DNA methylation in Arabidopsis has a genetic basis and shows evidence of local adaptation
- Vienna Biocenter, Austria
- University of Southern California, United States
- University of Utah, United States
- Wellcome Trust Genome Campus, United Kingdom
- Max Planck Society, Germany
- Memorial Sloan-Kettering Cancer Center, United States
Figures
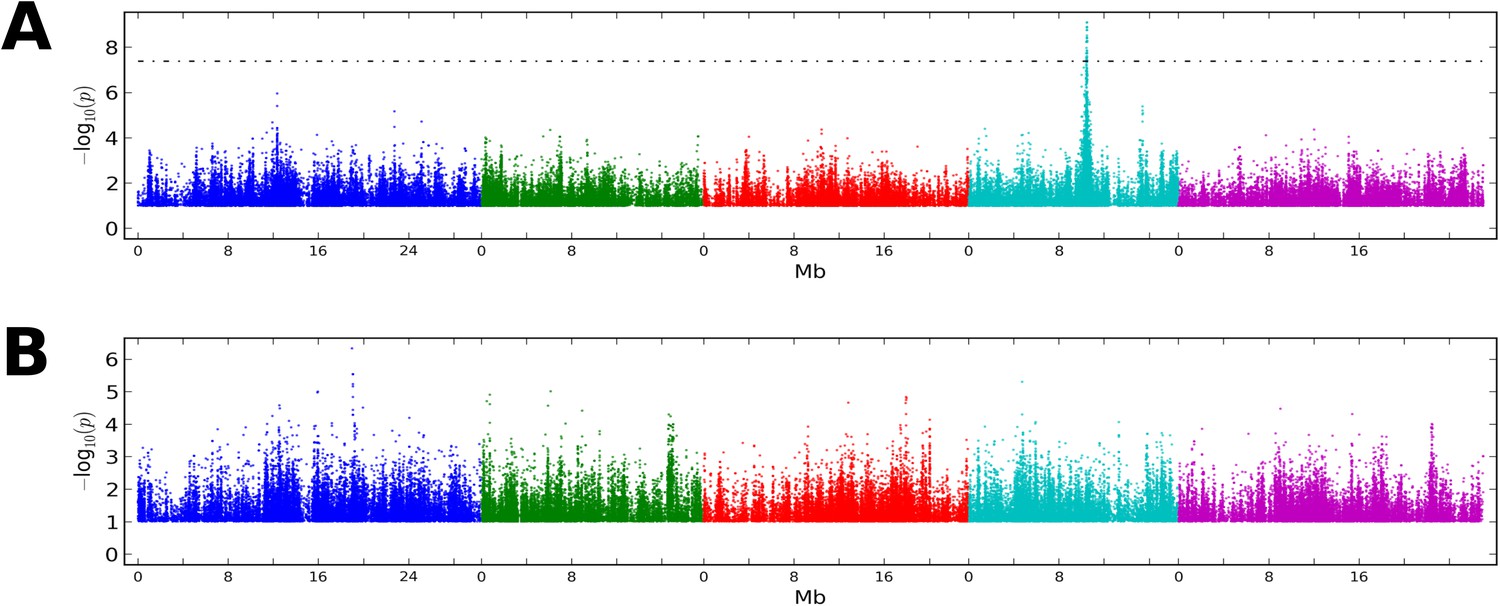
Figure 1 with 2 supplements
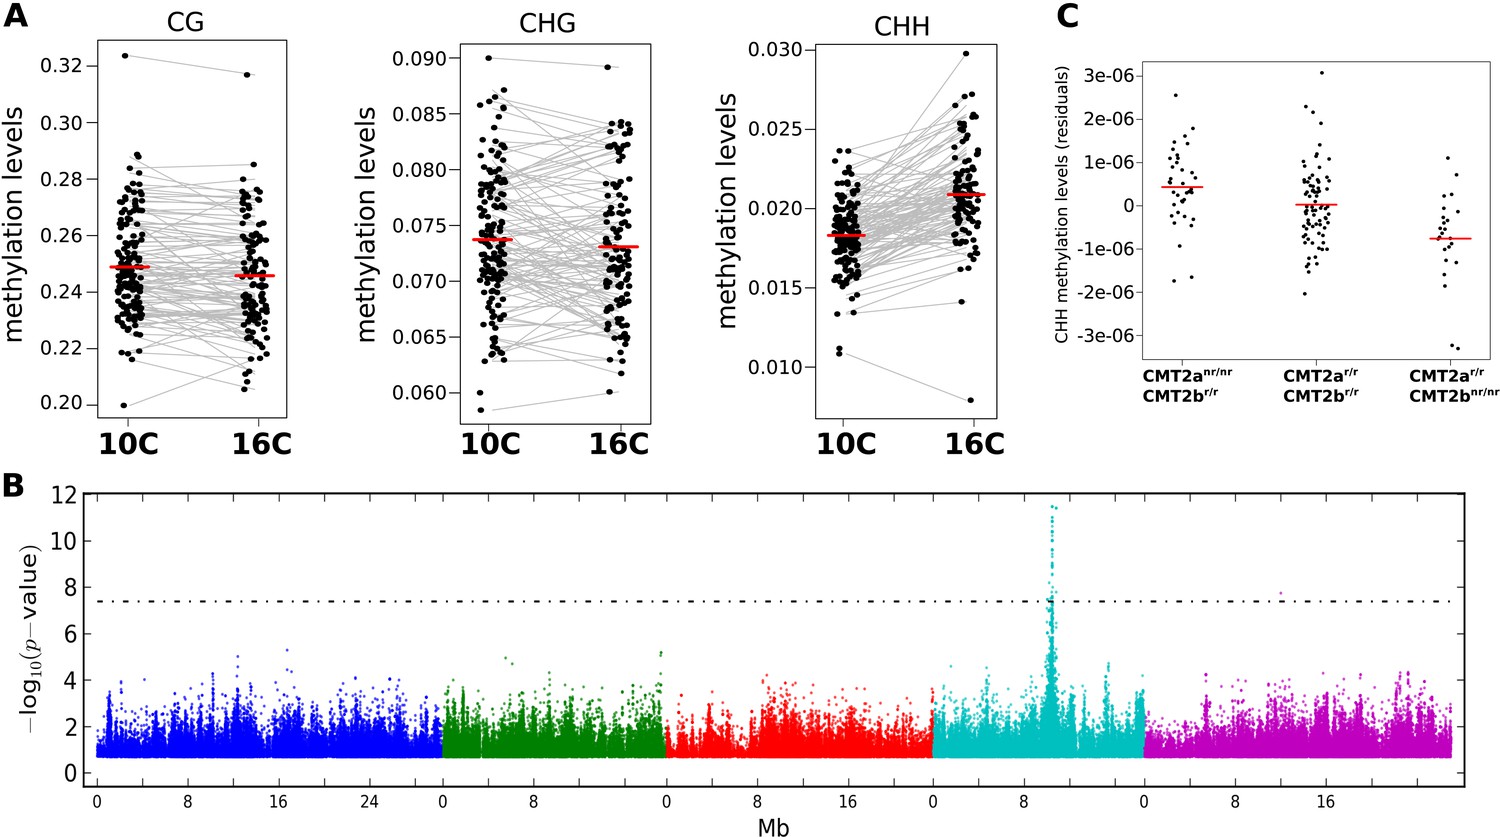
The effect of CMT2 on genome-wide CHH methylation levels.
(A) Genome-wide average methylation level reaction norms for each accession (156 samples at 10°C and 125 samples at 16°C). Only CHH levels differ significantly between temperatures (Wilcoxon rank sum test; p = 1.7e-16). (B) Manhattan plot of genome-wide association studies (GWAS) results using average levels of CHH methylation for 151 accessions at 10°C on large transposons as the phenotype (the peak is also seen at 16°C [not shown]). The threshold line indicates a Bonferroni-corrected p-value of 0.05. (C) CHH methylation on large (over 2 kb) transposons at 10°C by CMT2 two-locus genotype (population sizes are 36, 82, and 24 for CMT2anr/nr/CMT2br/r, CMT2ar/r/CMT2br/r, CMT2ar/r/CMT2bnr/nr, respectively). The values plotted are the Best Linear Unbiased Predictor (BLUP) estimates after correcting for population structure. Since accessions are homozygous, only four genotypes are possible, of which only three exist due to complete linkage disequilibrium between CMT2a and CMT2b. Figure 1—figure supplement 1 shows Manhattan plots of GWAS results for global methylation averages. Figure 1—figure supplement 2 shows Stepwise GWAS using average CHH methylation of TE's.
Figure 1—figure supplement 1
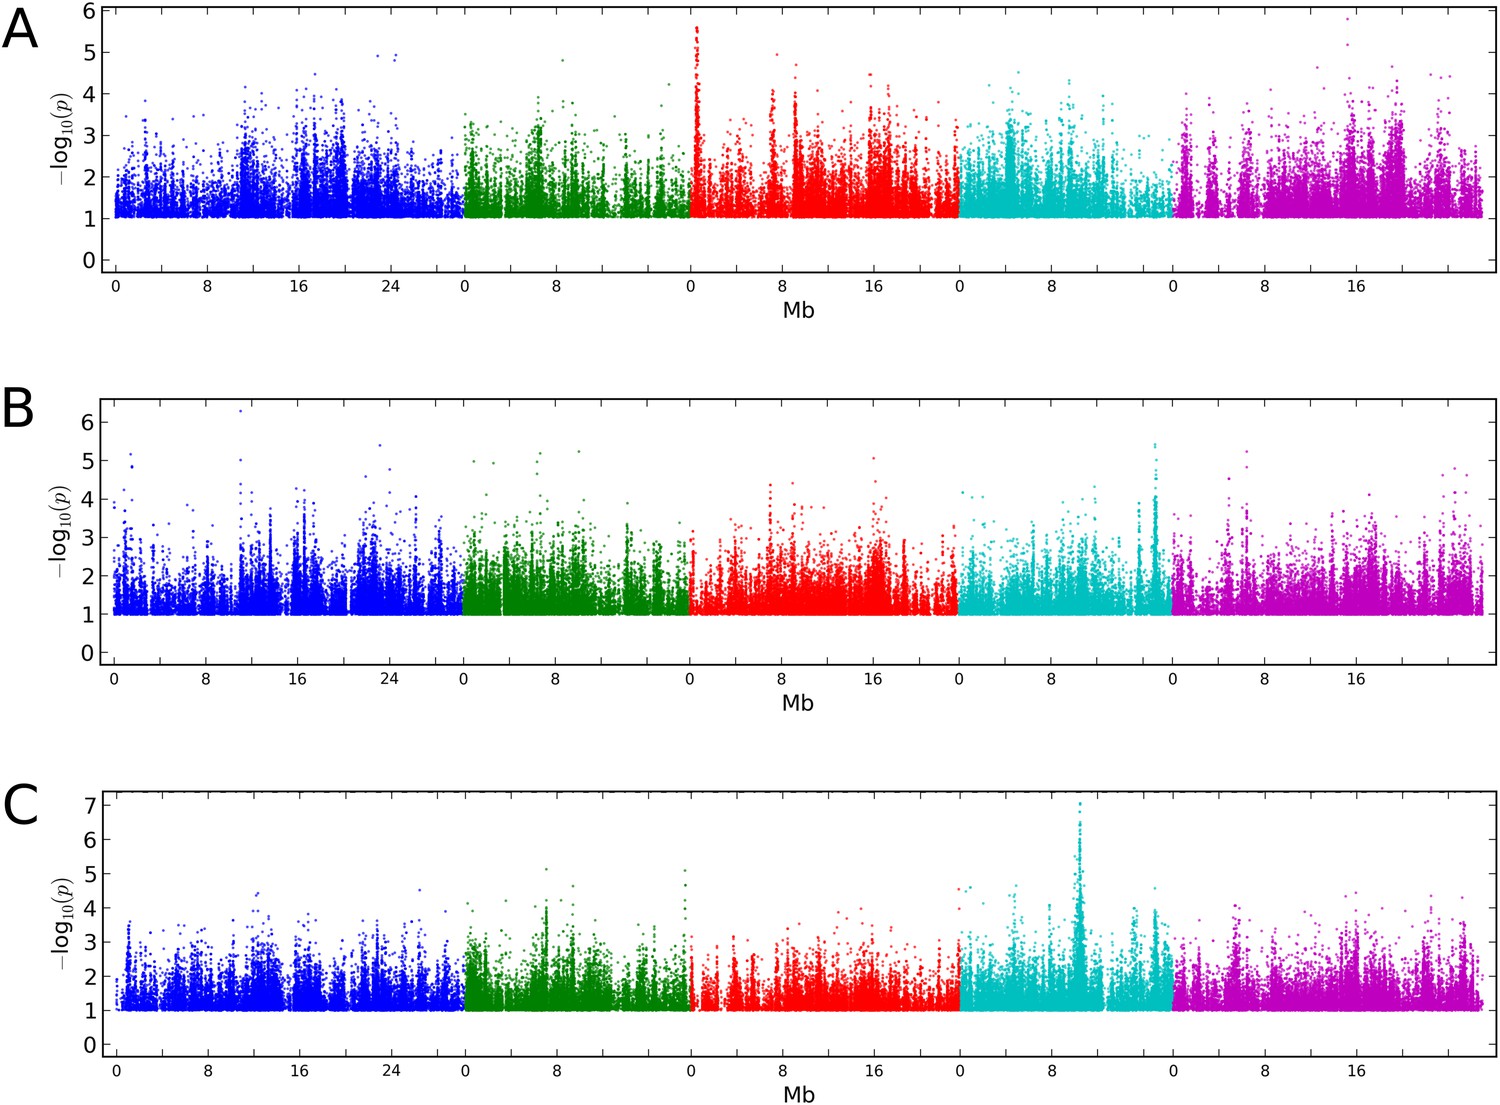
Manhattan plots of GWAS results for global methylation averages.
(A) CG methylation at 10°C. (B) CHG methylation at 10°C. (C) CHH methylation at 10°C. Results for methylation at 16°C were similar (data not shown).
Figure 1—figure supplement 2
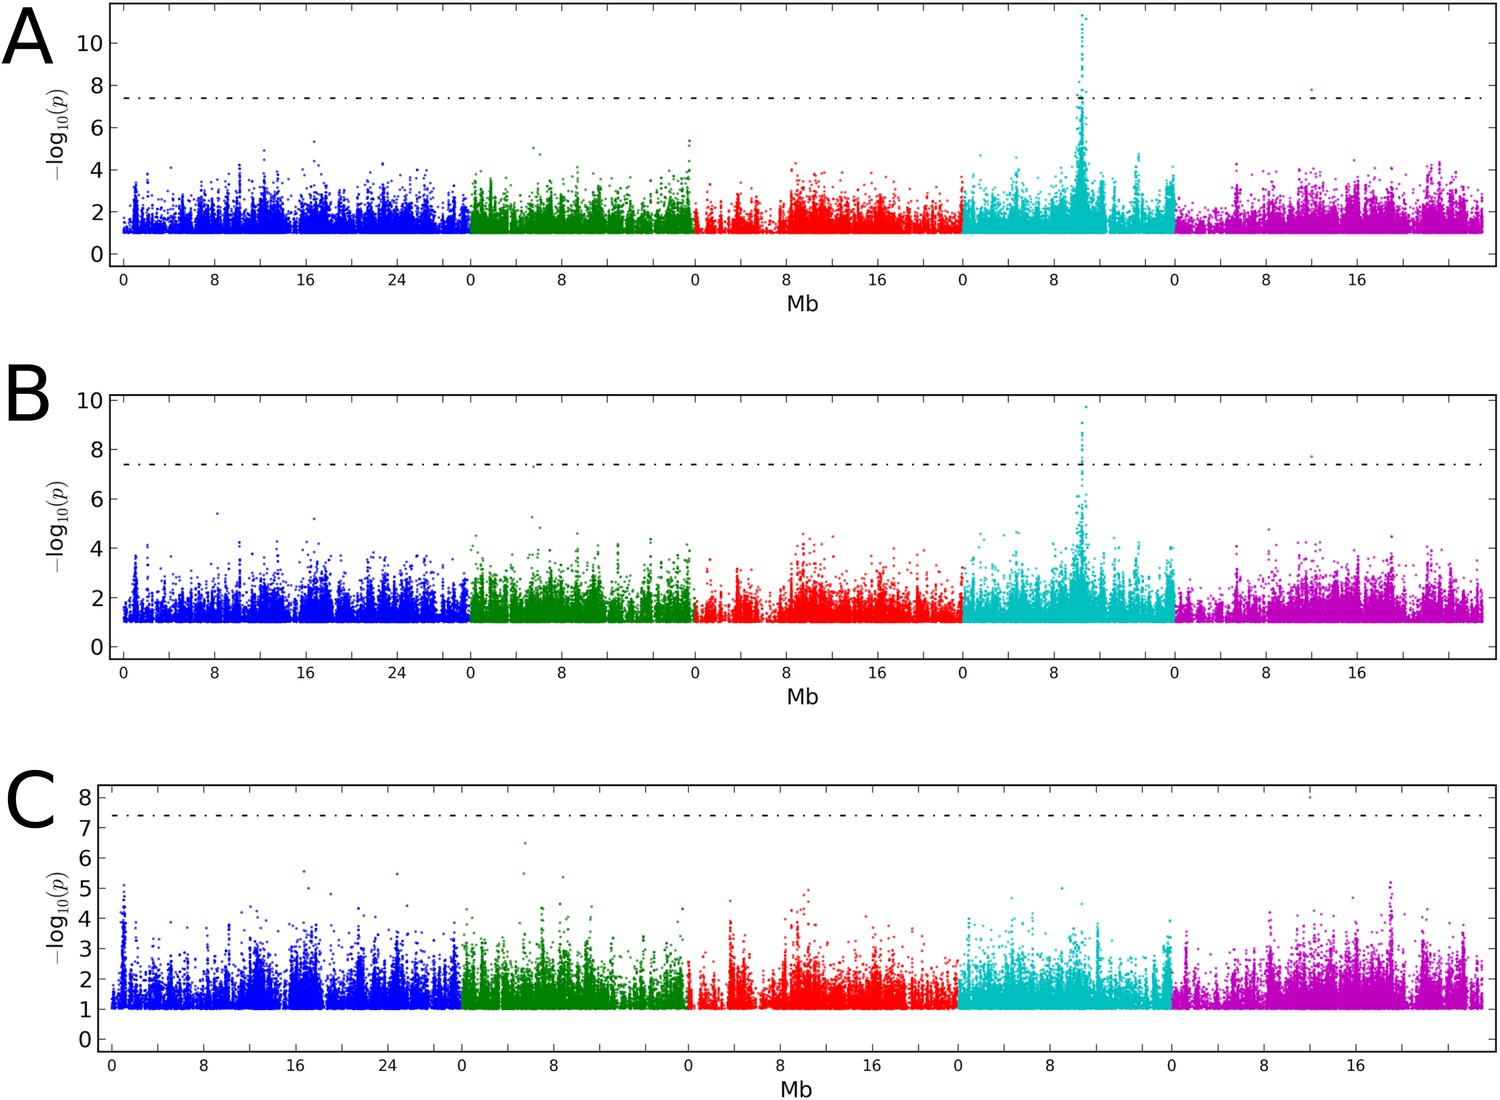
Stepwise GWAS using average CHH methylation of TE's as a phenotype.
(A) Without a cofactor. (B) Including SNP on chr 4 at position 10,459,127 (CMT2a) as a cofactor. (C) Including snps on chr 4 at 10,459,127 (CMT2a) and 10,454,628 (CMT2b) as cofactors. The threshold line indicates a Bonferroni-corrected p-value of 0.05.
Figure 2
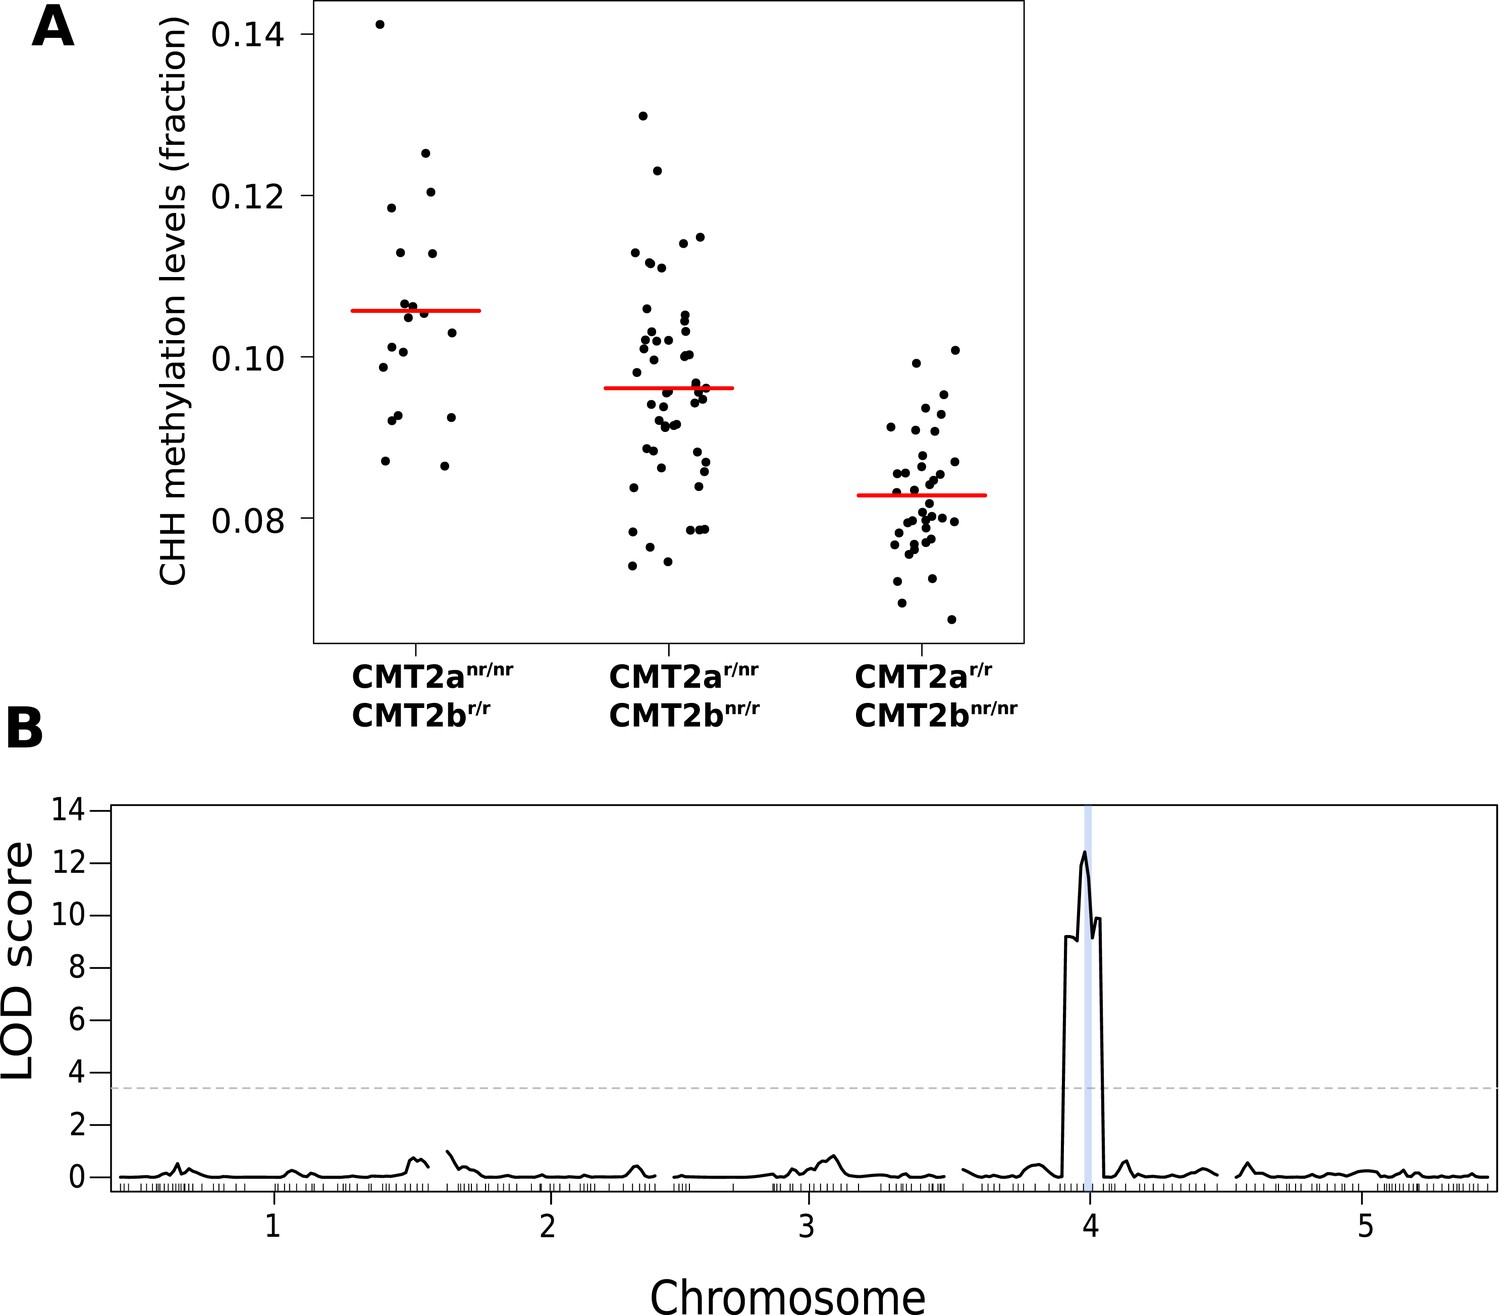
CHH methylation levels in an F2 population map to CMT2.
(A) CHH methylation on large transposons by CMT2 genotype in an F2 population of 113 individuals (population sizes are 19, 52, and 38 for CMT2anr/nr/CMT2br/r, CMT2ar/r/CMT2br/r, CMT2ar/r/CMT2bnr/nr, respectively; 4 individuals whose genotype at CMT2 could not be accurately inferred were omitted). (B) Mapping of CHH methylation of long TEs in the same population. The dotted line indicates a LOD threshold with a genome-wide p-value of 0.05 obtained using 1000 permutations, and the vertical blue line shows the marker interval that contains CMT2.
Figure 3
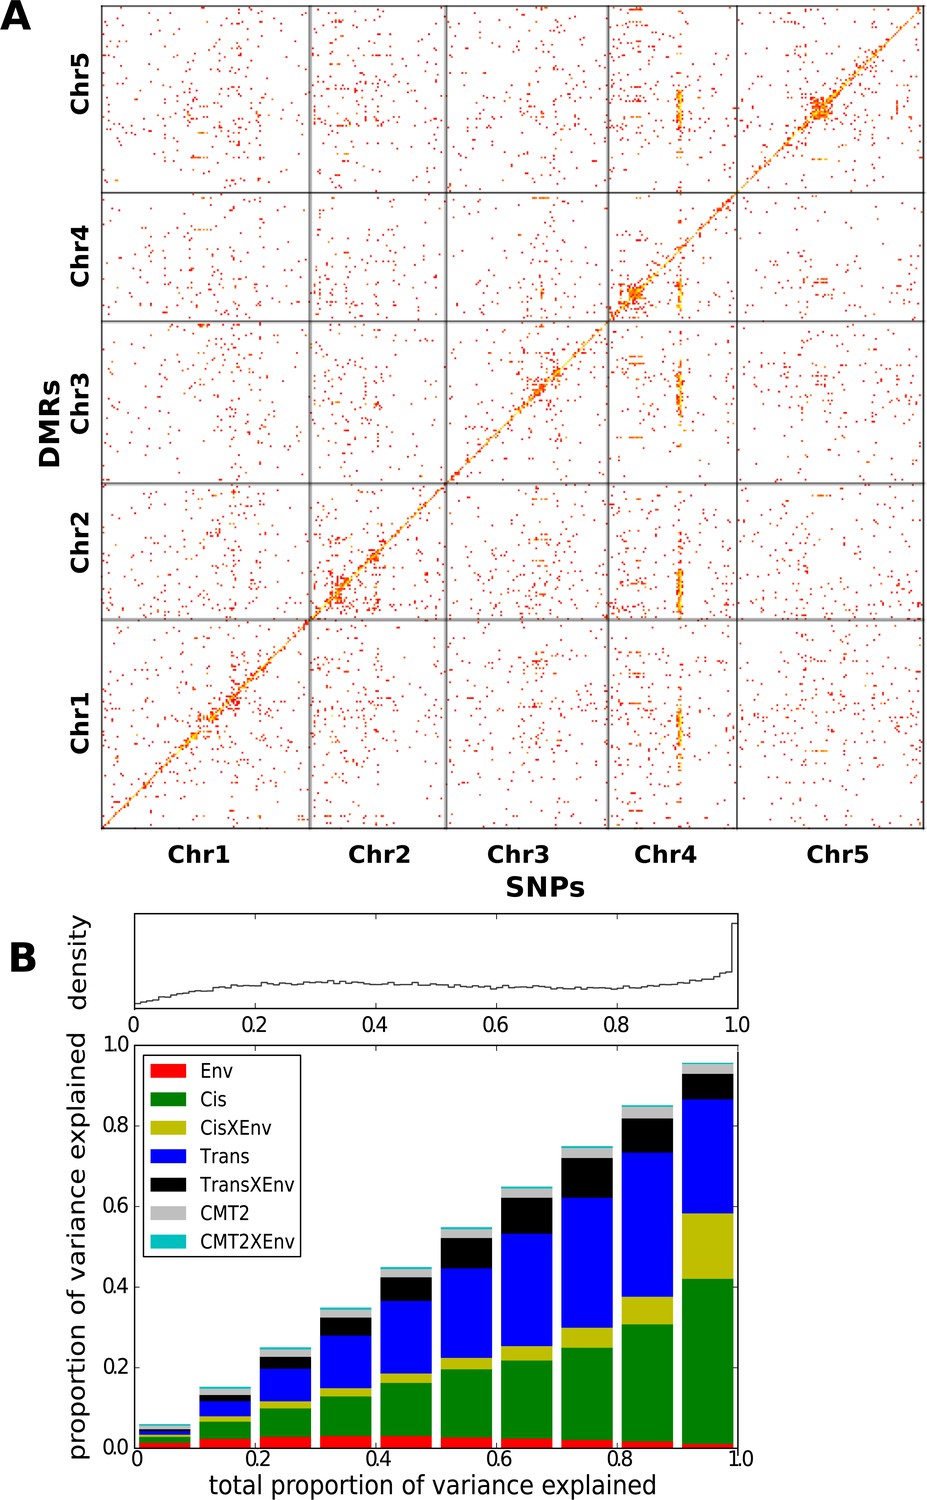
Genetic basis CHH methylation variation.
(A) GWAS for CHH differentially methylated regions (DMRs) at 10°C in 151 accessions, defined using 200 bp sliding windows across the genome and selecting the 200,000 most variable ones. For each DMR, SNPs significantly associated at the Bonferroni-corrected 0.05-level are plotted. (B) Variance-components analysis of the CHH DMRs. For each DMR, a mixed model with cis, CMT2, and genome-wide trans effects, plus environment and genetic interactions with environment was fitted (see ‘Materials and methods’). DMRs were binned by the total variance explained by the model. The density of DMRs in each bin is shown at the top, and the bottom shows the average variance-decomposition for each bin.
Figure 4

CHH methylation varies with temperature.
(A) Average methylation levels over variable transposons at 10°C (orange) vs 16°C (red), and over non-variable transposons at 10°C (purple) vs 16°C (dark blue). Methylation for variable TEs is significantly higher (permutation p-value for CHH methylation = 0.05). (B) The density of variable (red) and non-variable TEs along chromosomes in 500 kb windows. Density is defined as the percentage of the total number in either category in each window; pericentromeric regions are shaded grey. (C) The expression of TEs at both temperatures. Variable TEs are more highly expressed than non-variable TEs, but the difference is only statistically significant at 16°C (Wilcoxon: 10°C, p = 0.15; 16°C, p = 0.023).
Figure 5 with 2 supplements
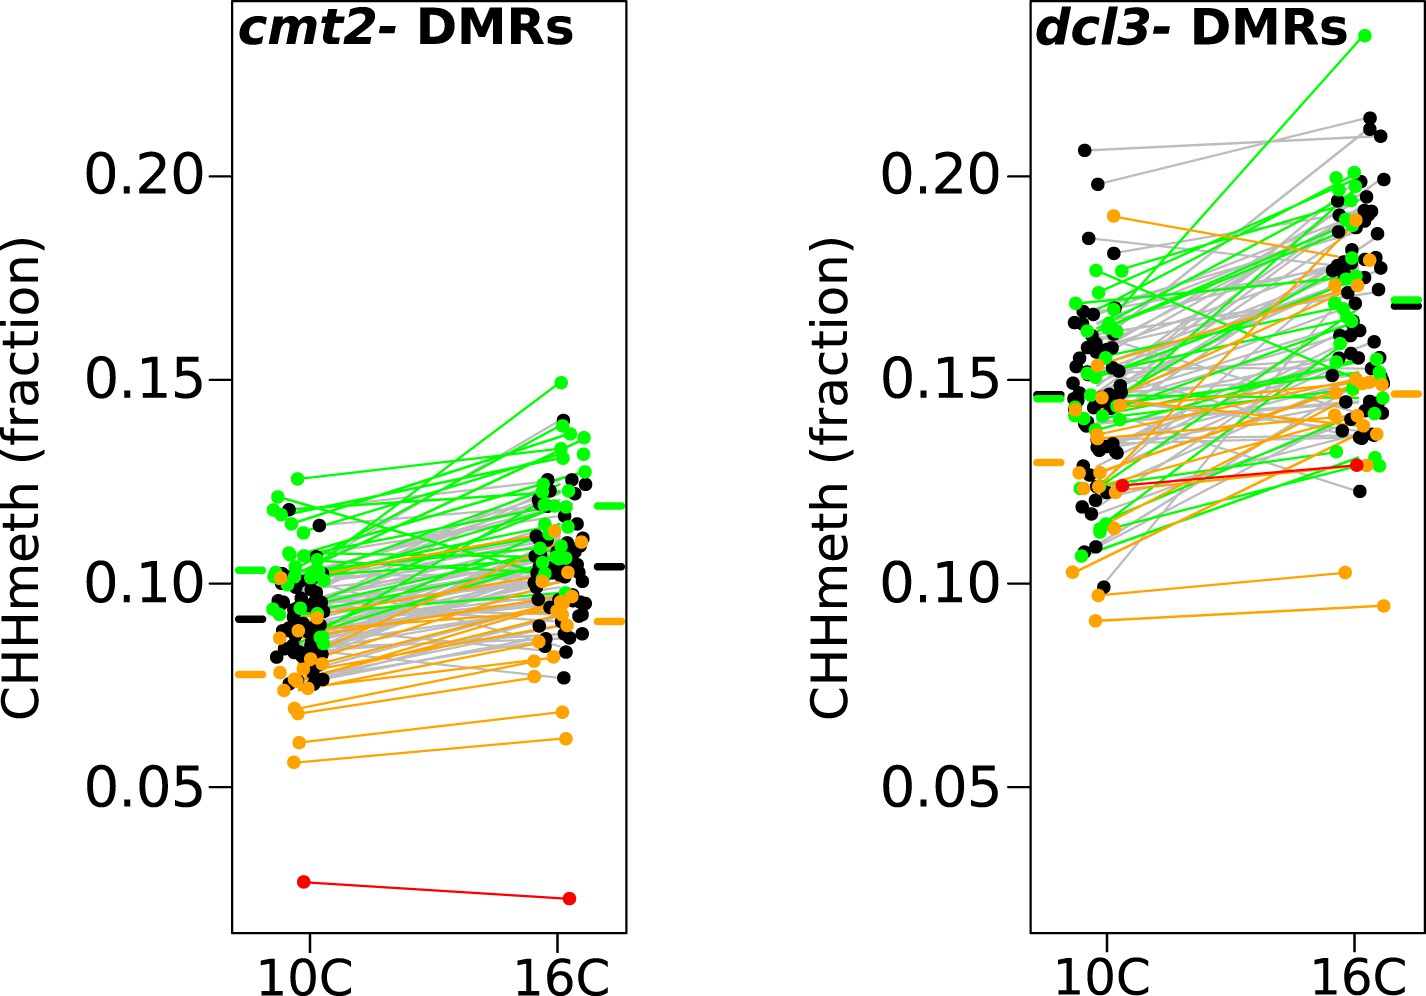
Temperature dependent CHH methylation variation at RdDM and CMT2 controlled DMRs.
CHH methylation at CMT2- and DCL3-dependent DMRs in natural accessions grown at 10°C and 16°C (cf. Figure 1A, each population has 110 individuals). The difference between temperatures was highly significant for both types of DMR (Wilcoxon p-value = 9.1e-11 and p-value = 5.9e-12 respectively). Black points/grey lines indicate accessions with the CMT2 reference allele; green, the CMT2a non-reference allele; and orange, the CMT2b non-reference allele. Red is the TAA-03 accession, which has a putative null allele of CMT2. Average methylation levels for each of the genotypes are shown in bars to the side Figure 5—figure supplement 1 shows GWAS on CMT2 and DCL3 dependant DMRs. Figure 5—figure supplement 2 shows a putative null allele of CMT2.
Figure 5—figure supplement 1
GWAS on CMT2 and DCL3 dependent DMRs.
(A) GWAS for CMT2-dependent DMRs at 10°C. (B) GWAS on DCL3-dependent DMRs at 10°C. Results from 16°C were similar in both cases. The threshold line indicates a Bonferoni-corrected p-value of 0.05.
Figure 5—figure supplement 2
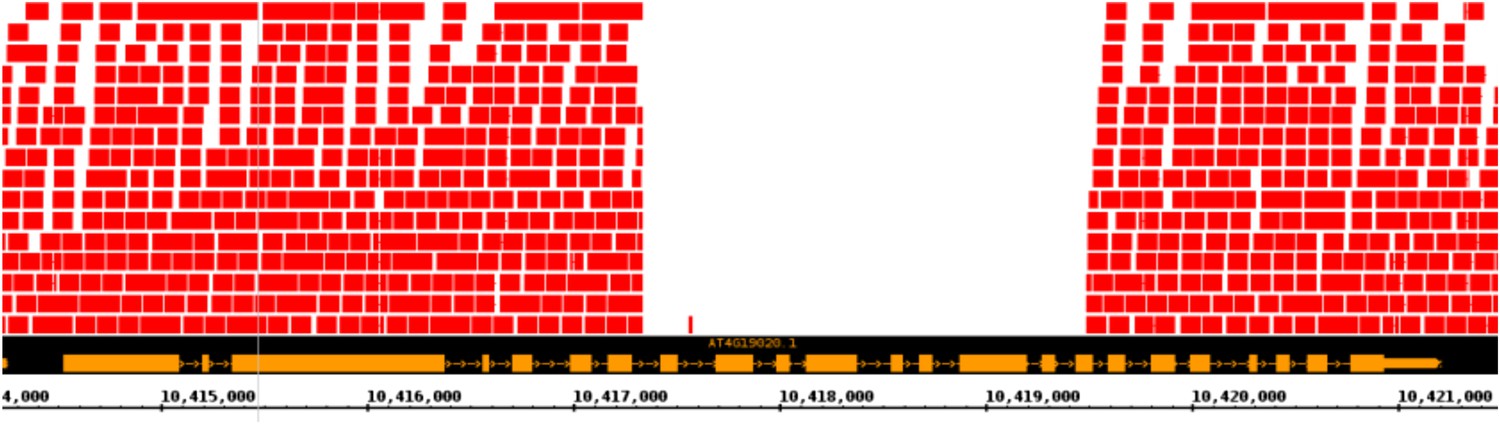
Putative null allele of CMT2.
A screenshot from a genome browser indicating the lack of read coverage for CMT2 stretching from intron 7 to exon 16 in the accession TAA-03.
Figure 6 with 6 supplements
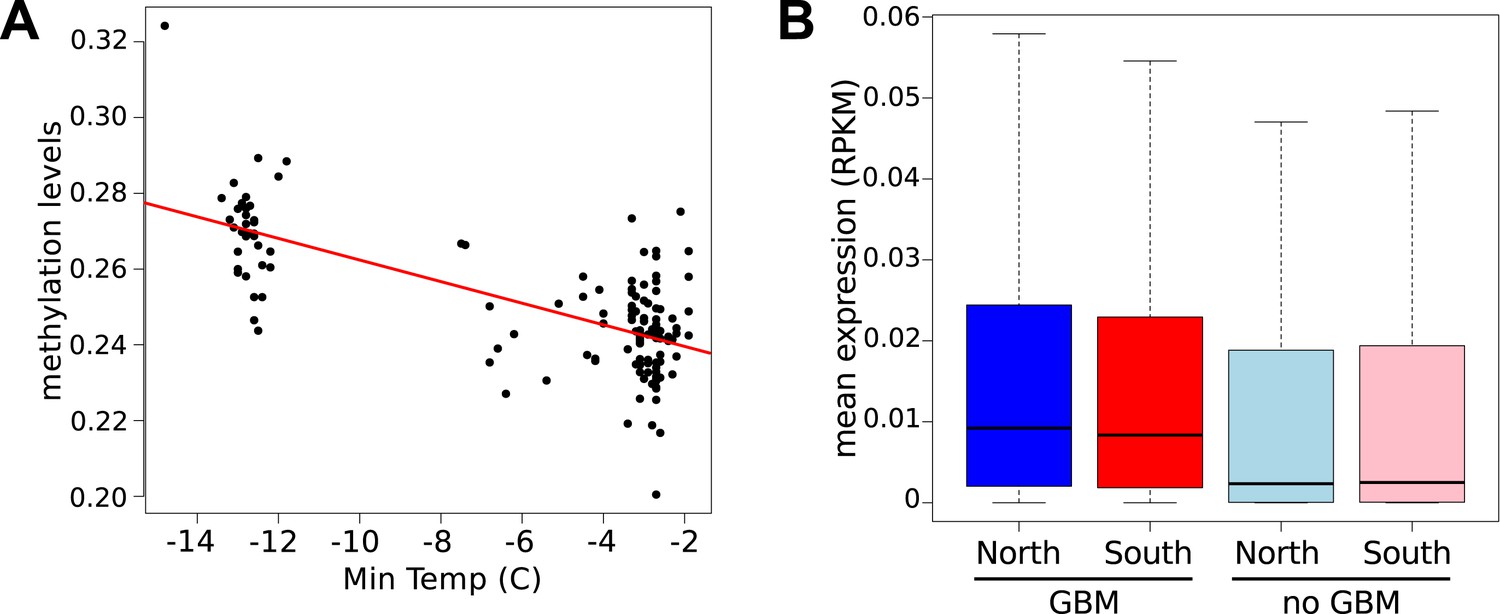
Latitudinal difference in gene body methylation (GBM) and gene expression.
(A) Global CG methylation levels at 10°C for 151 accessions are strongly correlated with minimum temperature at the location of origin. Results for 16°C are similar. (B) Genes with GBM are more highly expressed at 10°C in northern (blue) than in southern (red) accessions (wilcoxon rank sum test p = 2.1e-03), whereas genes without GBM show little difference (p = 1.9e-02). At 16°C the difference for genes with GBM is more significant (p = 6.4e-05), whereas the difference for genes without GBM is insignificant (p = 0.49).
Figure 6—figure supplement 1

Correlation between CG methylation levels and the minimum temperature at location of origin.
Above, GBM at 10°C and 16°C. Below, TE CG methylation at 10°C and 16°C.
Figure 6—figure supplement 2

Filtering of GBM variation data.
(A) Genes with low or no CHG methylation have variable levels of CG methylation, while genes with appreciable CHG methylation have very high CG (and CHH) methylation. (B) Among genes with only CG GBM, variance-component analysis reveals a bimodal distribution of the total variance explained: variation in methylation for genes with low levels of methylation typically does not appear to have a genetic basis.
Figure 6—figure supplement 3
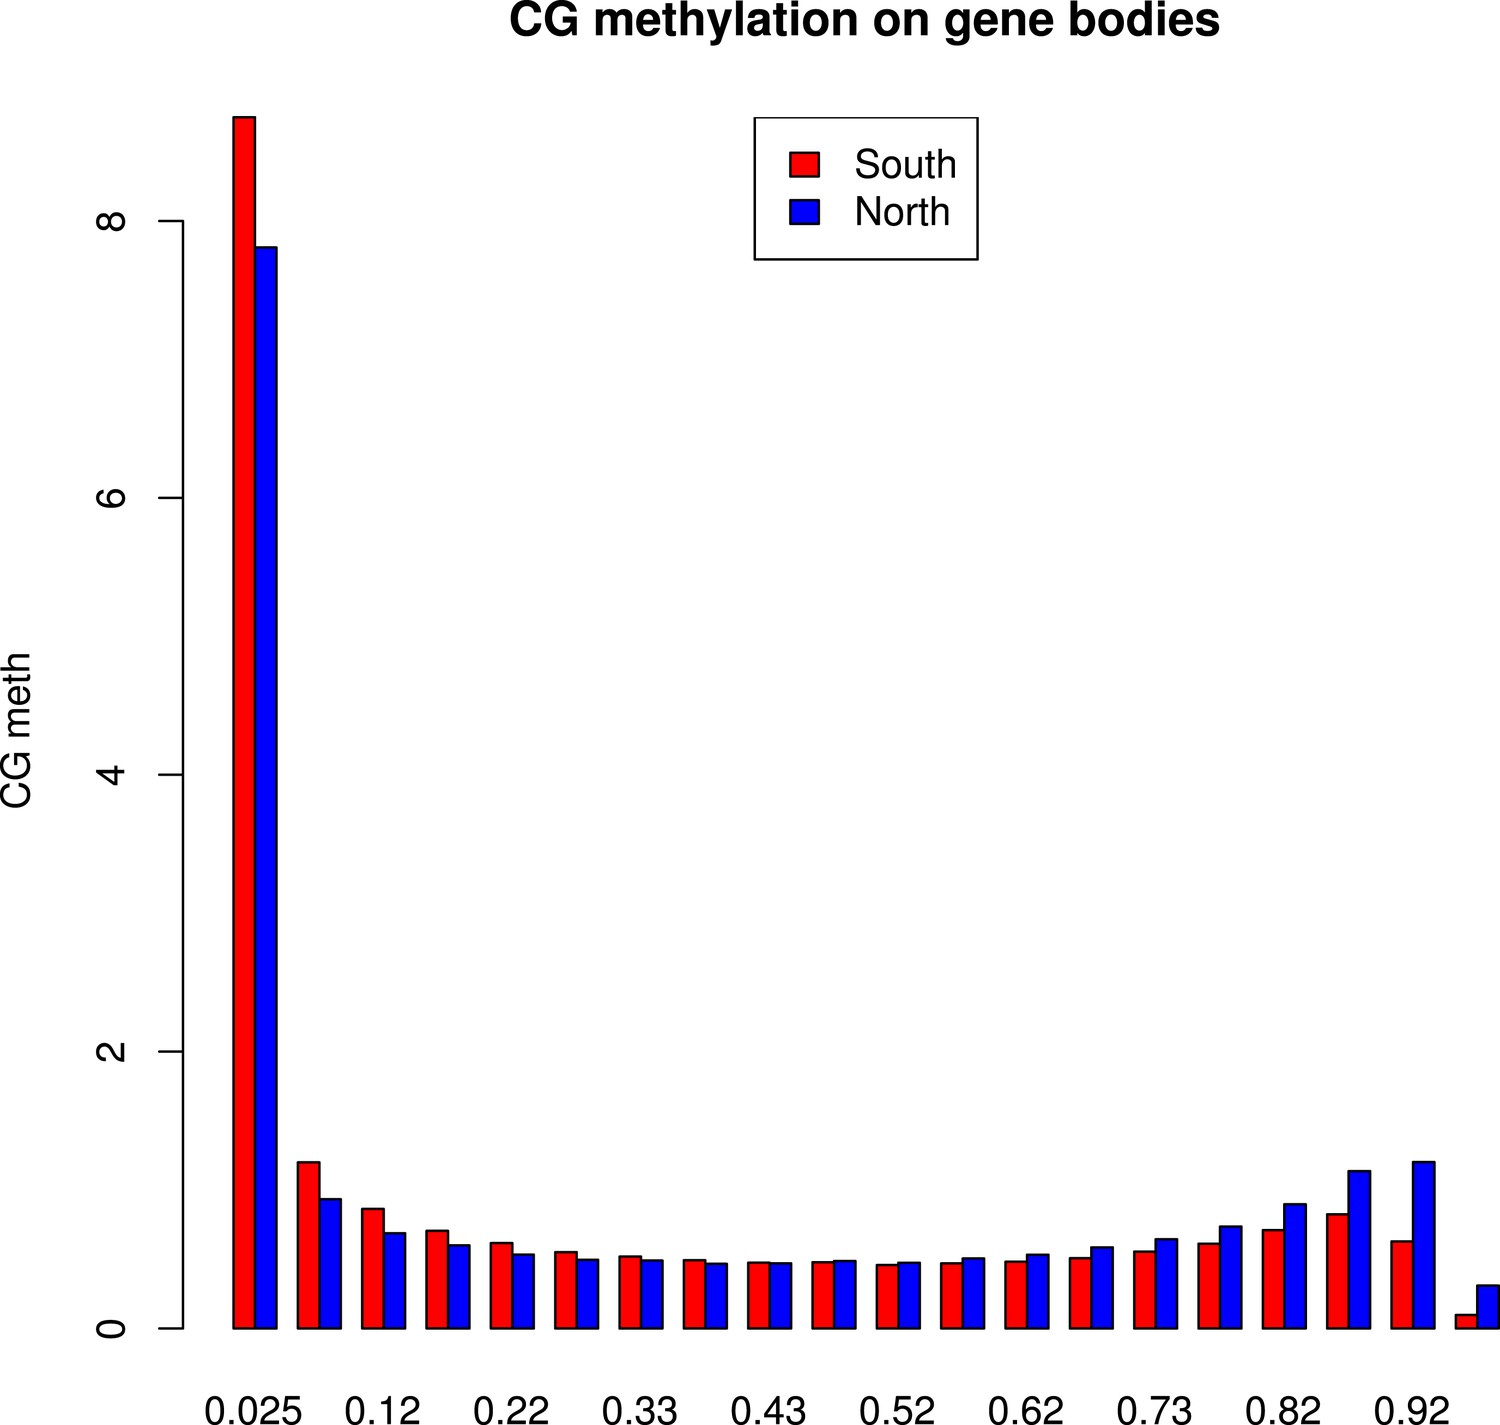
Distribution of methylation levels at individual CG dinucleotides within GBM genes.
The histogram shows the average methylation level for each individual CG dinucleotide on GBM genes in all accessions in the north (blue) or in the south (red).
Figure 6—figure supplement 4
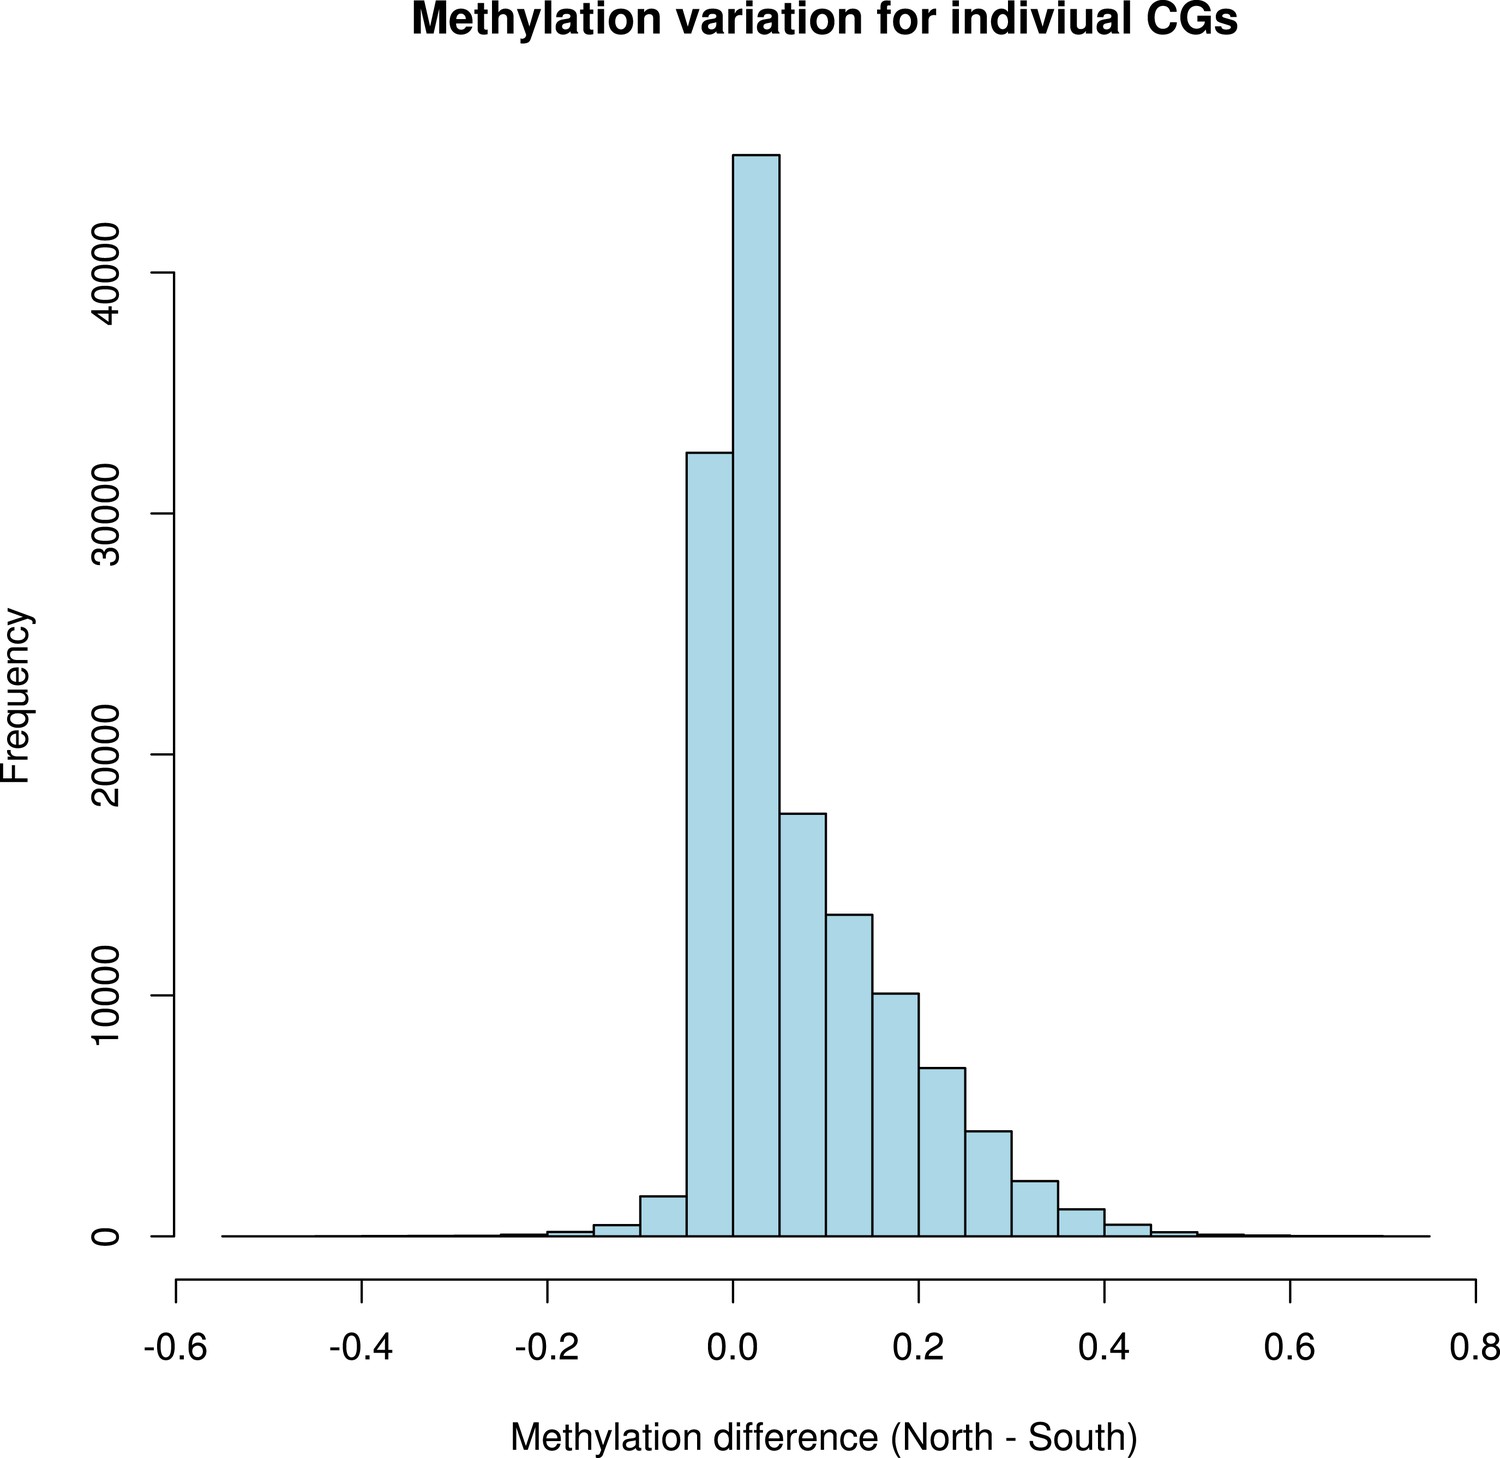
Distribution of variation in methylation levels between the north and the south for individual CG dinucleotides within GBM genes.
The histogram shows the average methylation level for each individual CG dinucleotide on GBM genes in all accessions in the north minus the average methylation level in the south for each dinucleotide.
Figure 6—figure supplement 5
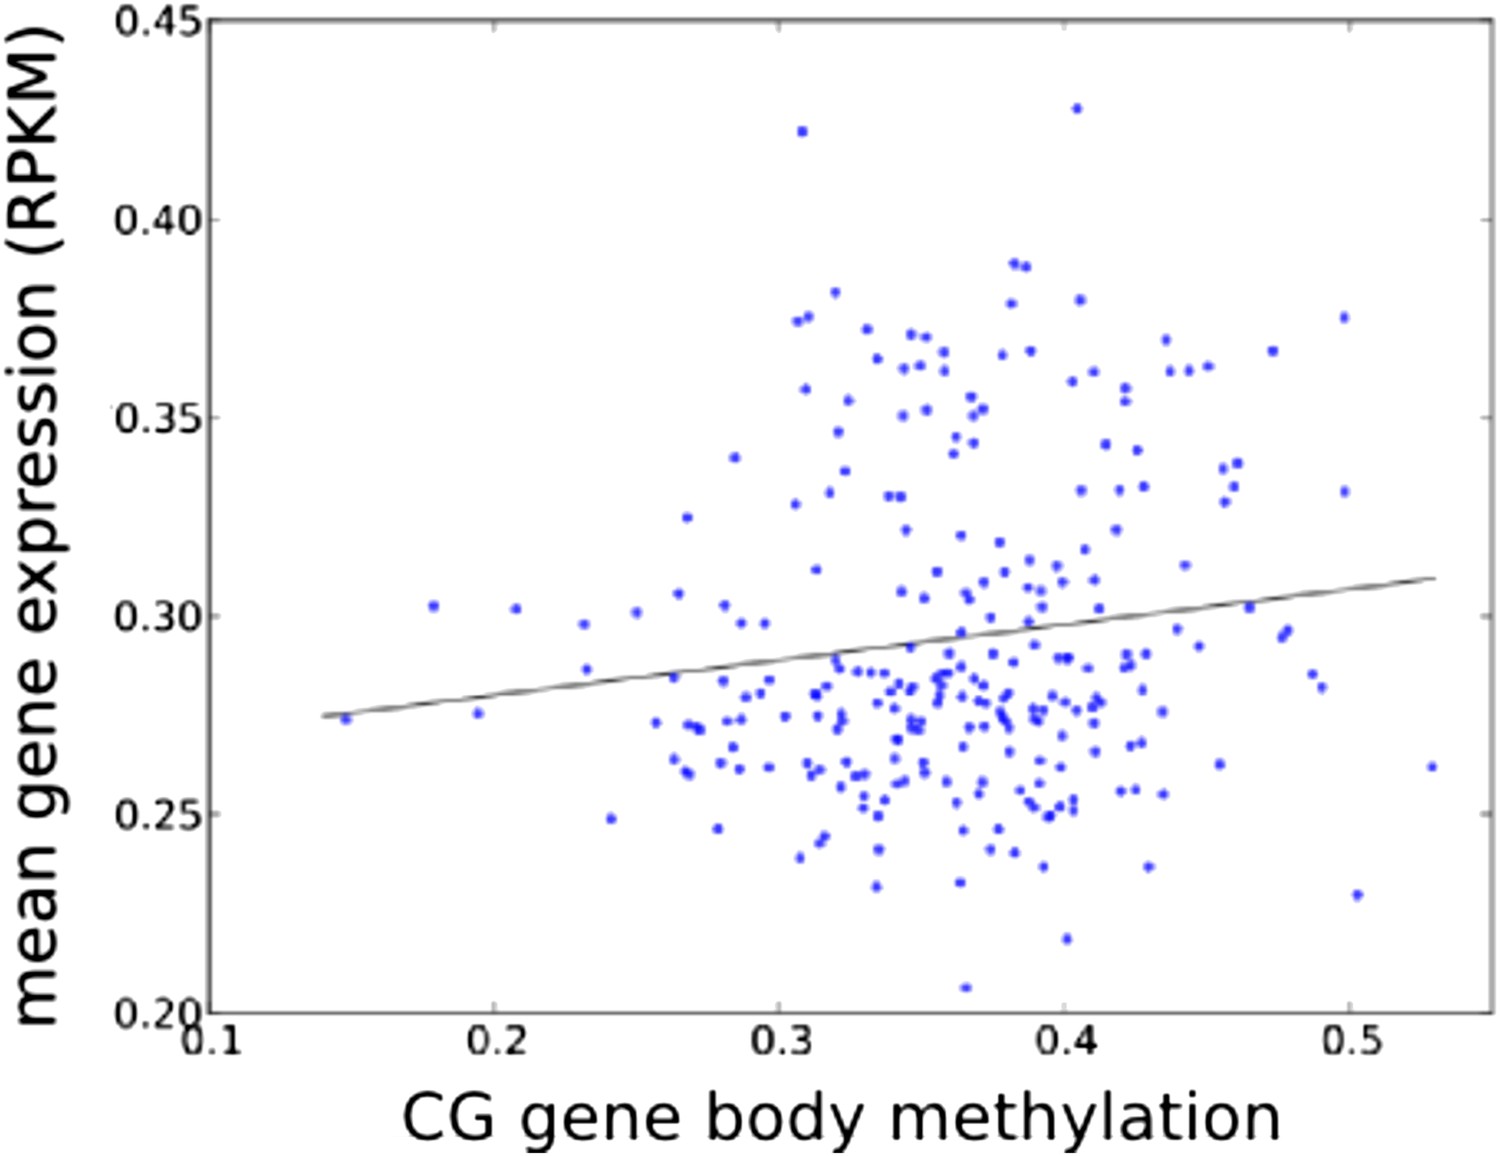
Accessions with higher average GBM tend to have higher average expression (of genes with GBM, normalized by genes without GBM; r = 0.131, p = 0.0386).
https://doi.org/10.7554/eLife.05255.019
Figure 6—figure supplement 6
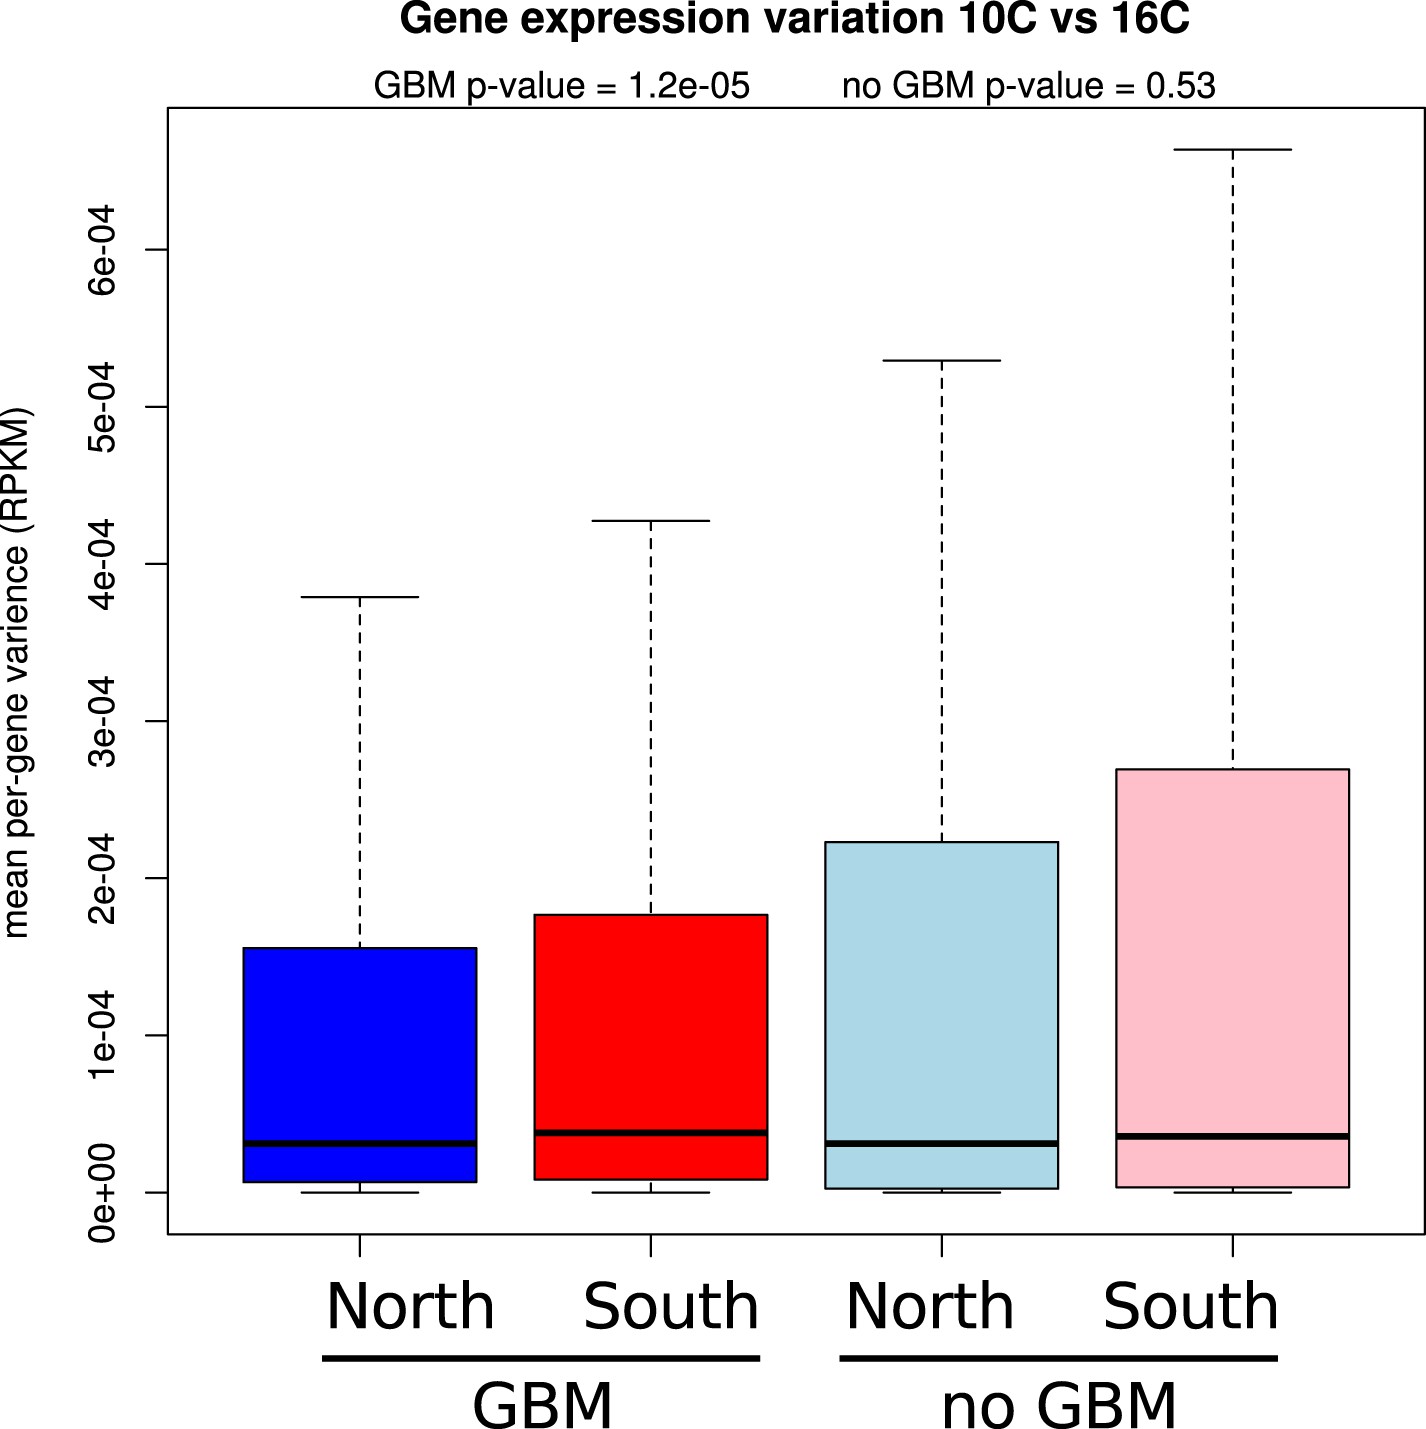
Genes with GBM show less expression variation between temperatures.
Mean per-gene variation in expression between 10°C and 16°C is reduced for GBM containing genes in northern (blue) accessions compared to southern (red) accessions (wilcoxon rank sum test p = 1.2e-05), whereas for genes without GBM the difference between north (light blue) and south (pink) is insignificant.
Figure 7

The genetic basis of GBM.
(A) Variance component analysis of GBM. (B) Significant associations (Bonferroni-corrected 0.05-level) from a GWAS of GBM for individual genes. (C) Correlation between non-reference allele at associated SNPs and GBM.
Figure 8 with 1 supplement
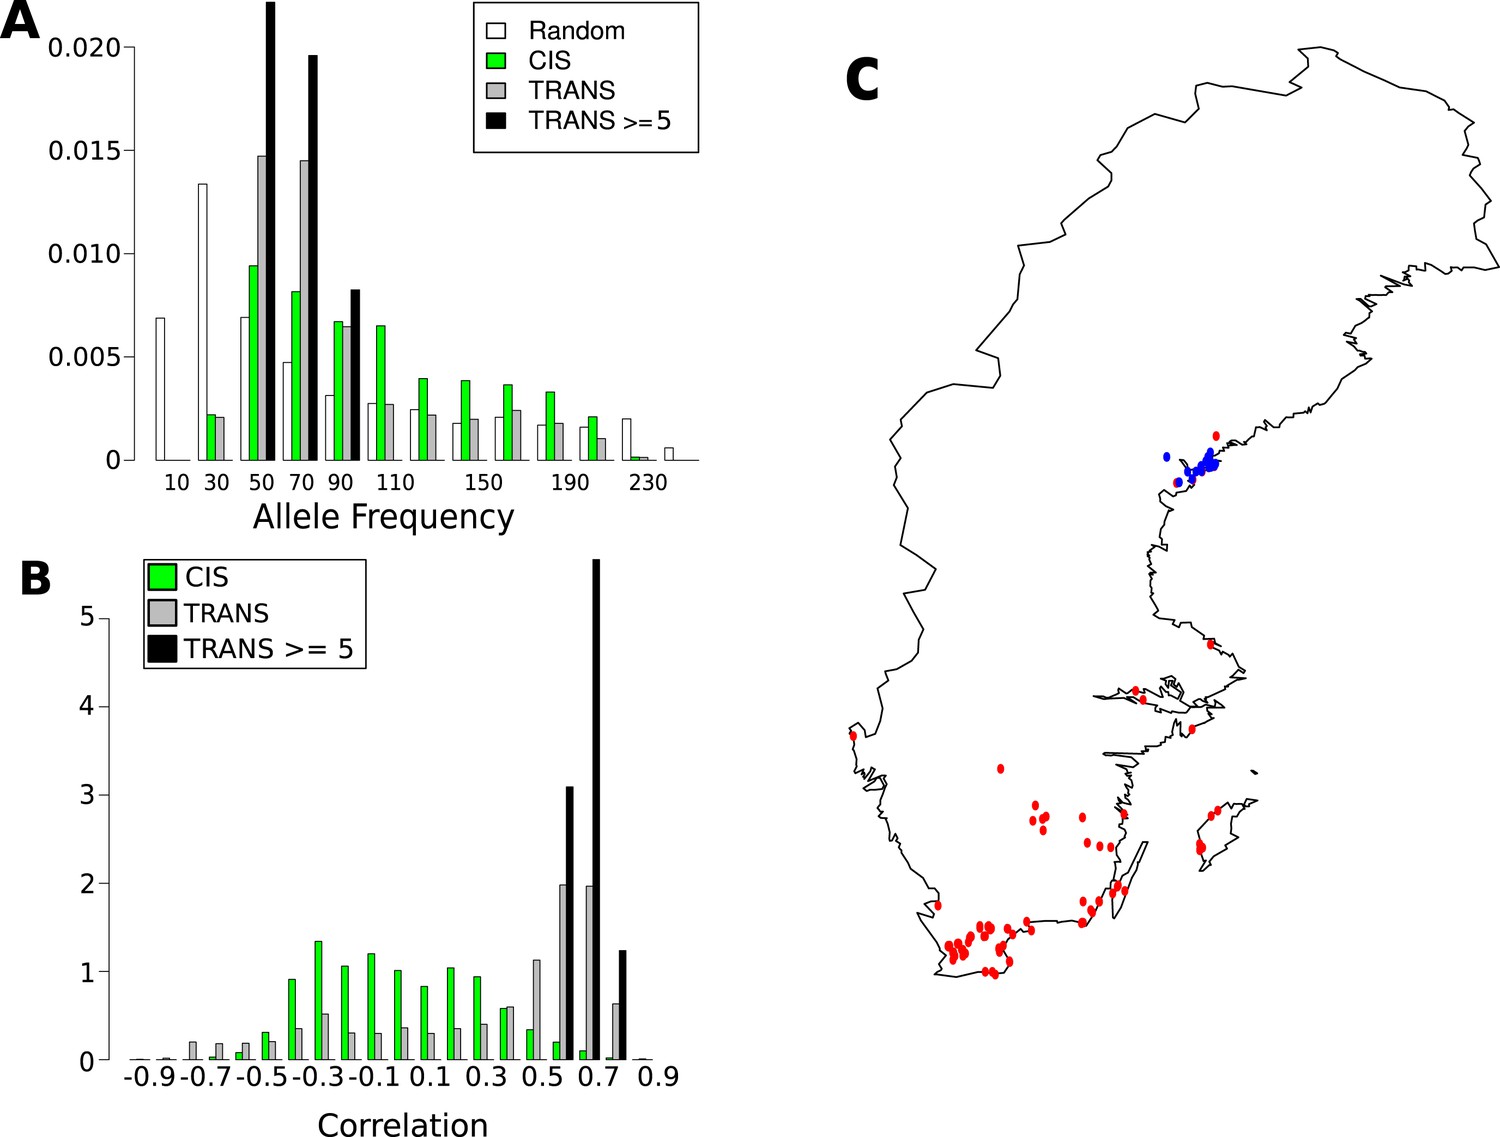
Frequency and distribution of GBM associated SNPs.
(A) Correlation between non-reference allele at associated SNPs and latitude. (B) Non-reference allele frequency distribution for cis and trans SNPs compared to random SNPs. (C) Accessions carrying the non-reference alleles are limited to northern Sweden (accessions with the non-reference allele at 8 or more of the 15 loci blue, remaining accessions are red).
Figure 8—figure supplement 1
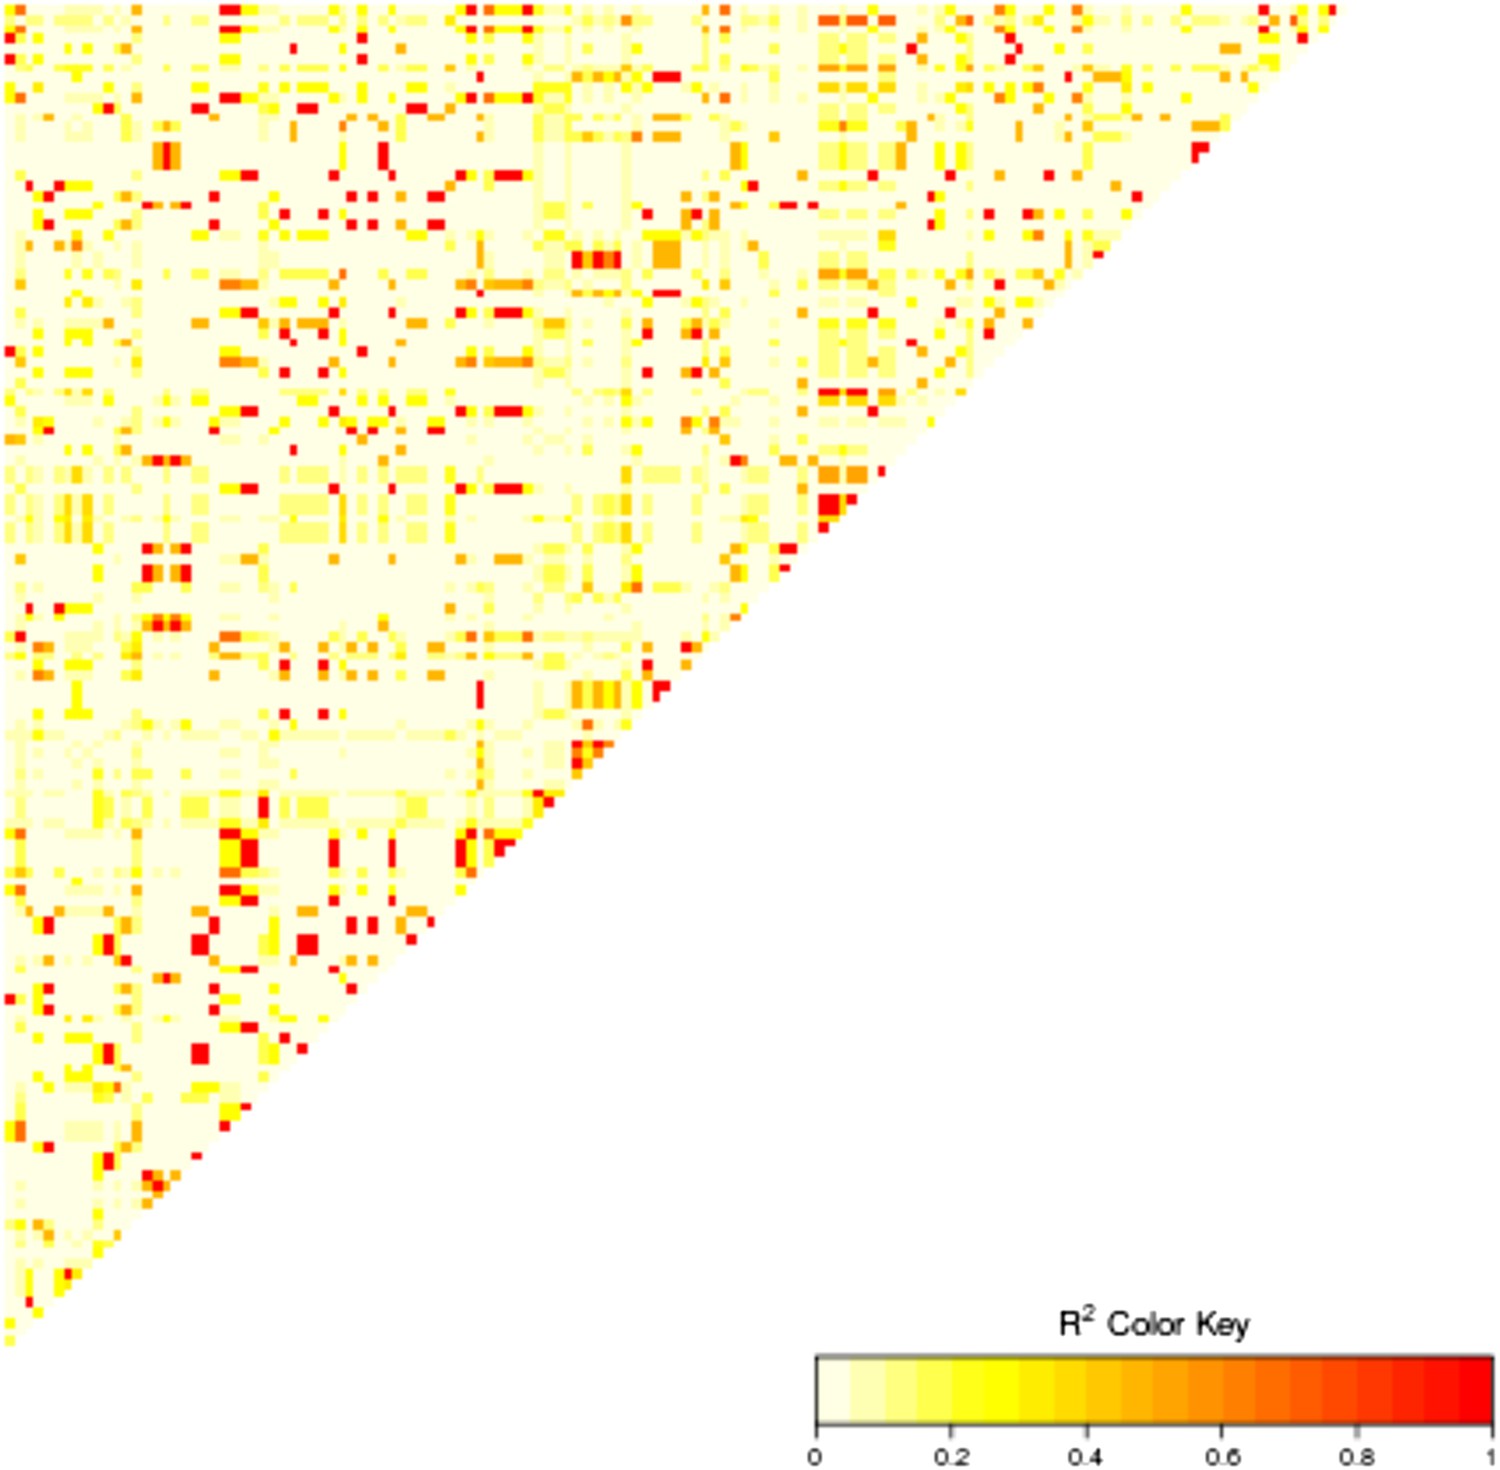
Linkage disequilibrium between the 15 highly associated trans-SNPs.
https://doi.org/10.7554/eLife.05255.023Tables
Table 1
Super-families (italics) and families that are over-represented among ‘variable’ TEs
| TE (super-)family | Expected | Observed | Enrichment | 95th Quantile |
|---|---|---|---|---|
| RathE1_cons | 5 | 26 | 4.56 | 10 |
| RathE3_cons | 2 | 9 | 3.23 | 6 |
| RathE2_cons | 1 | 5 | 2.52 | 4 |
| SINE | 3 | 7 | 2.00 | 7 |
| RC/Helitron | 346 | 444 | 1.28 | 368 |
| DNA/MuDR | 144 | 184 | 1.27 | 162 |
| ATREP2 | 4 | 53 | 12.07 | 8 |
| RP1_AT | 2 | 27 | 11.59 | 5 |
| ATTIRX1C | 1 | 12 | 11.49 | 3 |
| ATREP13 | 2 | 28 | 9.87 | 6 |
| VANDAL22 | 1 | 11 | 8.56 | 3 |
| SIMPLEHAT1 | 1 | 11 | 7.34 | 4 |
| VANDAL2N1 | 1 | 10 | 7.32 | 3 |
| ATREP8 | 2 | 13 | 6.47 | 5 |
| VANDAL2 | 1 | 7 | 6.08 | 3 |
| ATREP10 | 1 | 10 | 5.93 | 4 |
| AT9NMU1 | 1 | 7 | 5.81 | 3 |
| ATN9_1 | 1 | 10 | 5.75 | 4 |
| SIMPLEHAT2 | 1 | 11 | 5.63 | 4 |
| META1 | 3 | 20 | 5.41 | 7 |
| ATDNAI27T9A | 3 | 15 | 4.83 | 6 |
| ATREP2A | 3 | 15 | 4.83 | 6 |
| ATCOPIA78 | 0 | 3 | 4.67 | 2 |
| VANDAL18NA | 0 | 3 | 4.67 | 2 |
| RathE1_cons | 5 | 26 | 4.56 | 10 |
| VANDAL14 | 0 | 3 | 4.48 | 2 |
| SIMPLEGUY1 | 3 | 13 | 4.19 | 6 |
| ATDNATA1 | 0 | 3 | 4.00 | 2 |
| TNAT2A | 1 | 4 | 3.93 | 3 |
| ATREP7 | 4 | 16 | 3.64 | 8 |
| RathE3_cons | 2 | 9 | 3.23 | 6 |
| ATREP14 | 1 | 4 | 3.18 | 3 |
| ATREP16 | 1 | 4 | 3.18 | 3 |
| LIMPET1 | 3 | 9 | 2.90 | 6 |
| ATREP6 | 4 | 14 | 2.89 | 8 |
| ARNOLDY2 | 7 | 22 | 2.85 | 13 |
| ATSINE4 | 2 | 7 | 2.67 | 5 |
| ATDNAI27T9C | 2 | 7 | 2.42 | 6 |
| ATREP3 | 38 | 92 | 2.39 | 49 |
| ARNOLDY1 | 6 | 14 | 2.21 | 11 |
| ATREP1 | 13 | 23 | 1.73 | 19 |
| HELITRONY3 | 37 | 51 | 1.36 | 48 |
Table 2
Correlation between methylation levels and environment-of-origin variables (Hancock et al., 2011)
| Environmental variable | Growing temp. | CG | CHG | CHH | ||||||
|---|---|---|---|---|---|---|---|---|---|---|
| r | rho | p-value | r | rho | p-value | r | rho | p-value | ||
| Latitude | 10 | 0.69 | 0.52 | 7.8E-11 | −0.24 | −0.19 | 2.7E-02 | 0.10 | 0.14 | 1.1E-01 |
| 16 | 0.62 | 0.47 | 3.2E-07 | −0.21 | −0.20 | 4.2E-02 | 0.04 | −0.11 | 2.5E-01 | |
| Longitude | 10 | 0.59 | 0.54 | 1.2E-11 | −0.14 | −0.09 | 3.1E-01 | 0.23 | 0.28 | 7.5E-04 |
| 16 | 0.55 | 0.53 | 4.4E-09 | −0.12 | −0.03 | 7.4E-01 | 0.14 | 0.15 | 1.2E-01 | |
| Temperature seasonality | 10 | 0.68 | 0.49 | 1.6E-09 | −0.27 | −0.24 | 4.8E-03 | 0.09 | 0.09 | 2.8E-01 |
| 16 | 0.62 | 0.42 | 1.1E-05 | −0.23 | −0.26 | 6.6E-03 | 0.04 | −0.12 | 2.1E-01 | |
| Max. temp. (warmest month) | 10 | −0.14 | 0.06 | 4.6E-01 | −0.07 | −0.13 | 1.3E-01 | 0.14 | 0.20 | 2.0E-02 |
| 16 | −0.03 | 0.10 | 2.9E-01 | −0.10 | −0.20 | 3.8E-02 | 0.05 | 0.03 | 7.3E-01 | |
| Min. temp. (coldest month) | 10 | −0.70 | −0.56 | 9.1E-13 | 0.27 | 0.21 | 1.2E-02 | −0.07 | −0.06 | 4.7E-01 |
| 16 | −0.63 | −0.48 | 2.7E-07 | 0.24 | 0.24 | 1.4E-02 | 0.00 | 0.19 | 5.6E-02 | |
| Precipitation (wettest month) | 10 | 0.45 | 0.52 | 1.2E-10 | −0.25 | −0.27 | 1.2E-03 | −0.20 | −0.12 | 1.7E-01 |
| 16 | 0.29 | 0.43 | 4.0E-06 | −0.26 | −0.24 | 1.2E-02 | −0.22 | −0.19 | 5.8E-02 | |
| Precipitation (driest month) | 10 | 0.31 | 0.40 | 1.5E-06 | −0.33 | −0.29 | 6.5E-04 | −0.24 | −0.21 | 1.6E-02 |
| 16 | 0.21 | 0.32 | 7.4E-04 | −0.26 | −0.24 | 1.4E-02 | −0.15 | −0.18 | 6.0E-02 | |
| Precipitation seasonality | 10 | 0.42 | 0.44 | 7.1E-08 | −0.07 | −0.16 | 5.4E-02 | 0.05 | 0.01 | 9.0E-01 |
| 16 | 0.36 | 0.37 | 1.2E-04 | −0.13 | −0.16 | 1.1E-01 | 0.01 | −0.01 | 9.1E-01 | |
| PAR (spring) | 10 | 0.04 | 0.22 | 8.9E-03 | 0.20 | 0.18 | 3.7E-02 | 0.24 | 0.23 | 7.3E-03 |
| 16 | 0.03 | 0.18 | 6.6E-02 | 0.27 | 0.21 | 3.5E-02 | 0.38 | 0.35 | 2.8E-04 | |
| Length of growing season | 10 | −0.59 | −0.57 | 5.5E-13 | 0.24 | 0.23 | 7.3E-03 | −0.16 | −0.18 | 3.3E-02 |
| 16 | −0.58 | −0.54 | 4.0E-09 | 0.23 | 0.21 | 3.0E-02 | −0.04 | 0.01 | 8.9E-01 | |
| No. consecutive cold days | 10 | 0.60 | 0.53 | 4.0E-11 | −0.19 | −0.13 | 1.2E-01 | 0.17 | 0.28 | 1.1E-03 |
| 16 | 0.57 | 0.53 | 4.2E-09 | −0.17 | −0.09 | 3.7E-01 | 0.10 | 0.08 | 4.1E-01 | |
| No. consecutive frost-free days | 10 | −0.59 | −0.49 | 1.2E-09 | 0.29 | 0.27 | 1.5E-03 | 0.02 | 0.03 | 7.1E-01 |
| 16 | −0.51 | −0.39 | 4.9E-05 | 0.30 | 0.30 | 1.6E-03 | 0.07 | 0.13 | 1.9E-01 | |
| Relative humidity (spring) | 10 | 0.62 | 0.47 | 5.6E-09 | −0.23 | −0.18 | 3.9E-02 | 0.09 | 0.06 | 4.5E-01 |
| 16 | 0.53 | 0.37 | 1.2E-04 | −0.20 | −0.26 | 7.6E-03 | 0.04 | −0.08 | 4.3E-01 | |
| Daylength (spring) | 10 | 0.69 | 0.50 | 7.2E-10 | −0.27 | −0.21 | 1.4E-02 | 0.08 | 0.05 | 5.7E-01 |
| 16 | 0.63 | 0.41 | 1.5E-05 | −0.23 | −0.29 | 2.7E-03 | 0.04 | −0.17 | 8.7E-02 | |
| Aridity | 10 | 0.53 | 0.49 | 8.4E-10 | −0.35 | −0.31 | 1.9E-04 | −0.18 | −0.21 | 1.3E-02 |
| 16 | 0.43 | 0.42 | 8.4E-06 | −0.28 | −0.24 | 1.3E-02 | −0.13 | −0.20 | 3.8E-02 | |
-
r = Pearson's correlation, rho = Spearman's rank correlation, p-value = significance of rho.
-
PAR = photosynthetically active radiation.
Table 3
15 SNPs associated with gene body methylation (GBM) at 5 or more genes
| Chr | Position | Associated with GBM at how many genes? | Non-reference allele count | SNP-latitude correlation | Overlap with sweep (Long et al., 2013) | Overlap with min. temp. Assoc. SNPs (Hancock et al., 2011) |
|---|---|---|---|---|---|---|
| 1 | 912291 | 8 | 42 | 0.73 | none | 1_914088_0.21 |
| 1 | 4405103 | 5 | 66 | 0.64 | none | none |
| 1 | 7614101 | 5 | 48 | 0.66 | none | none |
| 1 | 19755967 | 5 | 88 | 0.75 | none | 1_19757140_0.24 |
| 2 | 6998631 | 6 | 55 | 0.87 | 2_6931030 | none |
| 2 | 7655016 | 6 | 81 | 0.61 | 2_7613651 | none |
| 2 | 7660469 | 9 | 55 | 0.78 | 2_7613651 | 2_7662427_0.30 |
| 2 | 7666059 | 5 | 69 | 0.72 | 2_7613651 | 2_7665507_0.25 |
| 2 | 7680882 | 5 | 82 | 0.63 | 2_7613651 | none |
| 2 | 7915712 | 6 | 51 | 0.83 | none | 2_7913782_0.23 |
| 2 | 9382495 | 5 | 73 | 0.71 | none | 2_9383856_0.34 |
| 2 | 9653878 | 9 | 48 | 0.80 | none | none |
| 3 | 419309 | 8 | 66 | 0.68 | none | none |
| 4 | 519982 | 8 | 66 | 0.70 | none | none |
| 4 | 13290034 | 5 | 74 | 0.74 | none | none |
Table 4
Genes in the plant chromatin database that are within 100 kb of one of the 15 SNPs associated with GBM at 5 or more genes
| ChromDB | Locus |
|---|---|
| ARID3 | AT2G17410 |
| ARP3 | AT1G13180 |
| CHB4 | AT1G21700 |
| CHR9 | AT1G03750 |
| CHR35 | AT2G16390 |
| CONS3 | AT3G02380 |
| DNG12 | AT1G21710 |
| FLCP39 | AT3G02310 |
| FLCP16 | AT2G22630 |
| FLCP9 | AT2G22540 |
| GTI1 | AT2G22720 |
| HMGB4 | AT2G17560 |
| JMJ27 | AT4G00990 |
| NFA1 | AT4G26110 |
| SDG23 | AT2G22740 |
| SDG37 | AT2G17900 |
| YDG2 | AT2G18000 |
| HON3 | AT2G18050 |
Table 5
Genes within 100 kb of the 15 SNPs associated with GBM at 5 or more genes whose expression is also correlated with the SNP
| SNP | Locus | Desciption | p-value |
|---|---|---|---|
| 1_19755967 | AT1G53030 | Encodes a copper chaperone | 4.72E-07 |
| 1_19755967 | AT1G52880 | NO APICAL MERISTEM (NAM) Transcription factor with a NAC domain | 5.47E-07 |
| 1_19755967 | AT1G52990 | Thioredoxin family protein | 2.36E-05 |
| 1_19755967 | AT1G52780 | Protein of unknown function (DUF2921) | 1.46E-04 |
| 1_4405103 | AT1G12750 | RHOMBOID-like protein 6 (RBL6); FUNCTIONS IN: serine-type endopeptidase activity | 3.74E-08 |
| 1_4405103 | AT1G12790 | RuvA domain 2-like | 2.76E-05 |
| 1_4405103 | AT1G12730 | GPI transamidase subunit | 2.81E-05 |
| 1_4405103 | AT1G13080 | CYTOCHROME P450 FAMILY 71 SUBFAMILY B POLYPEPTIDE 2 (CYP71B2) | 1.65E-04 |
| 1_7614101 | AT1G21790 | TRAM LAG1 and CLN8 (TLC) lipid-sensing domain containing protein | 1.10E-05 |
| 1_7614101 | AT1G21900 | Encodes an ER-localized p24 protein | 8.81E-05 |
| 1_7614101 | AT1G21760 | F-BOX PROTEIN 7 (FBP7) putative translation regulator in temperature stress response | 8.54E-04 |
| 1_912291 | AT1G03660 | Ankyrin-repeat containing protein | 1.26E-10 |
| 1_912291 | AT1G03770 | RING1B protein with similarity to polycomb repressive core complex1 (PRC1) | 5.76E-07 |
| 1_912291 | AT1G03940 | HXXXD-type acyl-transferase family protein | 1.18E-06 |
| 1_912291 | AT1G03610 | Protein of unknown function (DUF789) | 6.91E-06 |
| 1_912291 | AT1G03580 | Pseudogene with weak similarity to ubiquitin-specific protease 12 | 1.29E-05 |
| 1_912291 | AT1G03830 | Guanylate-binding family protein | 3.50E-05 |
| 2_6998631 | AT2G16340 | Unknown protein | 1.35E-08 |
| 2_6998631 | AT2G16210 | Transcriptional factor B3 family protein | 1.69E-04 |
| 2_7666059 | AT2G17630 | Pyridoxal phosphate (PLP)-dependent transferases superfamily protein | 2.47E-18 |
| 2_7660469 | AT2G17620 | Cyclin B2;1 (CYCB2;1) | 9.68E-07 |
| 2_7655016 | AT2G17740 | Cysteine/Histidine-rich C1 domain family protein | 1.22E-04 |
| 2_7655016 | AT2G17420 | NADPH-DEPENDENT THIOREDOXIN REDUCTASE 2 (NTR2) | 9.96E-04 |
| 2_7666059 | AT2G17430 | MILDEW RESISTANCE LOCUS O 7 (MLO7) | 7.56E-04 |
| 2_7915712 | AT2G18100 | Protein of unknown function (DUF726) | 1.73E-06 |
| 2_7915712 | AT2G17980 | ATSLY member of SLY1 Gene Family | 1.33E-05 |
| 2_7915712 | AT2G18400 | Ribosomal protein L6 family protein | 1.26E-04 |
| 2_7915712 | AT2G18150 | Haem peroxidase | 8.05E-04 |
| 2_7915712 | AT2G18050 | HISTONE H1-3 (HIS1-3) | 9.47E-04 |
| 2_9382495 | AT2G22260 | HOMOLOG OF E. COLI ALKB (ALKBH2) enzyme involved in DNA methylation damage repair | 1.21E-08 |
| 2_9382495 | AT2G21850 | Cysteine/Histidine-rich C1 domain family protein | 5.38E-06 |
| 2_9382495 | AT2G22240 | MYO-INOSITOL-1-PHOSPHATE SYNTHASE 1 (MIPS1) | 8.71E-05 |
| 2_9382495 | AT2G21940 | SHIKIMATE KINASE 1 (ATSK1) localized to the chloroplast | 1.80E-04 |
| 2_9653878 | AT2G22660 | Protein of unknown function (duplicated DUF1399) | 2.22E-14 |
| 2_9653878 | AT2G22900 | Galactosyl transferase GMA12/MNN10 family protein | 5.08E-09 |
| 2_9653878 | AT2G22830 | Squalene epoxidase 2 (SQE2) | 3.91E-06 |
| 2_9653878 | AT2G22640 | BRICK1 (BRK1) | 6.17E-05 |
| 2_9653878 | AT2G22540 | SHORT VEGETATIVE PHASE (SVP) Floral repressor involved in thermosensory pathway | 2.46E-04 |
| 2_9653878 | AT2G22570 | NICOTINAMIDASE 1 (NIC1) | 2.67E-04 |
| 2_9653878 | AT2G22770 | NAI1 Transcription factor | 7.71E-04 |
| 3_419309 | AT3G02220 | Protein of unknown function (DUF2039) | 2.06E-16 |
| 3_419309 | AT3G02230 | REVERSIBLY GLYCOSYLATED POLYPEPTIDE 1 (RGP1) | 4.58E-14 |
| 3_419309 | AT3G02300 | Regulator of chromosome condensation (RCC1) family protein | 1.25E-10 |
| 3_419309 | AT3G02120 | Hydroxyproline-rich glycoprotein family protein | 1.81E-09 |
| 3_419309 | AT3G01980 | Short-chain dehydrogenase/reductase (SDR) | 3.91E-09 |
| 3_419309 | AT3G02370 | Unknown protein | 4.53E-08 |
| 3_419309 | AT3G02020 | ASPARTATE KINASE 3 (AK3) | 4.18E-07 |
| 3_419309 | AT3G02160 | Bromodomain transcription factor | 2.60E-06 |
| 3_419309 | AT3G02390 | Unknown chloroplast protein | 5.60E-06 |
| 3_419309 | AT3G02050 | K+ UPTAKE TRANSPORTER 3 (KUP3) | 1.28E-05 |
| 3_419309 | AT3G02125 | Unknown chloroplast protein | 2.12E-05 |
| 3_419309 | AT3G02200 | Proteasome component (PCI) domain protein | 1.16E-04 |
| 3_419309 | AT3G02180 | SPIRAL1-LIKE3 Regulates cortical microtubule organization | 4.56E-04 |
| 3_419309 | AT3G02250 | O-fucosyltransferase family protein | 5.31E-04 |
| 3_419309 | AT3G02110 | Serine carboxypeptidase-like 25 (scpl25) | 6.18E-04 |
| 4_13290034 | AT4G26255 | Non-coding RNA of unknown function | 1.67E-13 |
| 4_13290034 | AT4G26450 | WPP DOMAIN INTERACTING PROTEIN 1 (WIP1) | 1.13E-04 |
| 4_13290034 | AT4G26230 | Ribosomal protein L31e family protein | 1.74E-04 |
| 4_13290034 | AT4G26160 | ATYPICAL CYS HIS RICH THIOREDOXIN 1 (ACHT1) | 5.72E-04 |
| 4_519982 | AT4G01090 | Protein of unknown function (DUF3133) | 1.23E-06 |
| 4_519982 | AT4G01230 | Reticulon family protein | 2.33E-05 |
| 4_519982 | AT4G01410 | Late embryogenesis abundant (LEA) hydroxyproline-rich glycoprotein family | 5.44E-05 |
| 4_519982 | AT4G01330 | Serine/threonine-protein kinase | 2.22E-04 |
| 4_519982 | AT4G01200 | Calcium-dependent lipid-binding (CaLB domain) family protein | 3.93E-04 |
| 4_519982 | AT4G01390 | TRAF-like family protein | 3.99E-04 |
| 4_519982 | AT4G01040 | Glycosyl hydrolase superfamily protein | 5.66E-04 |
| 4_519982 | AT4G01000 | Ubiquitin-like superfamily protein | 8.55E-04 |
Additional files
-
Supplementary file 1
Multiple sequence alignment of CMT2 sequences from different accessions.
- https://doi.org/10.7554/eLife.05255.027
-
Supplementary file 2
Multiple sequence alignment of CMT2 sequences from different accessions in FASTA format.
- https://doi.org/10.7554/eLife.05255.028
-
Supplementary file 3
Source for scripts used to extract SNPs from RNA-seq data and comparing to existing 250k SNP data.
- https://doi.org/10.7554/eLife.05255.029
Download links
A two-part list of links to download the article, or parts of the article, in various formats.
Downloads (link to download the article as PDF)
Open citations (links to open the citations from this article in various online reference manager services)
Cite this article (links to download the citations from this article in formats compatible with various reference manager tools)
DNA methylation in Arabidopsis has a genetic basis and shows evidence of local adaptation
eLife 4:e05255.
https://doi.org/10.7554/eLife.05255


