Structural dynamics of myosin 5 during processive motion revealed by interferometric scattering microscopy
- University of Oxford, United Kingdom
- National Heart, Lung and Blood Institute, National Institutes of Health, United States
Figures
Figure 1 with 3 supplements
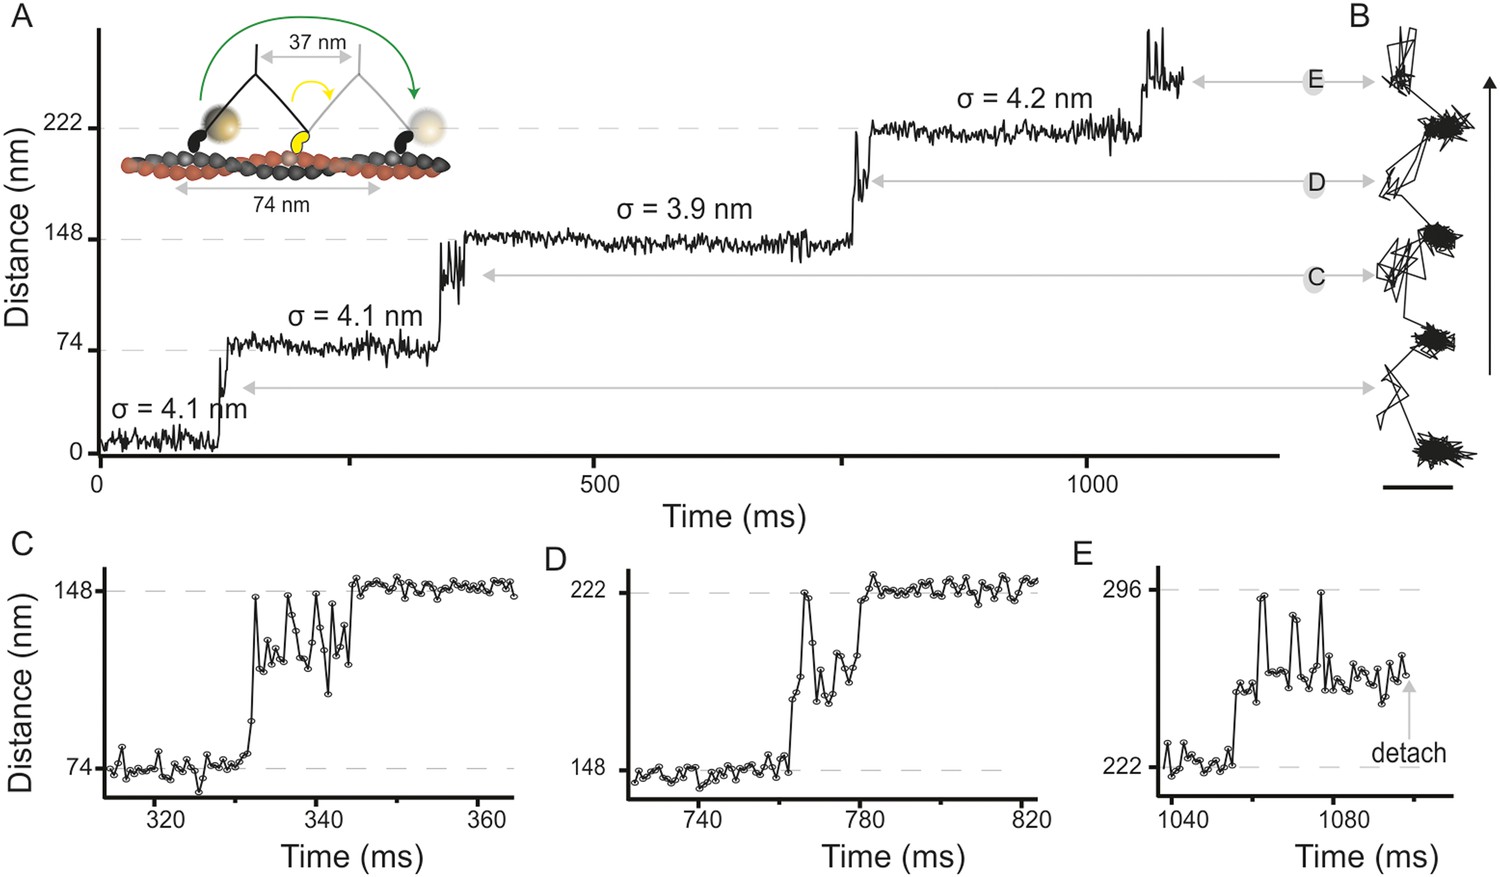
High-speed nanometric tracking of myosin 5 with interferometric scattering (iSCAT) microscopy.
(A) Distance traveled as a function of time for a single myosin 5 molecule biotinylated at the N-terminus and labeled with a 20 nm streptavidin-functionalized gold particle. The lateral localisation precision, σ, defined as the standard deviation of the positional fluctuations of the label while bound to actin is given above each of the actin-attached periods. Inset: schematic of gold-labeled myosin 5 stepping along actin. (B) Corresponding 2D-trajectory with the arrow indicating the direction of movement. (C–E) Close-up of the transient states indicated in A and B. ATP concentration: 10 μM. Scale bar: 50 nm. Imaging speed: 1000 frames/s (corresponding video: Video 1).
Figure 1—figure supplement 1
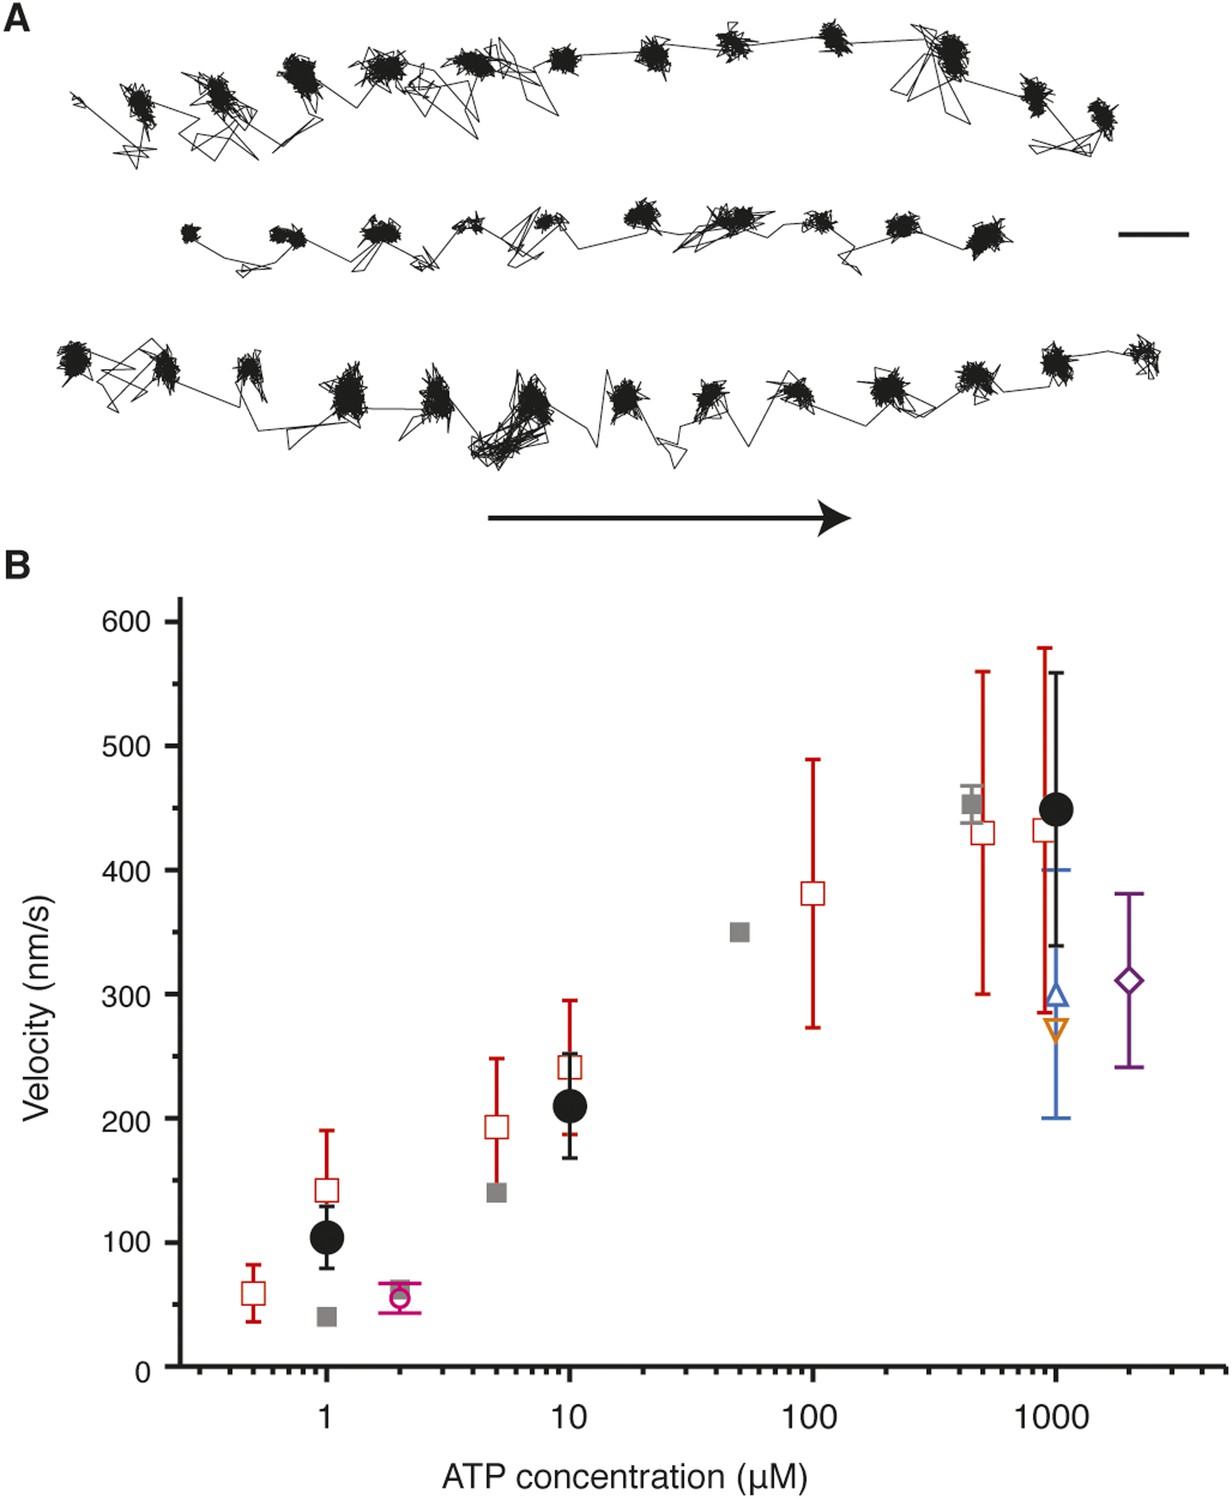
Activity of myosin 5 labeled with 20 nm gold nanoparticles at the N-terminus.
(A) Sample trajectories at [ATP] = 10 µM and at 1000 frames/s. Arrow indicates direction of motion. Scale bar: 50 nm. (B) Comparison of myosin 5 activity recorded in this work with previous single molecule studies. Black circles: this study. Symbols are defined as: purple rectangle, (Mehta et al., 1999) grey squares, (Forkey et al., 2003) dark blue square, (Warshaw et al., 2005) orange triangle, (Komori et al., 2007) pink circle, (Ohmachi et al., 2012) red open squares, (Ortega Arroyo et al., 2014).
Figure 1—figure supplement 2

Detection of the transient state with a molecular sized fluorescent label.
(A) Representative distance time series of a myosin 5 molecule labelled with an atto-647N/streptavidin conjugate at the N-terminus and tracked using single molecule total internal fluorescence microscopy. (B) Corresponding 2D trajectory. (C) Additional traces exhibiting the transient state marked by arrows. ATP concentration: 10 μM. Scale bar: 50 nm. Imaging speed: 100 frames/s.
Figure 1—figure supplement 3

Rare transient unbinding events for the leading head of myosin 5.
(A) Representative time trace segment of an event in which the leading head detaches from the actin filament and exhibits the intermediate state behaviour reported in the main text. (B) Corresponding 2D—trajectory of the segment highlighted in A. ATP concentration: 1 μM. Scale bar: 50 nm. Imaging speed: 1000 frames/s.
Figure 2 with 1 supplement
Three-dimensional interferometric tracking of the myosin head.
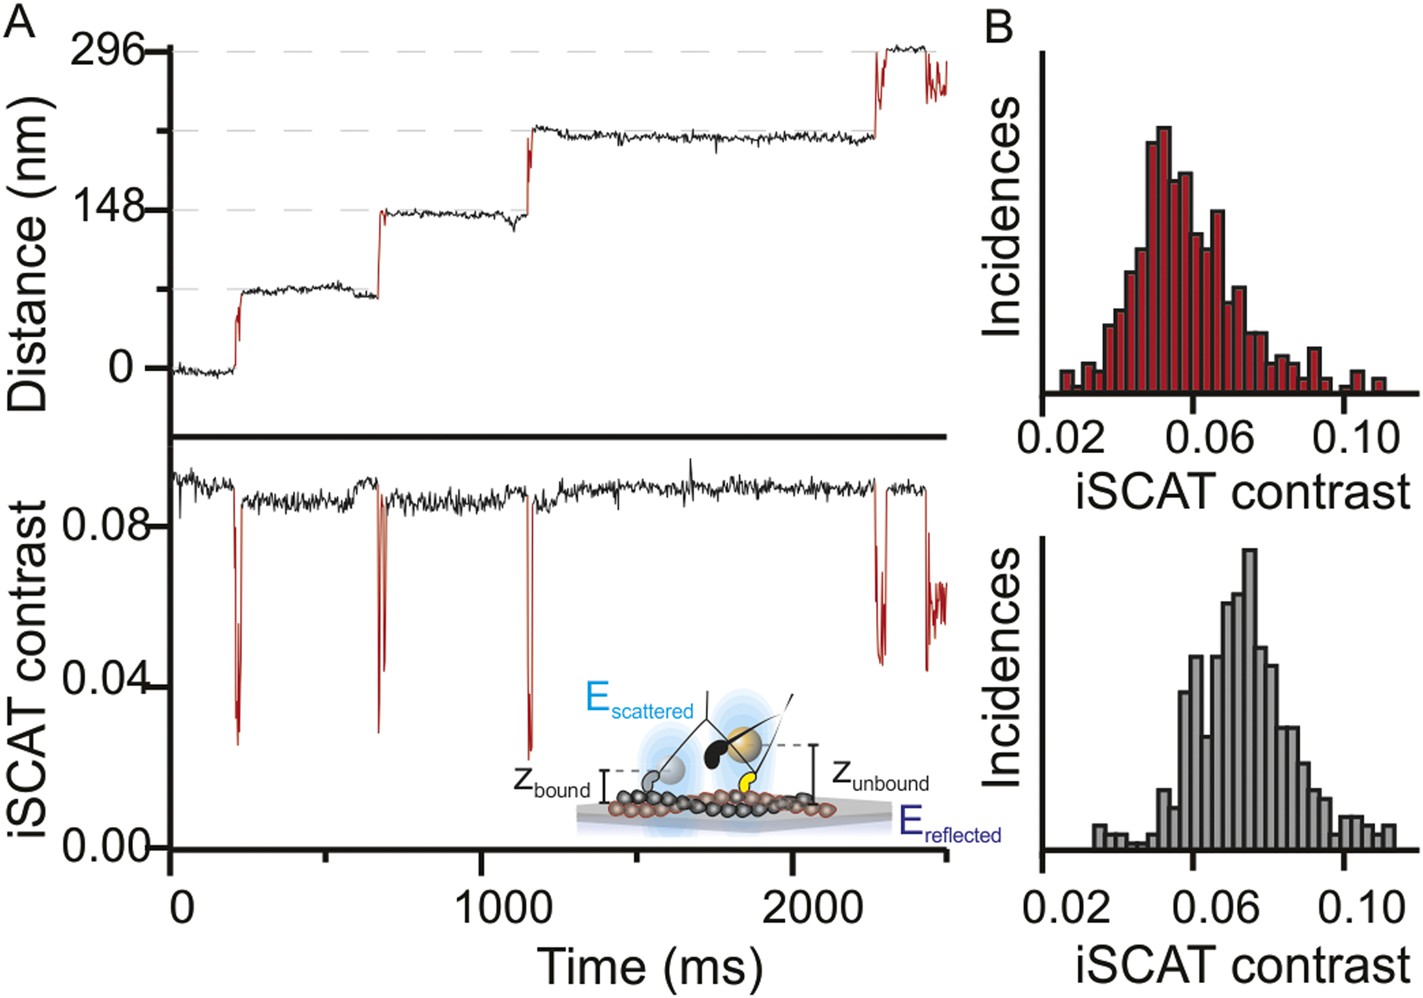
(A) Distance trace (upper panel) with the simultaneously recorded iSCAT contrast (lower panel). The red subset of the traces corresponds to the unbound head state. Inset: schematic illustrating how the difference in optical path difference for the bound (zbound) and unbound (zunbound) state leads to changes in iSCAT contrast caused by the interference of the reflected (Ereflected) and scattered (Escattered) electric fields. (B) Normalized histogram of the average iSCAT contrast while the head is in the transient state (red, N = 329) or bound to actin (black, N = 303). ATP concentration: 10 μM. Imaging speed: 1000 frames/s.
Figure 2—figure supplement 1
Dual colour iSCAT imaging of myosin 5.
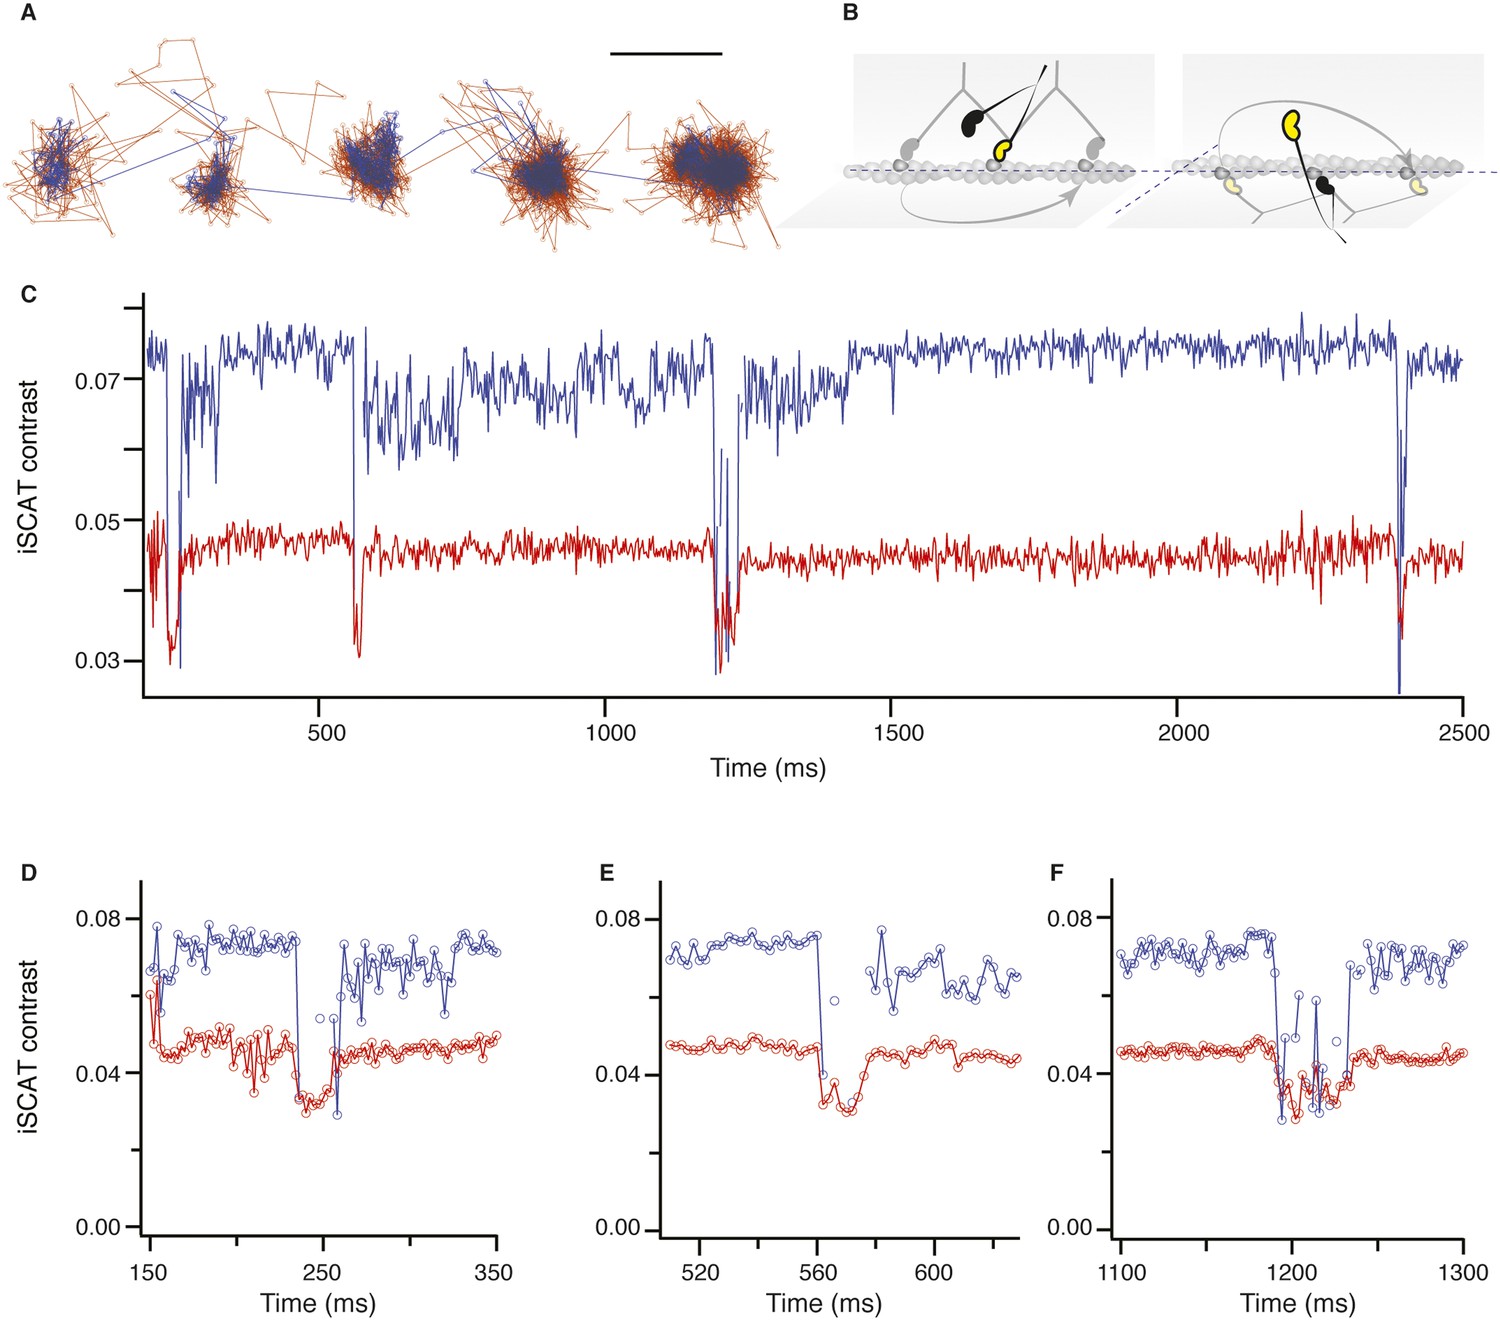
(A) 2D-trajectory of myosin 5 stepping along actin recorded simultaneously with 445 nm (blue trace) and 635 nm (red trace) illumination. Although the latter channel exhibits higher noise due to a lower scattering signal, the transient state is evident in every step even though much of the data are lost in the trace recorded at 445 nm due to the major drop in scattering intensity. (B) Schematic of myosin stepping along actin with different azimuthal orientations relative to the actin filament. (C) Corresponding iSCAT contrast as a function of time. Although the contrast is large in the blue channel, it drops much more significantly during population of the transient state. (D–F) Zoom of the contrast behaviour during the transient state from (C). ATP concentration: 10 μM. Scale bar: 50 nm. Imaging speed: 1000 frames/s.
Figure 3 with 1 supplement
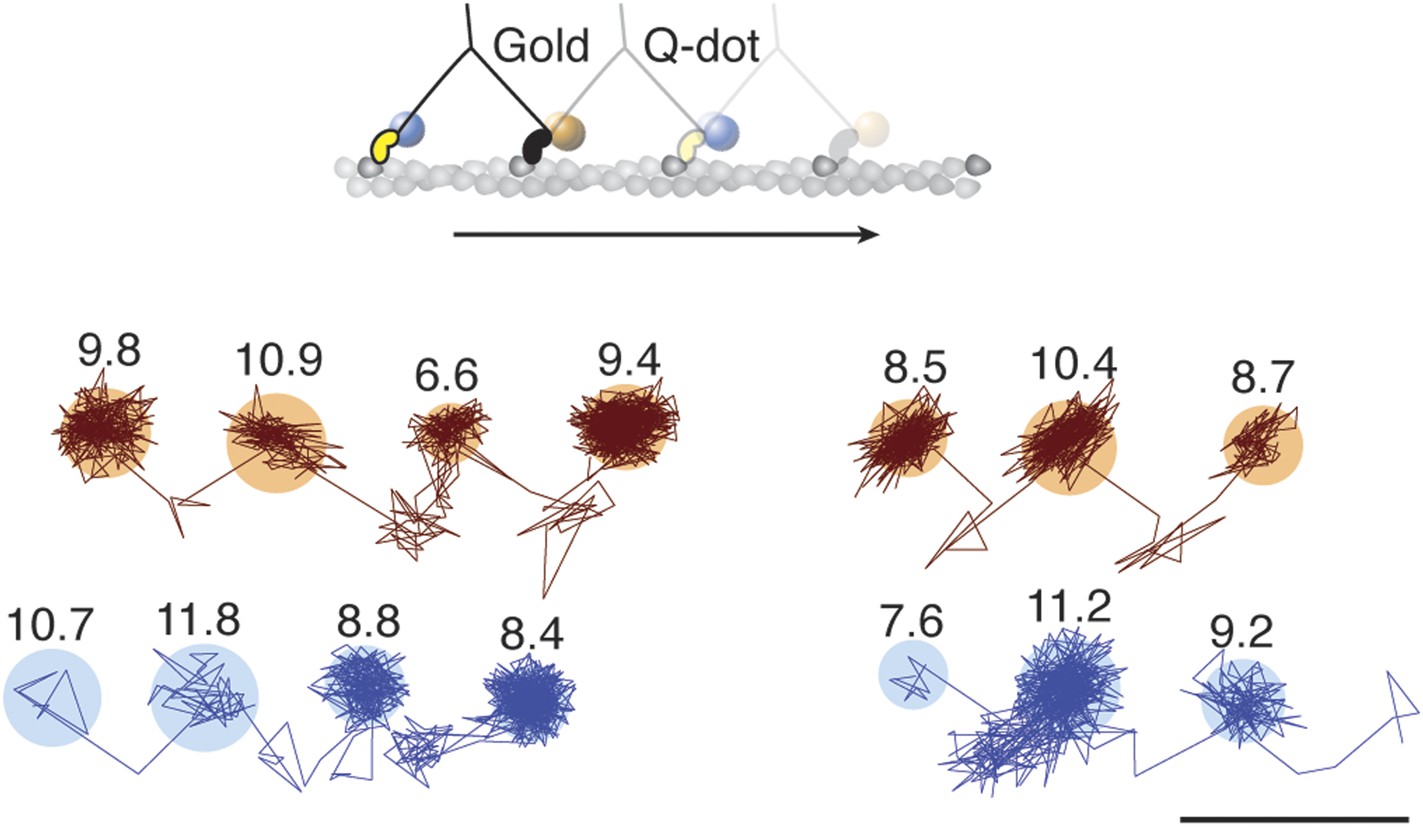
Simultaneous scattering and fluorescence tracking of a single myosin 5a.
One head was labeled with a 20 nm streptavidin-functionalized gold particle (red) and the other with a fluorescent quantum dot (blue). Reported values correspond to the standard deviation σ in the position of the bound state (nm) and the shaded regions encompass an area of 3σ. The traces are colored according to the label colors in the inset. ATP concentration: 10 μM. Scale bar: 100 nm. Imaging speed: 500 frames/s.
Figure 3—figure supplement 1
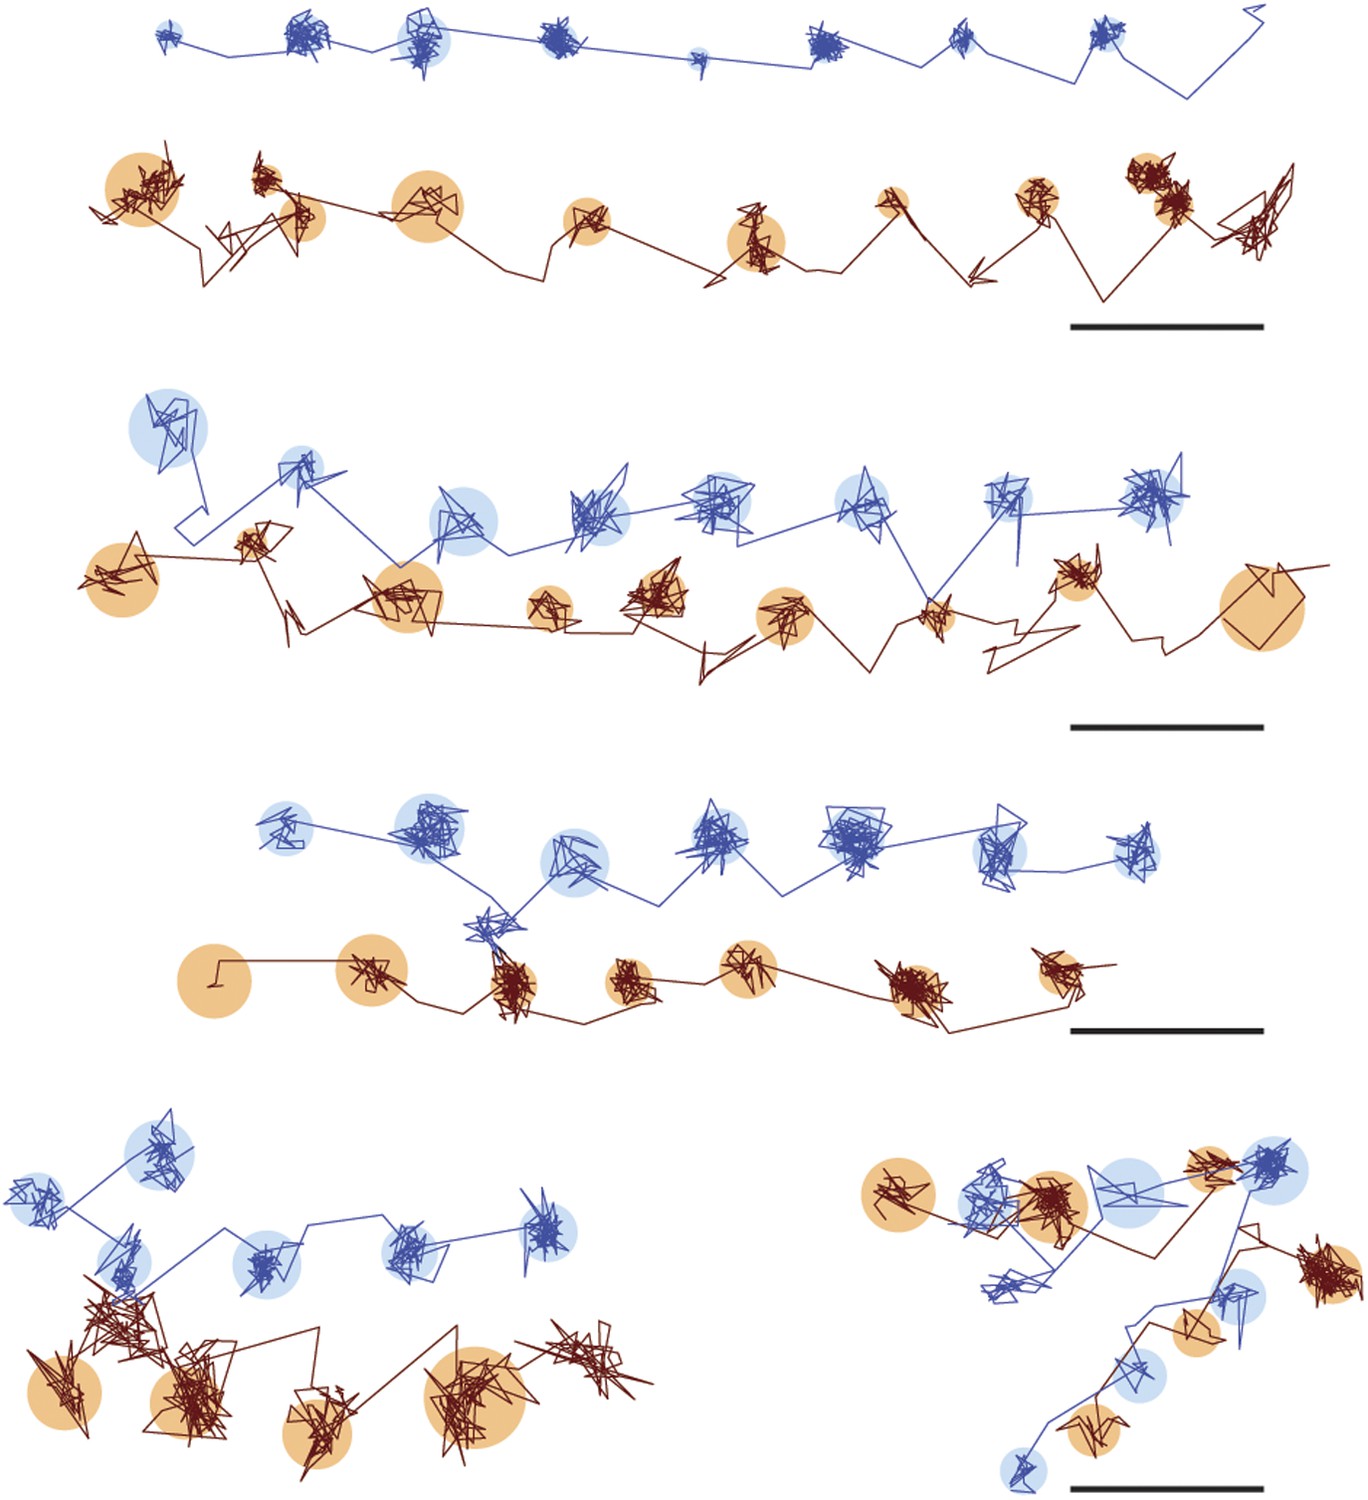
Additional traces of simultaneous scattering and fluorescence tracking of a single myosin 5a.
One head was labelled with a 20 nm streptavidin-functionalized gold particle (red) and the other with a fluorescent quantum dot (blue). Reported values correspond to the standard deviation σ in the position of the bound state (nm) and the shaded regions encompass an area of 3σ. The traces are colored according to the label colors in the inset. ATP concentration: 10 μM. Scale bar: 100 nm. Imaging speed: 100 frames/s.
Figure 4 with 1 supplement
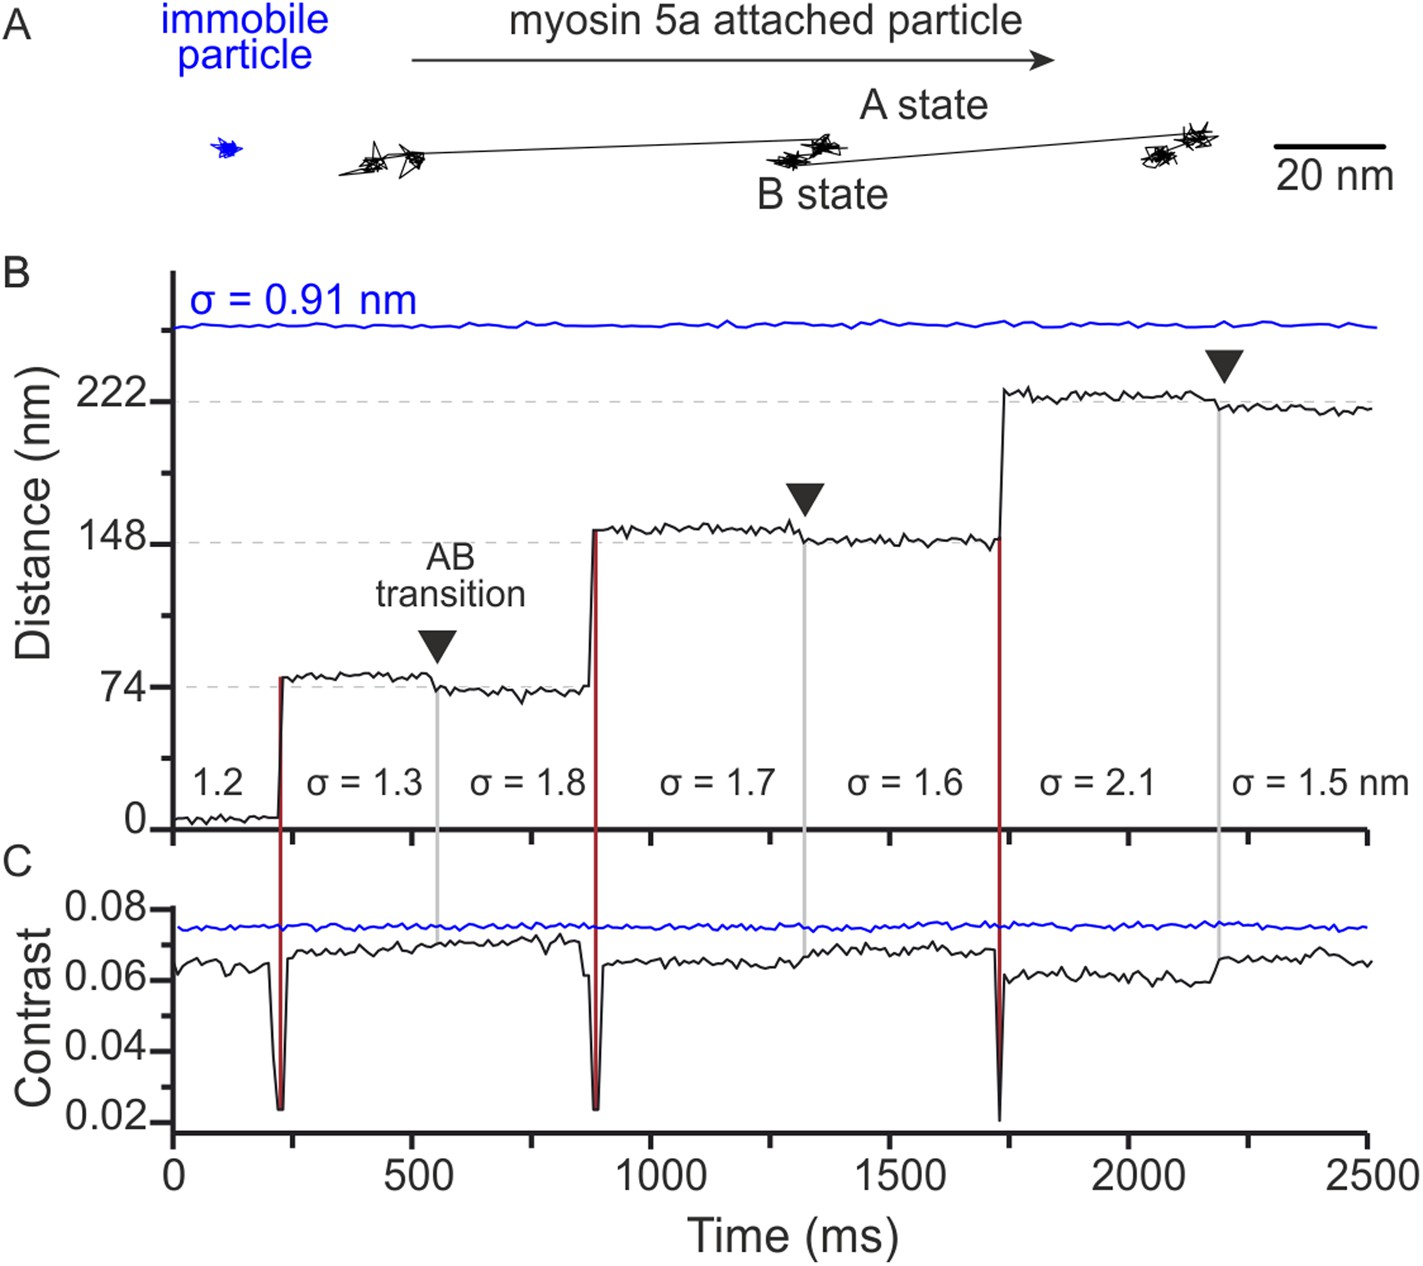
Two states of the motor domain during myosin movement.
(A) Sample 2D trajectories for a 20 nm gold particle immobilised on the surface and attached to the N-terminus of myosin 5a. The arrow indicates the direction of myosin movement. The trace shown is a fragment of the trajectory obtained from Video 2. (B) The same trajectory depicted as distance travelled vs time. Two distinct states (A and B) of the bound head are evident (black arrows). Standard deviations (σ) are given to compare both fixed (blue) and myosin bound particles (black). (C) Corresponding iSCAT contrast time trace for the trajectories in (B). A brief reduction in iSCAT contrast coincides with 74 nm steps taken by the labeled head (red vertical lines). The behaviour of a non-specifically surface-bound 20 nm gold particle that is completely immobilized is shown for comparison (blue traces in upper portion of the graphs in panels B and C). Repeated localization of the particle throughout suggests a nominal sub-nm lateral localization precision and a constant scattering contrast. ATP concentration: 10 μM. Scale bar: 20 nm. Imaging speed: 100 frames/s.
Figure 4—figure supplement 1
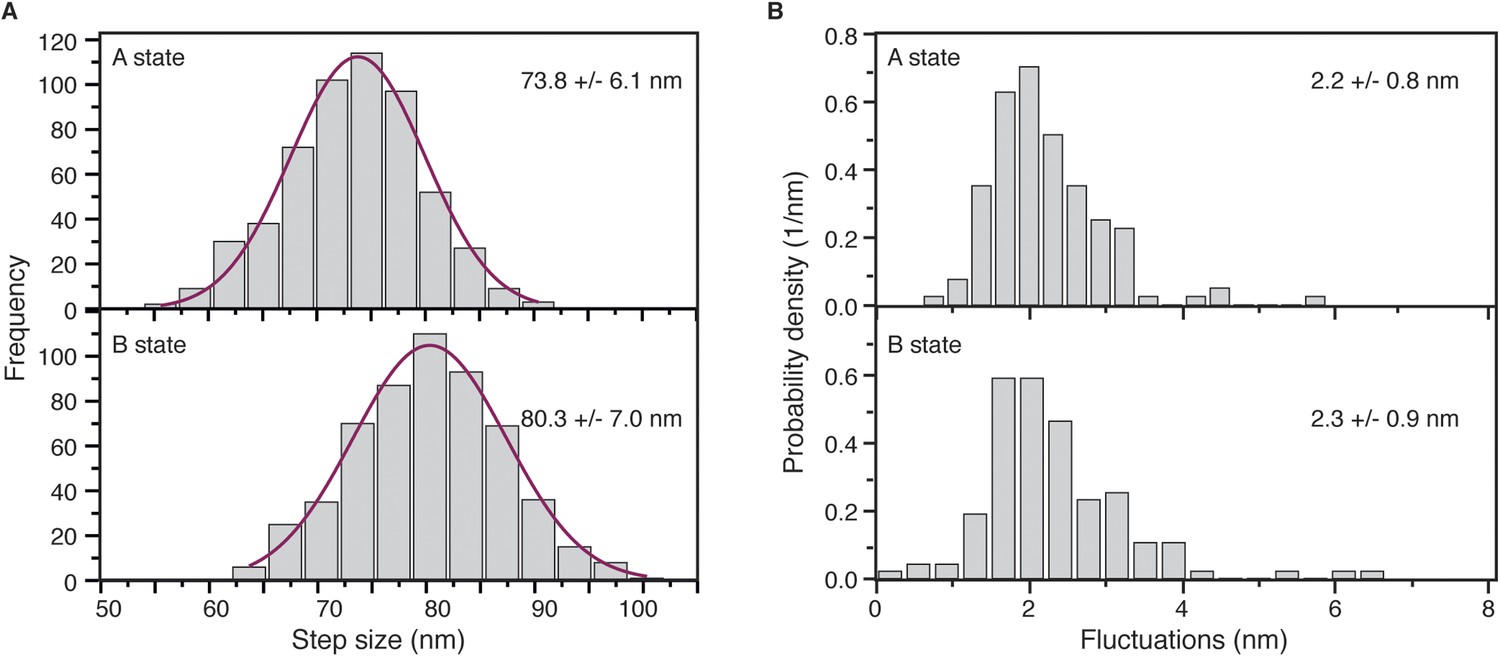
(A) Step size histograms for post to pre-power stroke and post to post power stroke states.
Data was collected at 100 Hz and 10 μM ATP, using 20 nm diameter gold nanoparticles. Number of steps analysed: 554. (B) The positional fluctuations of the A and B states presented as histograms of lateral localization precision, σ, show no measurable difference in mechanical stability of the two states.
Figure 5
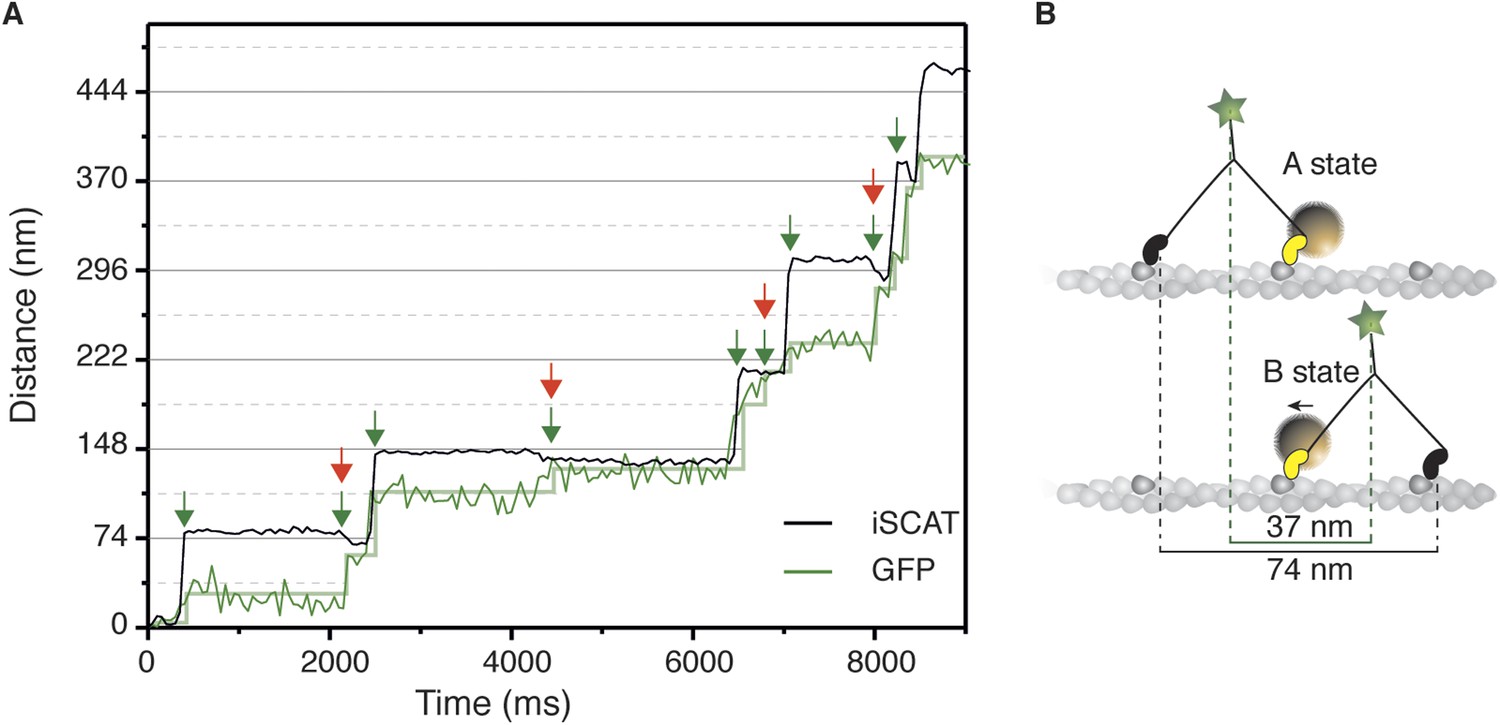
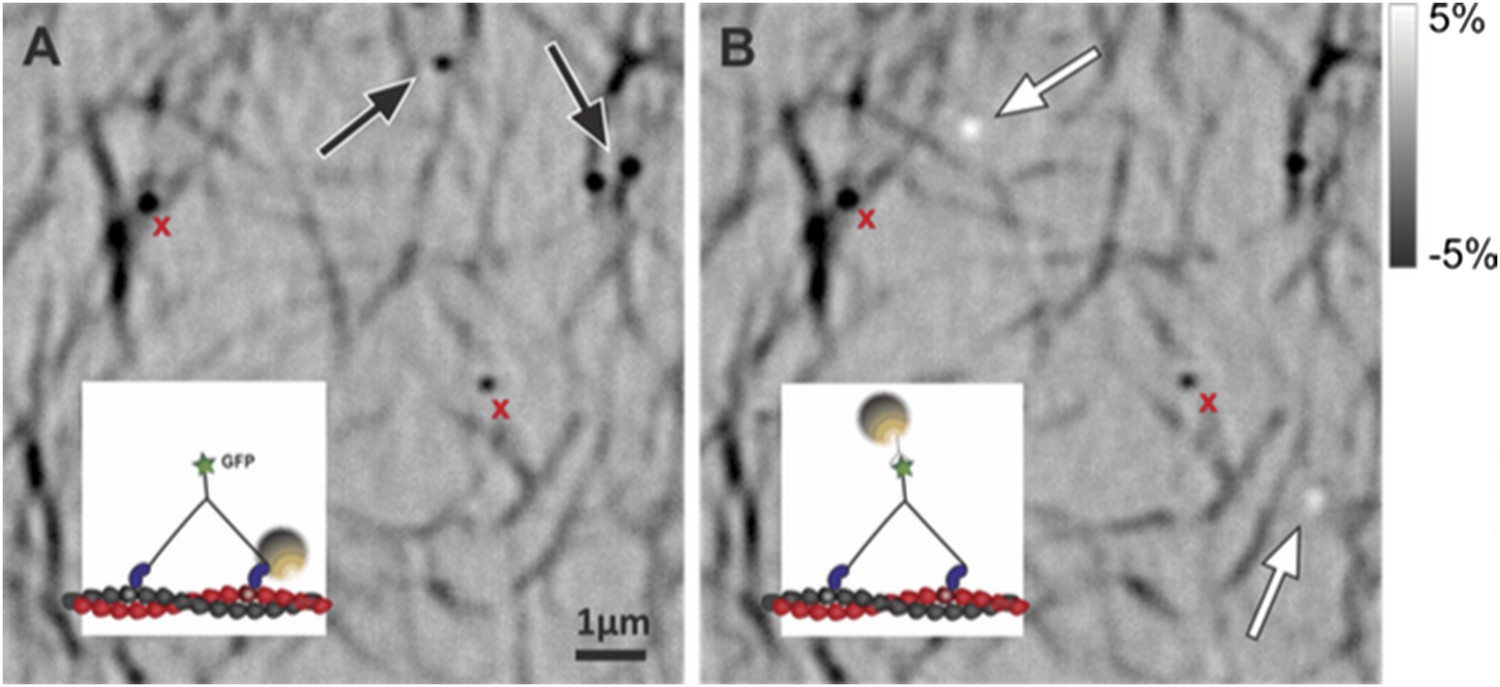
Simultaneous iSCAT and fluorescence tracking of myosin 5a.
(A) Tracking of the scattering signal from the gold nanoparticle attached to the N-terminus (black) and fluorescence signal from the GFP moiety located at the C-terminus of the same myosin 5a molecule (green). Movement of the tail correlates with the labeled head taking its step (74 nm displacement) and with the AB transition (power stroke of the labeled head). Green arrows represent the tail movement, which corresponds to the step of either the labelled or unlabeled head. When the unlabeled head takes its step it coincides with the AB transition within the labeled head (red arrows). Static localization precisions determined as in Figure 2: 1.6 nm (iSCAT), 8 nm (GFP). (B) Labelling scheme and schematic of the stepping mechanism and the corresponding observables. ATP concentration: 1 μM. Imaging speed for both channels: 20 frames/s.
Figure 6
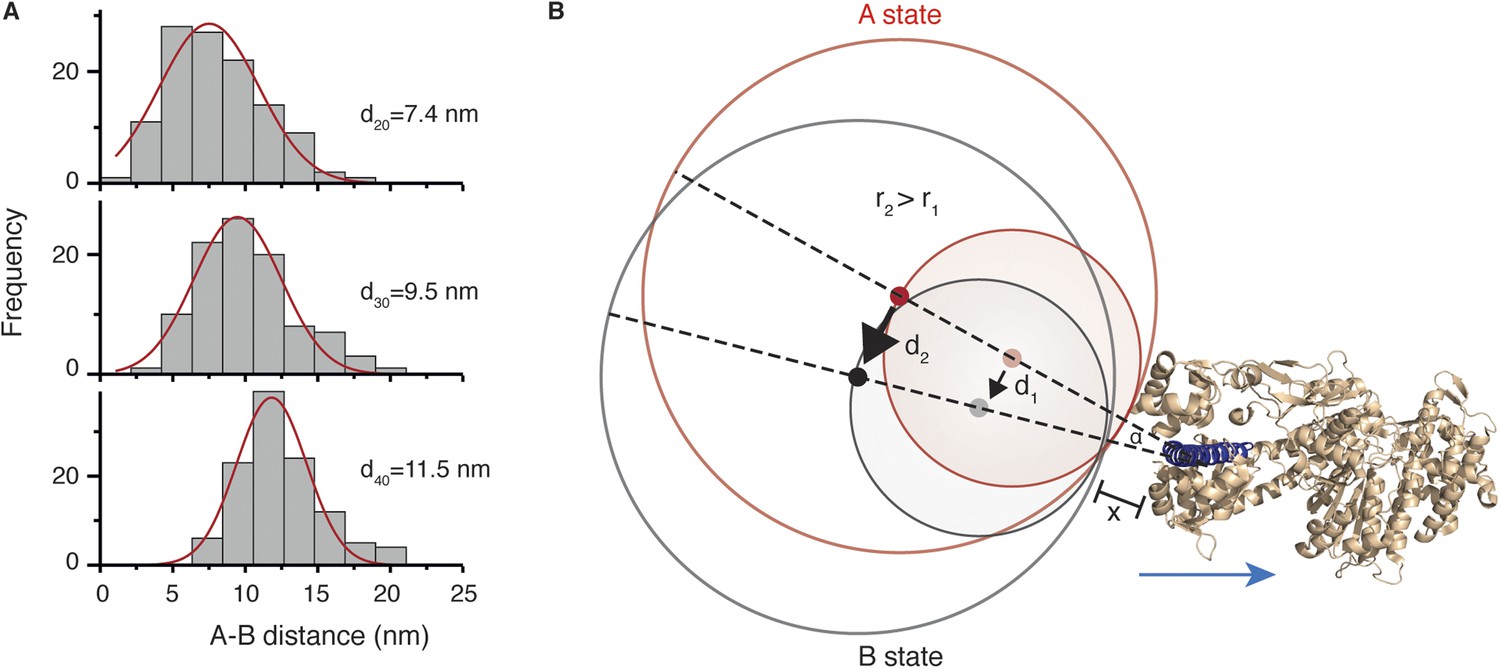
Conformational change within the N-terminal domain during the power stroke.
(A) Histograms for the distances between A and B states for 20, 30 and 40 nm gold nanoparticle labels located at the N-terminus. Total number of steps recorded: 124, 103 and 116, respectively. (B) Expected movement for two differently sized labels attached to myosin 5a during a conformational change in the head domain associated with the power stroke. The red circle represents the position of the label in the A state, and the grey circle corresponds to the B state with dots indicating their respective centres of mass. The labels r1 and r2 correspond to the radii of both labels where r2 = 2 × r1, and d1 and d2 correspond to the AB distance after rotation by an angle α around an origin located within the head domain at a distance x from the nanoparticle surface. The myosin 5a head domain pre-power stroke conformation is shown in orange (PDB: 1W7J). The lever arm is pointing out (shown in dark blue) and the blue arrow indicates its movement during the power stroke.
Figure 7
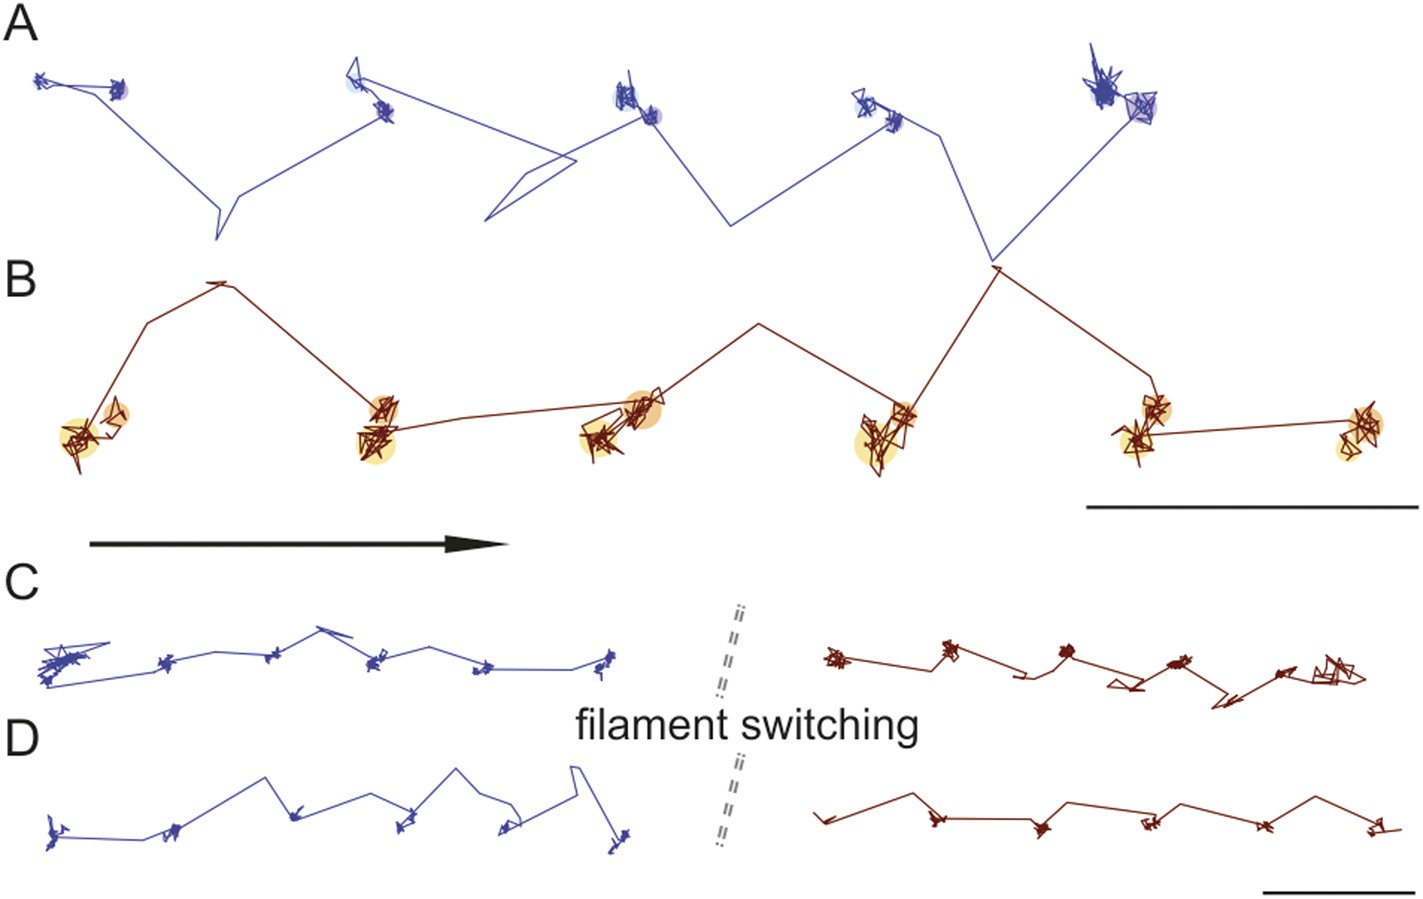
Directionality and kinetics of the AB transition and the transient state.
(A and B) Simultaneous observation of the AB transition and the transient state for right and left handed walking molecules. (C and D) Position of the transient state for the same molecule before and after switching actin tracks. ATP concentration: 10 μM. Scale bar: 100 nm. Imaging speed: 100 frames/s.
Figure 8 with 4 supplements
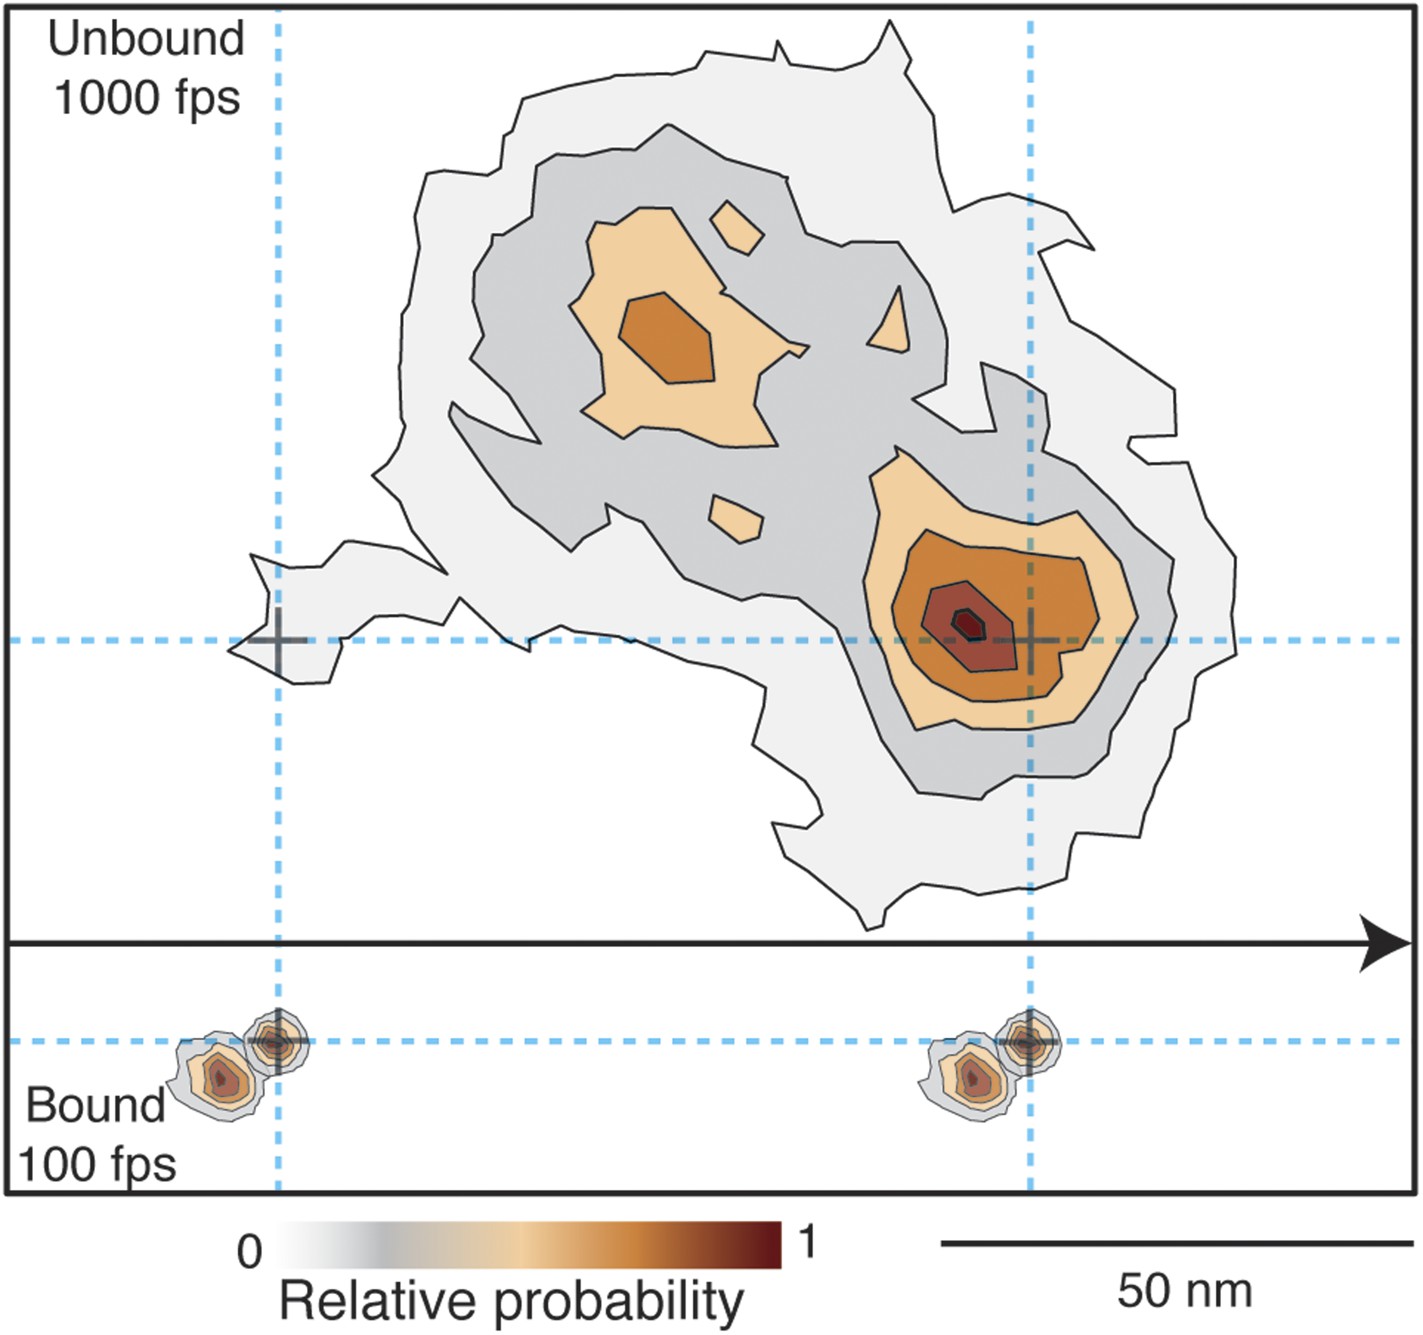
Probability density contour maps of the myosin step.
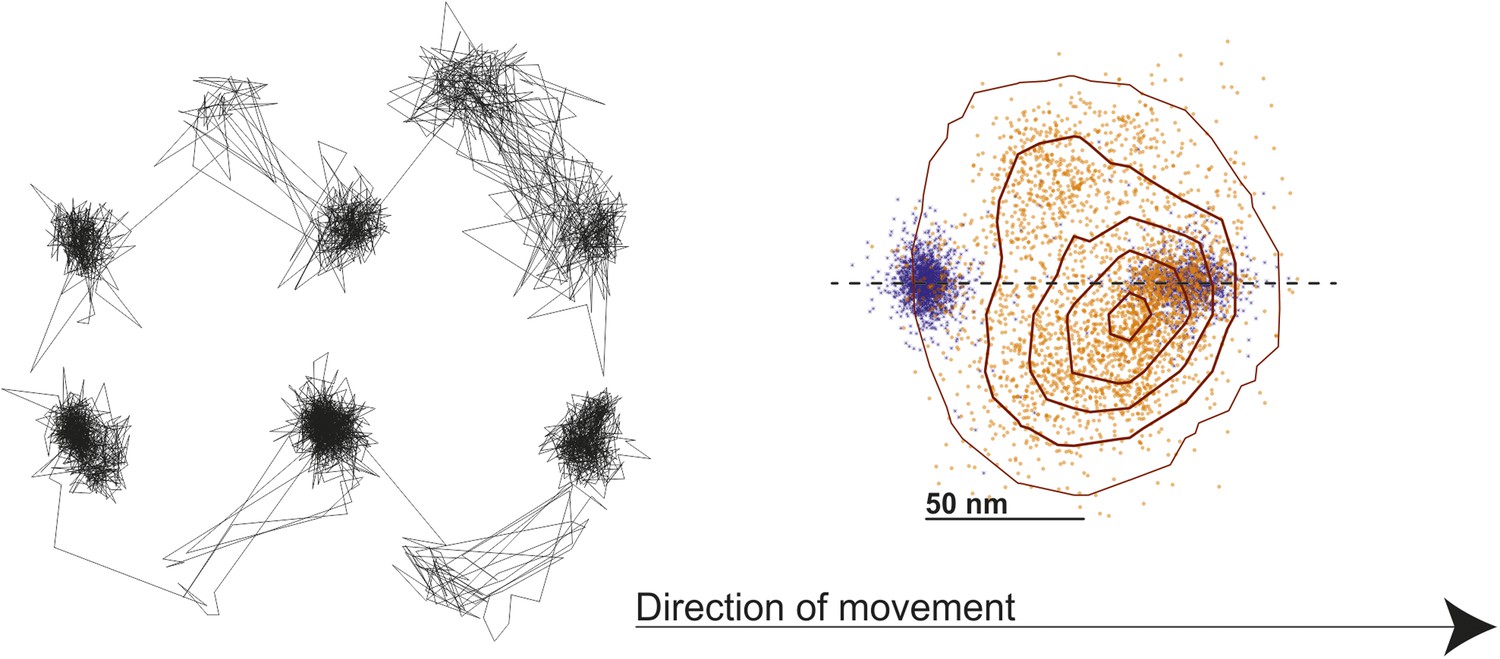
Upper panel represents the transient state of the unbound head. Contour map of a two-dimensional histogram with a 10 × 10 nm2 bin width obtained from the 1000 frames/s data (N = 486). Lower panel shows the AB transition within the bound head, a two-dimensional histogram with a 1 × 1 nm2 bin width generated using the 100 frames/s data (N = 129). All contributing steps were aligned and those to the right of the filament when viewed in the direction of motion were mirrored. The arrow represents direction of movement (from left to right).
Figure 8—figure supplement 1
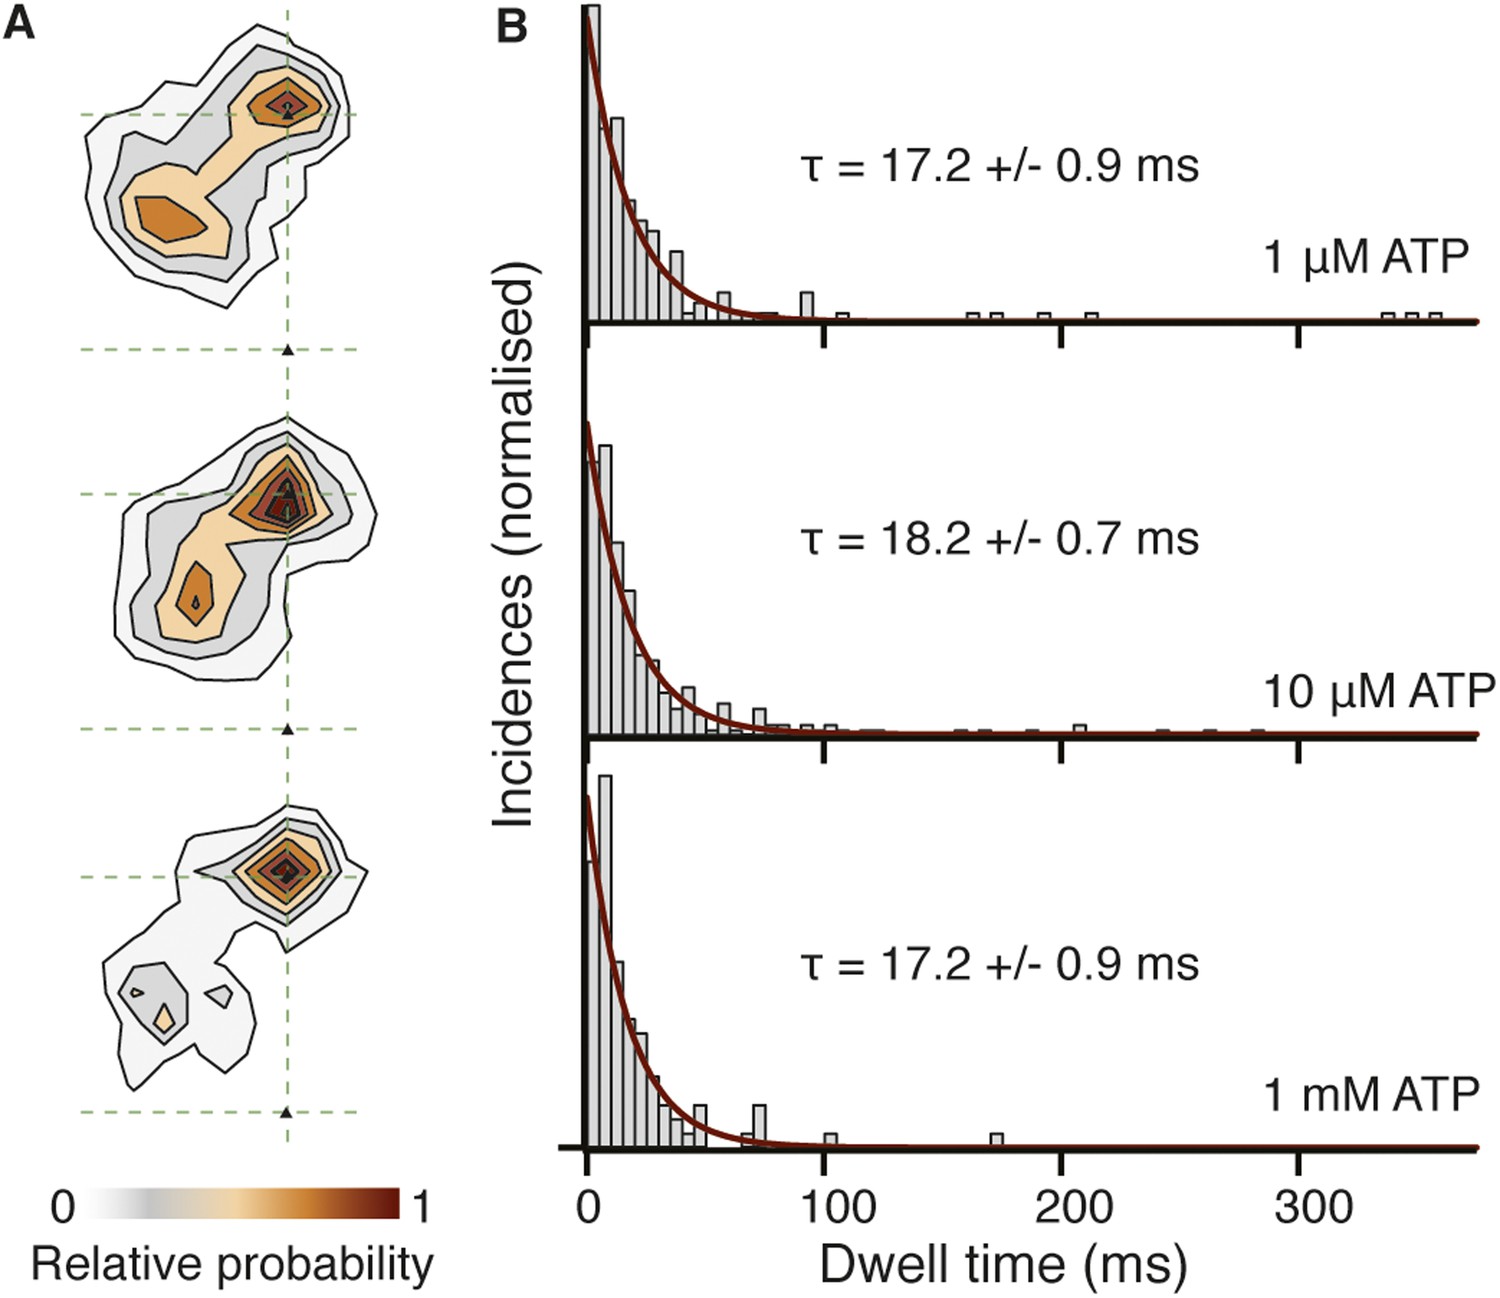
Spatiotemporal dynamics of the transient state as a function of ATP concentration.
(A) Contour maps of the transient state at three different ATP concentrations. Obtaining traces at high ATP concentration was challenging due to the small available field of view and rapid detachment of myosin from actin caused by the faster stepping rate. (B) Dwell time histograms at three different ATP concentrations (1 μM, N = 116; 10 μM, N = 223; 1 mM, N = 90). Fitting the dwell time distribution to a single exponential yields an average lifetime of 17.5 ± 0.6 ms, independent of ATP concentration.
Figure 8—figure supplement 2
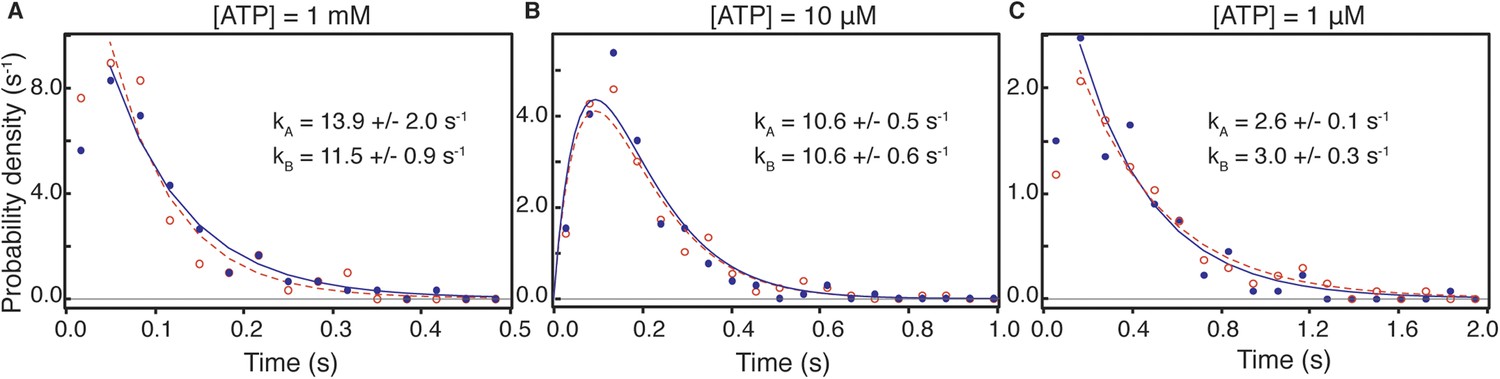
Dwell time distributions for pre and post-power stroke states at different ATP concentrations.
In all cases, data and fits for the pre-power stroke state are shown in red; data and fits for the post-power stroke state are shown in blue. At saturating (1 mM) ATP concentration (A) both dwell time distributions exhibited single exponential behaviour in line with ADP release being the rate limiting step. The constants for the A state dwell times are given by kA and that for the B state by kB. At lower ATP concentrations, sequential ADP release and ATP binding result in bi-exponential behaviour. At 10 μM ATP (B), both kinetic constants, k1, k2, are almost identical therefore the dwell time distribution is fit to two sequential process with the same rate constant (termed kA for the dwell time of the A state and kB for that of the B state). (C) At 1 μM ATP the process is limited by ATP binding. Data taken at 100 frames/s, we increased the imaging speed to 400 Hz at 1 mM ATP concentration. Total number of steps recorded: 110, 245 and 104, for 1 μM, 10 μM and 1 mM, respectively.
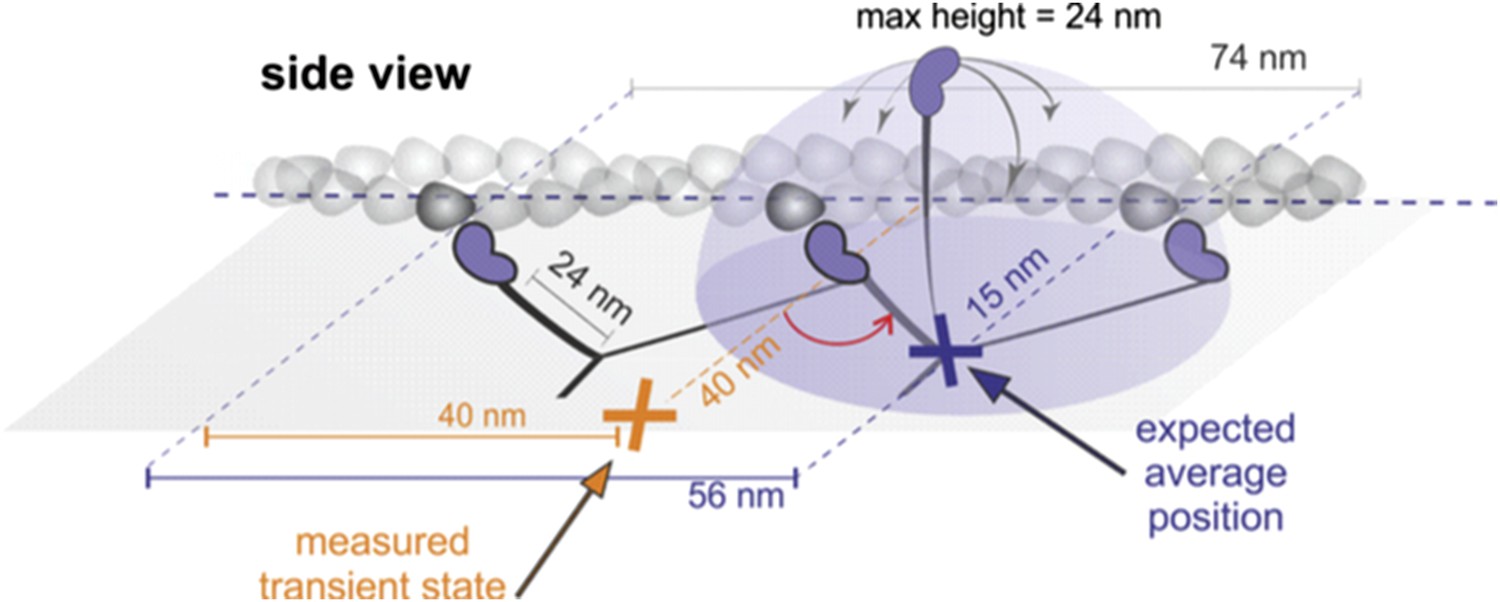
Figure 8—figure supplement 3
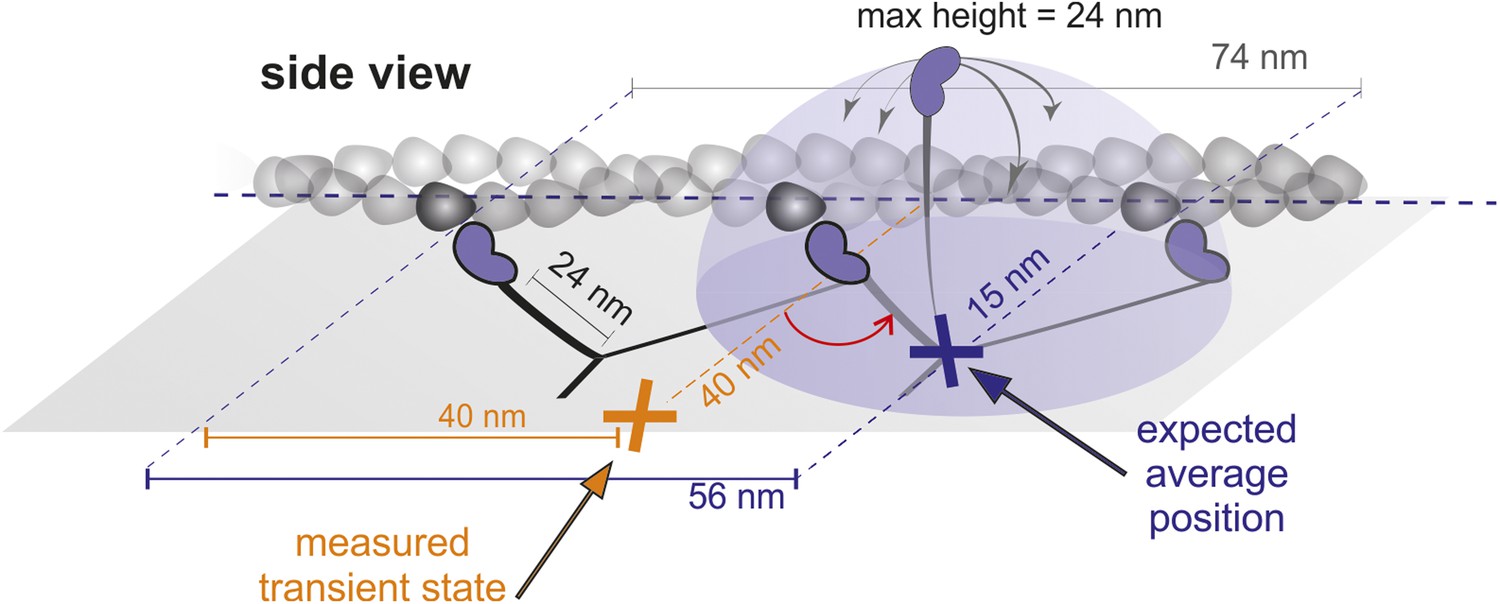
Geometrical considerations assuming myosin molecules moving parallel to the glass surface.
If the head searched the full spherical space, the average position would be simply about half way between the leading head and the next binding site. For a parallel orientation this would be 56 nm forward and 15 nm off axis and for a perpendicular orientation 56 nm forward but ‘in line’ with the bound head positions. These numbers arise from simple geometric considerations but also agree with much more sophisticated simulations based on a free rotational diffusion model (Hinczewski et al., 2013). We, however, observed a transient state half way between the two binding sites, 40 nm off axis (marked in orange), which rules out this geometry.
Figure 8—figure supplement 4
Probability density contour map of the transient state.
Contour map of a two-dimensional histogram with a 18 × 18 nm2 bin width was obtained using all, left- and right- handed walking traces, without flipping (left panel). The resulting contour plot shows good agreement with previous results (Dunn and Spudich, 2007).
Figure 9
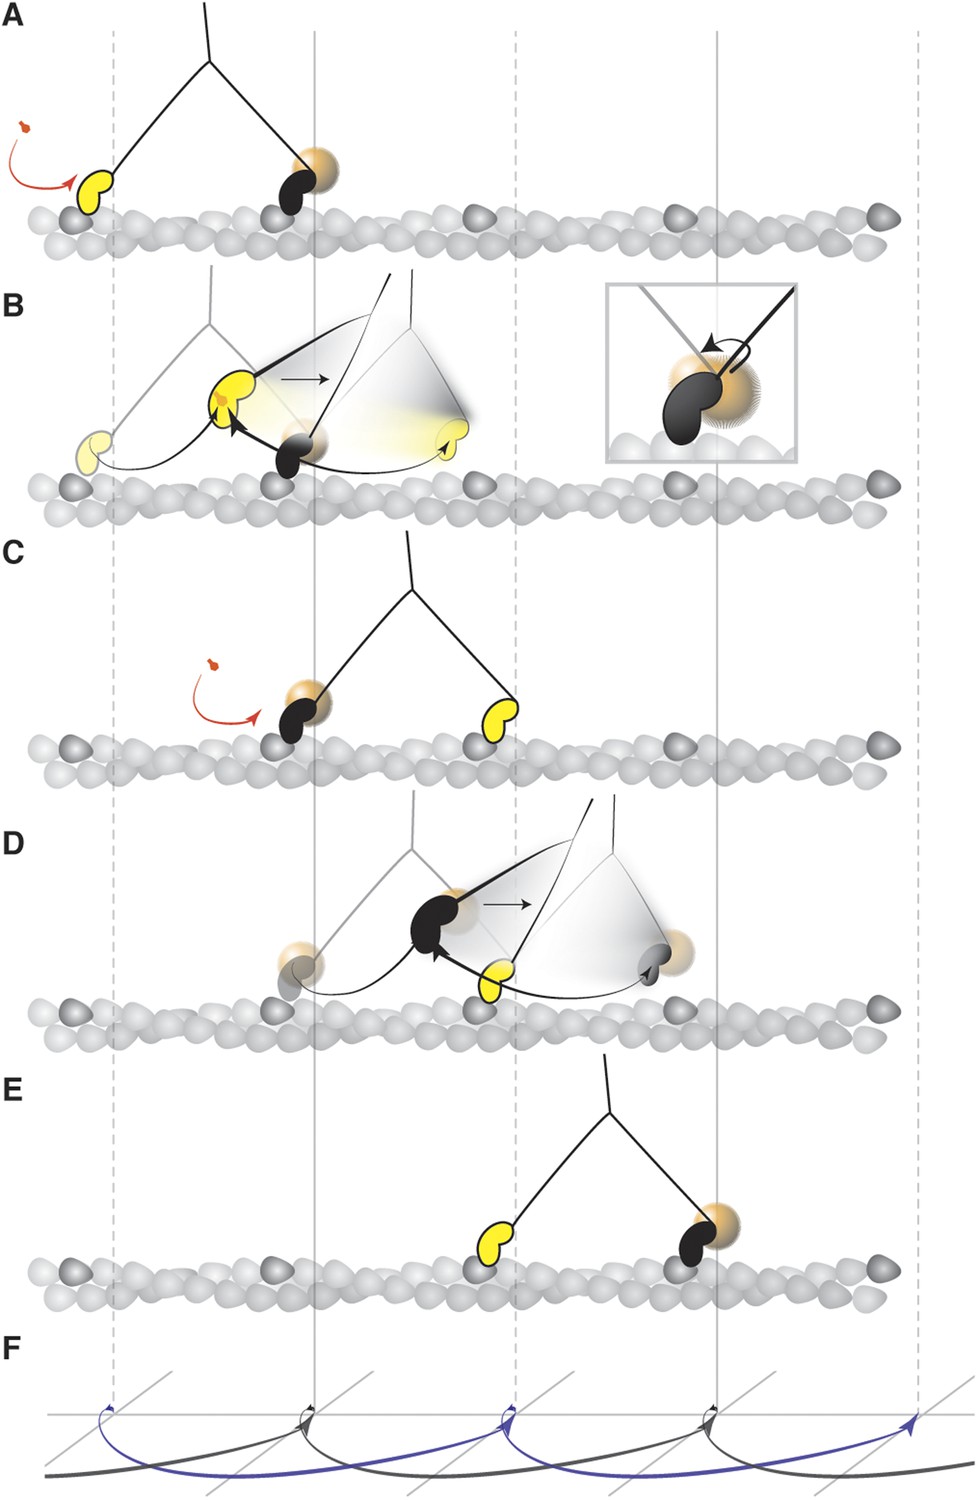
Mechanism of the myosin step.
(A) ATP binding to the trailing head (yellow) and its detachment releases strain stored in the molecule. (B) The bound head (black with a gold nanoparticle attached) performs its power stroke which is accompanied by the AB transition (inset). The labeled head becomes a new trailing head (C) which detaches after ATP binding. (D) It moves forward in a partially twisting motion and occupies an off axis position (transient state). From this position, the head binds the desired binding site while ATP hydrolyses. (E) The step completes as the head binds actin and is repeated by the other head in the same direction dictated by the initial torsional strain. (F) Schematic representation of both heads' movement (lateral projection).
Author response image 1
Author response image 2
Author response image 3
Videos
Video 1
This file contains the iSCAT video from which the trajectory shown in Figure 1 of the main manuscript was obtained.
The left panel presents the raw video format after referencing with the flat field image. The flat field accounts for illumination inhomogeneities and was generated as described in the Materials and Methods section. The right panel shows the static background subtracted video format. The background includes the average of 100 frames before the particle binds and removes the constant features which are part of the sample (a.g. actin, glass roughness) by simple subtraction (Ortega Arroyo et al., 2014). The video was taken at 1000 frames/s and at a magnification of 31.8 nm/pixel. The corresponding field of view shown is 1.30 × 1.30 μm2 and corresponds to a total recording time of 1.3 s. The video playback speed is 1000 frames/s.
Video 2
This file contains a full video from which the trajectory shown in Figure 4 of the main manuscript was obtained.
The video was taken at 100 frames/s and at a magnification of 31.8 nm/pixel. The corresponding field of view shown is 2 × 2 μm2 and corresponds to a total recording time of 5 s. The video playback speed is 100 frames/s.
Download links
A two-part list of links to download the article, or parts of the article, in various formats.
Downloads (link to download the article as PDF)
Open citations (links to open the citations from this article in various online reference manager services)
Cite this article (links to download the citations from this article in formats compatible with various reference manager tools)
Structural dynamics of myosin 5 during processive motion revealed by interferometric scattering microscopy
eLife 4:e05413.
https://doi.org/10.7554/eLife.05413


