Endoplasmic reticulum stress-independent activation of unfolded protein response kinases by a small molecule ATP-mimic
- Howard Hughes Medical Institute, University of California, San Francisco, United States
- Fundación Ciencia & Vida, Chile
- Universidad Andrés Bello, Chile
- Mount Sinai Hospital, United States
- Max Planck Institute of Molecular Physiology, Germany
- Princeton University, United States
Figures
Figure 1 with 2 supplements
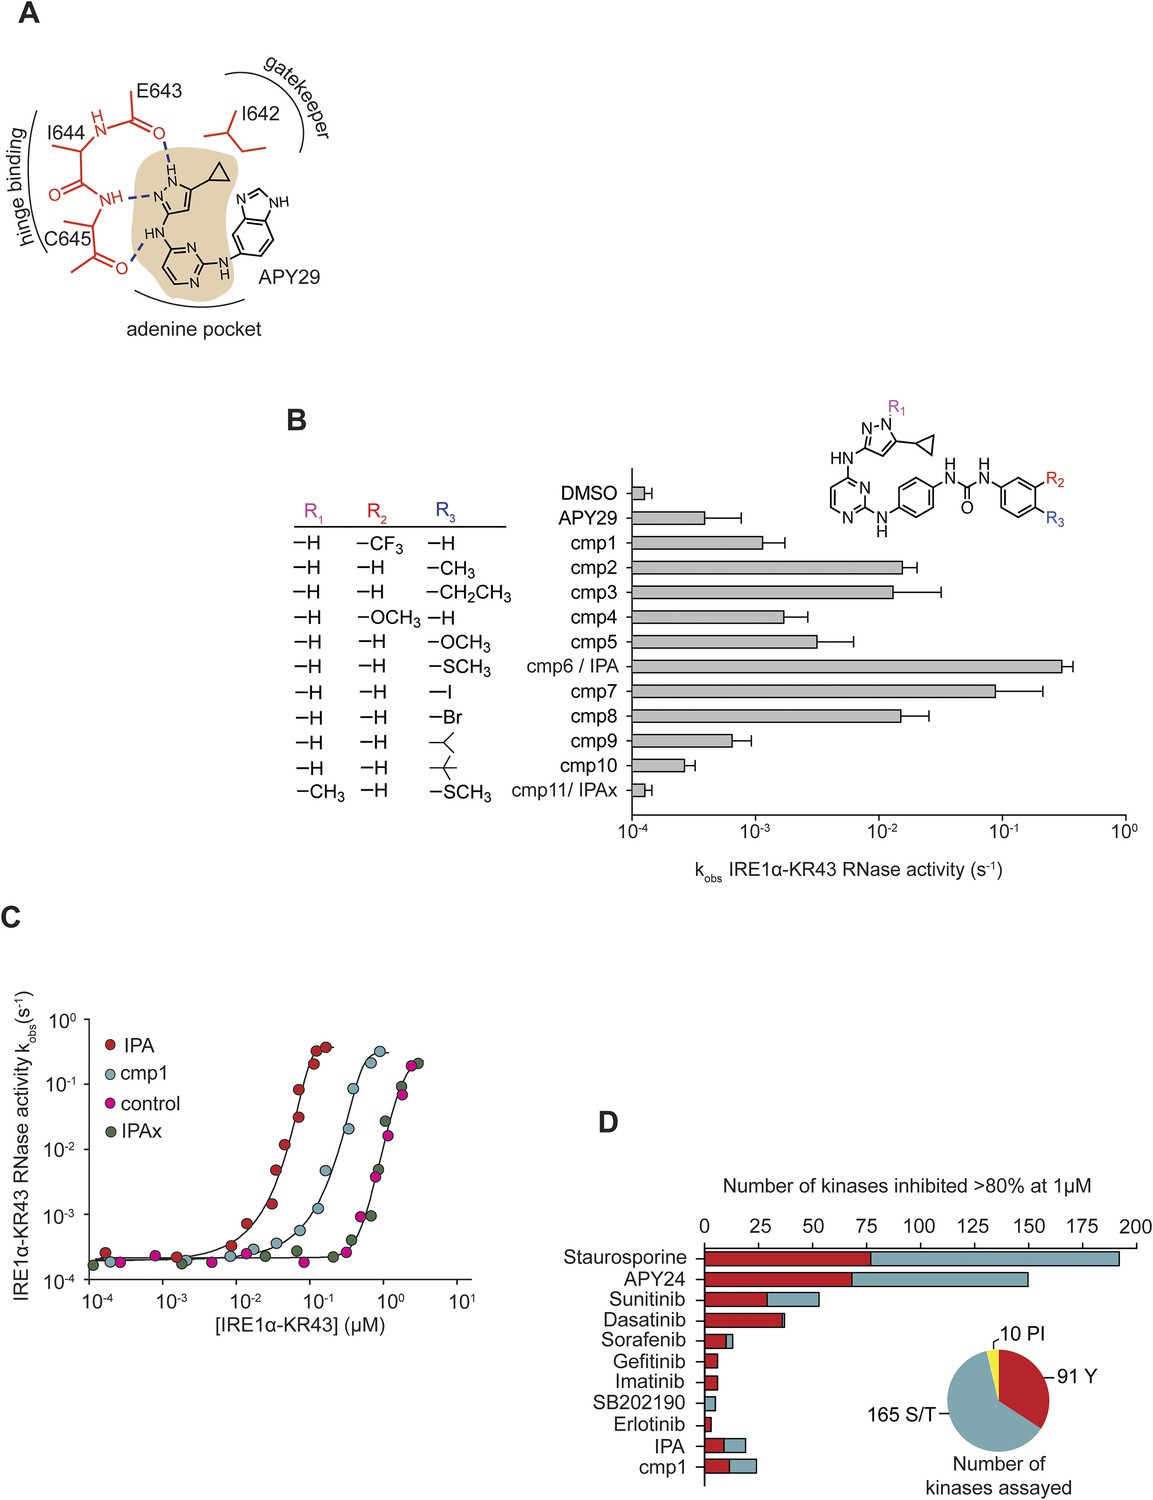
Design and characterization of IRE1α activators.
(A) The core scaffold of APY29 (aminopyrazole pyrimidine-base indicated in beige). (B) Structure-activity analysis of activating compounds. Compounds were assayed at 1 μM in a RNA cleavage assay containing IRE1α-KR43 (200 nM) and 5′ [32P]-labeled RNA substrate HP21 (see ‘Materials and methods’). IPAx is methylated at the N[1] position in the pyrazole ring indicated as shown in R1. (C) The effects of activating compounds (20 μM) as a function of IRE1α-KR43 concentration. 1/2kmax, obs and Hill coefficients (‘n’) were calculated (IPA: 1/2kmax, obs = 0.43 μM, n = 4.2; cmp1: 1/2kmax, obs = 3 μM, n = 3.8; IPAx 1/2kmax, obs = 8 μM, n = 3.3, DMSO control: 1/2kmax, obs = 8 μM, n = 3.3). (D) Compounds and FDA-approved drugs (all at 1 µM) were screened against a panel of 266 recombinant human kinases (‘S/T’: Ser/Thr protein kinases; ‘Y’: Tyr protein kinases, ‘PI’: phosphatidylinositide lipid kinases). APY24 contains the aminopyrozole pyrimidine-base, which is similar to APY29 (Figure 1—figure supplement 2).
Figure 1—figure supplement 1
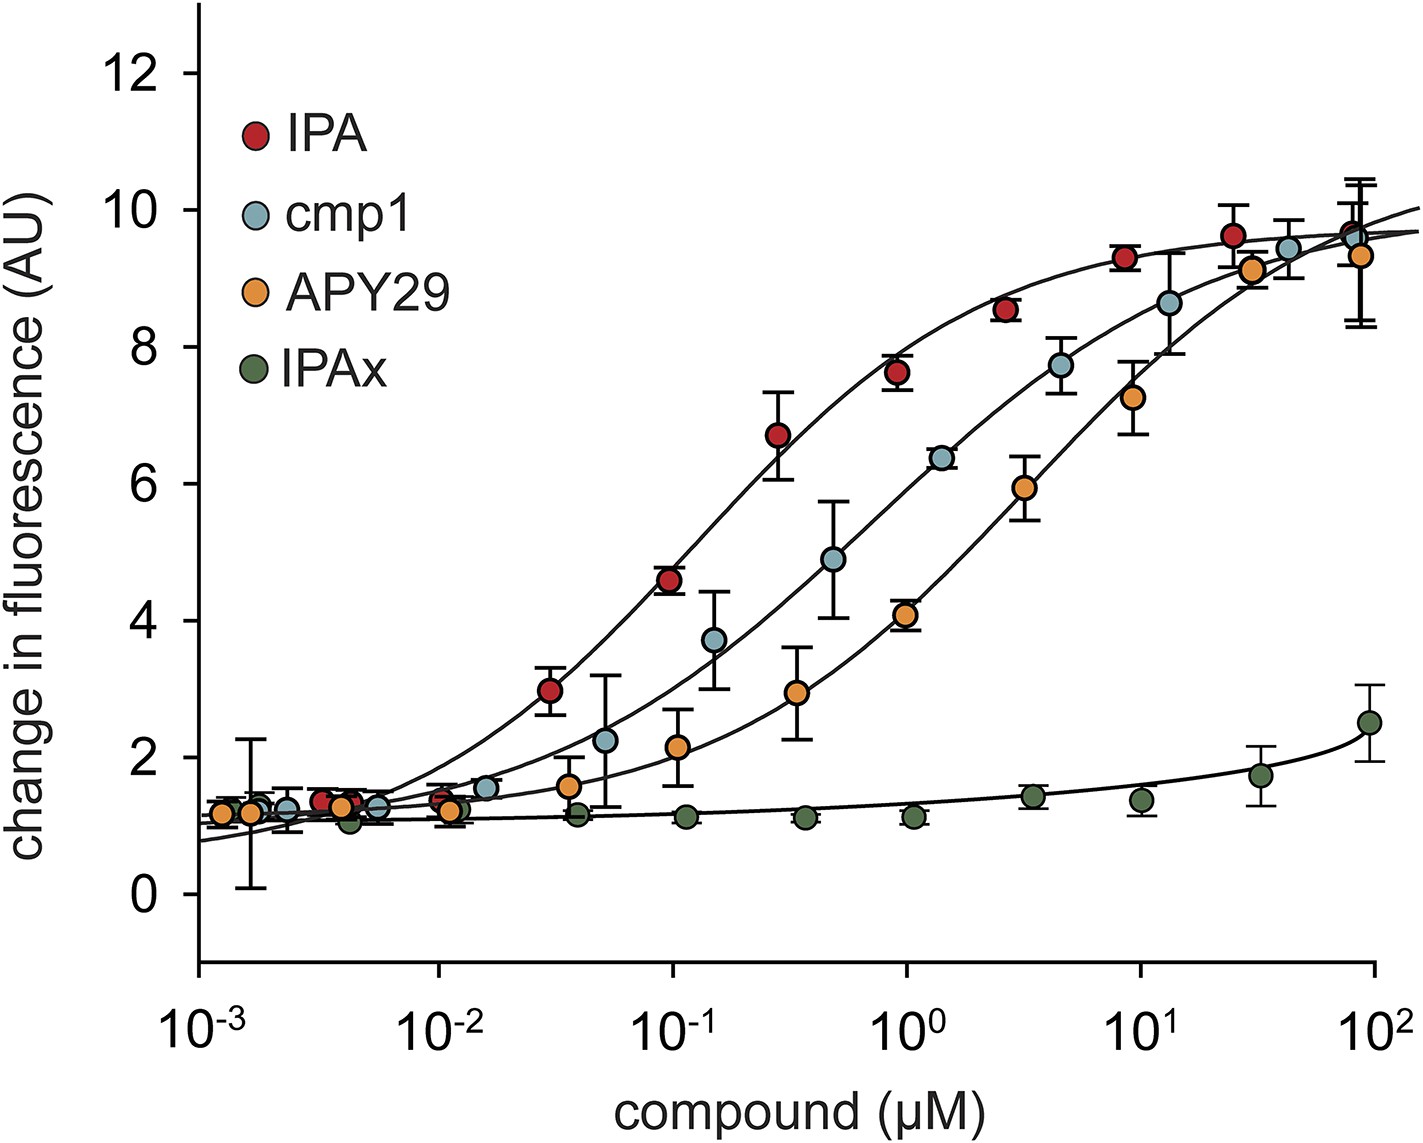
Concentration dependence of IPA, cmp1, and APY29 on IRE1α-KR43 RNase activity.
A fluorescence RNA substrate (HP17) containing a 5′ fluorescein and 3′ black hole quencher was used to determine RNase activity at a constant concentration of IRE1α ([IRE1α-KR43] = 100 nM; IPA EC50 = 0.36 μM; APY29 EC50 = 5.2 μM; cmp1 EC50 = 0.95 μM).
Figure 1—figure supplement 2
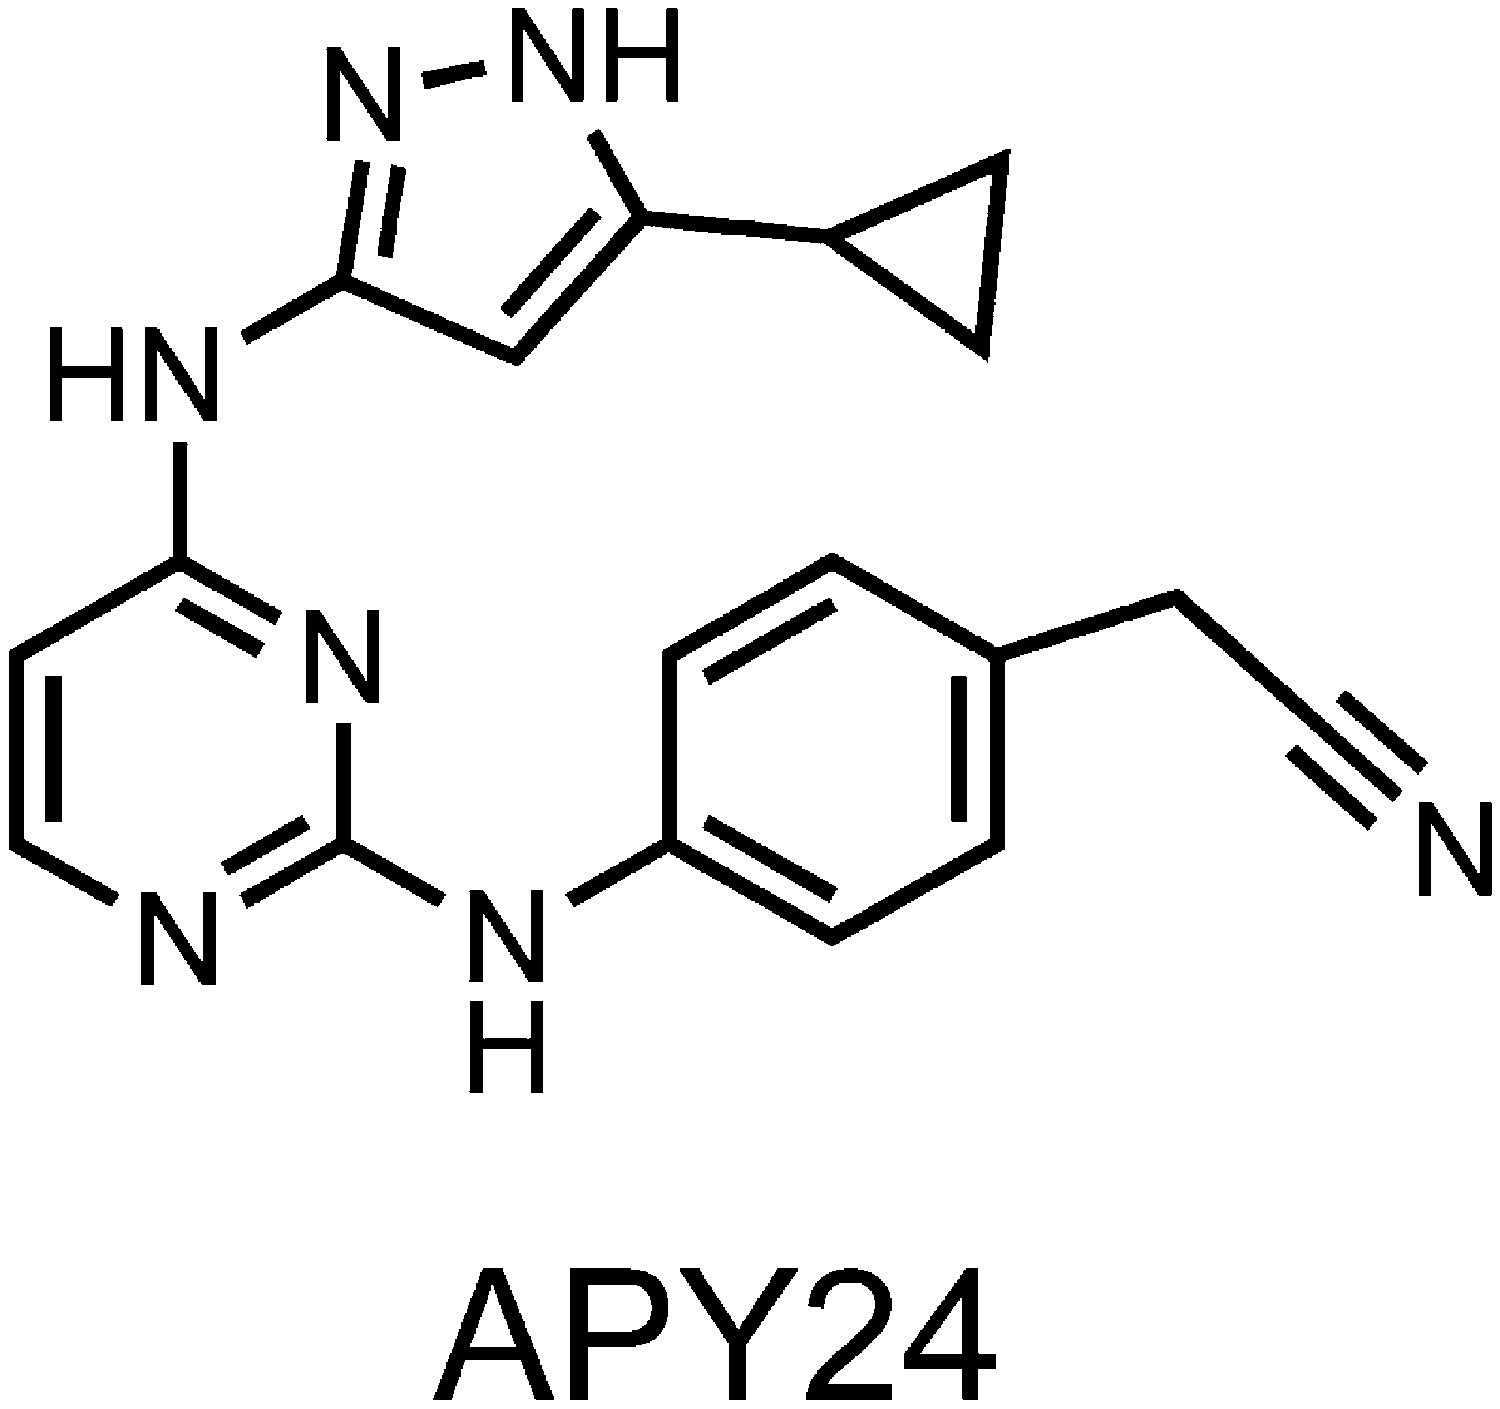
Structure of APY based compound.
The structure of APY24 contains a aminopyrozole pyrimidine core similar to APY29.
Figure 2 with 1 supplement
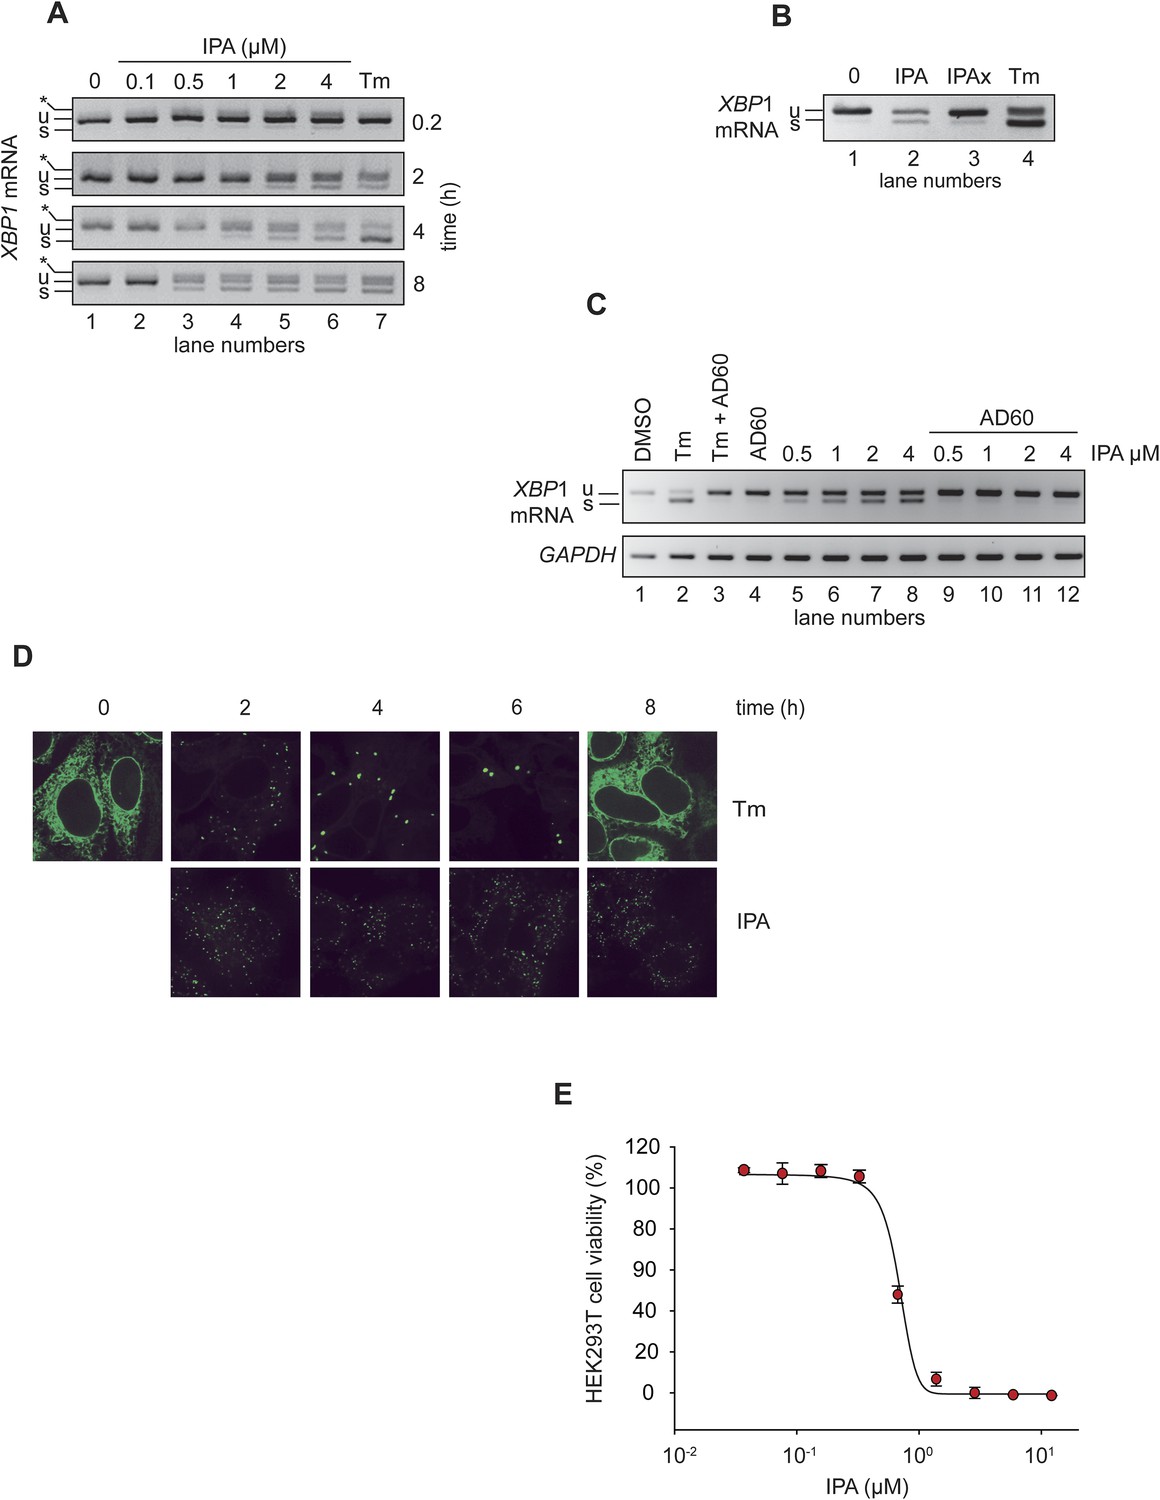
IPA activates the IRE1 branch of the unfolded protein response (UPR) in HEK293T cells.
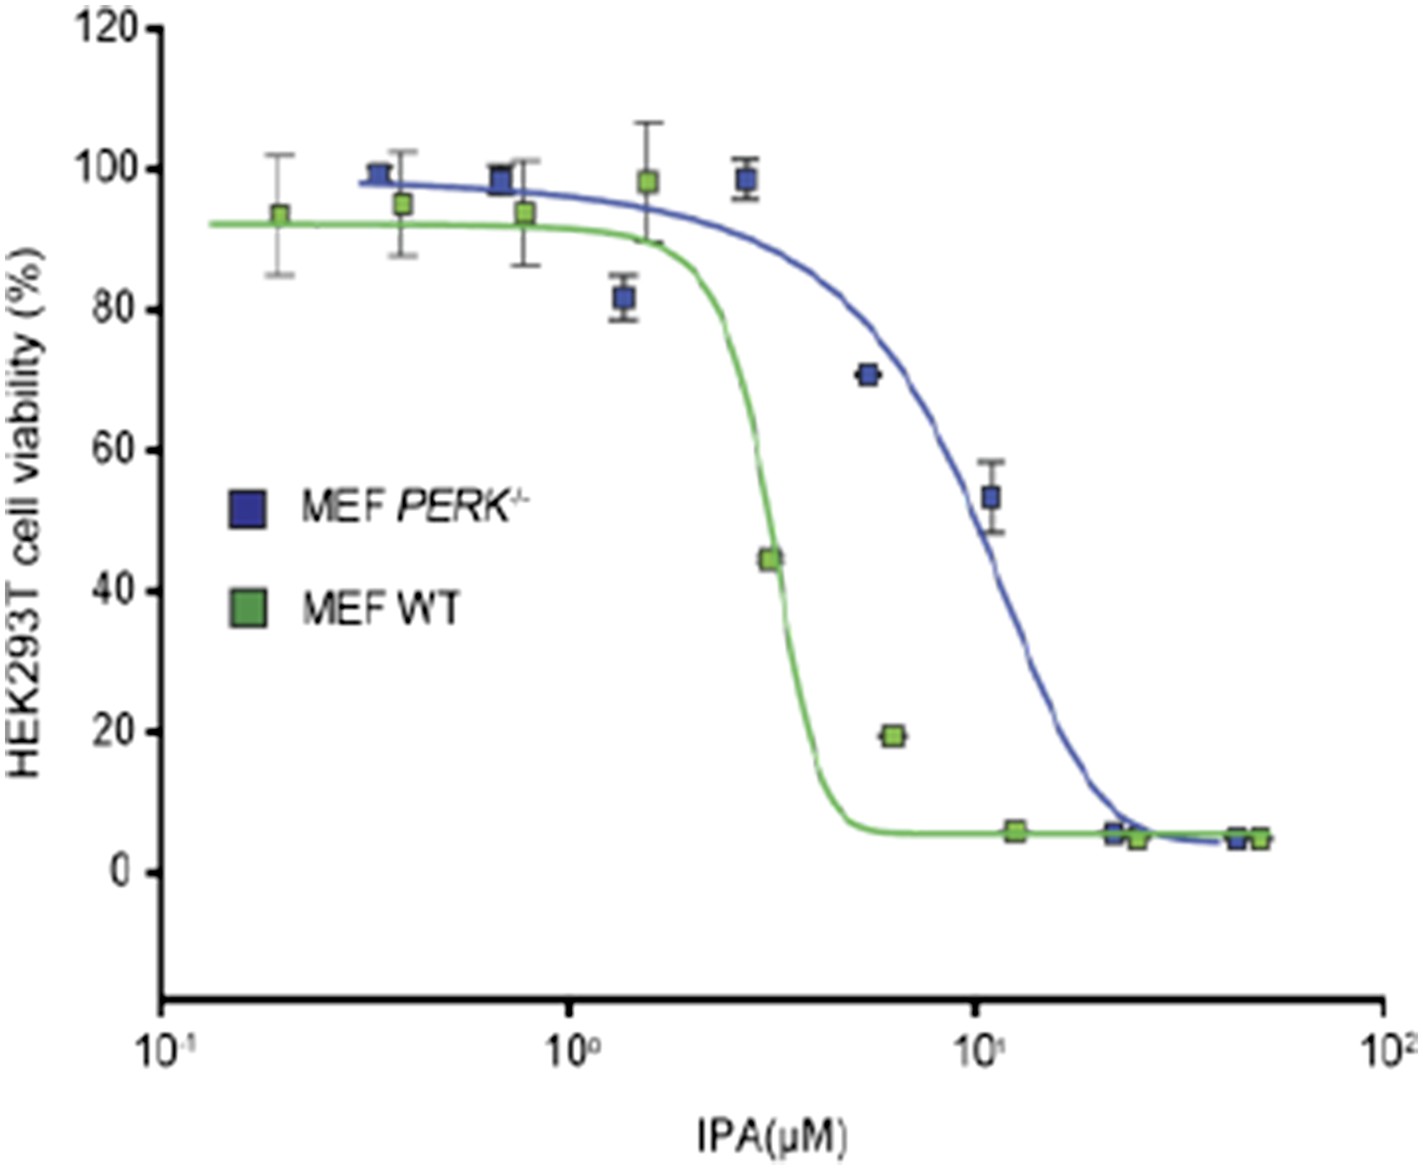
(A) HEK293T cells were treated with increasing concentrations of IPA as a function of time. Tunicamycin (Tm, 2 µg/ml) was used as positive control to induce endoplasmic reticulum stress. The resulting XBP1 mRNA spliced products detected by RT-PCR (‘u’: unspliced and ‘s’: spliced) are indicated. Control cells were treated with DMSO only. The asterisk identifies a hybrid amplicon resulting from spliced and unspliced XBP1 mRNA. (B) The effects of IPAx on the splicing of XBP1 mRNA in HEK293T cells were detected by RT-PCR after 4-hr incubation ([IPA] and [IPAx] = 2 µM). (C) Inhibition of IPA-mediated XBP1 mRNA splicing in HEK293T cells by AD60 (incubation time = 4 hr; [AD60] = 1 μM). (D) IRE1-GFP foci formation in T-REx293 cells. IRE1-GFP was visualized by confocal microscopy. (E) Effects of IPA on HEK293T cell viability (LD50 = 0.83 μM).
Figure 2—figure supplement 1
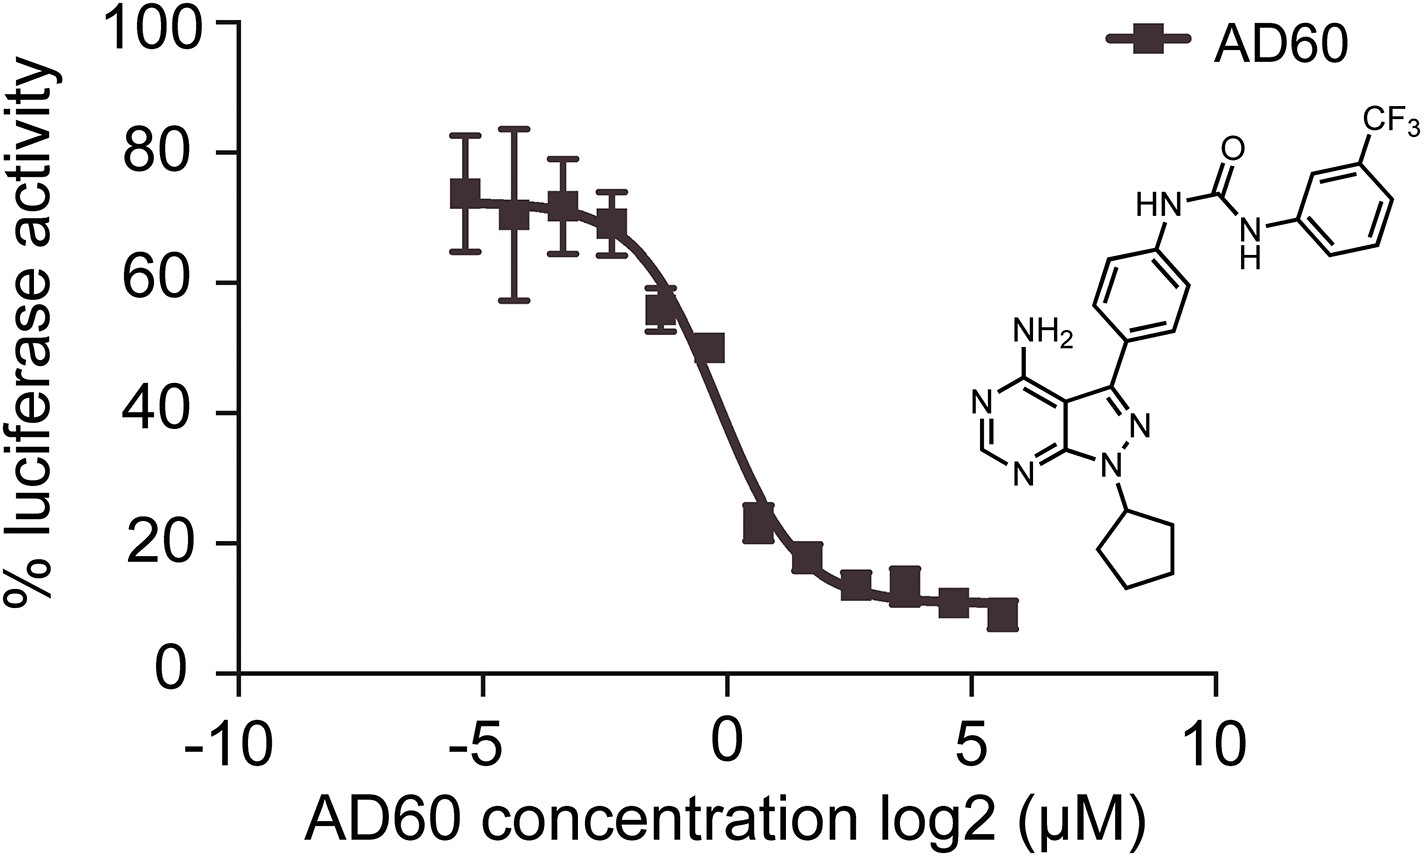
AD60 inhibition of XBP1-luciferase-splicing reporter activation in HEK293T cells.
A dose response of AD60 in the presences of Tm (2 μg/m) is shown. Luciferase activity of cells treated with AD60 was normalized to cells treated with Tm only. AD60 IC50 = 0.75 μM.
Figure 3
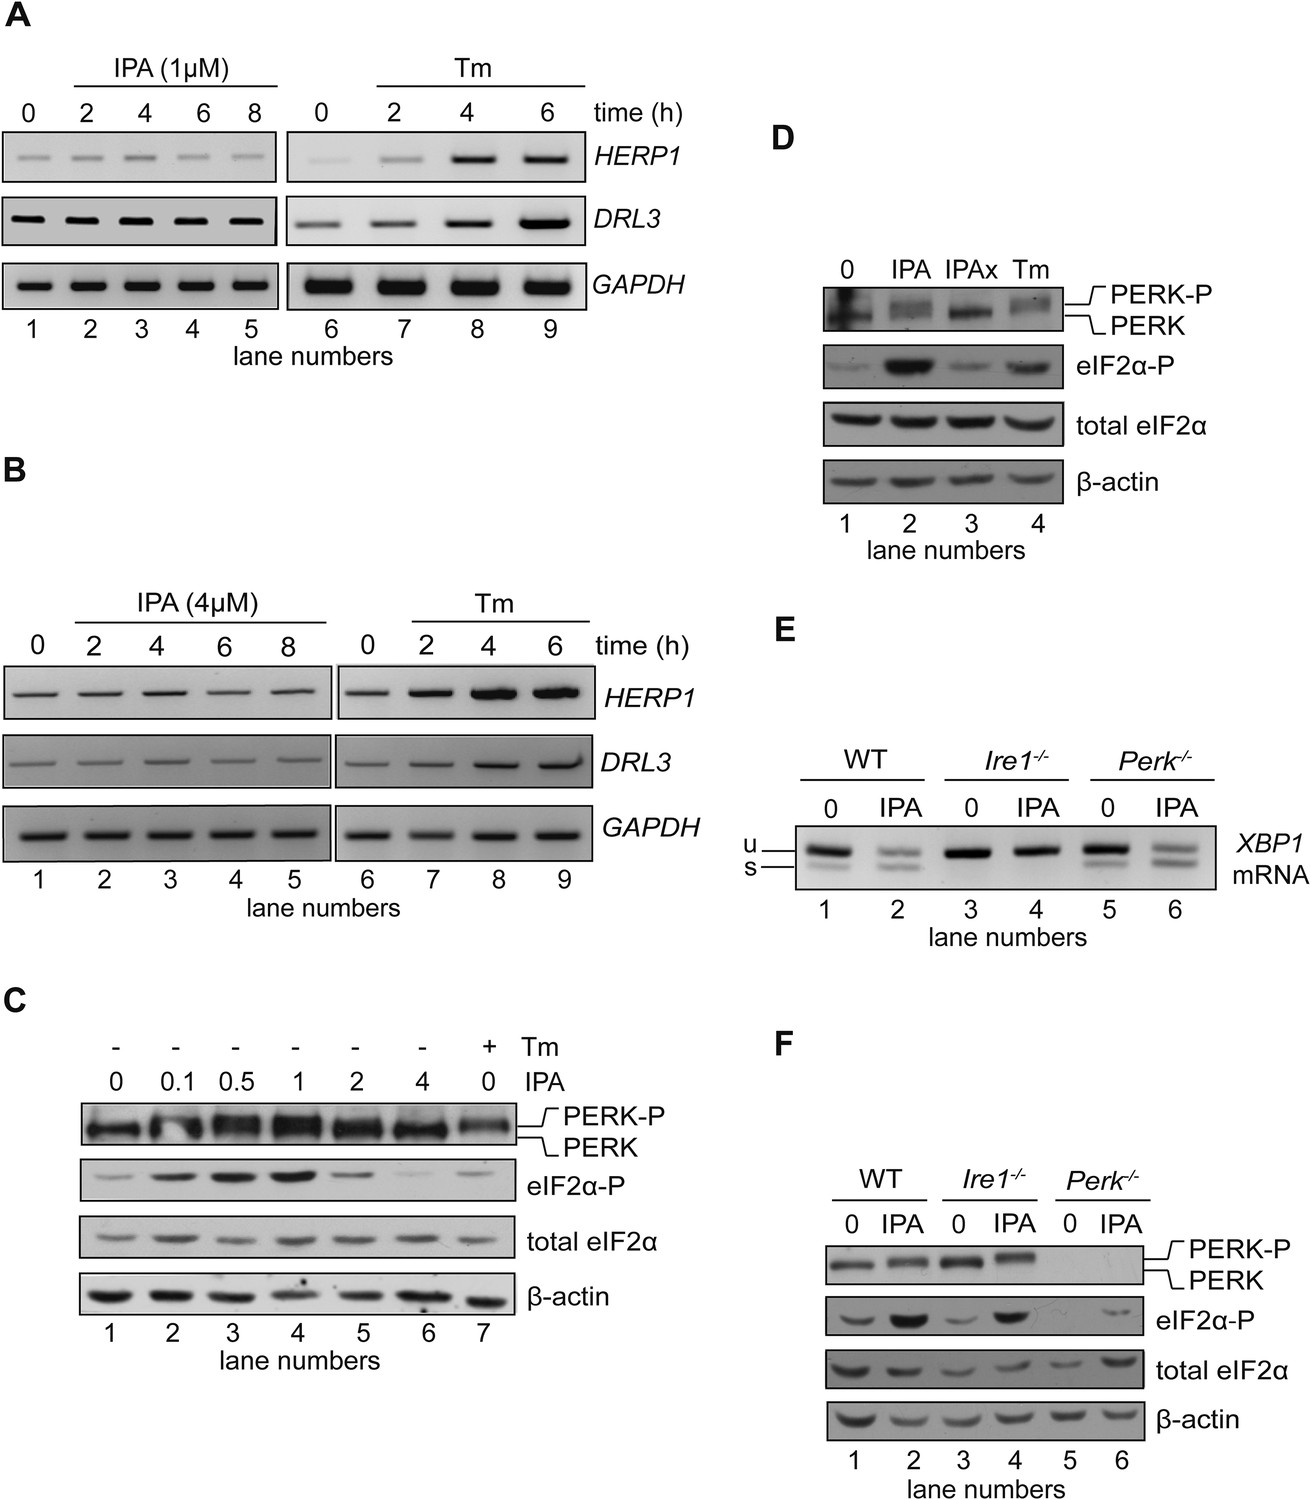
Effects of IPA on the ATF6 and PERK branches of the UPR.
(A) The levels of ATF6 transcriptional target mRNAs HERPUD1 (HERP1) and DERLIN3 (DERL3) were measured by RT-PCR in HEK293T cells treated with 1 μM IPA. GAPDH was used as a loading control. (B) Same as in (A) but cells were treated with 4 μM IPA. (C) Phosphorylation of PERK and eIF2α in HEK293T cells treated with IPA were detected by immunoblotting (incubation time = 4 hr); PERK phosphorylation is apparent from its shift in gel mobility; eIF2α phosphorylation was detected using a phospho-specific antibody. β-actin was used as a loading control. (D) HEK293T cells were treated for 4 hr with IPA (1 µM), IPAx (1 µM), or Tm (2 µg/ml). PERK shift and eIF2α phosphorylation were detected as in C. (E) Wild-type (WT), Ire1−/−, and Perk−/− mouse embryonic fibroblast (MEFs) cells were treated with IPA (1 µM) or Tm (5 µg/ml) for 4 hr. Induction of XBP1 mRNA splicing by IPA was measured by RT-PCR. (F) Cells were treated as above. PERK gel mobility shift and eIF2α phosphorylation were detected by immunoblotting.
Figure 4 with 1 supplement
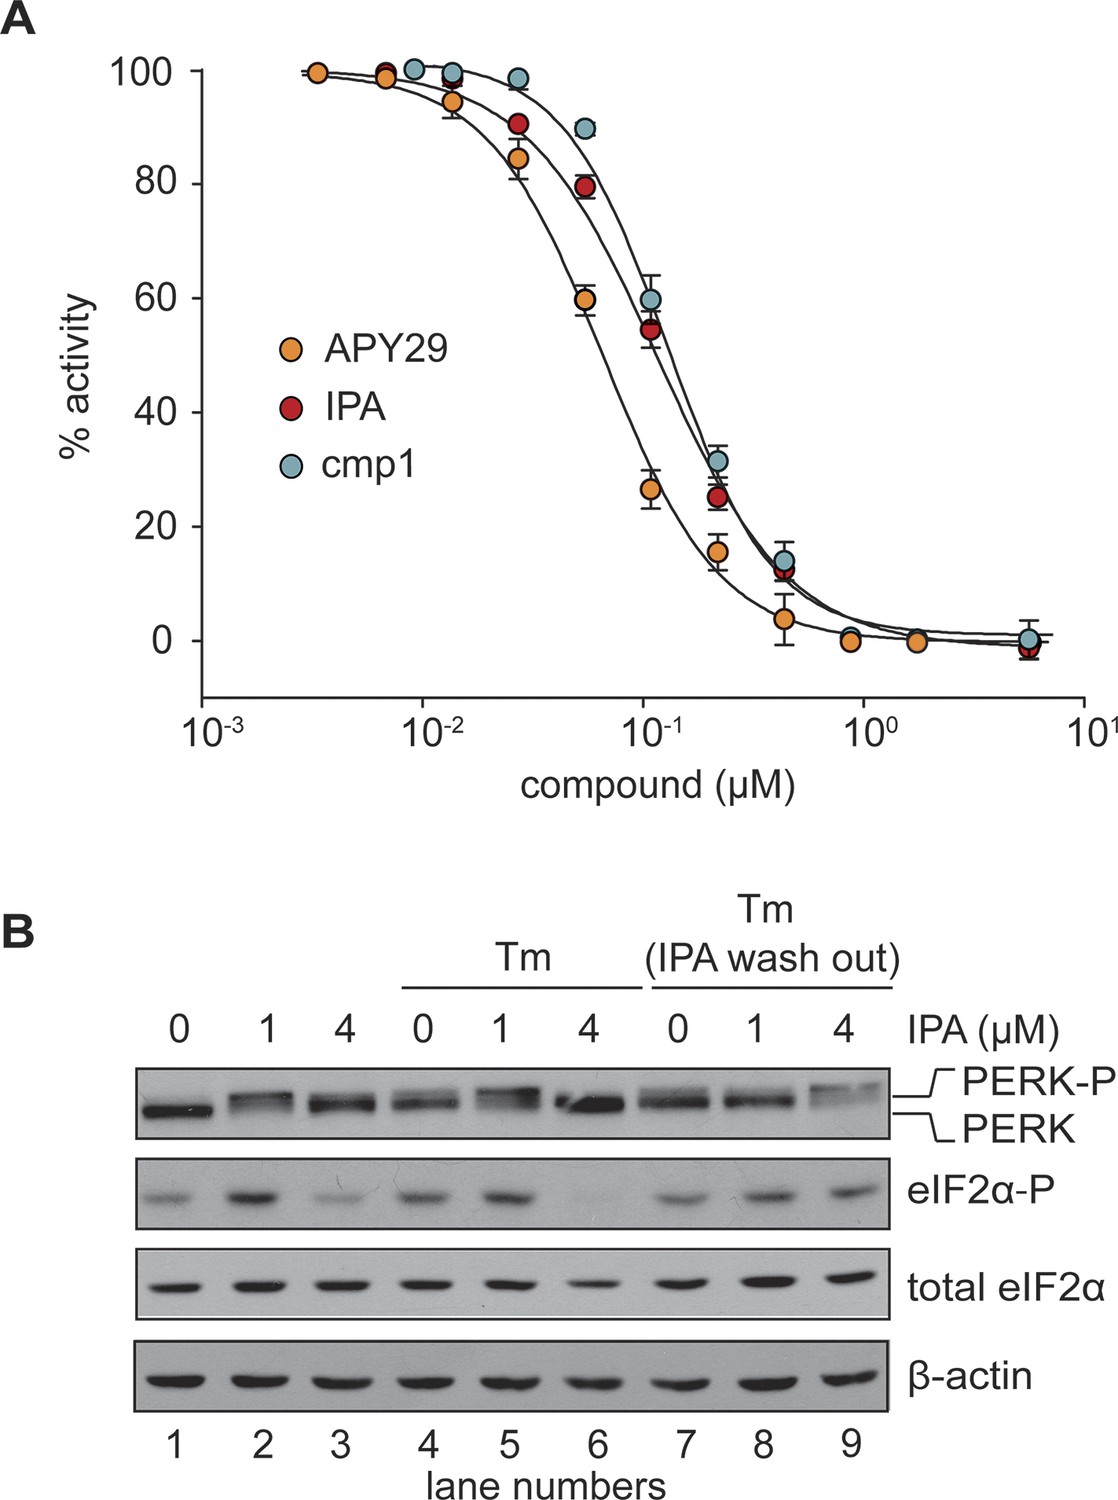
In vitro effects of IPA on GST-PERK kinase activity.
(A) The effects of IPA, cmp1, and APY29 on GST-PERK kinase activity were monitored measuring phosphorylation of purified S. cerevisiae eIF2α with γ-[32P]-labeled ATP (IPA IC5o = 2.8 μM; cmp1 IC5o = 4.5 μM, APY29 IC5o = 0.69 μM). (B) HEK293T cells were pre-treated with IPA for 30 min. Cells were then either co-incubated with IPA and Tm (2 µg/ml) for an additional 4 hr (lanes 4, 5, and 6) or washed (IPA wash-out) and treated with Tm alone (lanes 7, 8, and 9).
Figure 4—figure supplement 1
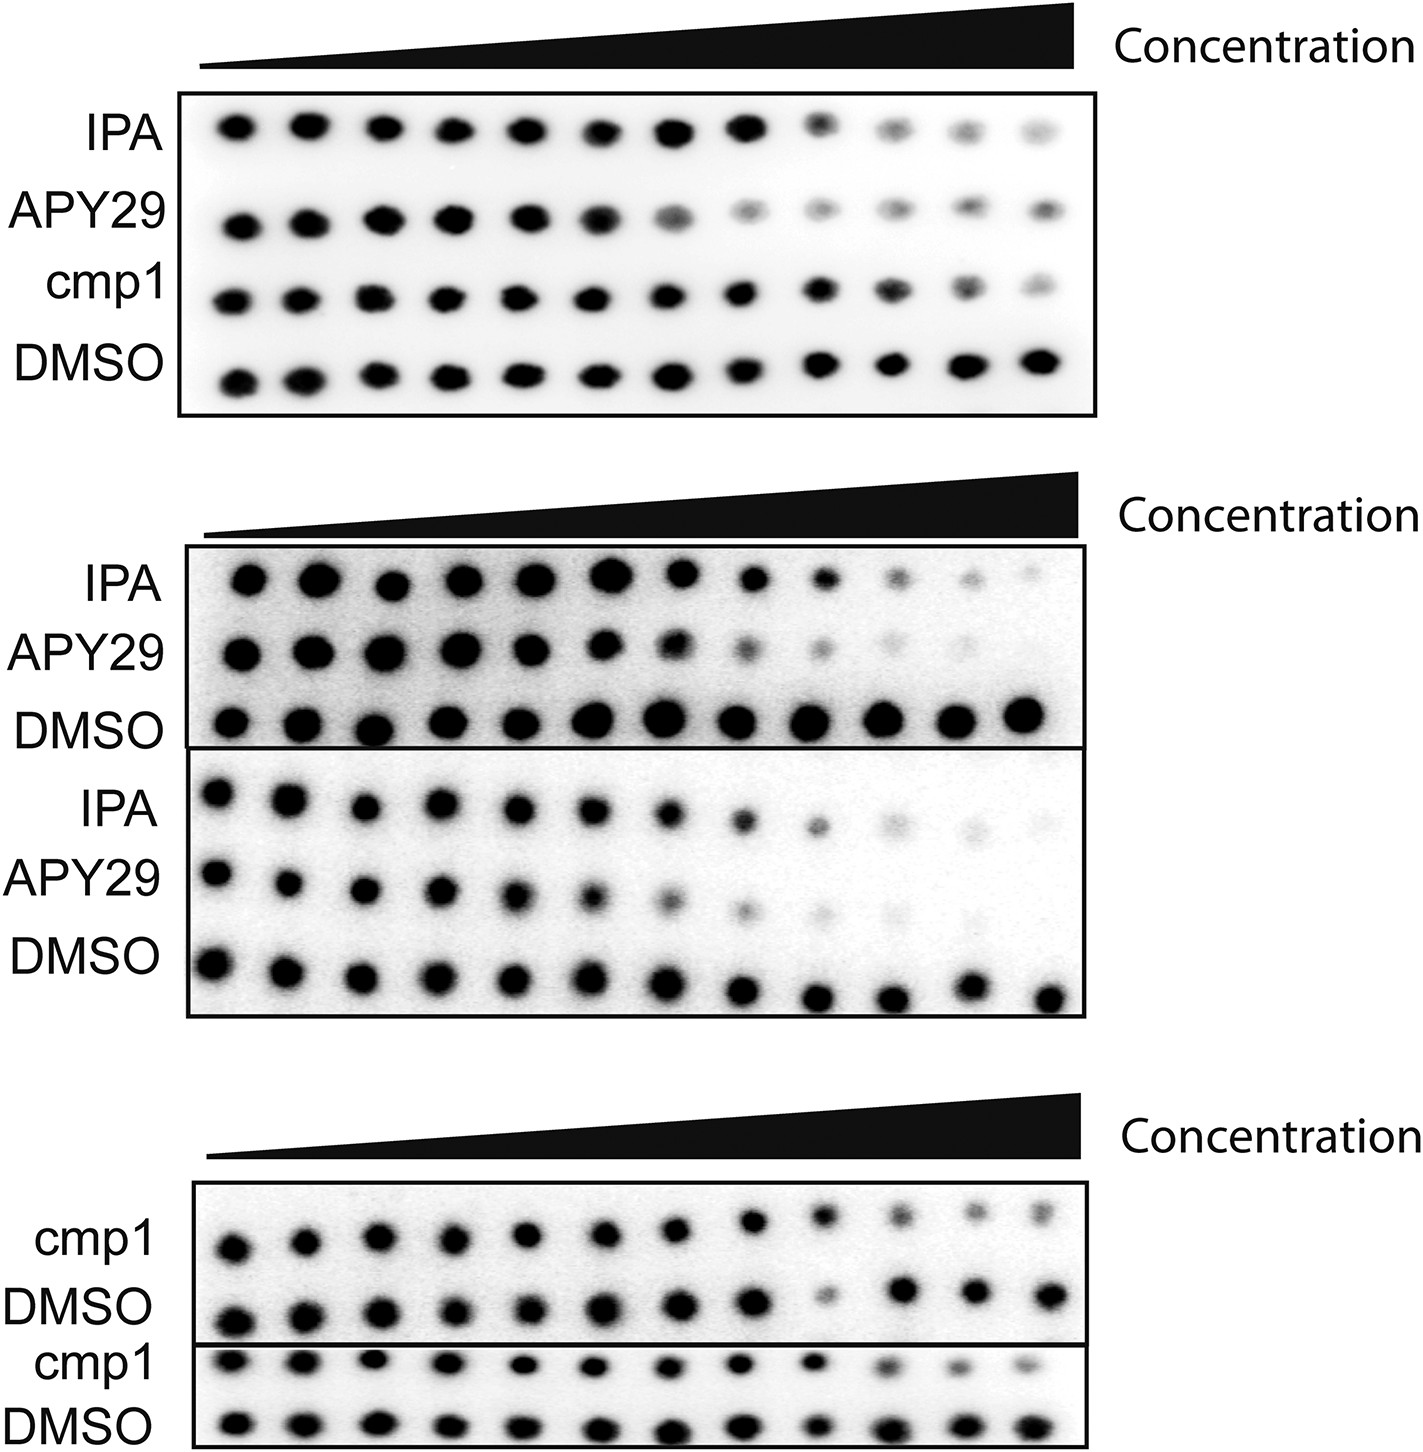
Audioradiographs of IPA, Cmp1 and APY29 tested against PERK-GST fusion protein.
Dose responses were based on a 12-point inhibitor titration, using a twofold dilution series starting from 30 μM to determine the IC50 values of PERK inhibition.
Figure 5 with 4 supplements
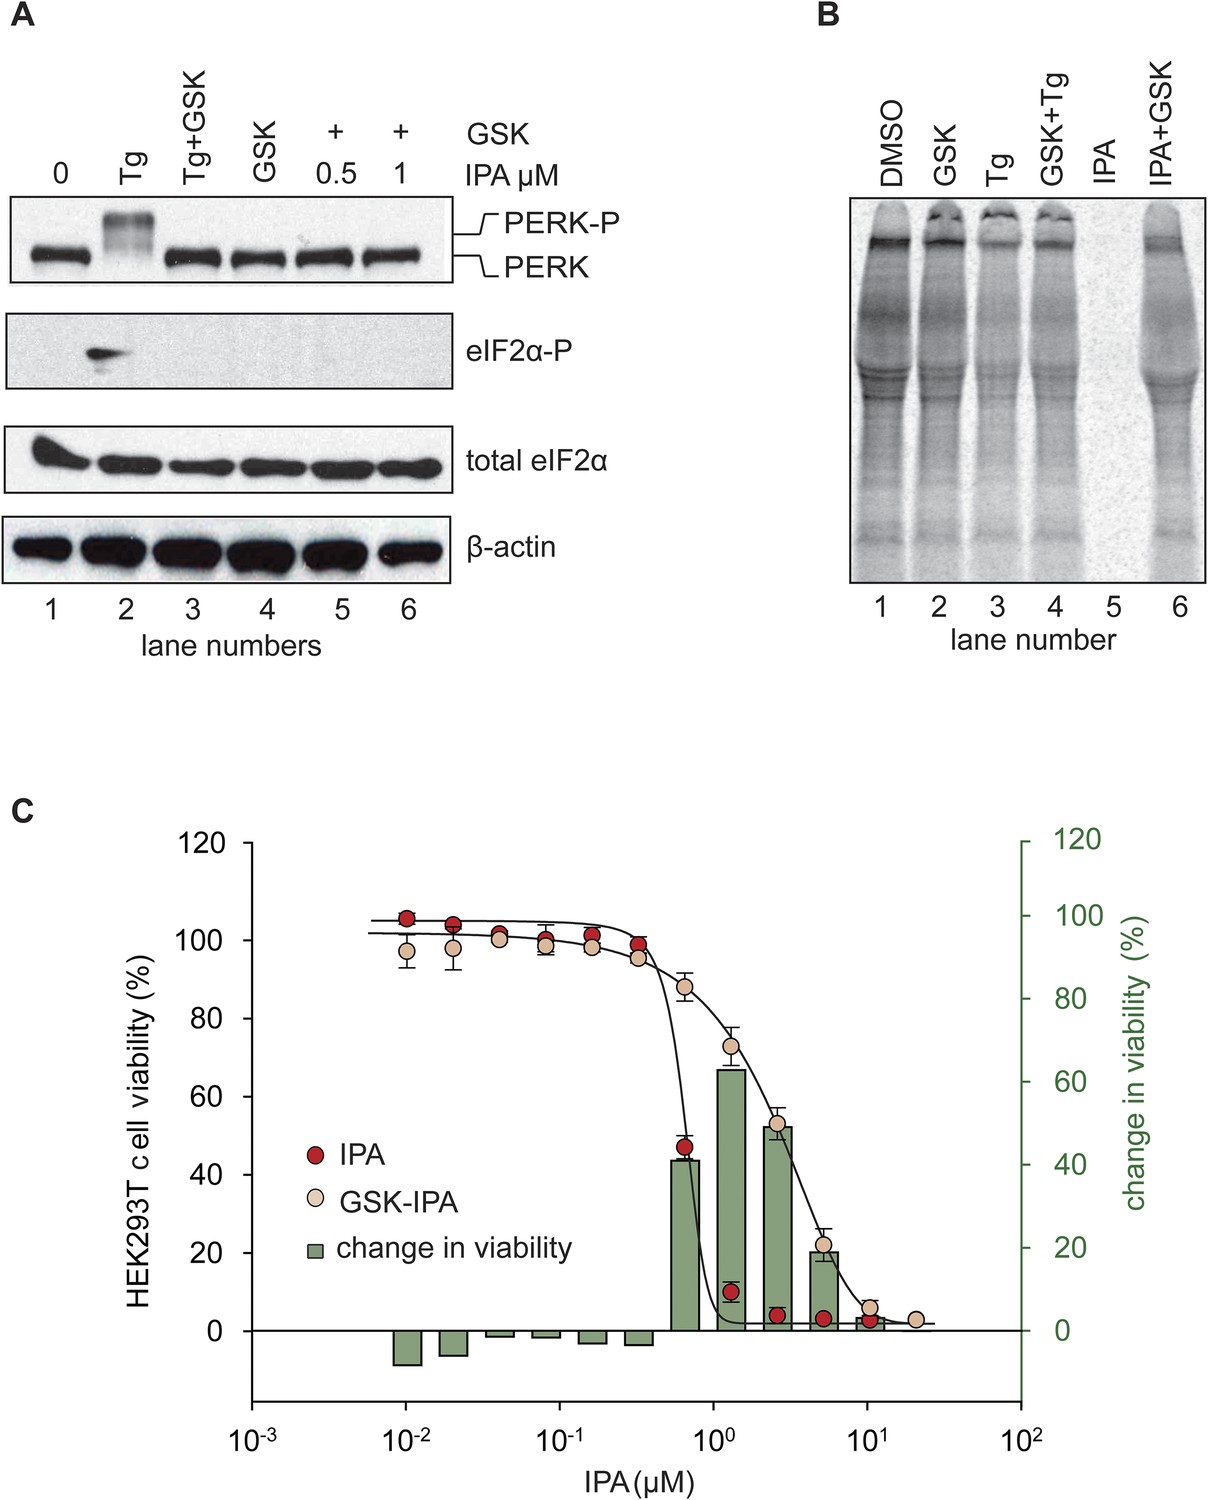
Inhibition of IPA-mediated PERK activation by GSK2606414.
(A) Reversal of IPA-mediated PERK activation ([IPA] = 0.5 and 1 μM; lanes 5 and 6; note peak in Figure 3C at these concentrations) in combination with GSK2606414 (GSK, 1 μM) was observed using immunoblotting as described in (Figure 3C). As a control, GSK (1 μM) was used to also inhibit PERK branch activation by thapsigargin (Tg; 100 nM; lane 3). (B) HEK293T cells were incubated with [35S] methionine to monitor protein translation upon addition of IPA (1 μM) or a combination of IPA (1 μM) and GSK (1 μM). The UPR was induced with Tg (100 nM) or DMSO as indicated. (C) Cotreatment of HEK293T cells with IPA + GSK. HEK293T cell viability was measured as a dose-response of IPA in combination with 1 μM of GSK (pink circles). The presence of 1 μM GSK shifted the IPA LD50 from 0.82 μM to 6.21 μM. The change in cell viability ± GSK inhibitor is overlaid on both dose responses (green bars). Cells were treated with compounds for 24 hr and cell viability was normalized to DMSO controls.
Figure 5—figure supplement 1

Quantification of [35S] incorporation.
Quantification of [35S] incorporation was performed a total of 3-time, and mean errors were derived.
Figure 5—figure supplement 2
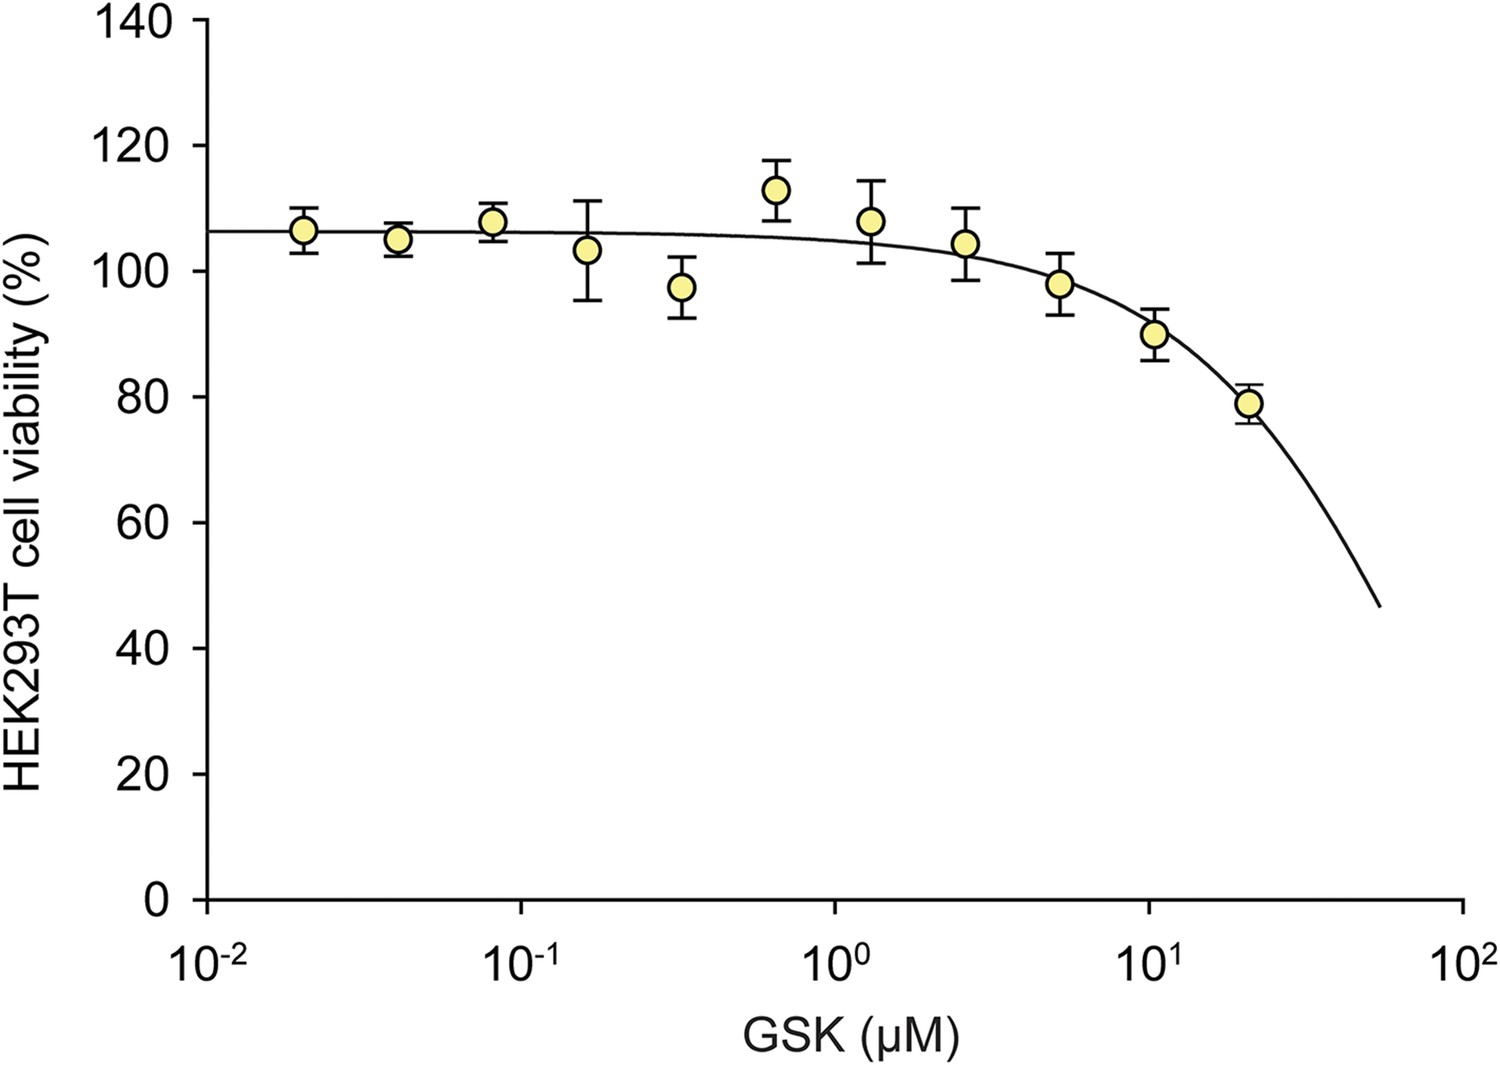
The effects of GSK on HEK293T cell viability.
A dose response of GSK was administered in HEK293T cells for 24 hr. No effect on viability was observed at 1 μM.
Figure 5—figure supplement 3
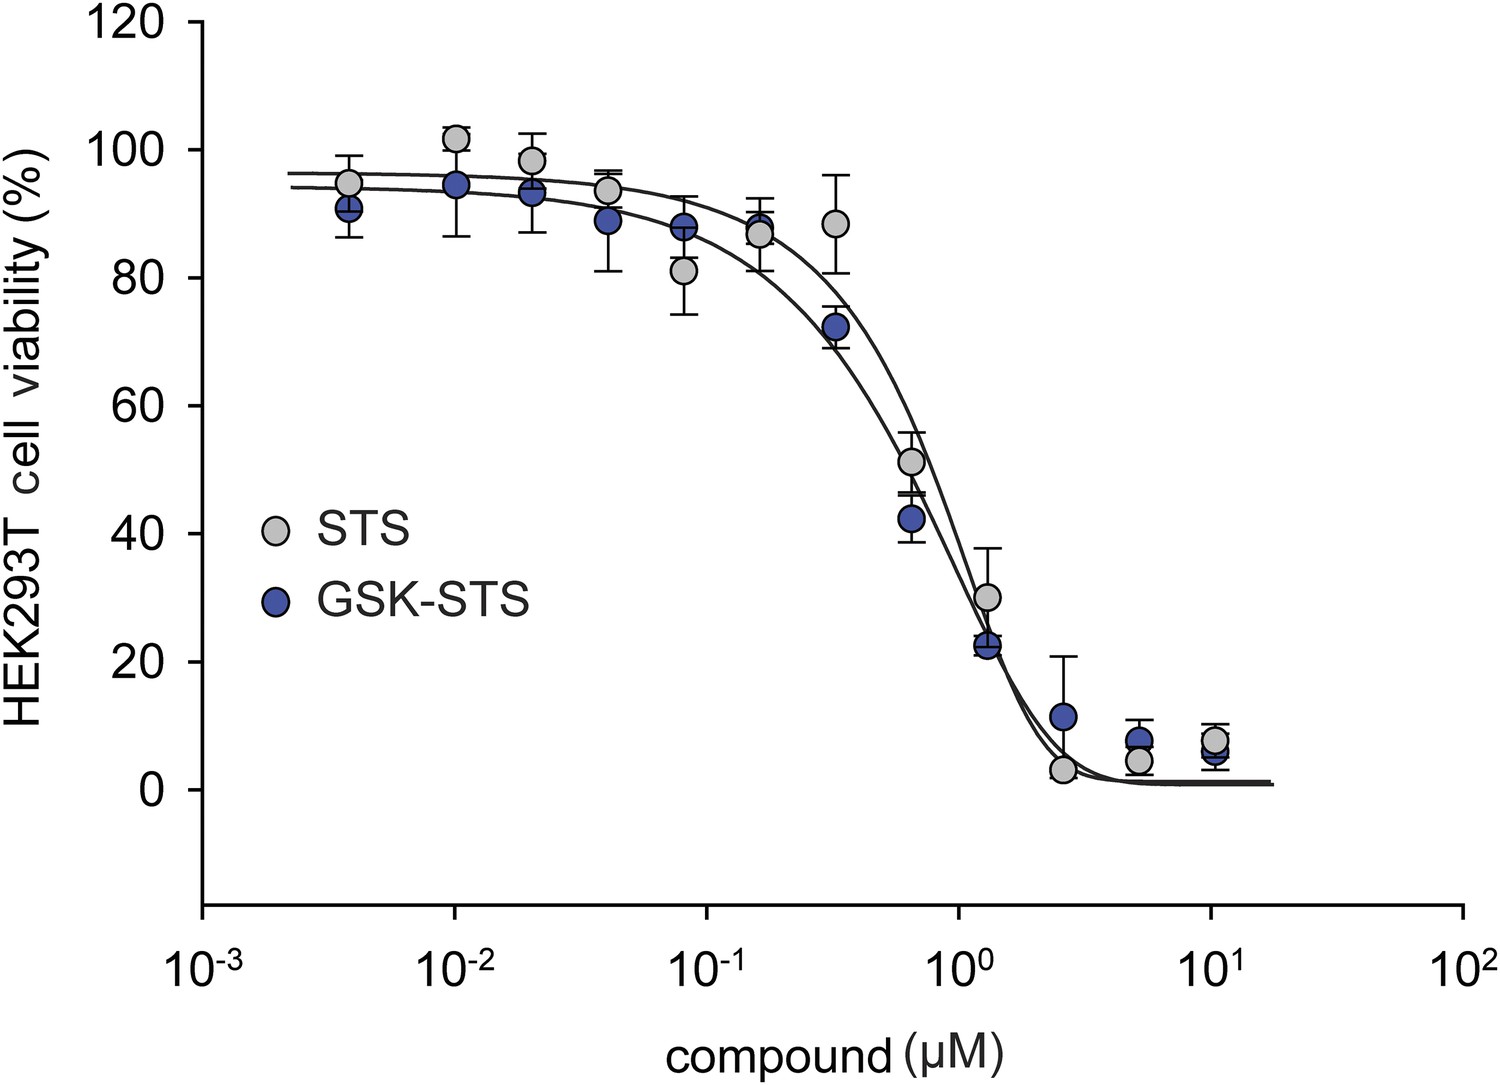
The effect of staurosporine (STS) on HEK293T cell viability in the presence of GSK PERK inhibitor.
A dose response of STS in the presence of 1 μM GSK PERK inhibitor. No change in cell viability was observed in the presence of GSK when STS was present.
Figure 5—figure supplement 4
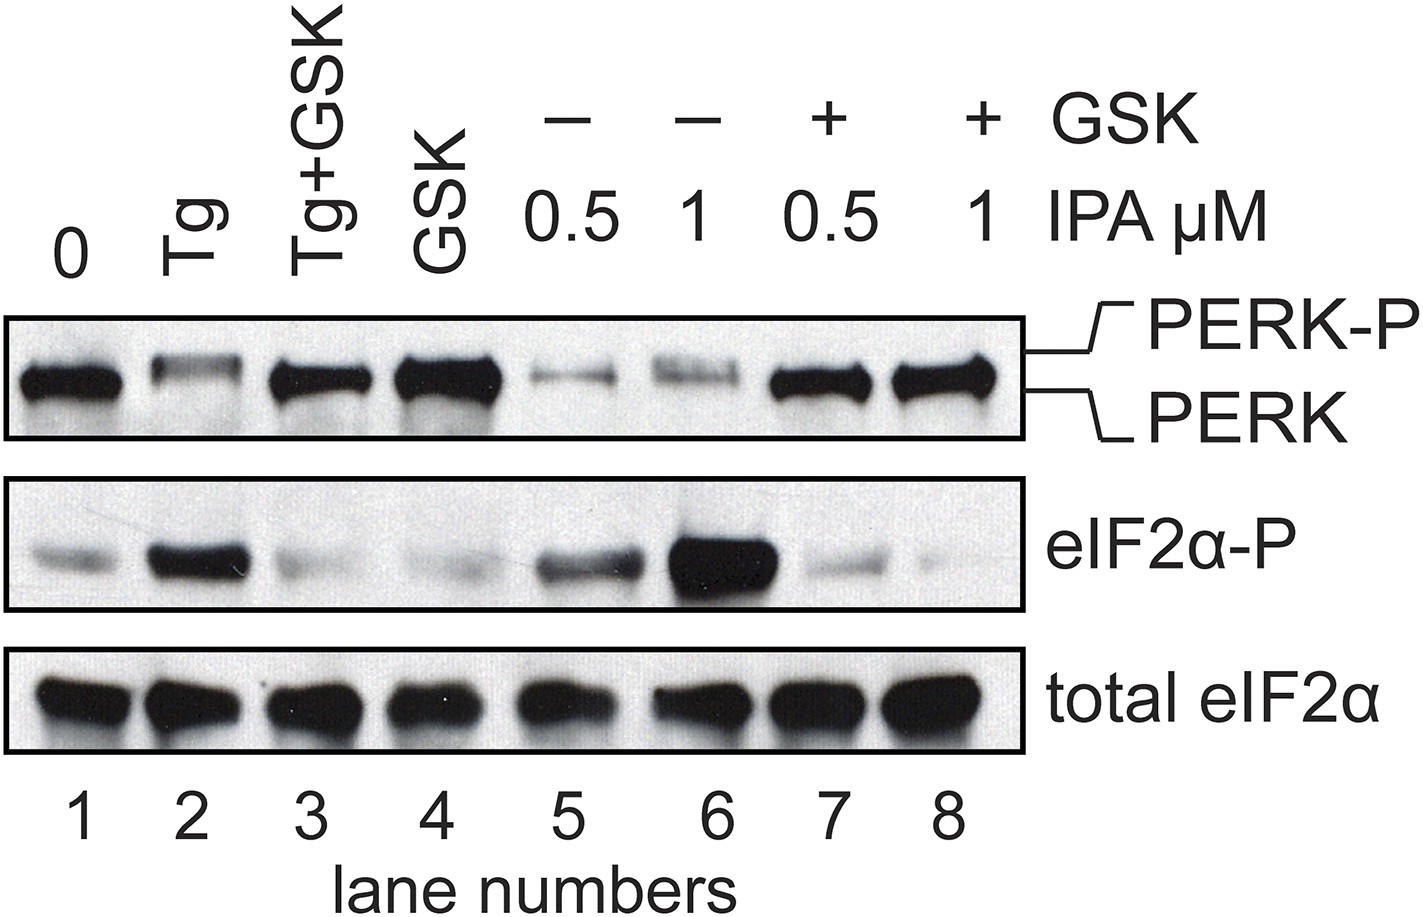
Inhibition of IPA-mediated PERK activation using GSK2606414.
Reversal of IPA-mediated PERK activation ([IPA] = 0.5 and 1 μM; lanes 7 and 8; note lanes 5 and 6 which show robust activation of the PERK pathway) in combination with GSK2606414 (GSK, 1 μM) was observed using immunoblotting as described in (Figure 3C). As a control, GSK (1 μM) was used to also inhibit PERK branch activation by thapsigargin (Tg; 100 nM; lane 3). No effect on the pathway was observed with GSK alone (lane 4).
Figure 6 with 2 supplements
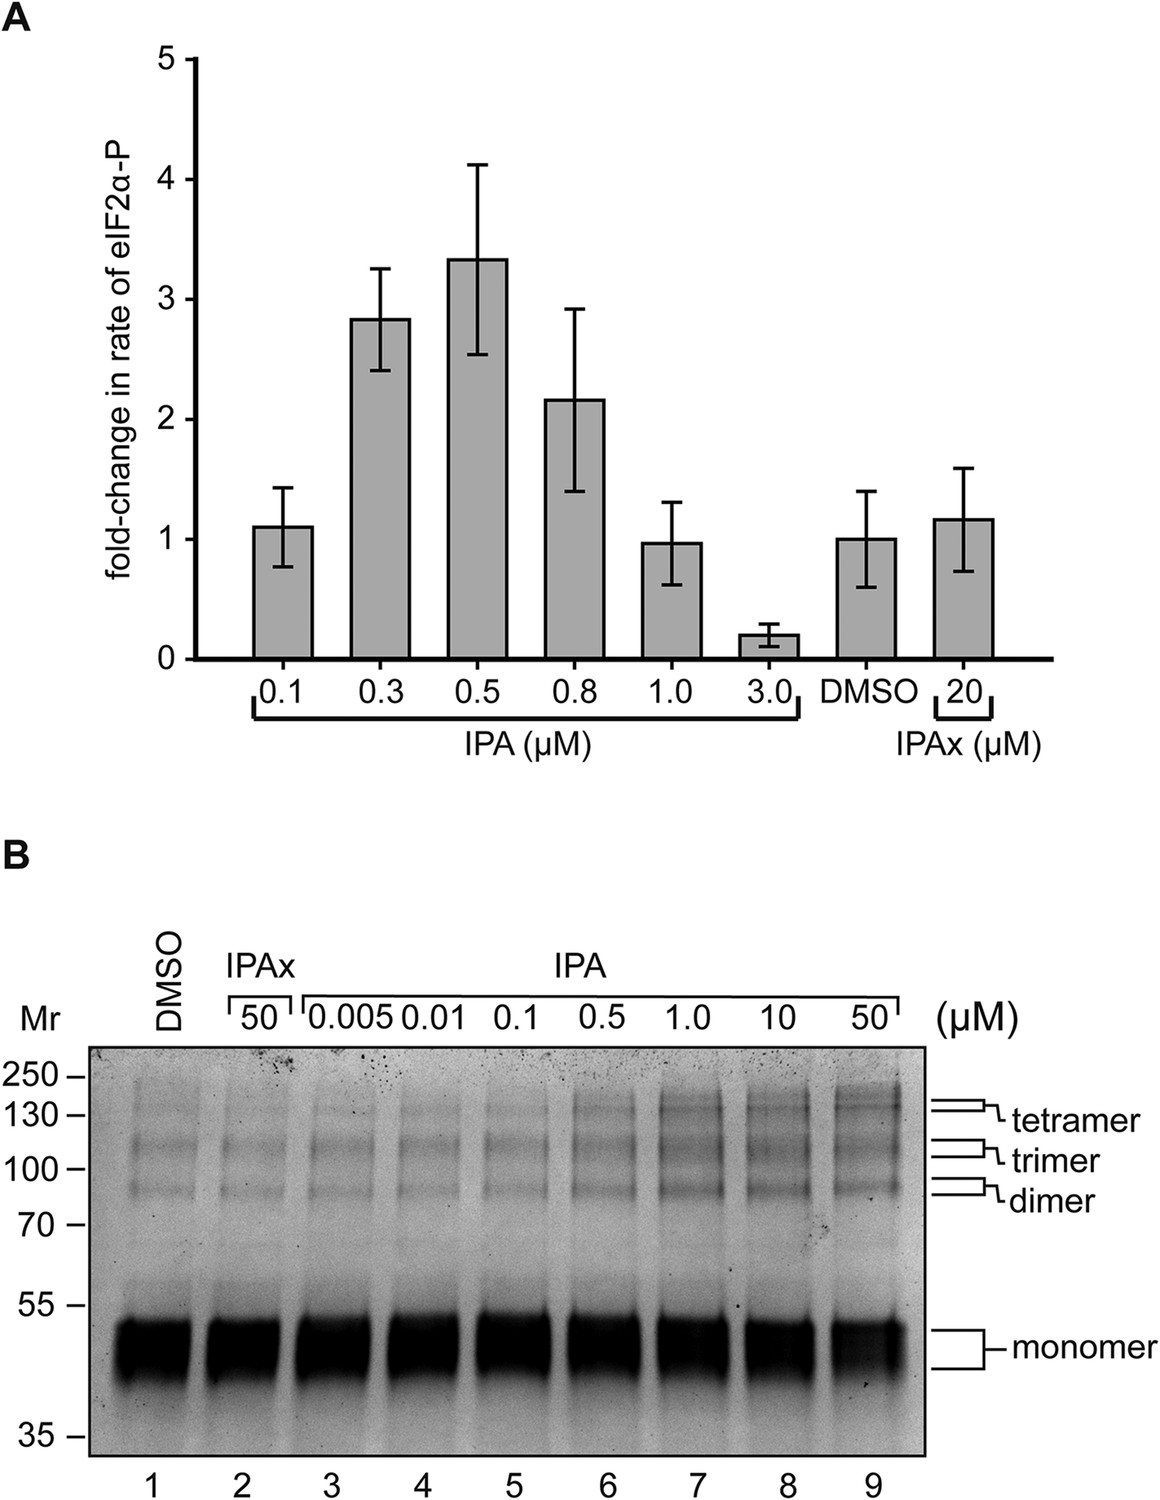
Reconstitution of activation of cytosolic PERK protein in vitro.
(A) Recombinant PERK cytoplasmic domain was incubated at a set concentration of IPA. The fold-change in the rate of eIF2α was normalized to the DMSO control and plotted for all concentration. The greatest effects were observed at 500 nM (3.3-fold change) and 3 μM (0.31-fold change) in activity. IPAx showed no effect on the rate of PERK activity at a concentration of 20 μM. (B) Recombinant PERK cytoplasmic domain (2 μM) was preincubated with varying concentrations of IPA (or IPAx) and subjected to chemical cross-linking. An IPA-dependent increase in the dimer, trimer, and tetramer complexes was observed, whereas IPAx (50 μM) showed no effect when compared to the DMSO control.
Figure 6—figure supplement 1
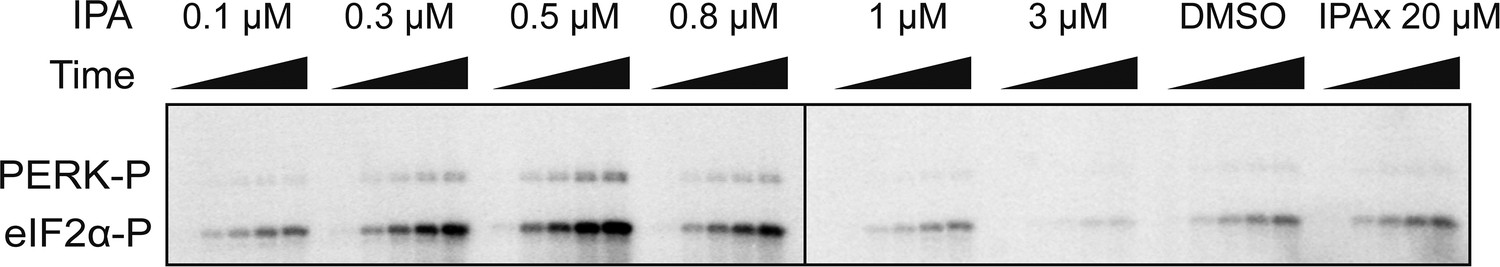
Biochemical reconstitution of PERK activation.
SDS-polyacrylamide gel showing a dose response of IPA. eIF2α phosphorylation was used as a read out of activity. A dramatic activation and inhibition profile is observed. At maximal activity IPA elicits a 3.3-fold change in activation and 0.31-fold change at inhibitory concentrations.
Figure 6—figure supplement 2

The effect of IPAx on PERK activation in vitro.
To test effect of IPAx on PERK activation two concentrations (0.3 and 0.5 μM) were tested in vitro. The SDS-polyacrylamide gel shows the effect of IPAx on PERK activation at 0.3 and 0.5 μM. No activation was observed when normalized to the DMSO control.
Figure 7

Proposed model for PERK activation.
The mechanism of PERK activation suggests that at low concentrations of IPA PERK protein is hyper activated presumably through movements of the (DFG/αC-in). At higher doses of IPA all active sites are filled blocking PERK's activity.
Figure 8
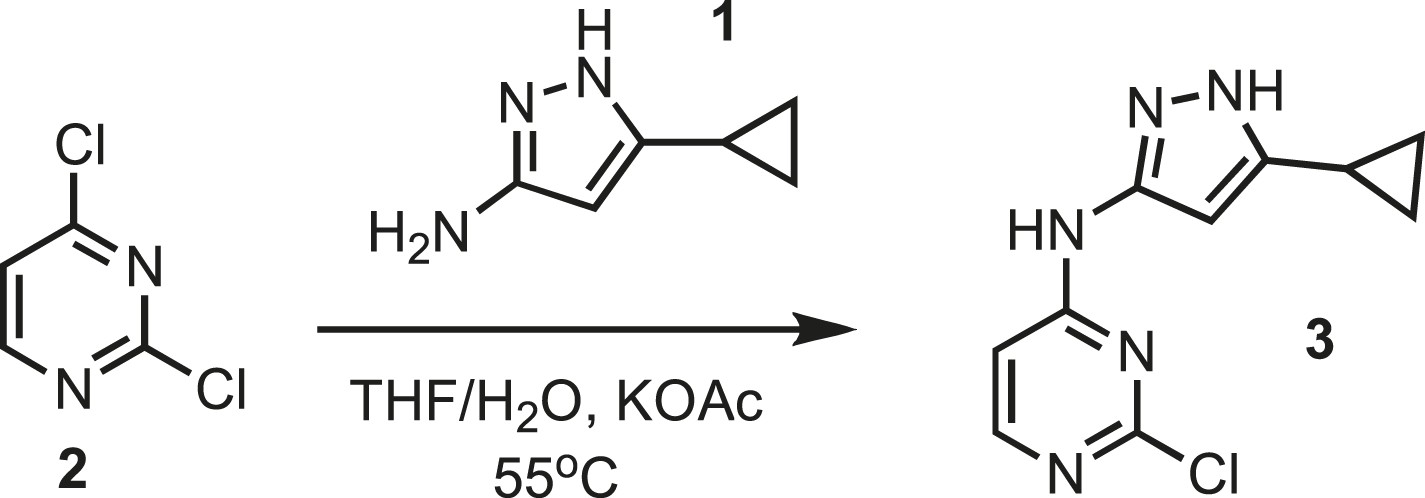
Synthesis of intermediate 3.
https://doi.org/10.7554/eLife.05434.024
Figure 9
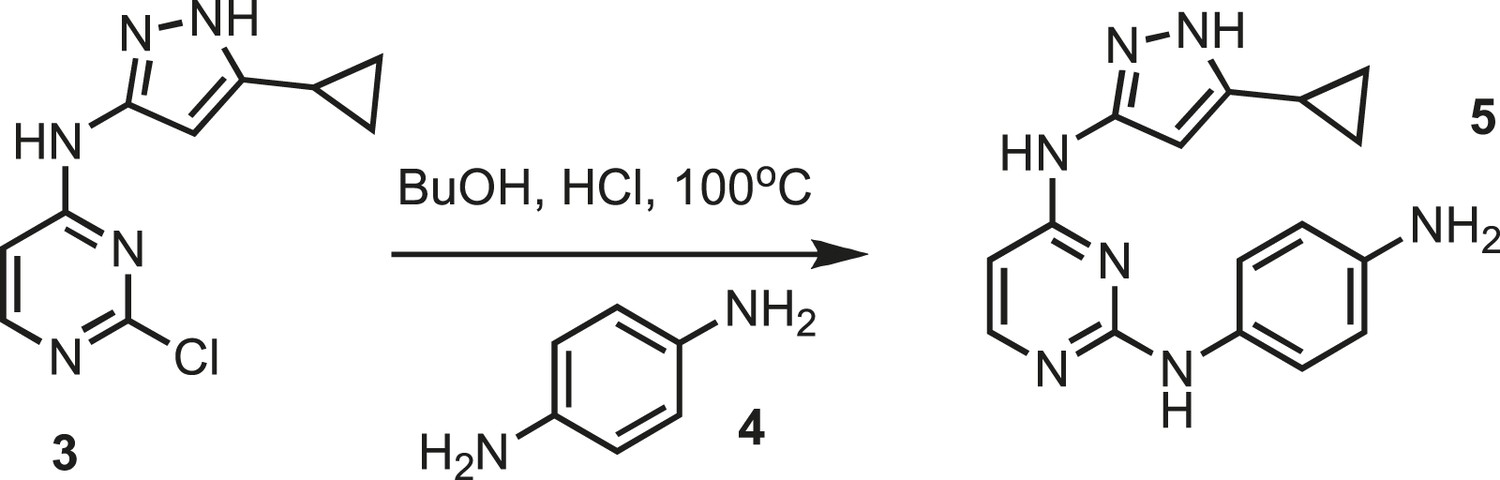
Synthesis of intermediate 5.
https://doi.org/10.7554/eLife.05434.025
Figure 10
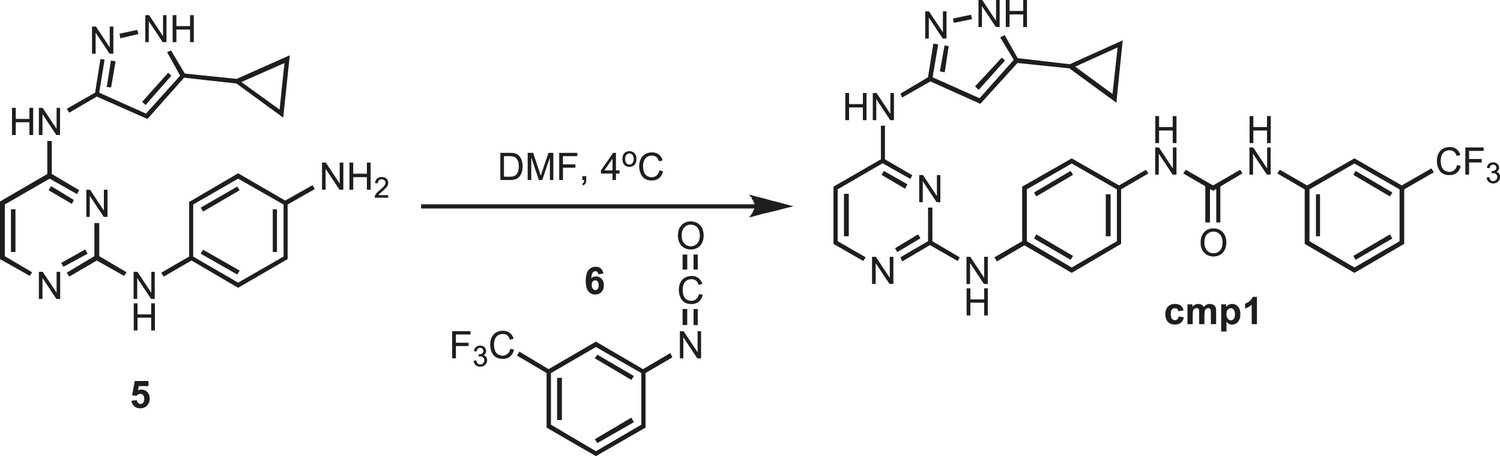
Synthesis of cmp1.
https://doi.org/10.7554/eLife.05434.026
Figure 11

Synthesis of cmp2.
https://doi.org/10.7554/eLife.05434.027
Figure 12
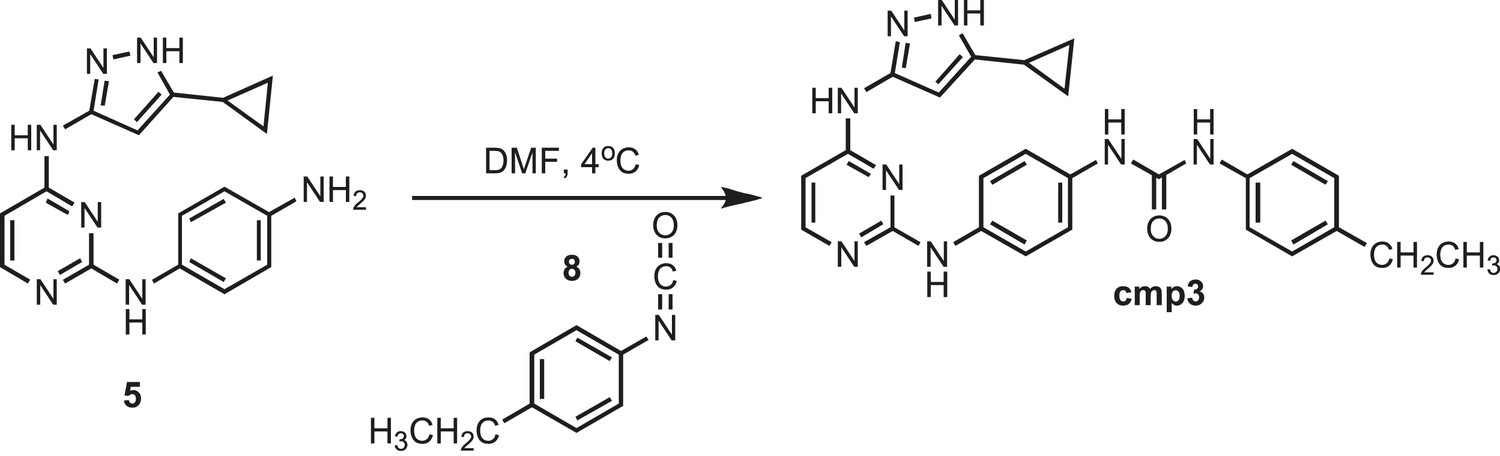
Synthesis of cmp3.
https://doi.org/10.7554/eLife.05434.028
Figure 13
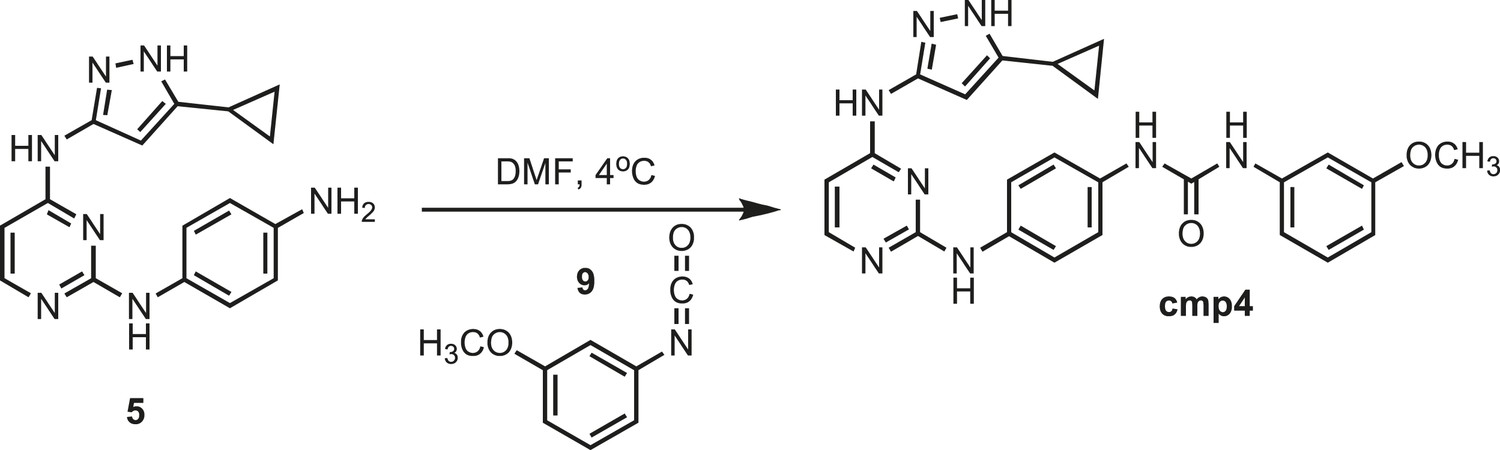
Synthesis of cmp4.
https://doi.org/10.7554/eLife.05434.029
Figure 14
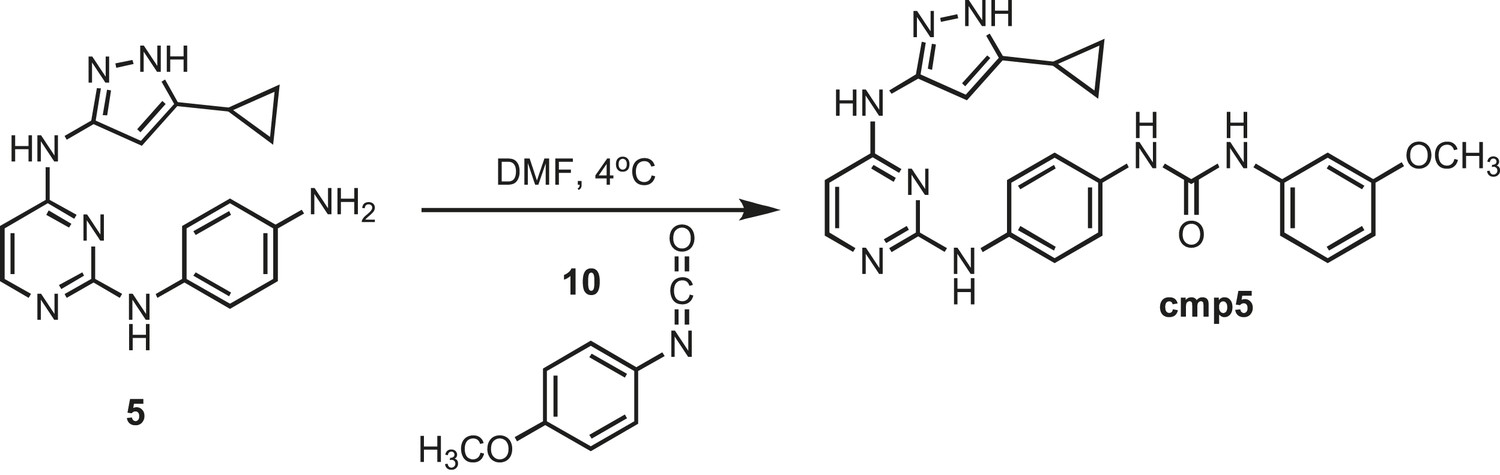
Synthesis of cmp5.
https://doi.org/10.7554/eLife.05434.030
Figure 15
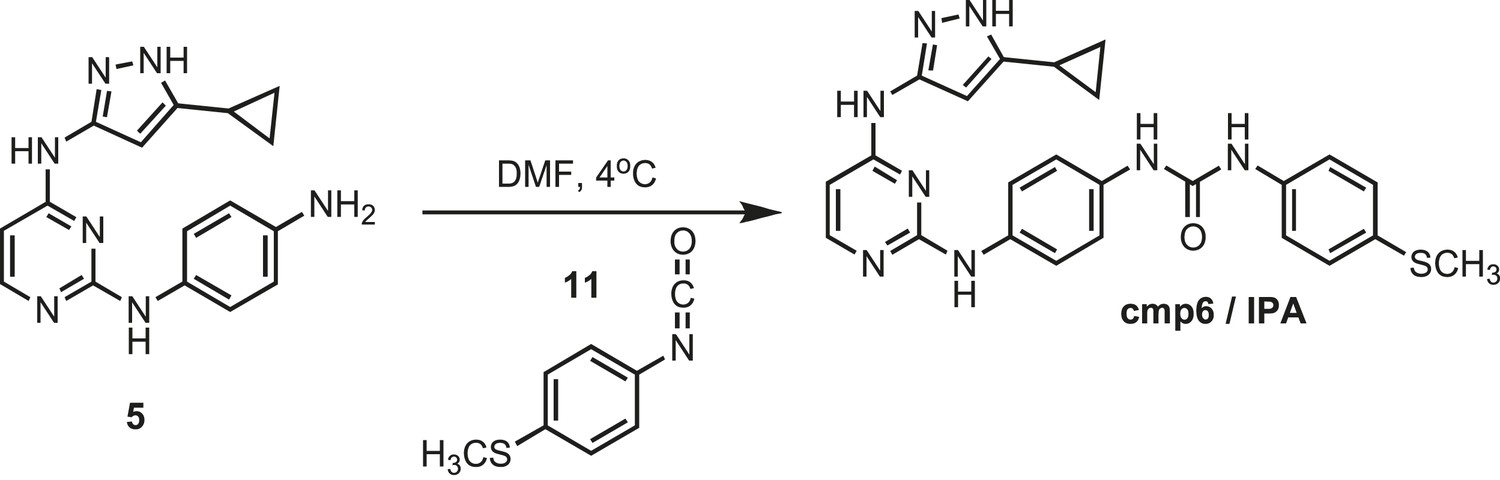
Synthesis of cmp6 (IPA).
https://doi.org/10.7554/eLife.05434.031
Figure 16
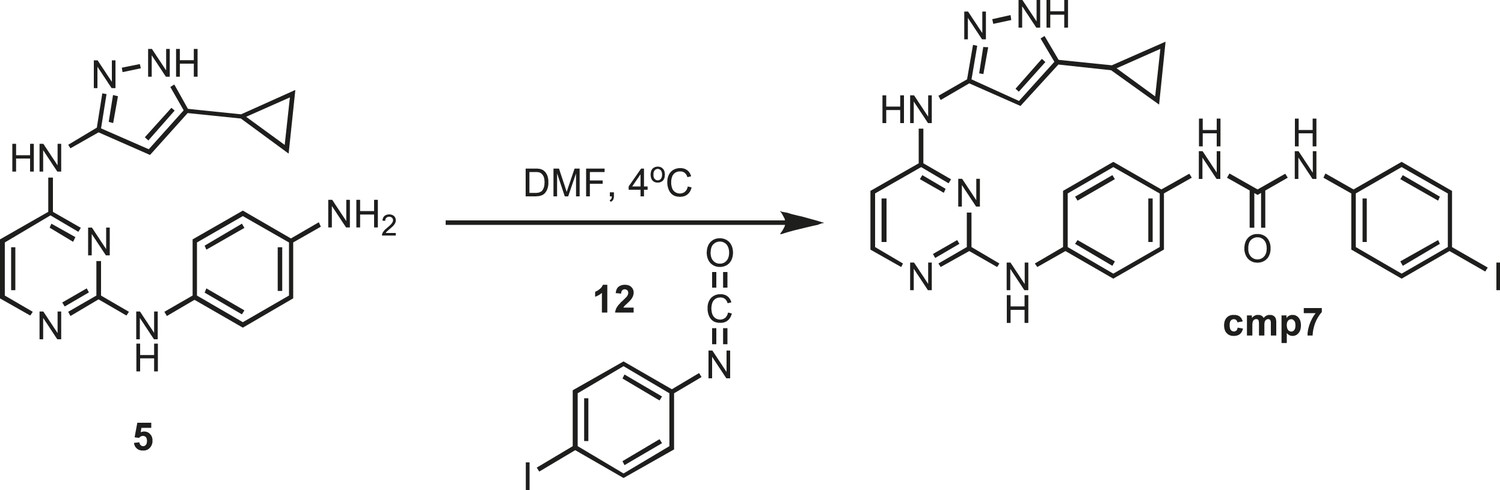
Synthesis of cmp7.
https://doi.org/10.7554/eLife.05434.032
Figure 17

Synthesis of cmp8.
https://doi.org/10.7554/eLife.05434.033
Figure 18
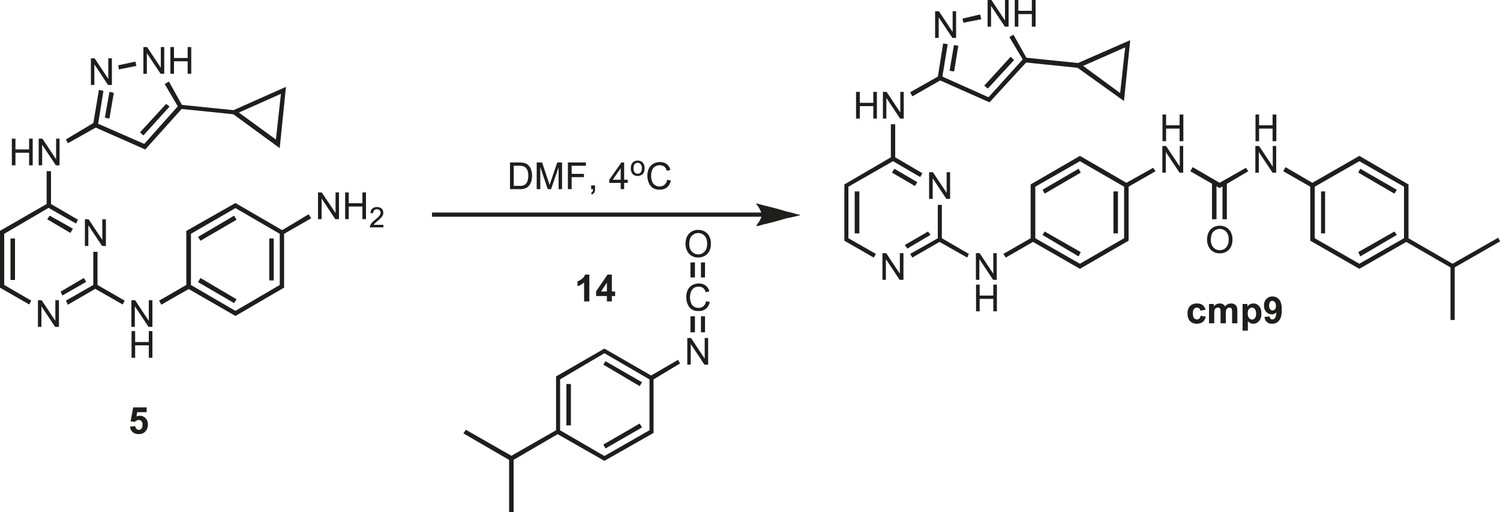
Synthesis of cmp9.
https://doi.org/10.7554/eLife.05434.034
Figure 19
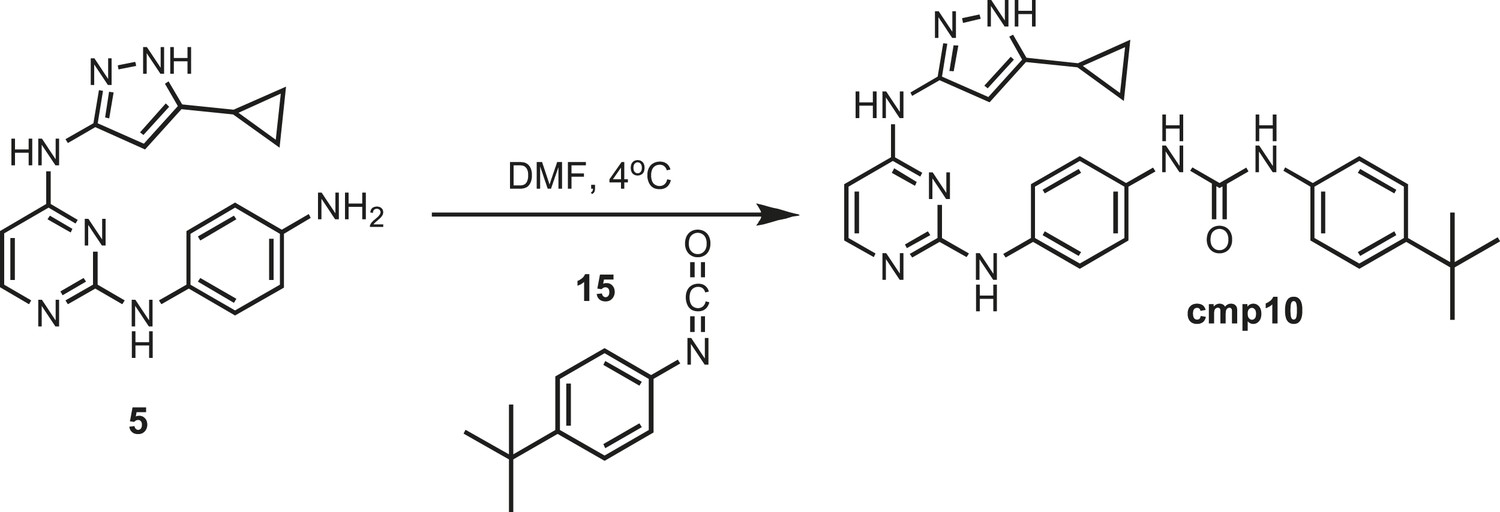
Synthesis of cmp10.
https://doi.org/10.7554/eLife.05434.035
Figure 20

Synthesis of IPAx intermediate 1.
https://doi.org/10.7554/eLife.05434.036
Figure 21
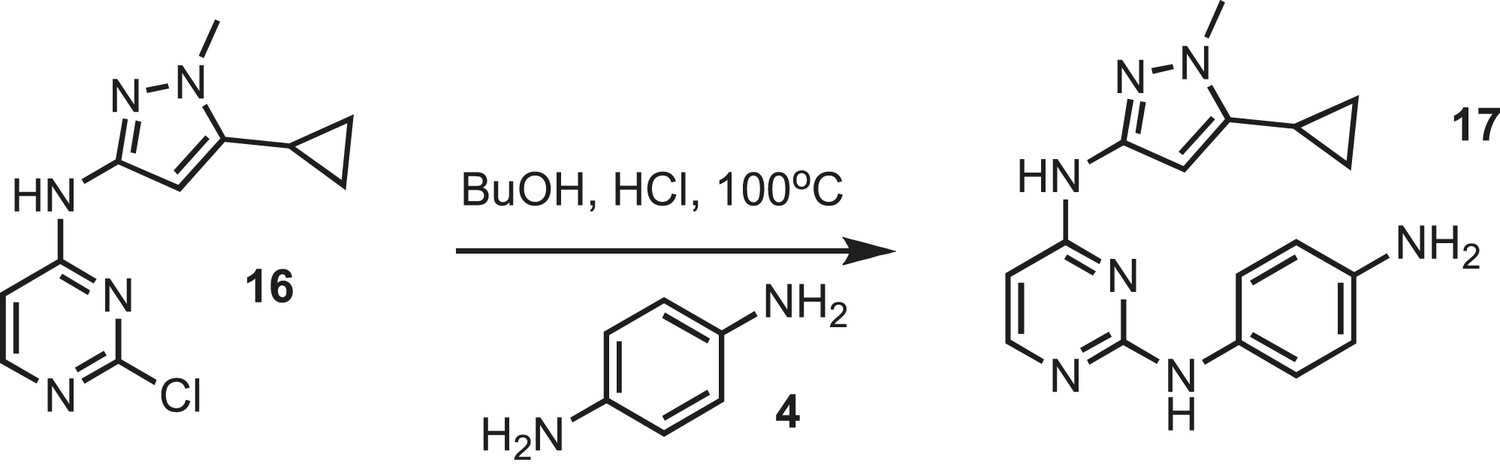
Synthesis of IPAx intermediate 2.
https://doi.org/10.7554/eLife.05434.037
Figure 22
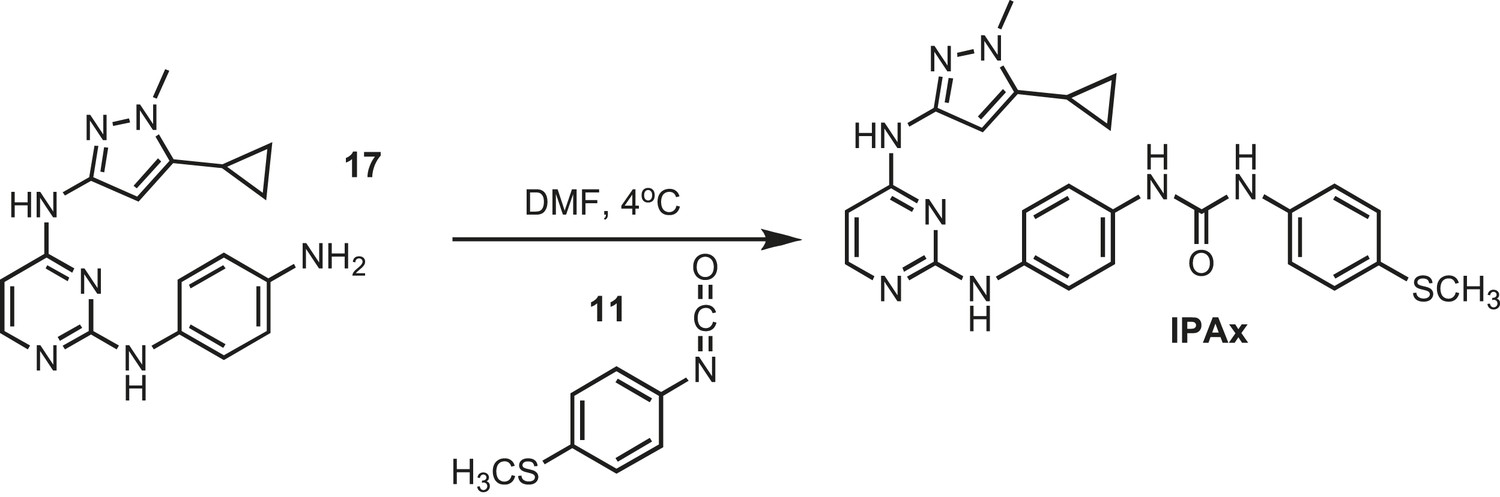
Synthesis of IPAx intermediate 3.
https://doi.org/10.7554/eLife.05434.038
Author response image 1
Additional files
-
Supplementary file 1
Invitrogen Kinome screen raw data. All kinases screened in the Invitrogen panel and their percent inhibitions. Classification of kinases can be located on the right hand column and the number of kinases inhibited can be located at the bottom of the last page of the panel.
- https://doi.org/10.7554/eLife.05434.020
Download links
A two-part list of links to download the article, or parts of the article, in various formats.
Downloads (link to download the article as PDF)
Open citations (links to open the citations from this article in various online reference manager services)
Cite this article (links to download the citations from this article in formats compatible with various reference manager tools)
Endoplasmic reticulum stress-independent activation of unfolded protein response kinases by a small molecule ATP-mimic
eLife 4:e05434.
https://doi.org/10.7554/eLife.05434


