A striatal-enriched intronic GPCR modulates huntingtin levels and toxicity
- Fudan University, China
- Collaborative Innovation Center for Brain Science, China
- Baylor College of Medicine, United States
- Massachusetts General Hospital, United States
- Novartis Institutes for Biomedical Research, United States
- Zhejiang University, China
Figures
Figure 1 with 1 supplement
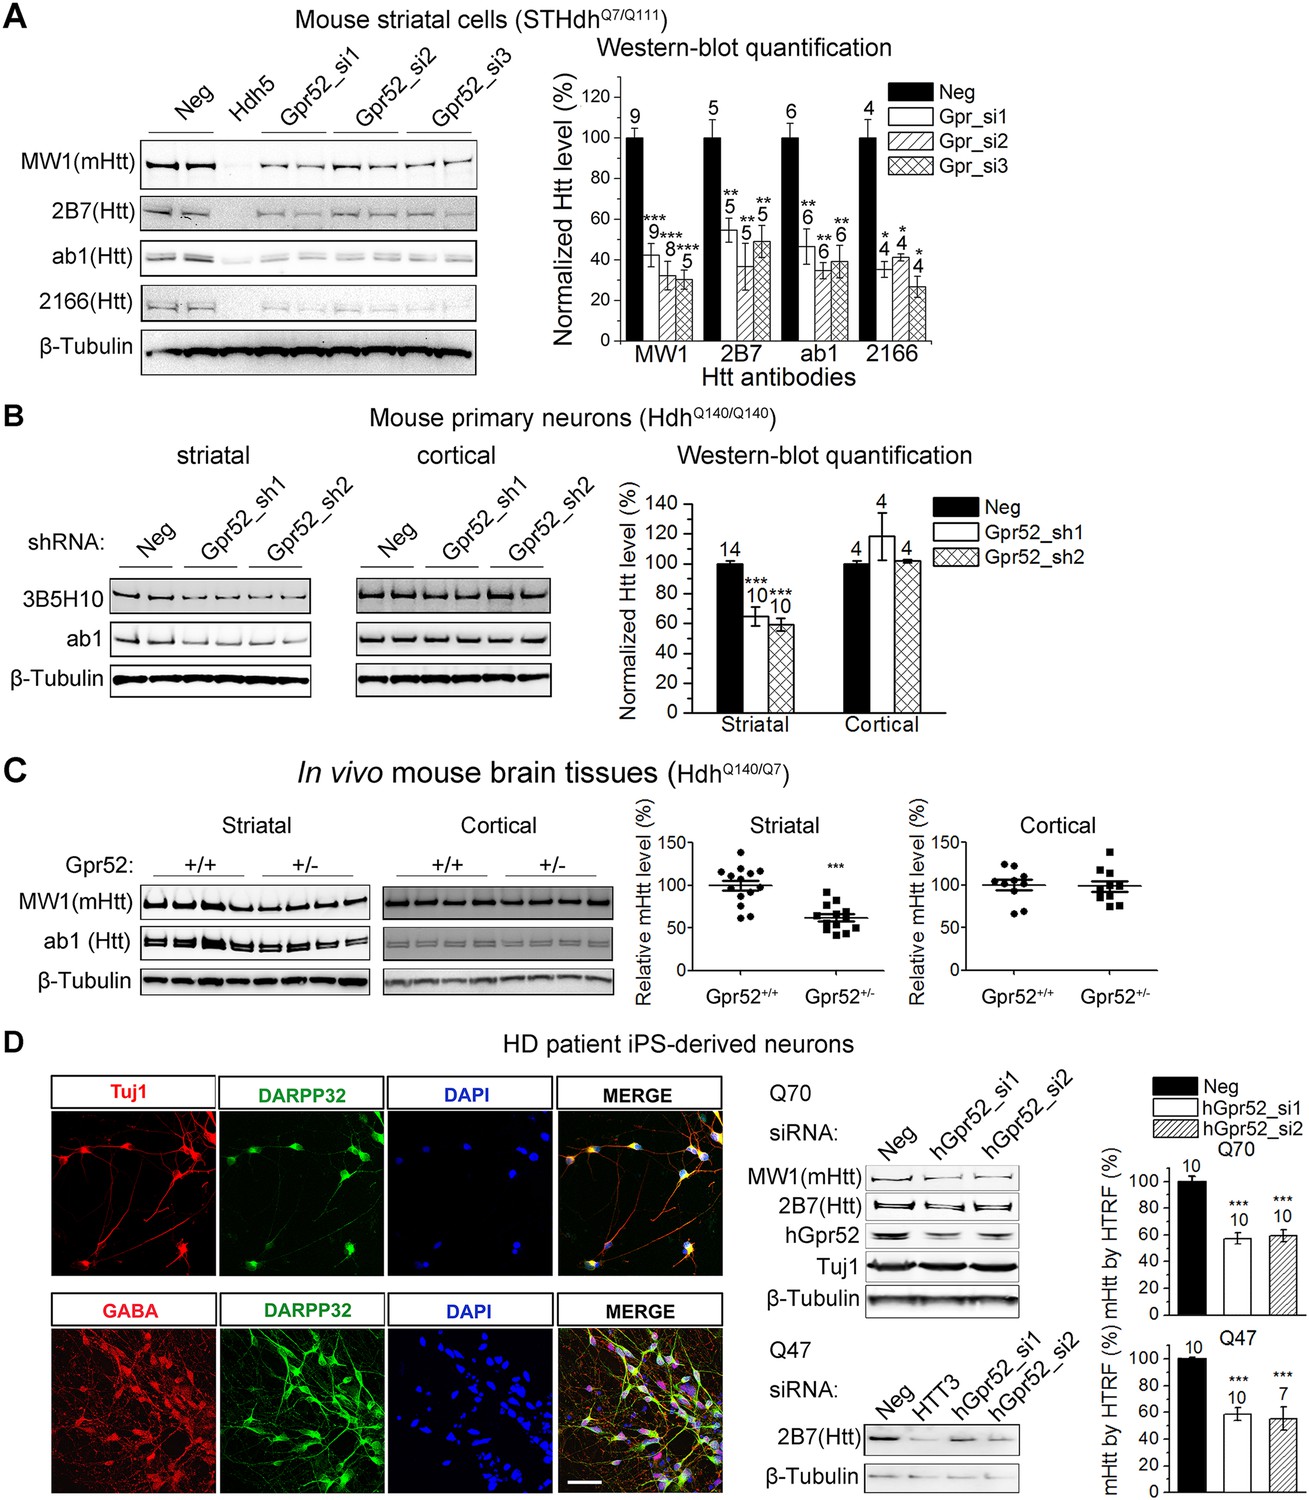
Gpr52 modulates Htt levels.
All data plots: average and S.E.M.; ‘*’: p < 0.05, ‘**’: p < 0.01, ‘***’: p < 0.001 by the two-tailed Mann–Whitney U test. The number on top of each bar indicates the biological replicate number. (A) Transfection of Gpr52 siRNAs (Gpr52_si1∼3) in the mouse striatal cells (STHdhQ7/Q111) lowers Htt levels, as detected by Htt antibodies MW1, 2166, ab1 and 2B7. MW1 is the polyQ antibody that detects only the mHtt protein, whereas 2166, 2B7 and ab1 detects both mHtt and wtHtt. Left panels: representative western-blots; Hdh5 is the Htt siRNA used as the positive control for Htt knock-down. Neg is the non-targeting siRNA used as the negative control. Right panel: western-blot quantification from multiple replicates. (B) Infection of lentiviruses expressing Gpr52 shRNAs (Gpr52_sh1∼2) lowers Htt in primary striatal but not cortical neurons cultured from HdhQ140/Q140 knock-in mice. Left panels: representative western-blots. Right panel: western-blot quantification for the normalized 3B5H10 signals from multiple replicates. (C) Heterozygous knockout of Gpr52 lowers Htt in vivo in the striata but not cortices of HdhQ140/Q7 knock-in mice in vivo. The mice were obtained by crossing the heterozygous Gpr52 knockout mice with the HdhQ140/Q140 knock-in mice. Littermates between 40 to 69 days of age were analyzed. Left panels: representative western-blots. Right panel: western-blot quantification of the normalized MW1 signals from multiple mouse samples. Each dot represents the signal from a single mouse. (D) Left panels: Immunostaining of HD patient iPS-derived striatal-like neurons. Differentiated neurons from HD patient's iPS cells express molecular markers for striatal medium spiny neurons: Tuj1, GABA and DARPP32. Scale bar: 50 μM. Right panels: Transfection of human Gpr52 siRNAs (hGpr52_si1∼2) in the HD patient iPS-derived neurons lowers Htt levels detected by both western-blots and HTRF. HTT3 is the Htt siRNA used as the positive control for Htt knock-down. Bar plot represents the normalized mHtt levels detected by HTRF using the 2B7/MW1 antibody pair.
Figure 1—figure supplement 1
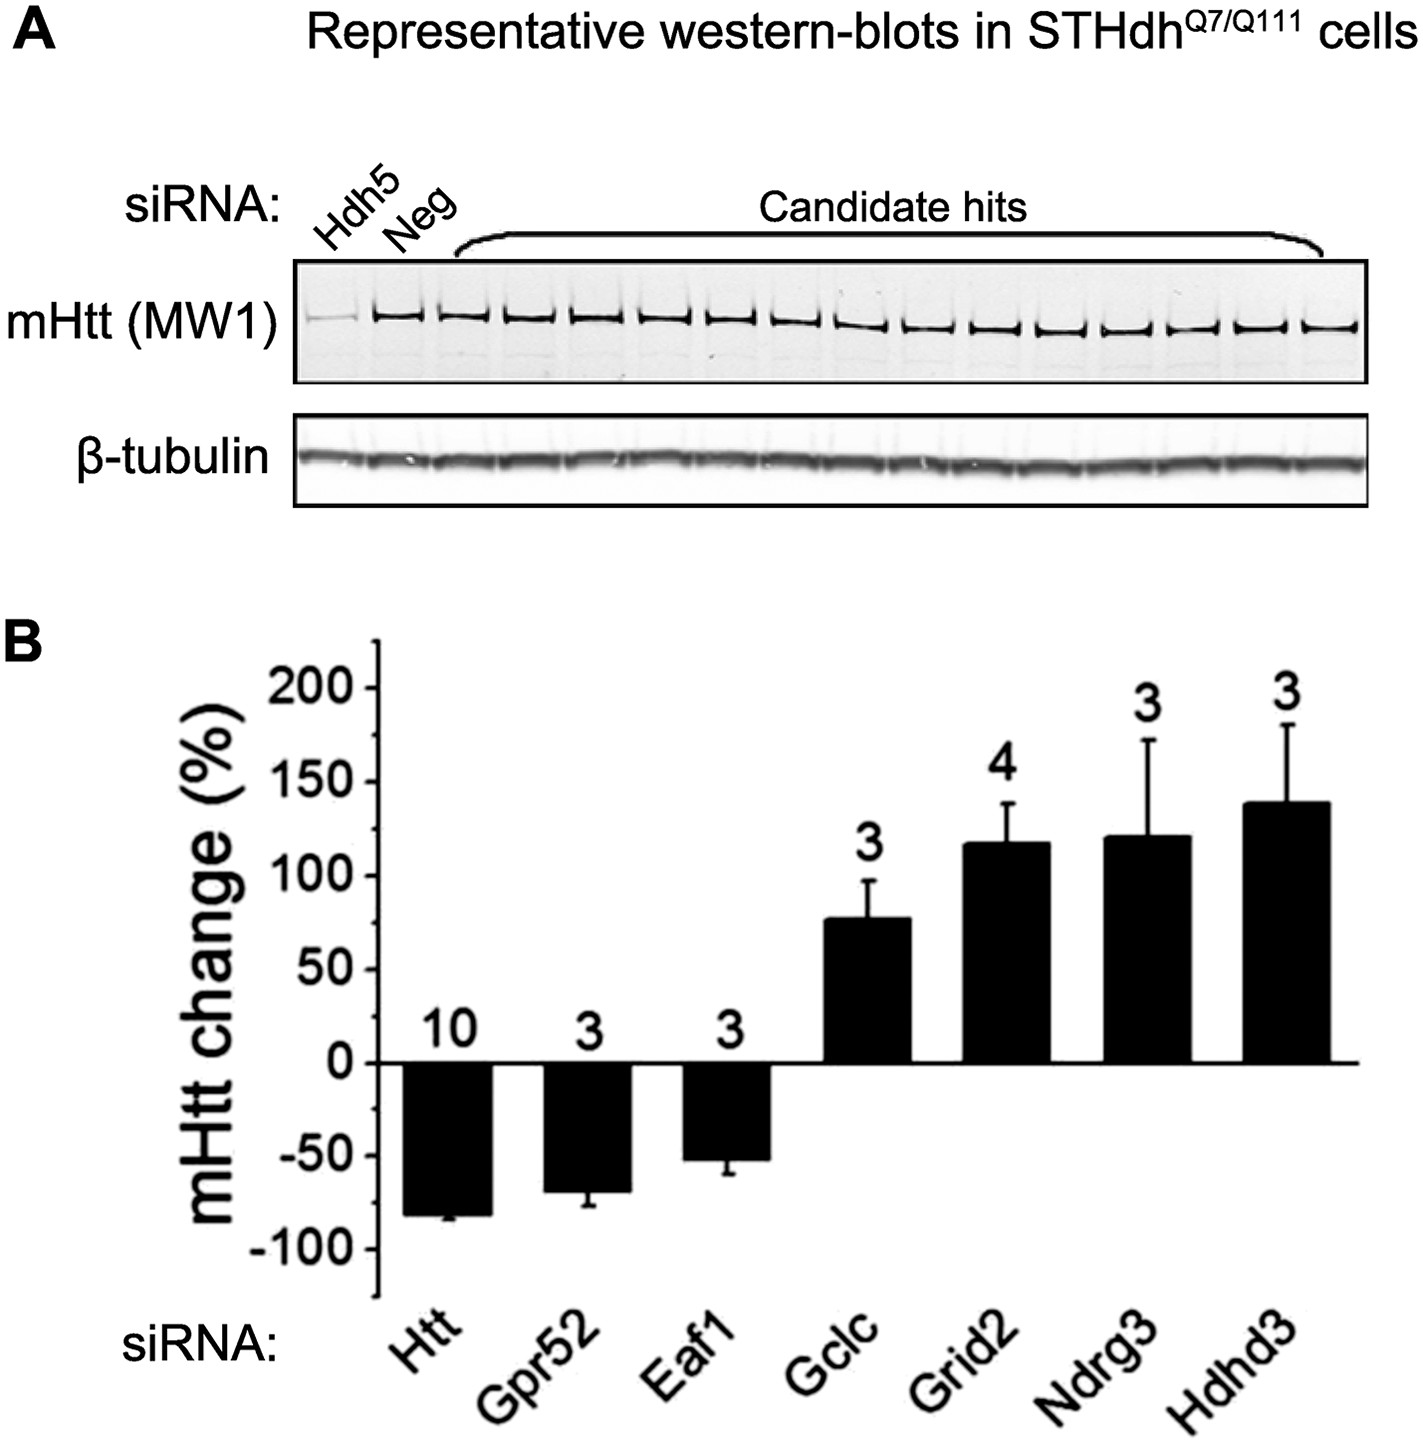
Screening for modulators of Htt levels in the striatal cells (STHdh).
(A) Representative western-blots in the STHdhQ7/Q111 cells of candidate modifiers of mHtt levels. 104 candidate modifiers were selected based on our previous screening results (doi: 10.1038/nn.3367). The genes that had averaged Z score values larger than 1.2 and were not previously identified as validated hits in the patient fibroblasts were selected for testing in STHdh cells by pooled siRNAs (Dharmacon, custom library). The MW1 detected full length mHtt is quantified and normalized to the tubulin signal using the ImageJ software. The siRNAs that change mHtt levels by more than 30% in the same direction in three biological repeats were selected as hits. The number on top of each bar indicates the biological repeat number of siRNA knock-down. (B) The bar plot of mHtt level changes upon knock-down of the identified modifiers. The numbers on top of each bar represent the number of biological replicates tested.
Figure 2
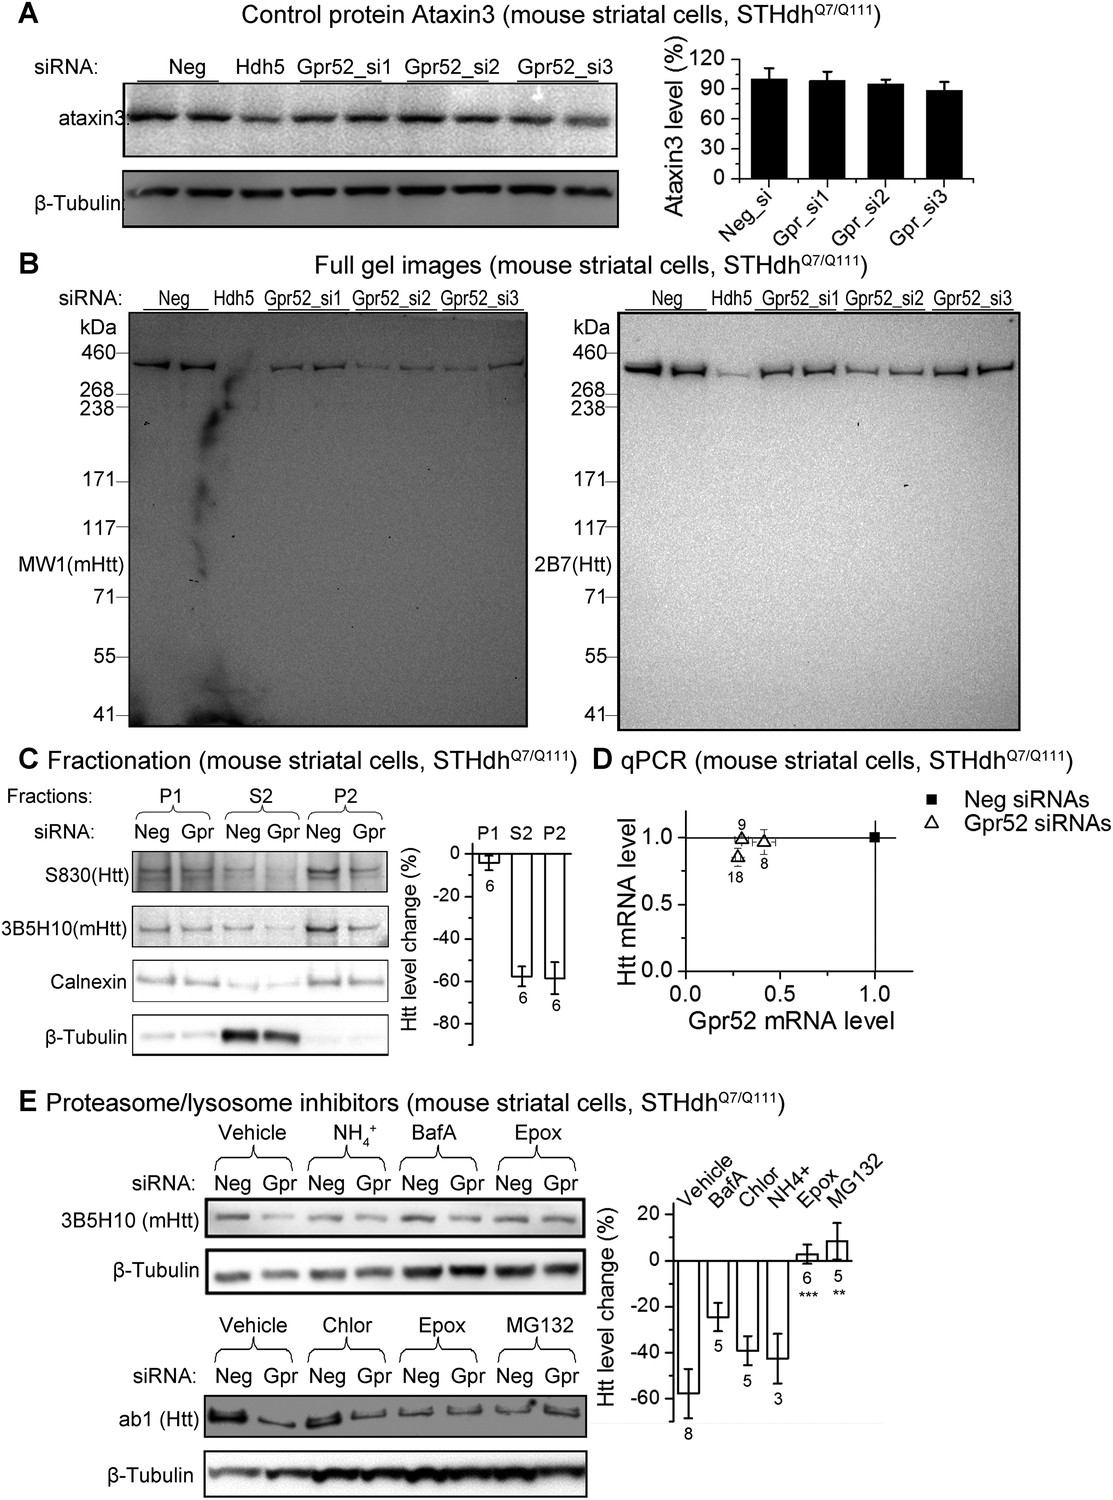
The Gpr52 mediated change of Htt levels is via protein degradation.
(A) Representative western-blots of STHdhQ7/Q111 cell lysates showing no reduction of Ataxin3 levels by Gpr52 knock-down. Bar graph: quantification of Atxn3 levels, n = 4. (B) Full membrane images of Htt blots showing no increase/appearance of lower molecular weight bands in the STHdh cell lysates, suggesting that the Htt reduction by Gpr52 knock-down is not due to protein cleavage modulations. (C) Representative western-blots for different biochemical fractions of the protein extract from STHdhQ7/Q111 cells transfected with non-targeting control siRNA (Neg) or the Gpr52 siRNA (Gpr52_si2). Gpr52 knock-down reduced Htt levels in both the P2 and S2 fractions, but not the P1 fraction. (D) In the Gpr52 siRNAs (triangles) transfected STHdhQ7/Q111 cells, Htt mRNA levels (Y-axis) and Gpr52 mRNA (X-axis) levels were measured by qPCR. Both the Gpr52 siRNAs and the Htt siRNAs show substantial knock-down of their targets, whereas the Gpr52 knock-down by Gpr52 siRNAs do not reduce Htt mRNA levels. No reverse-transcriptase control samples have been assayed to eliminate potential contaminations from genomic DNA. (E) Left: representative western-blots of STHdhQ7/Q111 cells transfected with non-targeting control siRNA (Neg) or the Gpr52 siRNA (Gpr52_si2) with or without proteasome or autophagy inhibitors. Right: the bar plot of western-blot quantification of the Htt level change by Gpr52 siRNA transfection with each compound treatment.
Figure 3 with 3 supplements
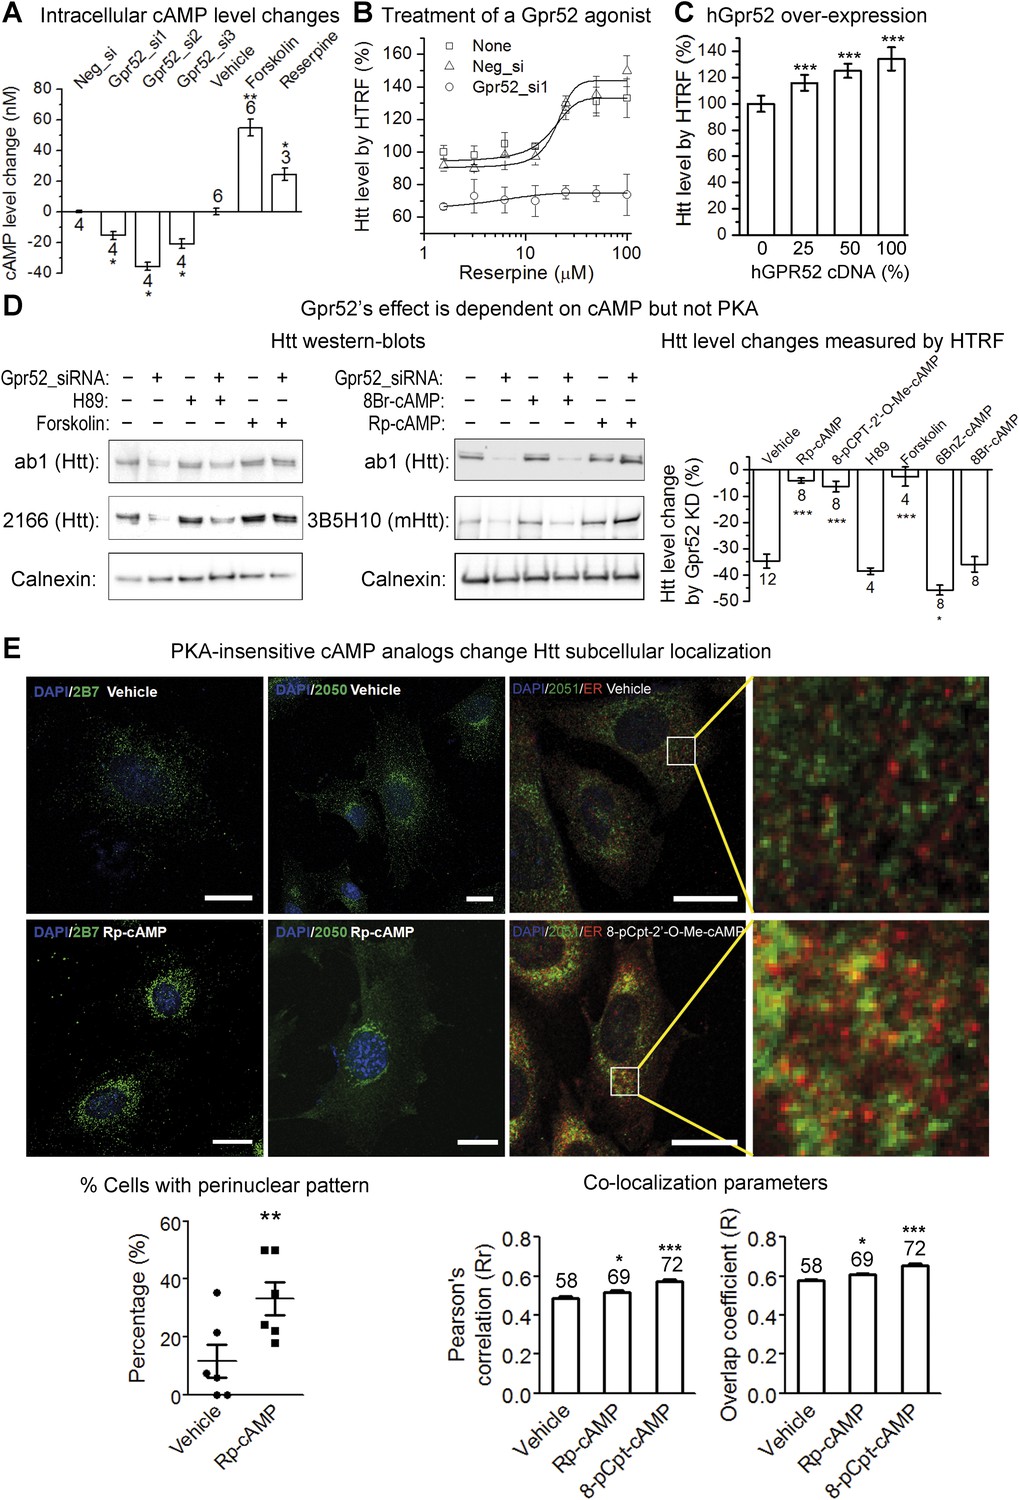
Gpr52 modulates Htt levels via cAMP dependent but PKA independent pathways.
All experiments are performed in the mouse striatal cell line STHdhQ7/Q111, and all data are plotted as average and S.E.M. ‘*’: p < 0.05, ‘**’: p < 0.01, ‘***’: p < 0.001. The number on top of each bar indicates the biological replicate number. (A) Changes of cAMP levels measured by the cAMP-Glo assay (Promega). Gpr52 siRNAs were tranfected for 3 days, whereas the compound treatment (forskolin: 1 µM; reserpine: 10 µM) lasts for 24 hr; statistical analyses performed by the two-tailed Mann–Whitney U test. (B) Htt level measured by the 2B7/2166 HTRF (Liang et al., 2014) upon treatment of different doses of the Gpr52 agonist reserpine for 48 hr, with transfection of Gpr52 siRNA (Gpr52_si1) vs the non-targeting control (Neg_si), n = 4. (C) Htt level measured by the 2B7/2166 HTRF when transfected with hGPR52 cDNA titrated with the empty control vector at different percentages (X-axis), n = 6; statistical analysis performed by the one-way ANOVA and post-hoc Dunnett's test. (D) Left and middle: Representative western-blots of STHdhQ7/Q111 cells transfected with the Gpr52 siRNA (Gpr52_si2) and then treated with the indicated PKA modulators or cAMP analogs (forskolin and cAMP analogs: 1 µM; H89: 50 µM). Calnexin has been used as a loading control. The Bars plot: Htt level changes (%) measured by 2B7/2166 HTRF (Liang et al., 2014) of the total lysates with the same treatments as in the western-blot samples. (E) Confocal microscopy experiments showing that HTT proteins are enriched in the perinuclear and co-localize with the endoplasmic reticulum (ER) marker calreticulin upon treatment of Rp-cAMP or 8-pCpt-2′-O-Me-cAMP (8-pCpt-cAMP for short). Upper panels: representative images showed the immunofluorescent signals of Htt (green), ER marker (red, only in the third and fourth columns) and DAPI (blue) in STHdh Q7/Q111 cells treated by vehicle, 1 μM Rp-cAMP or 1 μM 8-cpt-cAMP. Scale bars, 20 μM. The two panels on the right side are magnified images from the left for visualizing the co-localization. Yellow pixels indicate co-localization. Lower left plot: the percentage of cells showing clear perinuclear pattern in each samples. The pattern was judged blindly. Lower middle and right plots: co-localization parameters including Pearson's coefficient and overlap coefficient (mean and S.E.M.). Numbers in indicate the number of cells analyzed for each treatment from five or more biological replicates.
Figure 3—figure supplement 1
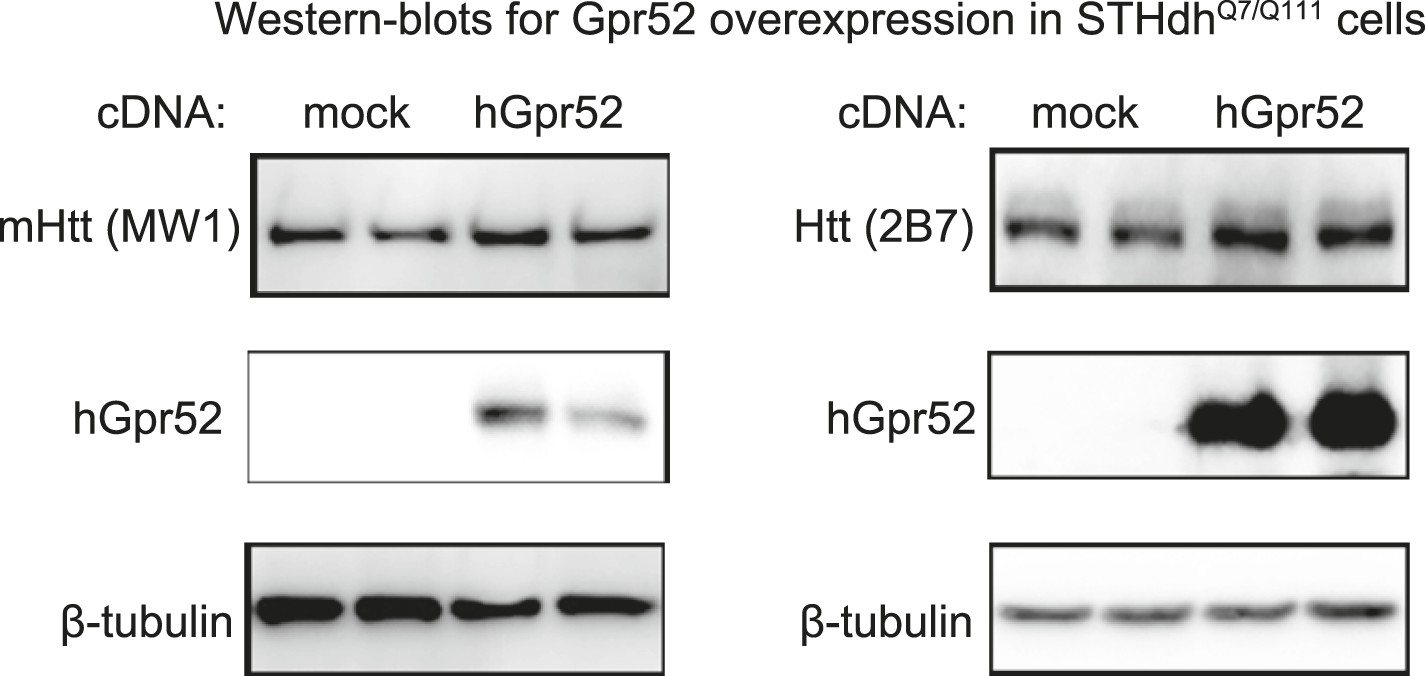
Over-expression of human Gpr52 cDNA in STHdh cells.
Representative western-blots showing increased Htt levels and over-expression of human Gpr52 (hGpr52) in STHdhQ7/Q111 transfected with the hGpr52 cDNA.
Figure 3—figure supplement 2
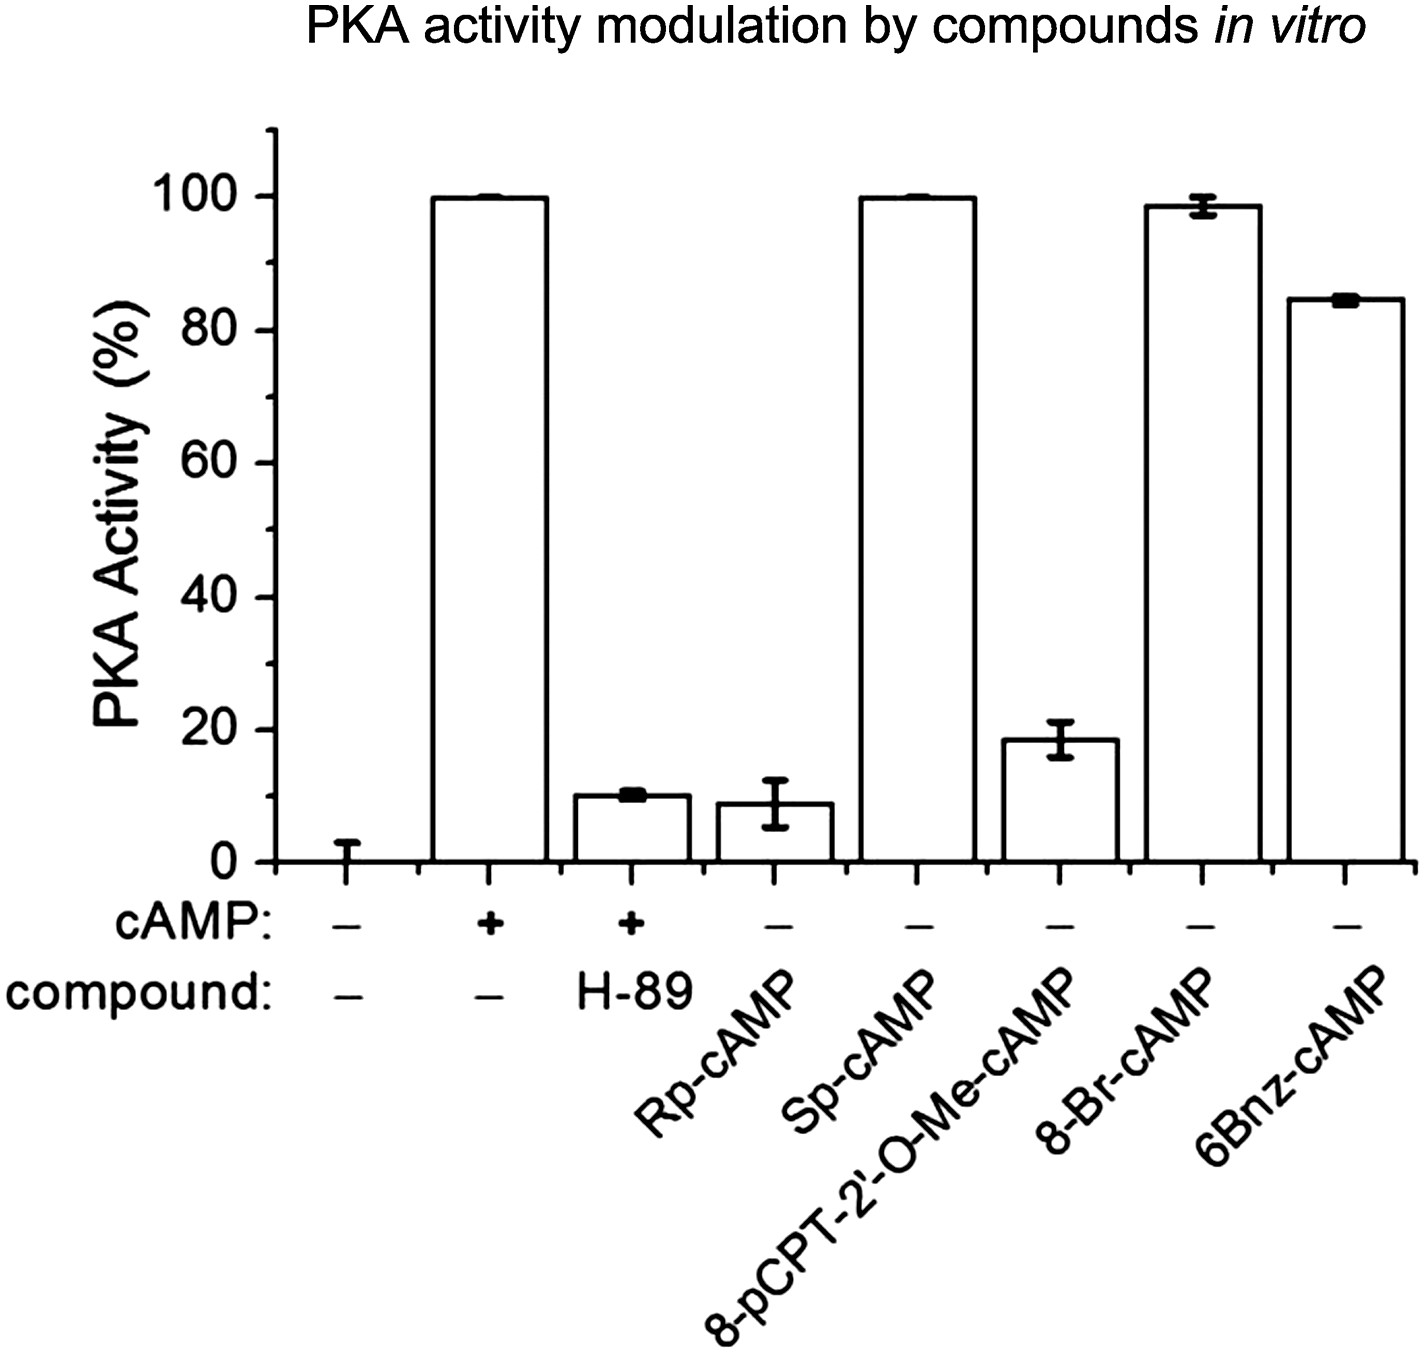
Modulation of PKA activity by PKA inhibitor or cAMP analogs.
PKA kinase activities are measured by the cAMP-Glo kit (Promega) with a modified protocol in the in vitro condition. Basically, PKA activity is determined by the phosphorylation of the kinase substrate, which is detected by the reduction of the luciferase signal after 1 hr. The average signal without any cAMP or analogs is used as the baseline (0% PKA activity, bar 1). The average signal with 200 nM purified cAMP (a component in the kit) is set as the 100% PKA activity. The PKA inhibitor H89 was applied together with 200 nM cAMP and blocked ∼90% of the PKA activity. Different cAMP analogs (200 nM) are tested for their ability to activate PKA. n = 6 for each sample. Rp-cAMP and 8-pCPT-2′-O-Me-cAMP do not activate PKA, whereas Sp-cAMP, 8-Br-cAMP and 6Bn-cAMP activate PKA as efficiently as cAMP.
Figure 3—figure supplement 3
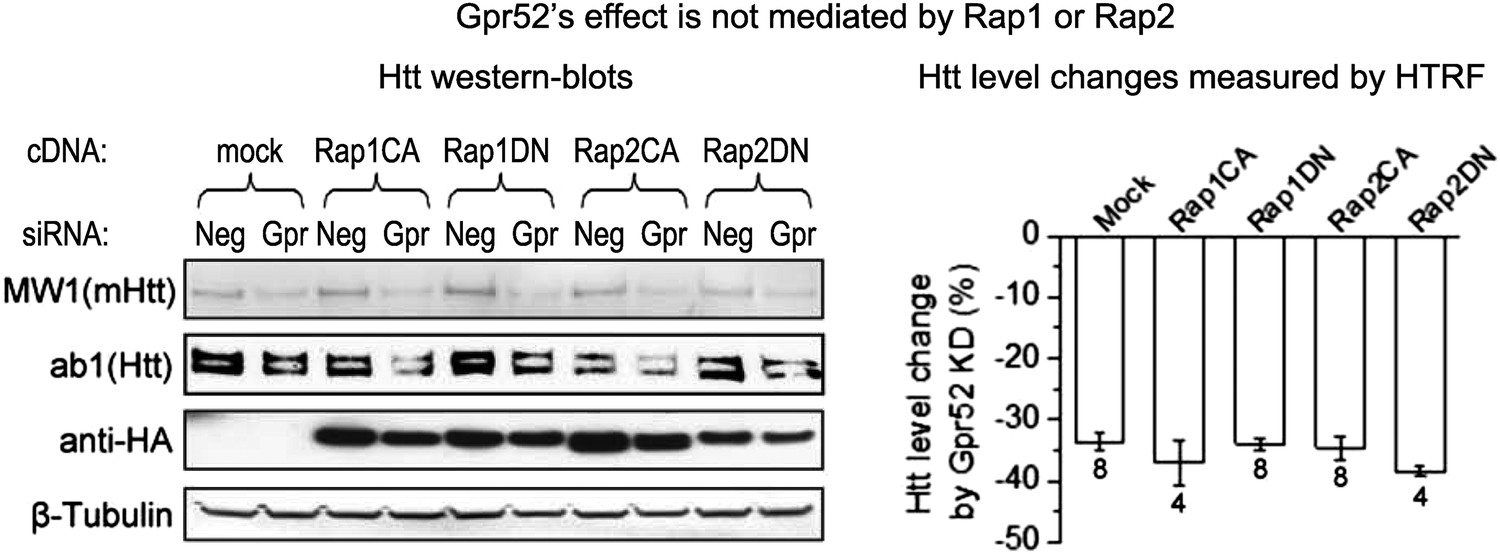
Gpr52's effect is not mediated by Rap1 or Rap2.
Left: Representative western-blots of STHdhQ7/Q111 cells transfected with the Gpr52 siRNA (Gpr52_si2) versus control siRNA, and then with constitutively active or dominant negative Rap1 (Rap1CA or Rap1DN) or Rap2 (Rap2CA or Rap2DN). The Bars plot: Htt level reduction (%) measured by 2B7/2166 HTRF of the total lysates of cells with same transfections as in the western-blots.
Figure 4 with 3 supplements

Rabgap1l interferes with Gpr52-mediated Htt modulation.
(A) Left: Representative western-blots of STHdhQ7/Q111 cells transfected with the Gpr52 siRNA (Gpr52_si2) vs the control siRNA, along with or without the Rabgap1l siRNA. Rabgap1l knock-down blunts the Gpr52's effect on the Htt level. Bar plot: HTRF quantification of the transfected cells as indicated, showing consistent results with the western-blots; statistical analyses by the two-tailed Mann–Whitney U-test. (B) mRNA levels of Gpr52 (left Y-axis) or Gapdh (right Y-axis) vs the ones of Rabgap1l (X-axis) upon transfection with HTT siRNAs or control (Neg). Both Gpr52 and Rabgap1l mRNA levels are lowered upon HTT knock-down, and a correlation between the lowering is observed. (C) Left panels: Representative confocal microscopic immunofluorescent images of Htt and Rab39B in STHdhQ7/Q111 cells. Treatments with 1 μM RP-cAMP or 1 μM 8-pCPT-2′-O-Me-cAMP for 48 hr leads to increased co-localization between Htt and Rab39B. Red: Rab39B; Blue: DAPI; Green: Htt (using antibody 2051); The lower panels are magnified images from the left for visualizing the co-localization. Yellow pixels indicate co-localization. Scale bars: 20 μm. Right panels: co-localization parameters including Pearson's coefficient and overlap coefficient (mean and S.E.M.). Numbers in indicate the number of cells analyzed for each treatment from five or more biological replicates. (D) A model figure explaining the modulation of Htt levels by Gpr52. Gpr52 increases cAMP when activated, which leads to activation of an unknown GEF (Guanine Exchange Factor) that activates the downstream Rab39B protein. Rab39B then co-localize with Htt and translocate it to the ER, where the proteasomal degradation is prohibited due to lack of proteasomes in the ER. The Gpr52 gene locates in an intron of the Rabgap1l gene, which expresses the GAP (GTPase Activating Protein) for Rab39B, and thus blocks the modulation. Thus, Gpr52 and Rabgap1l provide balanced regulation of Htt in striatal cells, and the shared genomic loci may facilitate their balance in modulating Htt levels via co-regulated expression in striatal cells.
Figure 4—figure supplement 1
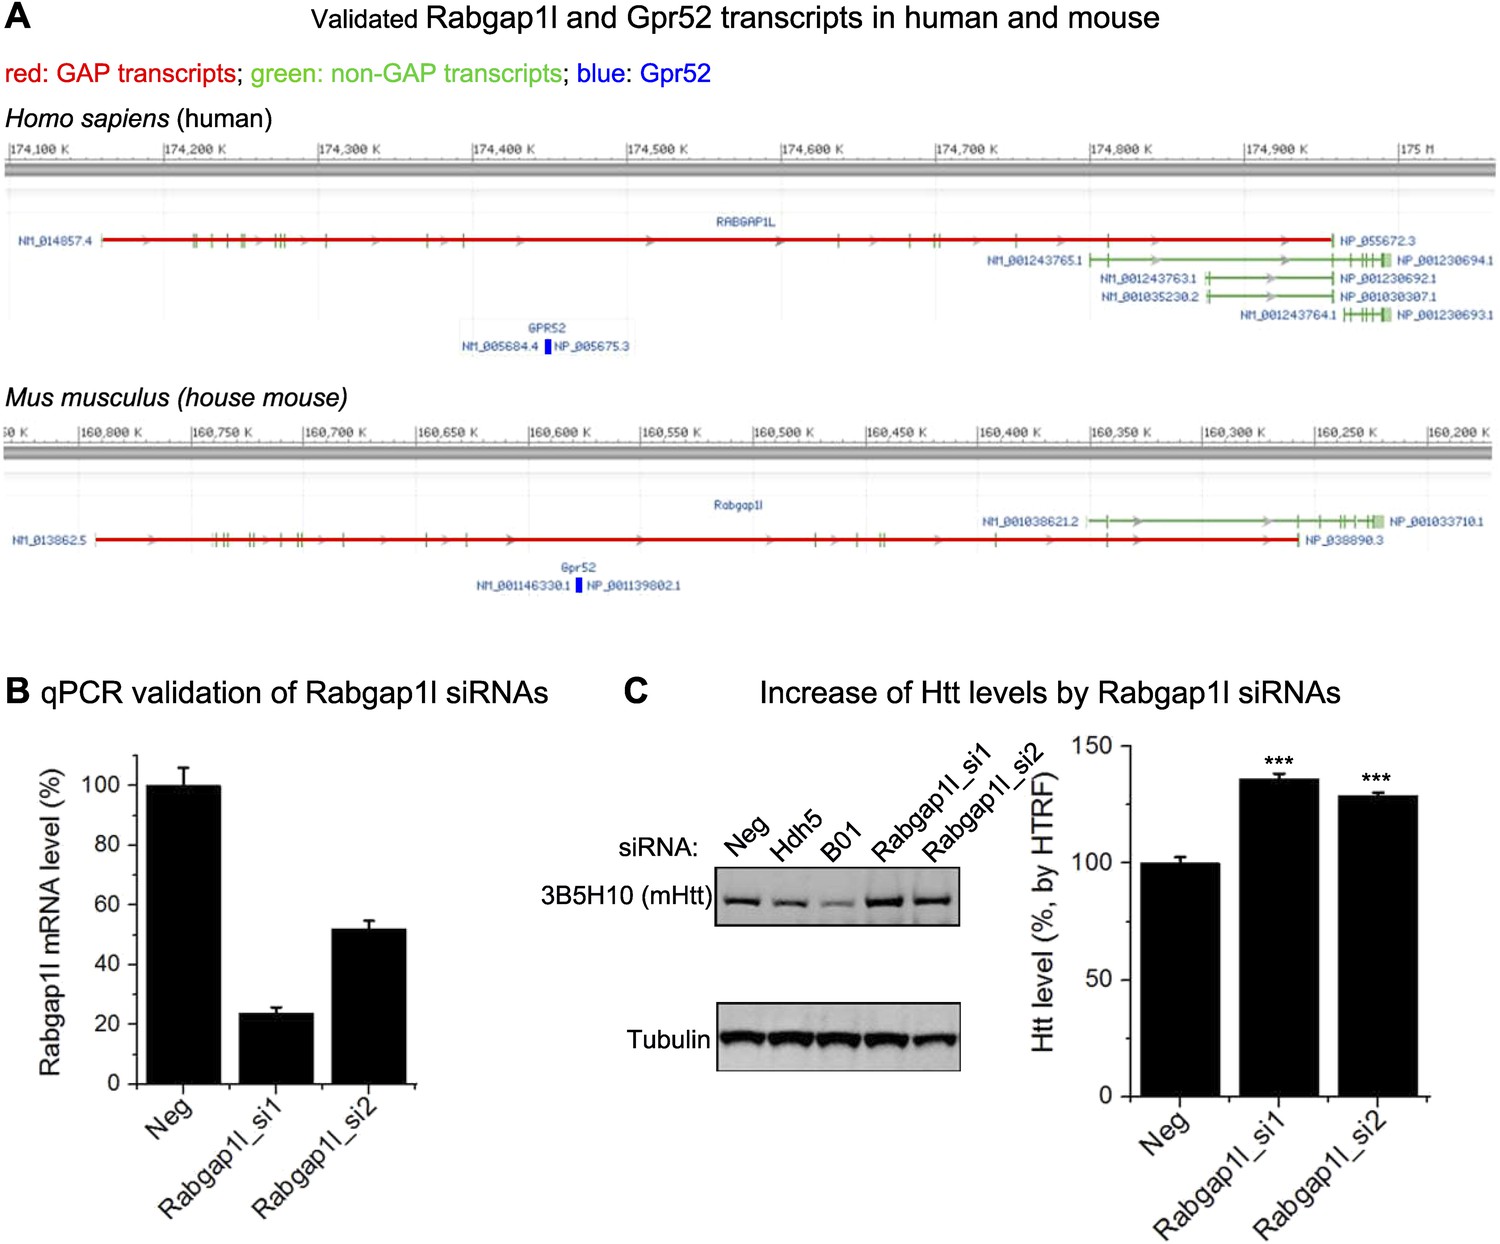
Rabgap1l genomic information and siRNA validation.
(A) Genomic loci of Rabgap1l and Gpr52. (B) qPCR quantification of the Rabgap1l mRNA level of STHdh cells transfected with Rabgap1l siRNAs or the non-targeting control siRNA (Neg). 50–80% knock-down could be achieved by siRNA transfection in these cells. (C) Western-blot (left) and HTRF (right) experiments showing that Rabgap1l knock-down by siRNA increases the Htt level in the STHdh cells. Hdh5 and B01 are Htt siRNAs used as positive controls. For HTRF, the 2B7/2166 antibody pair was used. Data are plotted as mean and S.E.M, n = 16 for non-targeting siRNA control (Neg) samples, and n = 12 for Rabgap1l siRNA transfected samples. ‘***’: P < 0.001 by the two-tailed Mann–Whitney U-test.
Figure 4—figure supplement 2
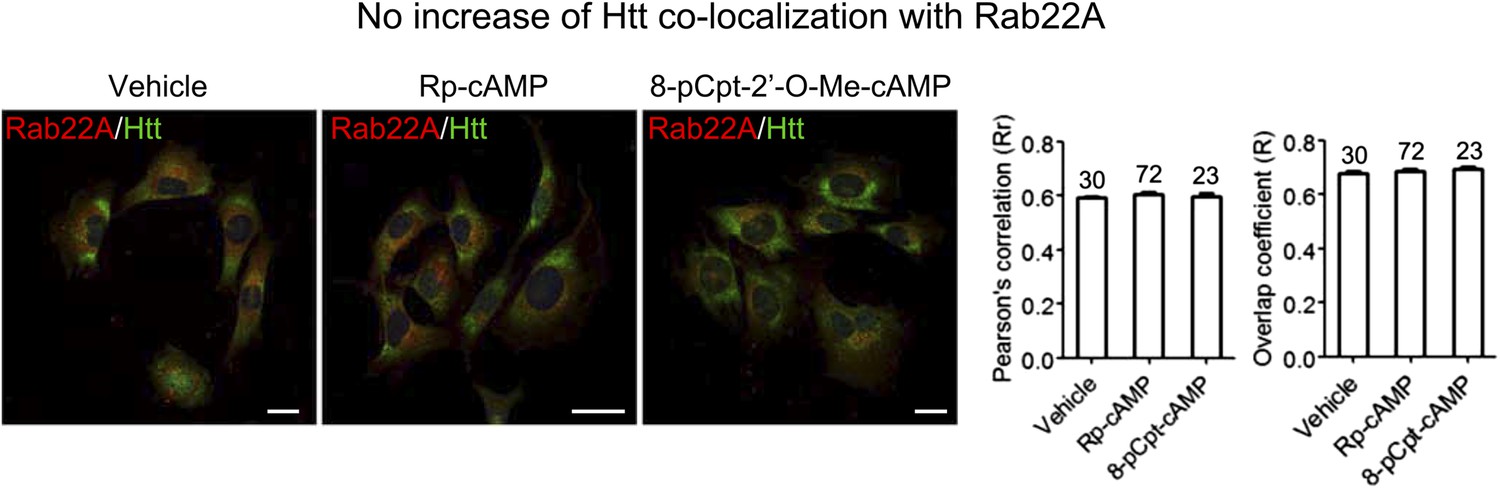
No increase of Htt co-localization with Rab22A.
Representative confocal microscopic immunofluorescent images of Htt and Rab22A in STHdhQ7/Q111 cells and the quantification analysis of co-localization. Treatments with 1 μM RP-cAMP or 1 μM 8-pCPT-2′-O-Me-cAMP for 48 hr leads to no change of co-localization between Gpr52 and Rab22A. Red: Rab22A; Blue: DAPI; Green: Htt (using antibody 2051); Scale bars: 20 μm.
Figure 4—figure supplement 3
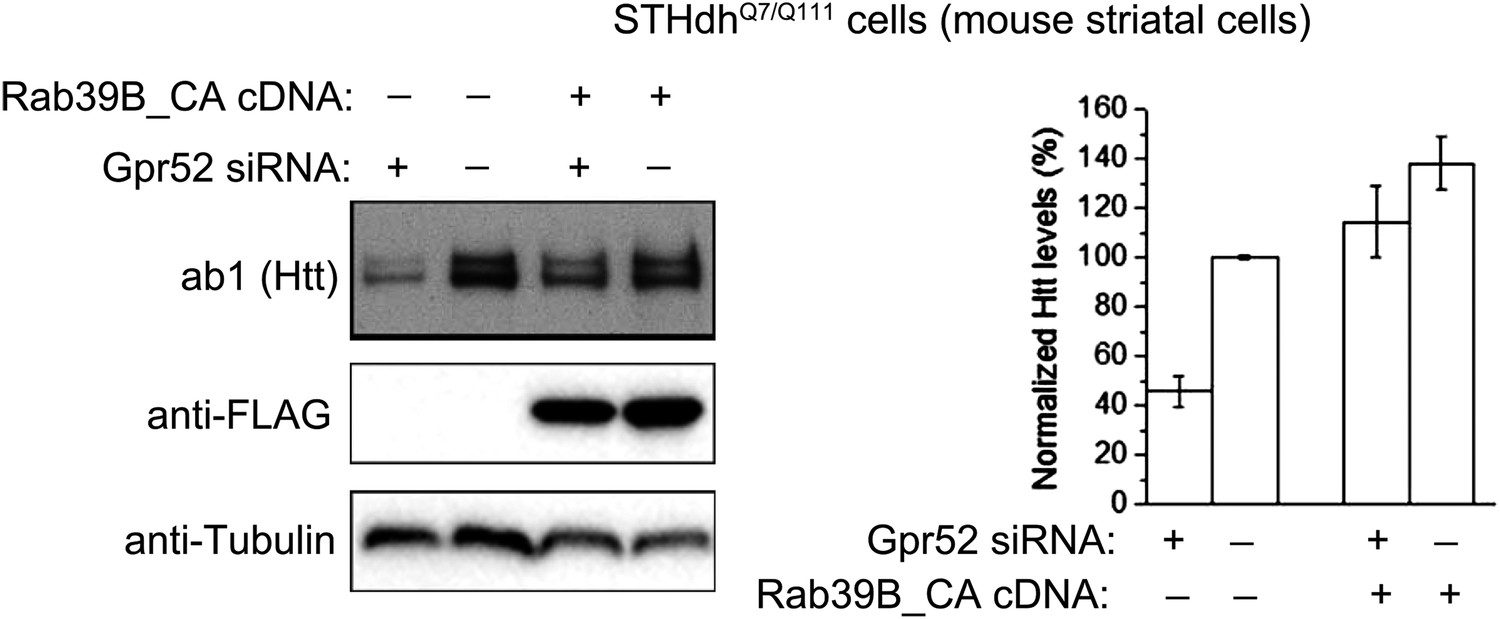
Constitutively active Rab39B blunts Gpr52's effect.
Left: Representative western-blots of Htt (ab1), consitutively active Rab39B (anti-FLAG for Rab39B_CA), and the loading control (Tubulin). ‘−’ indicates the empty vector or scrambled siRNA controls. Right: quantification of the normalized Htt signals, n = 4.
Figure 5
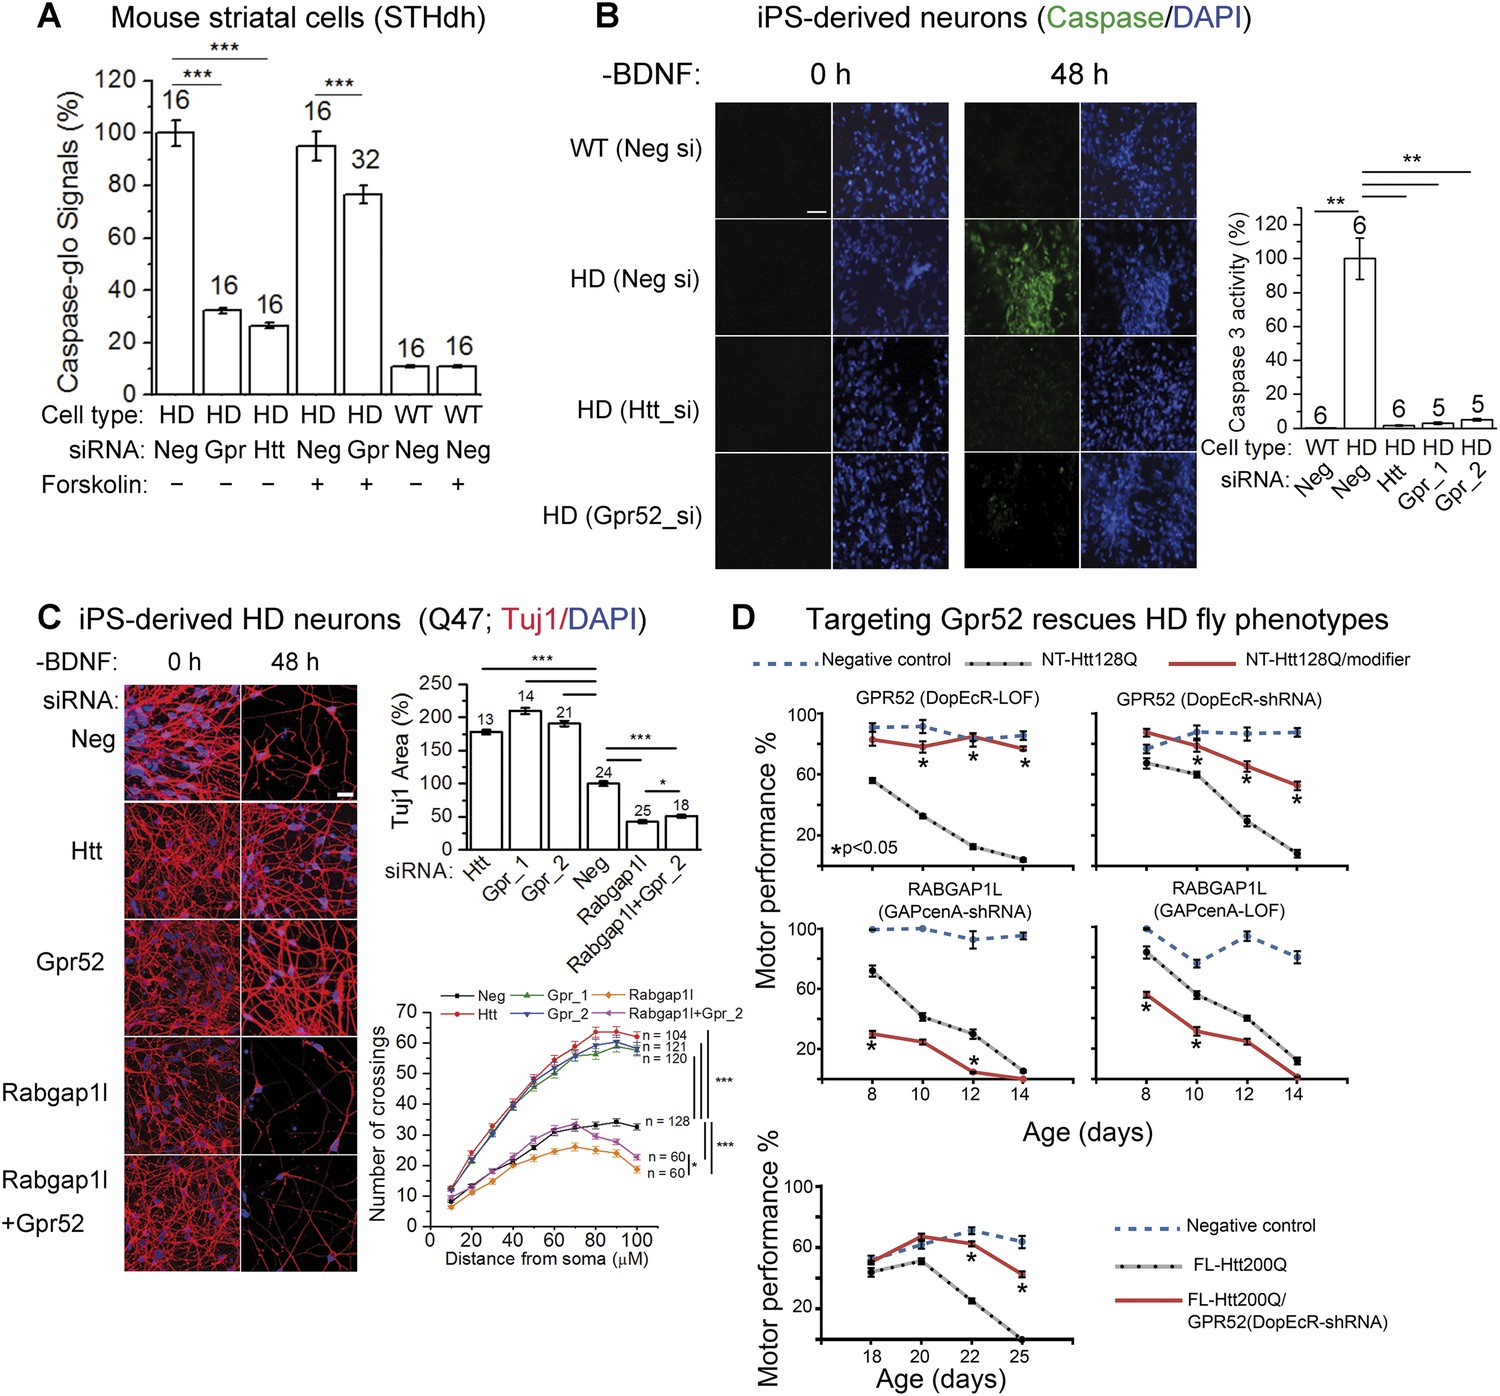
Lowering Gpr52 rescues human HD neurons and the in vivo fly HD models.
(A) Caspase-glo of STHdhQ7/Q111 (HD) or STHdhQ7/Q7 cells (WT) with indicated transfections (Neg: the non-targeting controls siRNA; Gpr: the Gpr52 siRNA smartpool; Htt: the Htt siRNA Hdh5) and compound treatments; statistical analyses by the two-tailed Mann–Whitney U-test. (B) Caspase 3 activity of patient iPS-derived neurons (Q47) measured by the fluorescent indicator dye before and after BDNF removal (scale bar: 200 µm). Bar plots: quantification of caspase 3 signals corrected by the total cell number (by DAPI) and normalized to the HD controls (second bar). Statistical analyses were performed by the two-tailed Mann–Whitney U-test. (C) Immunostaining of Tuj1 and DAPI showing loss of neurons of HD patient iPS-derived neurons (Q47) cultured under the BDNF-deprived condition with indicated transfections, and the rescue by knocking-down Htt or Gpr52 or Rabgap1l or Rabgap1l + Gpr52 (scale bar: 200 µm). Bar plots: quantification of the area in each field covered by the Tuj1 signal (Tuj1 area) and the nuclei counts. All data normalized to the non-targeting siRNA transfected control samples. Statistical analyses were performed by the two-tailed Mann–Whitney U-test. Sholl plots: the sholl analysis (Sholl, 1953) results plotted for each sample, ‘n’ indicated the number of analyzed neurons. Statistical analysis performed by two-way ANOVA tests. (D) Age-dependent motor performance in normal flies expressing elav-GAL4 driver alone (Negative control, blue dotted lines), HD flies expressing elav-GAL4 driven NT-Htt128Q or FL-Htt200Q alone (black dotted lines), or HD flies crossed to loss of function mutation (LOF) or knock-down (shRNA) lines of Drosophila homologs of Gpr52 or Rabgap1l (red lines). Lowering Gpr52 rescues the motor behavior deficits, whereas lowering Rabgap1l enhances the phenotype. n = 15, statistical analysis performed by one way ANOVA and Dunnett's post-tests.
Videos
Video 1
The representative video showing that lowering Gpr52 rescues the in vivo fly full-length HD models–linked to Figure 5D, the lower panel.
https://doi.org/10.7554/eLife.05449.015Download links
A two-part list of links to download the article, or parts of the article, in various formats.
Downloads (link to download the article as PDF)
Open citations (links to open the citations from this article in various online reference manager services)
Cite this article (links to download the citations from this article in formats compatible with various reference manager tools)
A striatal-enriched intronic GPCR modulates huntingtin levels and toxicity
eLife 4:e05449.
https://doi.org/10.7554/eLife.05449


