Rapid diversification associated with a macroevolutionary pulse of developmental plasticity
- Max Planck Institute for Developmental Biology, Germany
- Indiana University, United States
- Forestry and Forest Products Research Institute, Japan
Figures
Figure 1
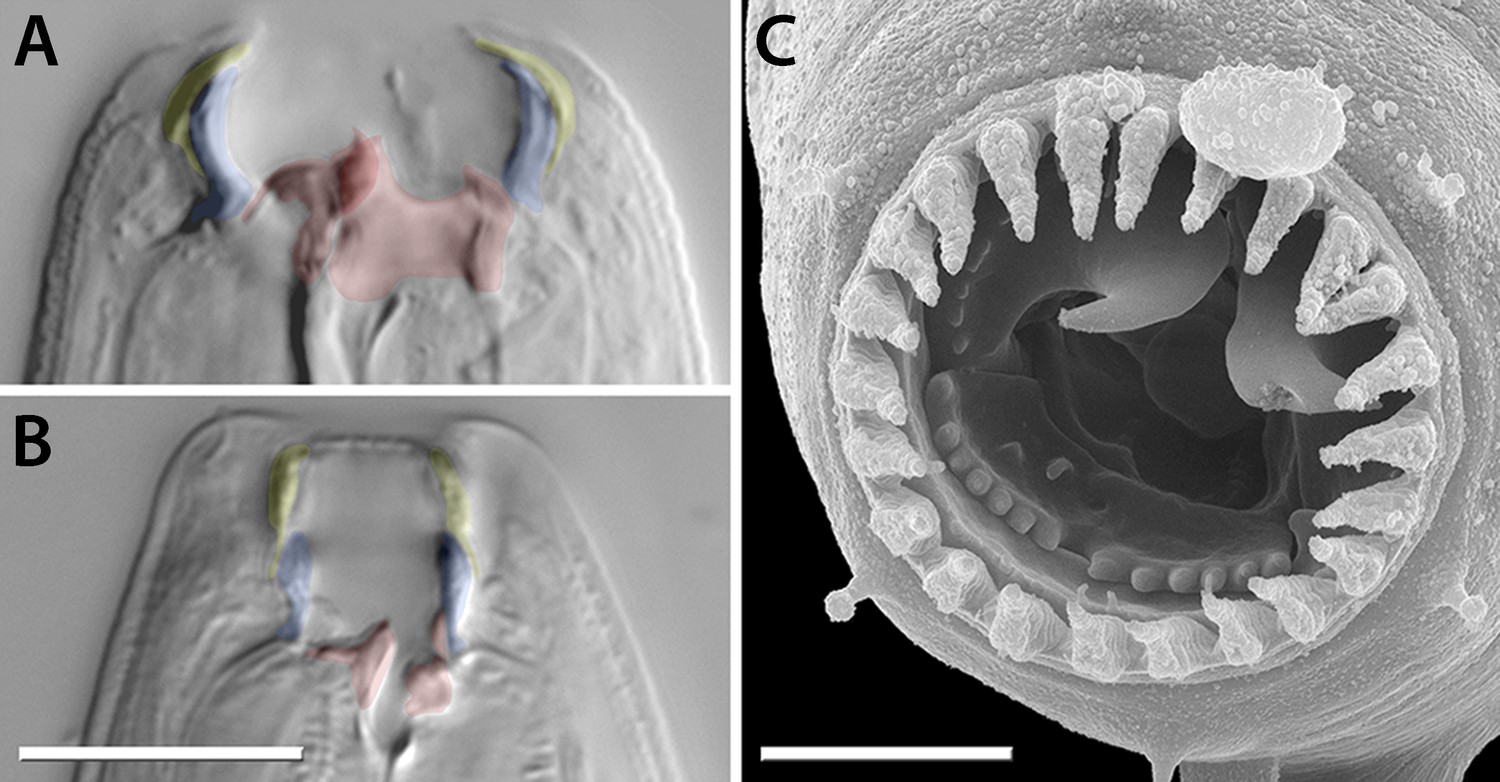
Mouth dimorphism and novelty in Diplogastridae.
(A) The diplogastrid eurystomatous (Eu) morph, as shown here for Parapristionchus giblindavisi, is marked by a wider mouth, larger teeth, and often greater stomatal complexity than the stenostomatous (St) morph. (B) P. giblindavisi, St morph. False coloring in (A and B) indicates individual cuticular compartments of the mouth, providing a basis for tracking changes in homologous structures (yellow, cheilostom; blue, gymnostom; red, stegostom except telostegostom). View in (A and B) is right lateral and at same scale. Scale bar, 10 µm. (C) Opposing teeth, shown here for Fictor sp. 1, are a structural novelty of Diplogastridae and used for predatory feeding. Visible serrated plates are among other feeding innovations of Diplogastridae. Dorsal is right; scale bar, 5 µm.
Figure 2

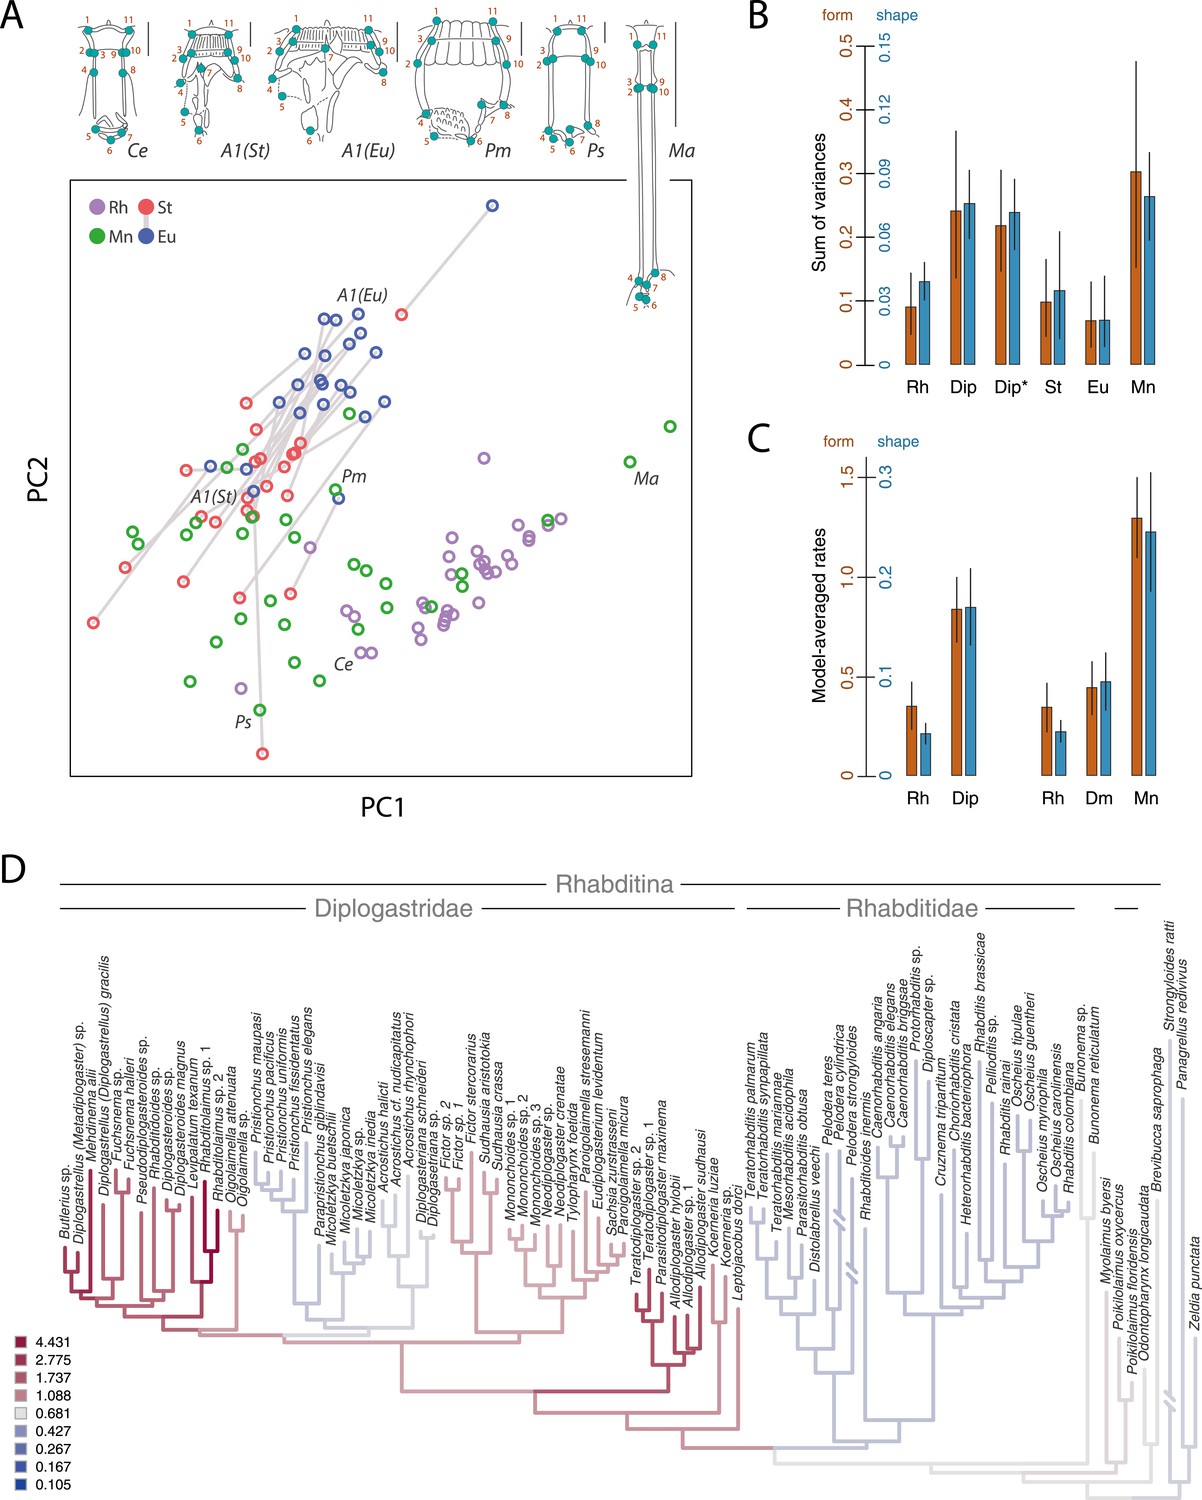
A radiation of feeding structures in diplogastrid nematodes.
(A) Phylogenetic relationships inferred for nematodes of Rhabditina, including 54 species of Diplogastridae (Figure 2—source data 1A,B) from an alignment including SSU rRNA, LSU rRNA, and 11 ribosomal protein genes (for Diplogastridae, 468 kb excluding missing data), and RNA polymerase II. History of dimorphism inferred by stochastic character mapping on the set of sampled Bayesian posterior trees (consensus tree is shown). **100% posterior probability (PP); *99% PP. (B) Morphological diversity of mouthparts in Diplogastridae (light blue and white blocks), which are strikingly complex with respect to outgroups (yellow block). The origin of plasticity coincided with a radiation of complex feeding-forms, which variously include opposing teeth, bilateral asymmetry, and additional armature and articulations. In shape, form, and complexity, the mouths of outgroups (Ri, Ce, Hb) are more similar to the St than the Eu morph of dimorphic species. For dimorphic taxa, Eu morph is shown. Two-letter designations abbreviate Linnaean binomials of depicted species.
-
Figure 2—source data 1
Nematode taxa used in this study, with isolation details given.
(A) Origins of strains are coded as follows: CGC, Caenorhabditis Genetics Center; JB, Baldwin lab (U. California, Riverside); MV, Viney lab (U. Bristol); NK, Kanzaki lab; RGD, Giblin-Davis lab (U. Florida-IFAS); RS, Sommer lab; SB, Sudhaus lab (Freie Universität Berlin). For other strains, references are given. nc, not culturable. (B) GenBank accession numbers for gene sequences analyzed in this study. Sequences shorter than 200 bp (with accession numbers beginning with ‘VS’) are available at www.pristionchus.org/download/suppSusoy2014.html.
- https://doi.org/10.7554/eLife.05463.007
Figure 3 with 3 supplements
Developmental plasticity, morphological disparity, and evolutionary tempo in diplogastrid nematodes.
(A) Stomatal morphology and positions of 11 two-dimensional landmarks (taxa coded in Figure 2). Below is a projection of the first two principal components of stomatal shape-space. Purple circles represent non-diplogastrid Rhabditina (Rh), green circles mark monomorphic Diplogastridae (Mn); blue and red circles connected by lines mark St and Eu morphs, respectively, of dimorphic Diplogastridae. (B) Phenotypic disparity of non-diplogastrid Rhabditina (Rh), Diplogastridae (Dip, dimorphic taxa are represented by St morph; Dip*, by both morphs), and individually of St, Eu, and monomorphic (Mn) Diplogastridae, as estimated by the sum of variances on shape- and form-space axes. Bars show mean values from 10,000 bootstrap replicates. Whiskers represent a 95% confidence interval. (C) Model-averaged relative estimates of evolutionary rates, as estimated under a Brownian motion model. Both a two-rate model (left) and a three-rate model (right) are shown (Dm, dimorphic Diplogastridae as represented by St morph). Bars are mean rates calculated across 5000 reconstructions of dimorphism history and 500 trees. Whiskers represent the standard deviation. (D) Rate estimates of stomatal form evolution in Rhabditina. In dimorphic taxa, rates are for St morph. Branch color indicates rates of evolutionary change; posterior rates are color-coded in legend.
-
Figure 3—source data 1
Results from analyses of principle components, disparity, and evolutionary rates.
(A) Results of principal component analysis of stomatal form in Rhabditina, including both morphs of dimorphic taxa.
Loadings of Procrustes coordinates and log centroid size of stomatal form onto the first four principal component (PC) axes are shown, as are the proportion of variance explained by those PC axes (B) Results of principal component analysis of stomatal shape in Rhabditina, including both morphs of dimorphic taxa. Loadings of Procrustes coordinates of stomatal shape onto the first four principal component (PC) axes are shown, as are the proportion of variance explained by those PC axes. (C) Results of phylogenetic principal component analysis of stomatal form in Rhabditina, with dimorphic taxa represented by the stenostomatous (St) morph. Loadings of Procrustes coordinates and log centroid size of stomatal form onto the first four principal component (PC) axes are shown, as are the proportion of variance explained by those PC axes. (D) Results of phylogenetic principal component analysis of stomatal shape in Rhabditina, with dimorphic taxa represented by the stenostomatous (St) morph. Loadings of Procrustes coordinates of stomatal shape onto the first four principal component (PC) axes are shown, as are the proportion of variance explained by those PC axes. (E) Estimates of morphological disparity of the stoma in Rhabditina. Groups compared were non-diplogastrid Rhabditina, monomorphic Diplogastridae, and dimorphic Diplogastridae. Disparity was measured as the principal component (PC) analysis volume and the sum of univariate variances. PC scores along the first two and three PC axes of Procrustes form and shape space, respectively, were used and are presented in the form mean ± standard deviation (95% confidence interval). Eu, eurystomatous; St, stenostomatous. (F) Rates of stomatal evolution along the first principal component (PC) axis of Procrustes form- and shape-space. Rates were compared for non-diplogastrid Rhabditina (Rh), dimorphic Diplogastridae (Dm), and monomorphic Diplogastridae (Mn). Numbers indicate separate rate parameters for the designated groups. Model-averaged rates with standard deviation are shown. (G) Statistical comparison of non-nested models of stomatal evolution along the first principal component (PC) axis of Procrustes form- and shape-space using a chi-square distribution. Numbers indicate separate rate parameters for the designated groups. Rh, non-diplogastrid Rhabditina (Rh); Dm, dimorphic Diplogastridae; Mn, monomorphic Diplogastridae. (H) Highest posterior densities (HPD) of rates, and associated p-values obtained from two-tailed randomization tests, of stomatal form and shape evolution. Tests were performed for the branches assigned to non-diplogastrid Rhabditina, dimorphic Diplogastridae, and monomorphic Diplogastridae. CI, confidence interval.
- https://doi.org/10.7554/eLife.05463.009
Figure 3—figure supplement 1
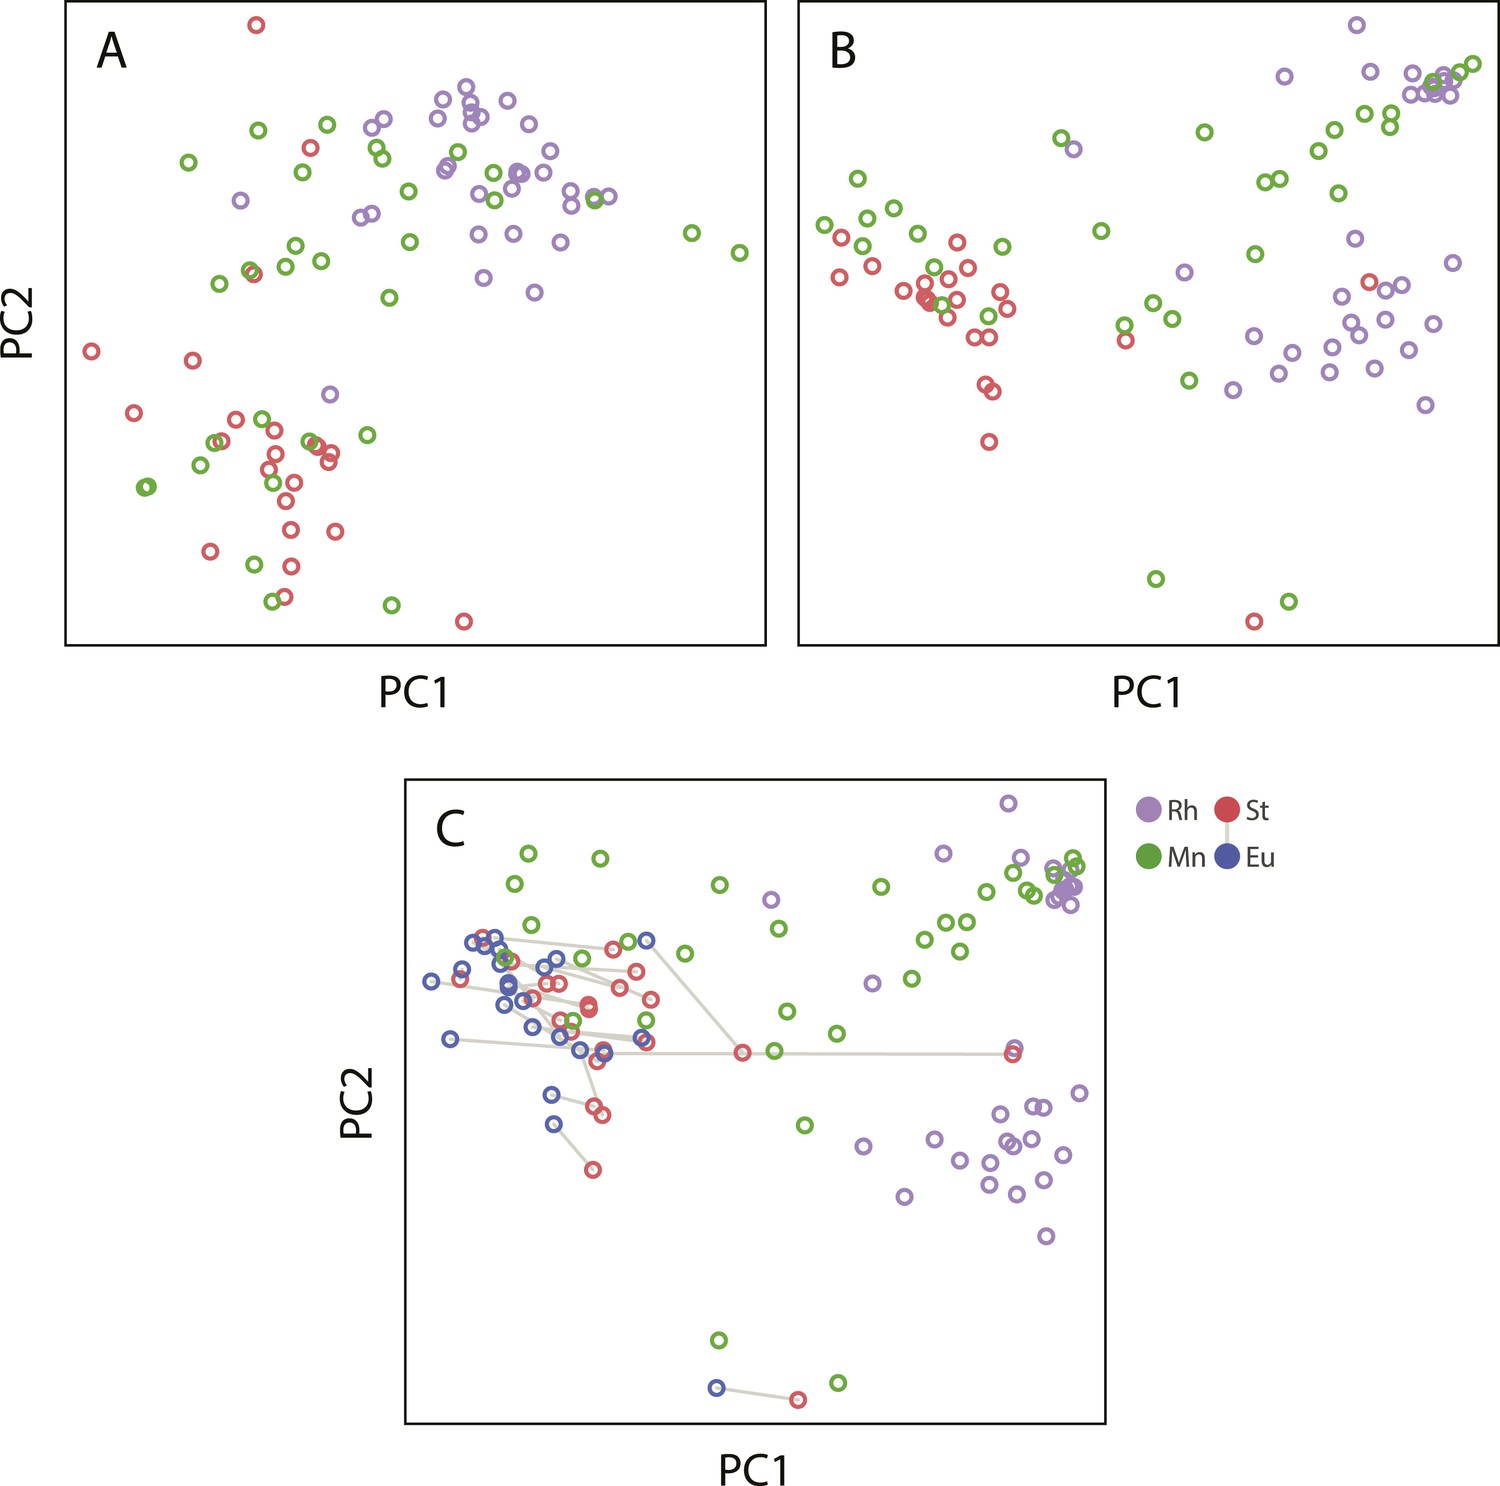
Projections of the first two principal components of Procrustes morphospace of stomatal landmarks.
In phylogenetic principal components analysis (phylogenetic PCA), dimorphic species are represented by the St morph. Purple circles represent non-diplogastrid Rhabditina (Rh), green circles mark monomorphic Diplogastridae (Mn); red circles, St morph of dimorphic Diplogastridae; blue and red circles connected by lines mark St and Eu morphs of individual dimorphic species. (A) Phylogenetic PCA of form. (B) Phylogenetic PCA of shape. (C) PCA of shape.
Figure 3—figure supplement 2

Rate estimates of stomatal shape evolution in Rhabditina.
In dimorphic taxa, rates are for St morph. Branch color indicates rates of evolutionary change; posterior rates are color-coded in legend.
Figure 3—figure supplement 3

Posterior densities of rates of stomatal form and shape evolution in Rhabditina.
Bars below represent highest posterior density intervals of weighted rate estimates for the groups. Rh, non-diplogastrid Rhabditina; Dm, dimorphic Diplogastridae; Mn, monomorphic Diplogastridae. (A) Rates of change of Procrustes form. (B) Rates for Procrustes shape. Results from analyses of form show both groups of Diplogastridae to have higher rates than monomorphic outgroups, although rates were highest in secondarily monomorphic lineages. Analyses of shape also clearly show higher rates in Diplogastridae as compared with outgroups.
Figure 4 with 1 supplement
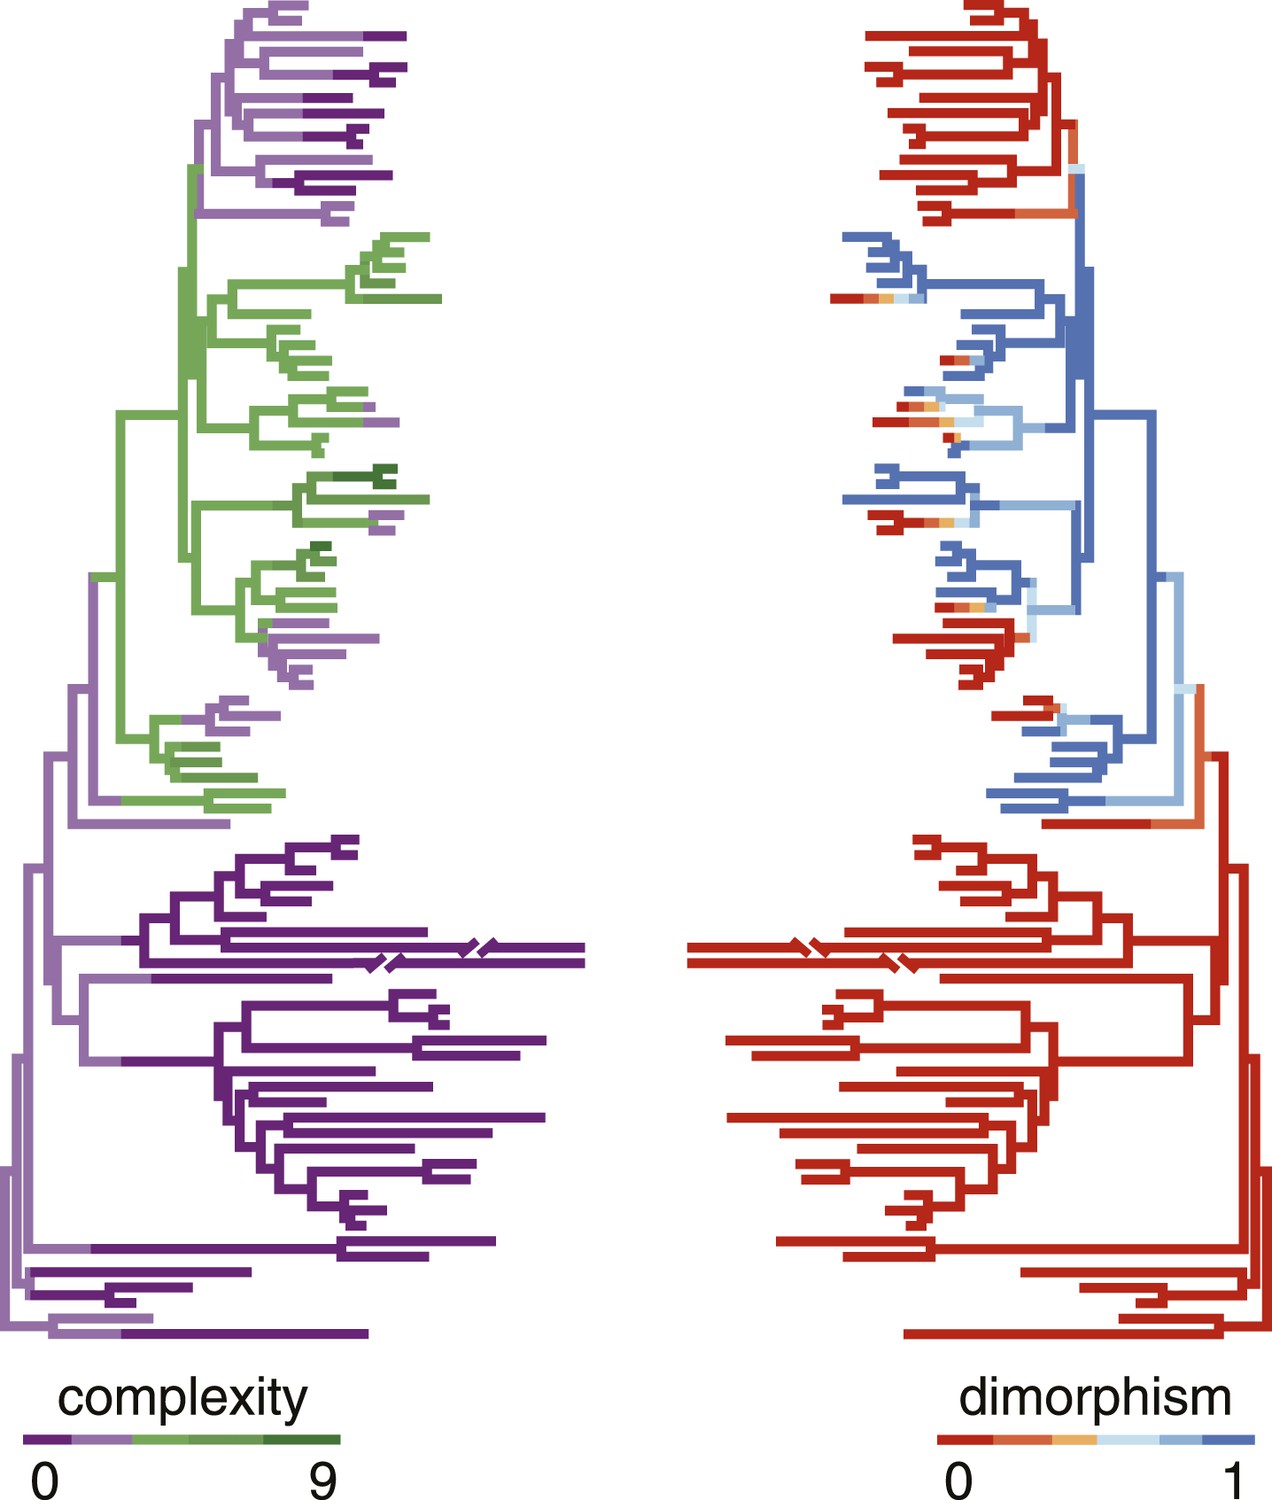
Correlation of polyphenism and complexity of nematode mouthparts.
Painted branches show congruence of simulated character histories of dimorphism (right tree; 0 = absent, 1 = present) and stomatal complexity (left tree; complexity index ranges from 0 to 9). Covariance tests (see text) show that the apparent phylogenetic correlation between dimorphism and complexity is significant.
-
Figure 4—source data 1
Matrix of structures tabulated to measure stomatal complexity.
Structures were recorded as described in text. Presence/absence of dimorphism is also given. 0 = absence, 1 = presence.
- https://doi.org/10.7554/eLife.05463.014
Figure 4—figure supplement 1

Tabulating complexity of nematode mouthparts.
The complexity index (ci) was tabulated as the sum of all stomatal ‘structures’, that is, geometric deviations marked by a <135° vertex from the cylindrical walls of the stoma or from the arched anterior margins of the pharyngeal radii. Tabulated structures are false-colored on illustrations of four example species. Iterative structures and bilaterally symmetrical duplicates were scored as a single structure due to their co-dependence. All aspects are left and lateral unless otherwise specified. Color-coded structures are recorded in Figure 4—source data 1: red, dorsal tooth; pink, right subdorsal denticle; orange, left subventral tooth; yellow, dorsal, basal stegostomatal fold; mauve, gymnostomatal serratae (iterative); dark green, articulated apodeme (bilaterally symmetrical); light blue, radial cheilostomatal divisions (iterative); teal, subventral stegostomatal warts (iterative); purple, left subventral ridge. (A) Mononchoides sp. 3 (ci = 8), right lateral aspect. An additional structure (pro- and mesostegostomatal serratae) is not observable from this aspect. (B) Paroigolaimella micrura (ci = 3). (C) Koerneria luziae (ci = 4). (D) Fuchsnema halleri (ci = 1).
Tables
Table 1
Environmental regulation of the mouth dimorphism across diplogastridae
| Dimorphic nematode species | Treatment type | % Eu, treatment | % Eu, control | Odds ratio |
|---|---|---|---|---|
| Allodiplogaster sp. 1 | Prey | 100 | 0 | |
| Allodiplogaster sudhausi | Prey | 97 | 1 | 1080.976 |
| Diplogasteriana n. sp. | Starved | 24 | 0 | |
| Fictor stercorarius | Prey | 96 | 0 | |
| Koerneria luziae | Starved | 5 | 0 | |
| Micoletzkya inedia | Prey | 95 | 0 | |
| Micoletzkya japonica | Prey | 92 | 0 | |
| Mononchoides sp. 1 | Prey | 98 | 10 | 120.272 |
| Mononchoides sp. 3 | Prey | 100 | 6 | |
| Neodiplogaster sp. | Prey | 100 | 0 | |
| Parapristionchus giblindavisi | Starved | 34 | 6 | 8.428 |
-
The presence of prey nematode (C. elegans) larvae and the absence of bacterial food (‘prey’ treatment) induced development of the Eu morph in strains normally St-biased on an abundance of bacterial food (control). For species that could not reach adulthood on this regimen, conditions of overpopulation and starvation (‘starved’ treatment) similarly promoted the Eu morph. Effect size is given as the odds ratio (Fisher's exact test) where not infinite.
-
Table 1—source data 1
Environmental induction of the Eu morph in dimorphic species. Results for individual replicates (plates) are shown.
- https://doi.org/10.7554/eLife.05463.005
Additional files
-
Supplementary file 1
Two tree files and a multiple sequence alignment file.
- https://doi.org/10.7554/eLife.05463.016
Download links
A two-part list of links to download the article, or parts of the article, in various formats.
Downloads (link to download the article as PDF)
Open citations (links to open the citations from this article in various online reference manager services)
Cite this article (links to download the citations from this article in formats compatible with various reference manager tools)
Rapid diversification associated with a macroevolutionary pulse of developmental plasticity
eLife 4:e05463.
https://doi.org/10.7554/eLife.05463


