Tuning myosin-driven sorting on cellular actin networks
- University of Michigan, United States
Figures
Figure 1 with 2 supplements
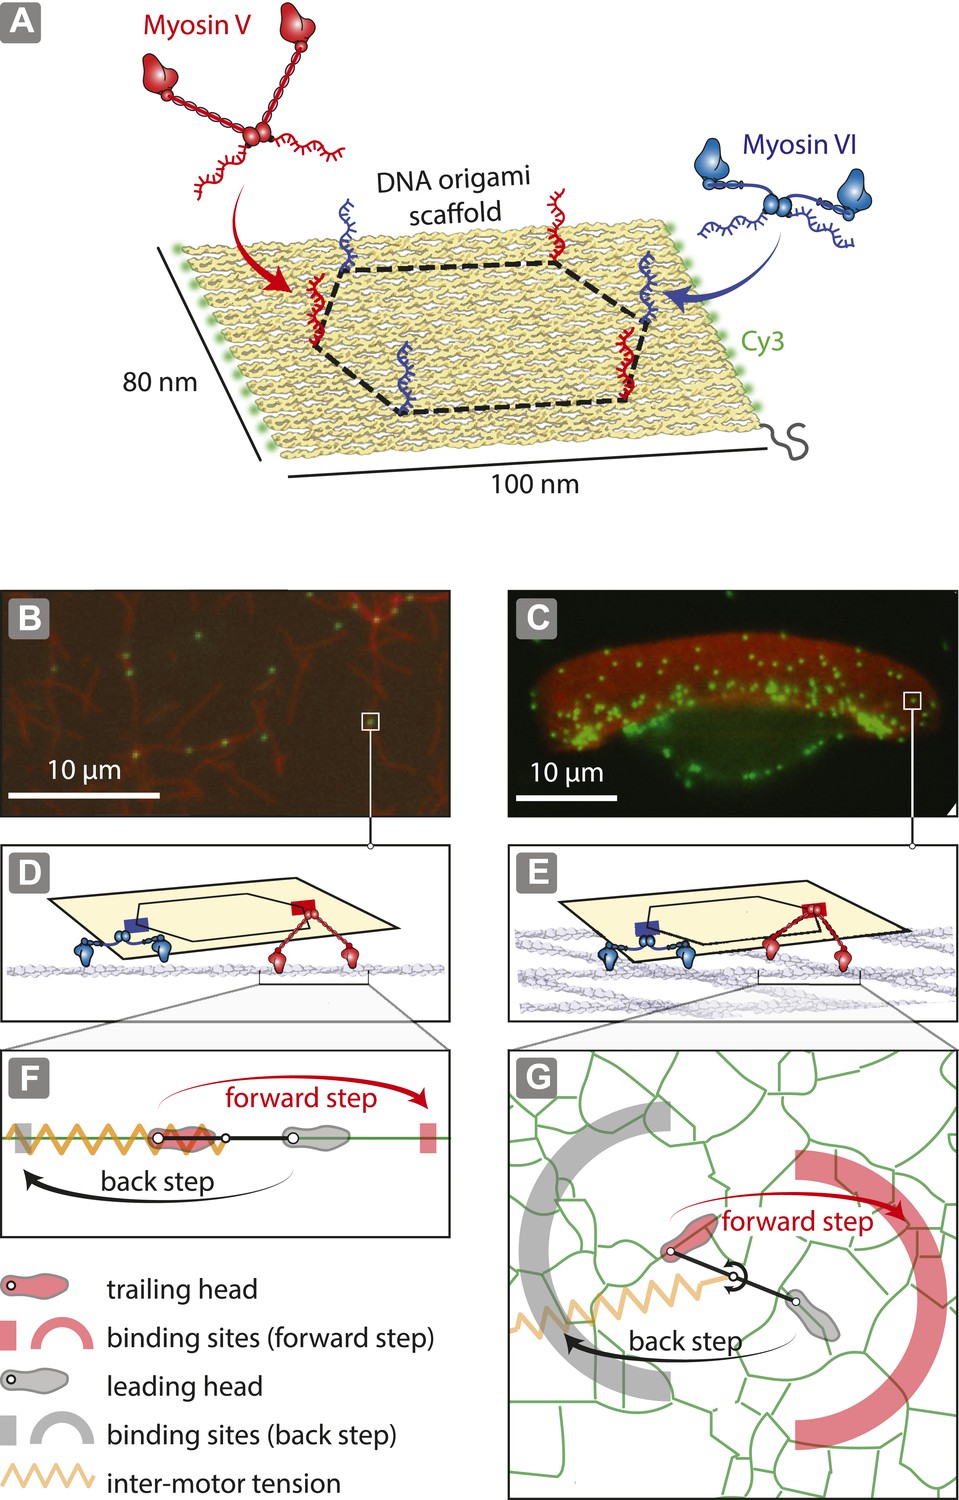
Reconstitution of myosin-driven cargo sorting on 1D and 2D actin tracks.
(A) Illustration of a programmable DNA scaffold (Rothemund, 2006) with six attachment sites at the vertices of a hexagon (dashed-line, 35-nm side), yielding 122 unique myosin V and VI combinations. Myosin V and VI were engineered with SNAP tags (Hariadi et al., 2014) for covalent attachment of unique DNA oligonucleotides. These DNA oligonucleotides hybridize with complementary sequences extending from the scaffold. (B–C) Representative snapshot of scaffold-motor complexes (green) on actin filaments (B) and a keratocyte actin network (C). Actin was stabilized and labeled with Alexa488-phalloidin (red). (D–E) Schematics depicting the interaction of scaffolds (yellow) with 1 myosin V (red) and 1 myosin VI (blue) on an actin filament (D) and on the surface of the keratocyte actin network (E). The motors and actin tracks are drawn approximately to scale. The keratocyte actin network is depicted by actin filaments oriented at ±35°, which corresponds to the characteristic Arp2/3 branch angle (Maly and Borisy, 2001). Mesh size of the keratocyte actin network (∼30 nm) (Svitkina et al., 1995) is comparable to the step size of myosin V (∼35 nm) and VI (∼30 nm) (Rock et al., 2001; Yildiz et al., 2003). (F–G) Hand-over-hand model of dimeric myosin stepping on 1D (F) and 2D (G) actin tracks. The competition between antagonistic myosins gives rise to inter-motor tension depicted as a simple harmonic spring (orange). For inter-motor tension below the stall force, the trailing head (light red) moves 36 nm forward (red arrow) to a new position within the forward-step target zone (shaded red areas), while the leading head (gray) remains stationary. High inter-motor tension induces a backward step (black arrow) of the leading head to a target site within the back-step target zone (shaded gray areas).
Figure 1—figure supplement 1
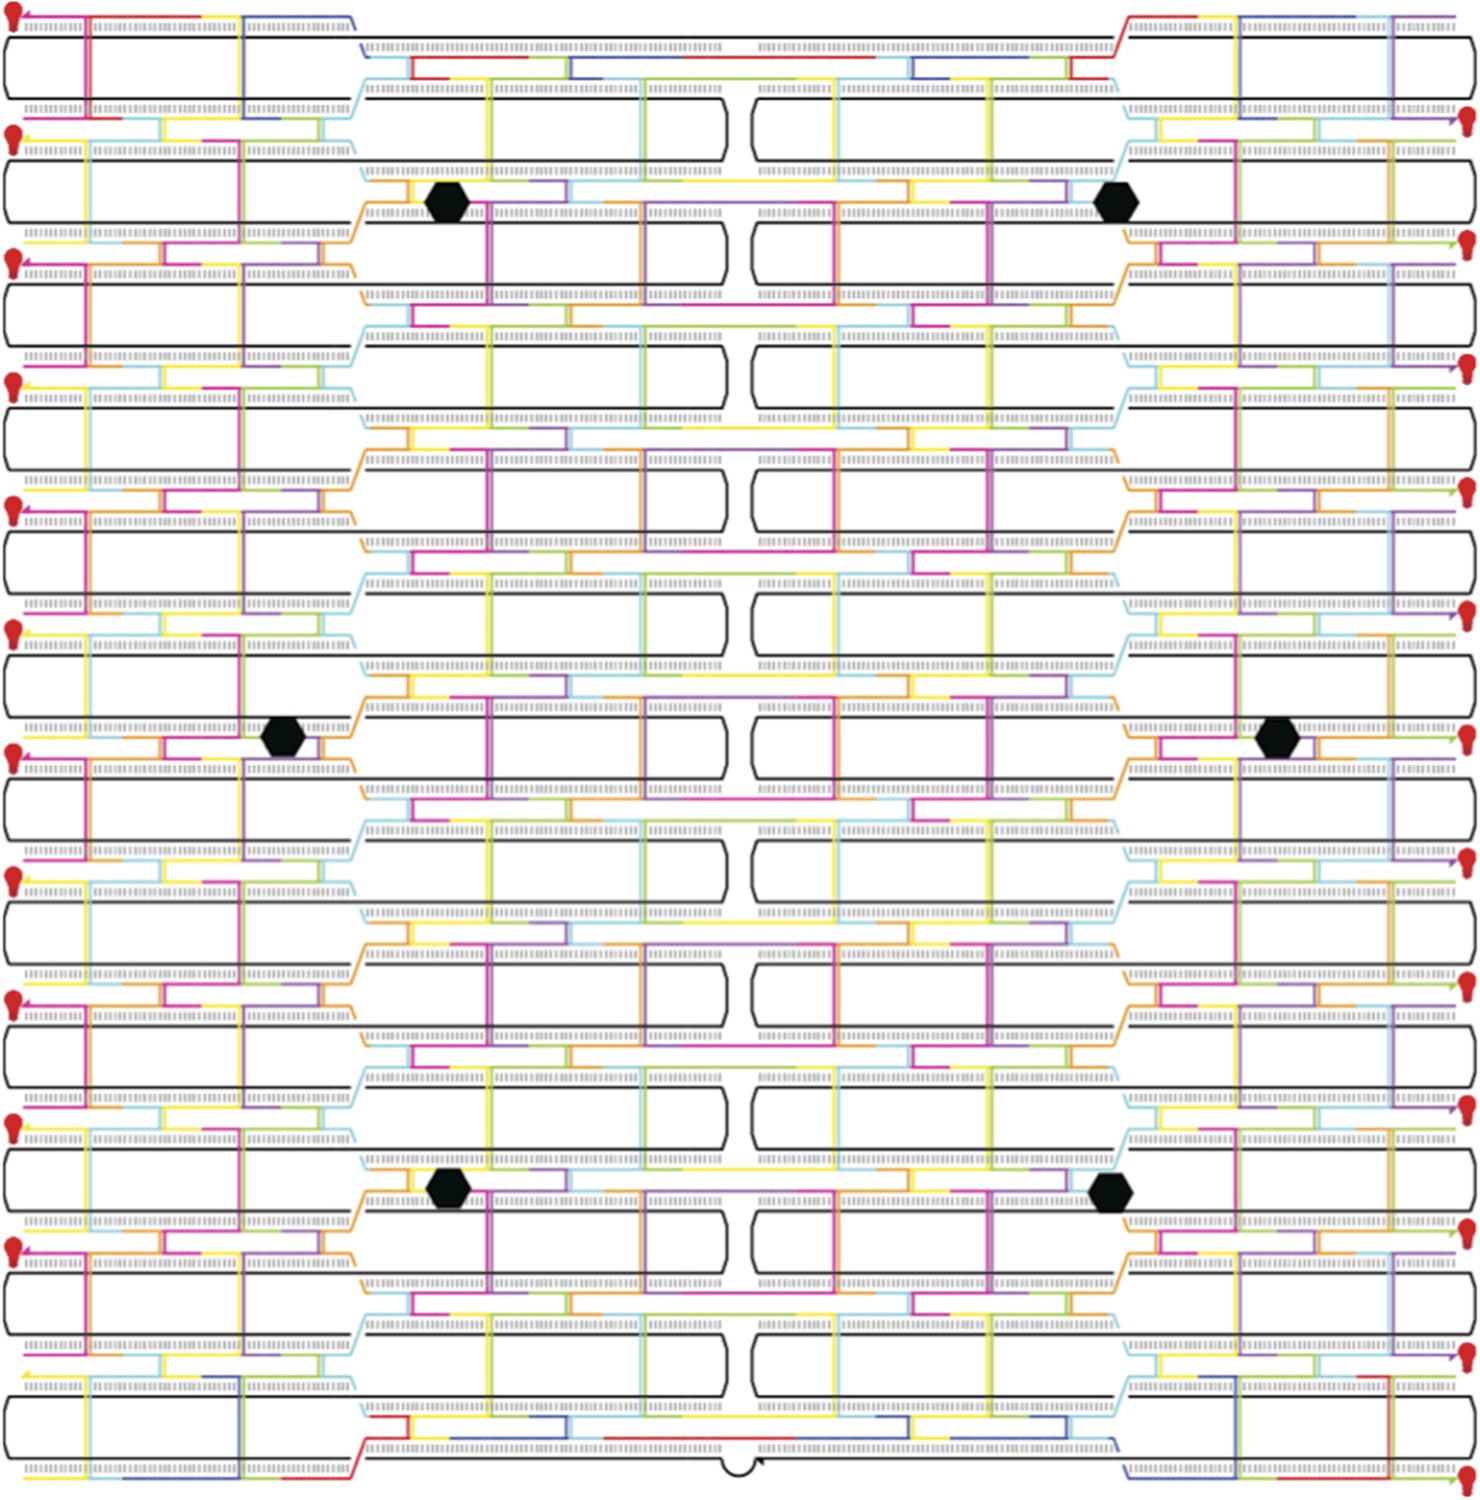
Flat rectangular DNA origami scaffold.
The main core of the nanostructure is a flat rectangular DNA origami scaffold with 10.44 bp/turn, consisting of 24 DNA helices (Woo and Rothermund, 2011). The scaffold strand is depicted as a continuous black line. The six attachment sites for myosin-DNA complexes are shown as black hexagons. The scaffold is decorated with 23 Cy3 fluorophores (shown as red light bulbs) to facilitate a high signal-to-noise ratio imaging.
Figure 1—figure supplement 2
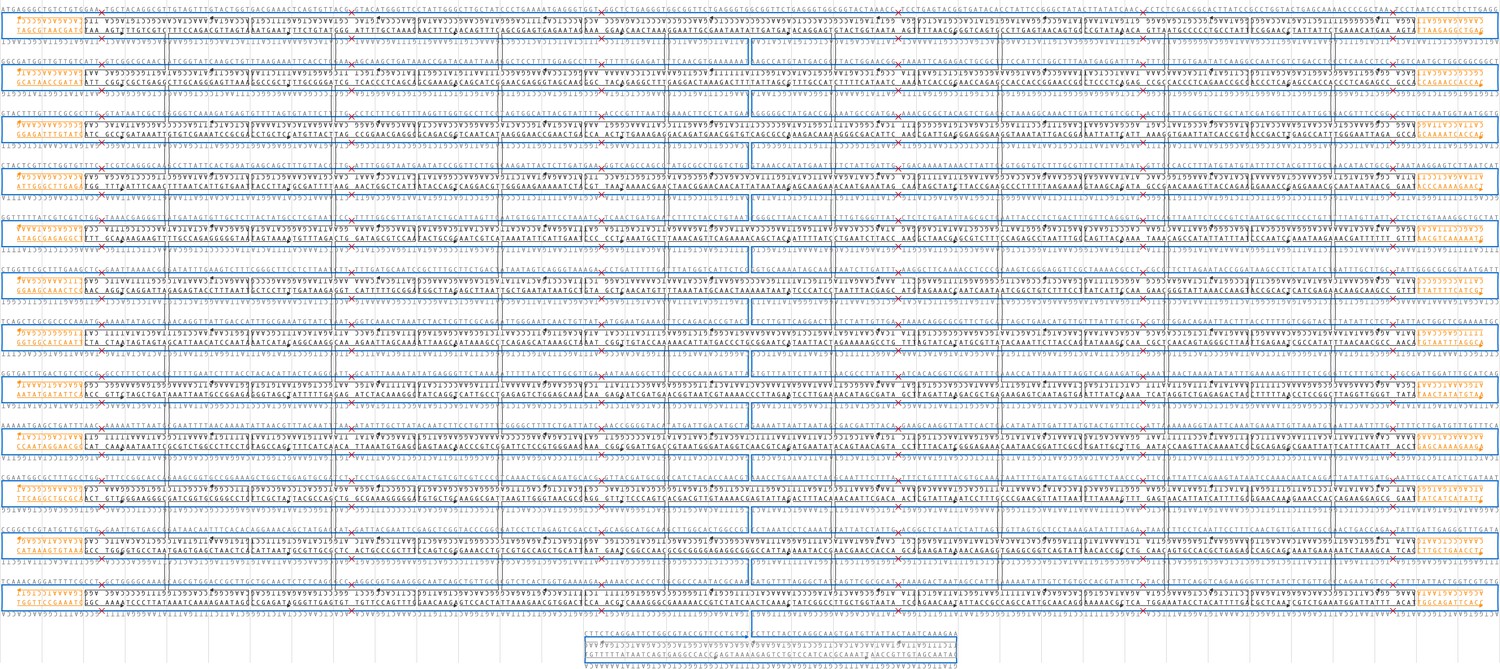
Sequence diagram for a flat rectangular DNA origami scaffold.
The scaffold strand is displayed in dark blue. The truncated edge staples strands are shown in orange. The staple strand sequences are listed in Supplementary file 1.
Figure 2
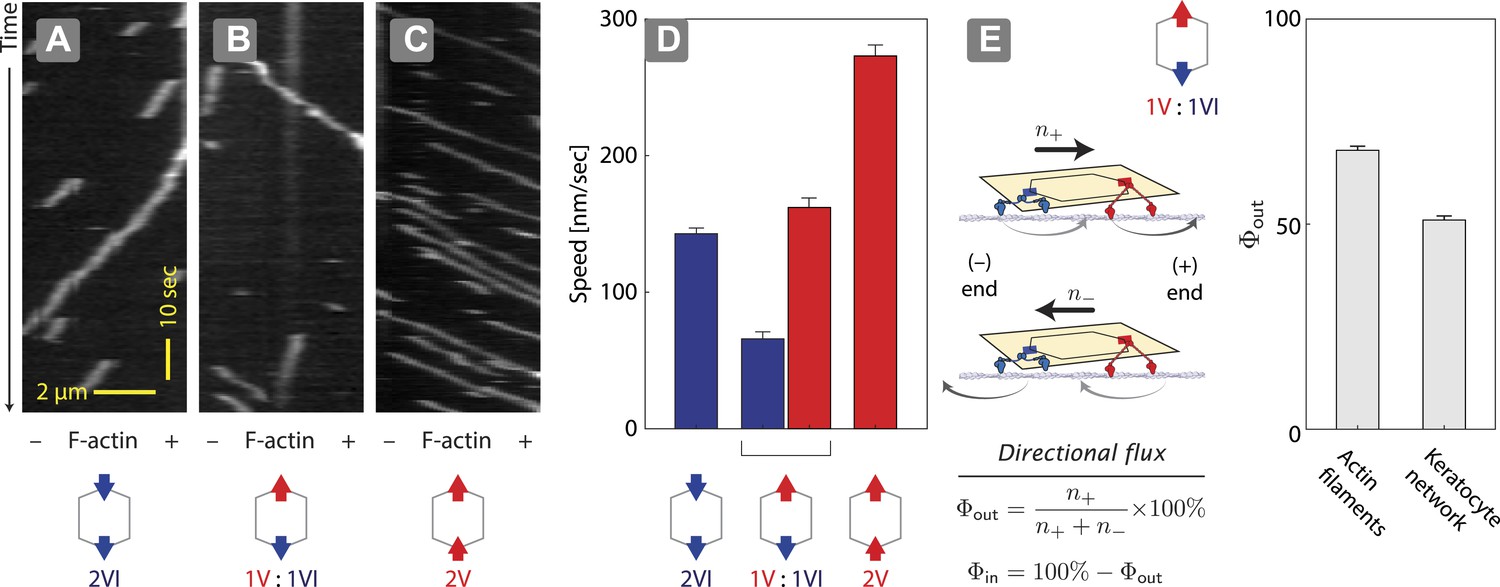
Unidirectional movement and sorting of scaffolds with myosin V and VI along single actin filaments.
(A–C) Kymographs showing the movement of indicated motor ensembles along actin filaments. Scaffolds with myosin V and VI display unidirectional movements toward plus-or minus-ends of the actin filament. The gray hexagon represents the organization of attachment sites on the scaffold, the red and blue arrows denote myosin V and VI, respectively. (D) Speed of plus-end (blue) and minus-end (red) directed movement of indicated scaffolds on actin filaments. Error bars are S.E.M. (E) Relative frequency of plus-end (n+) and minus-end (n−) directed movement for 1V:1VI scaffolds on actin filaments and keratocyte actin networks. Outward flux (Φout) is defined as the fraction of plus-end directed trajectories. Error bars are S.E.M. and were generated by bootstrapping (N ≥ 202 trajectories; ≥3 experiments).
Figure 3 with 1 supplement

Scaffolds show unidirectional movement along actin networks with directional flux controlled by relative motor number.
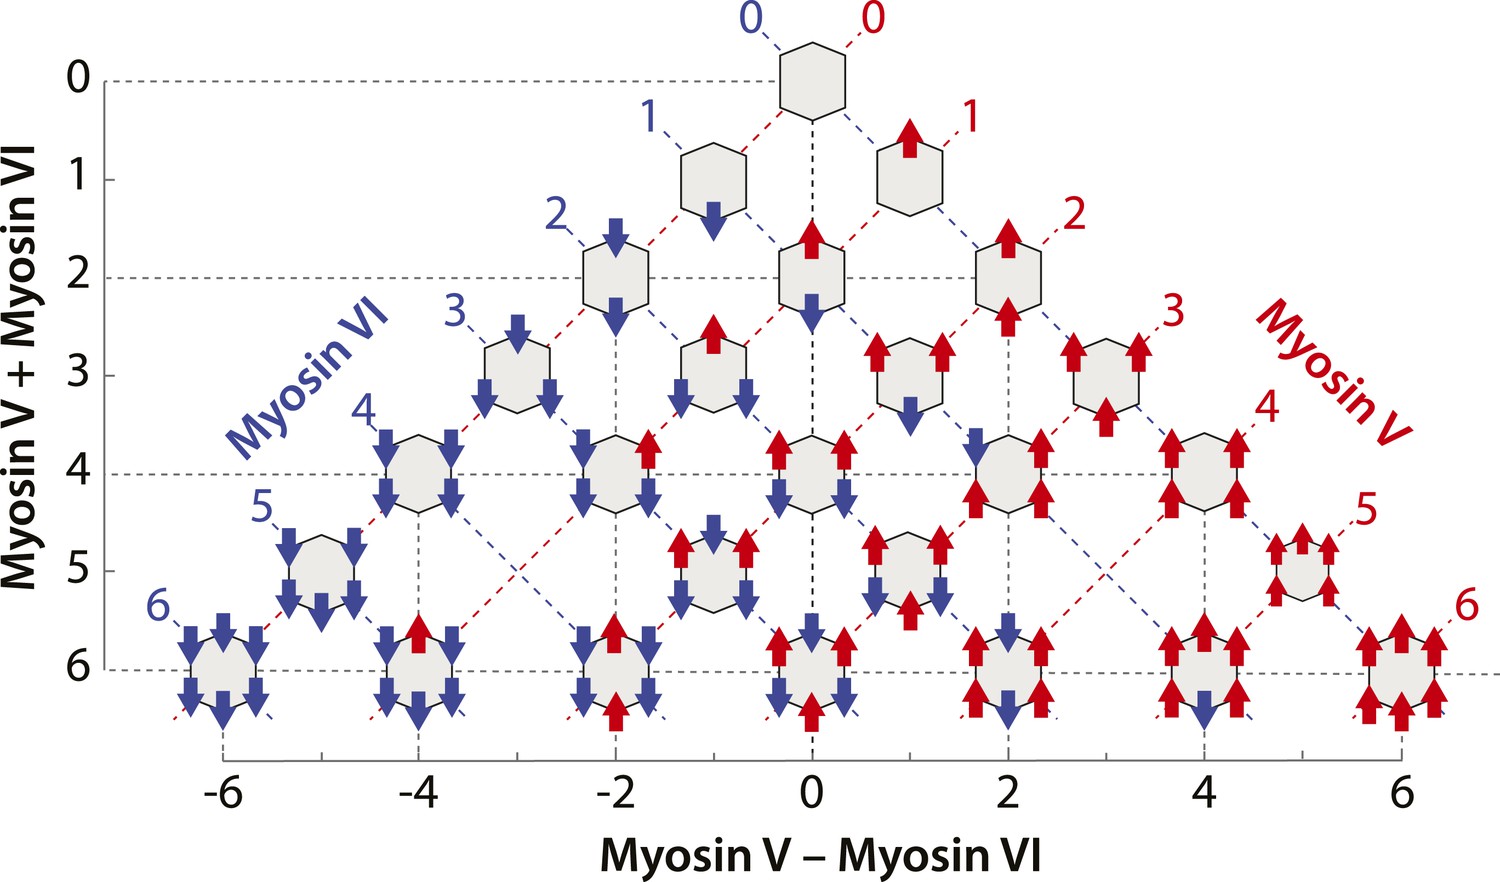
(A) Schematic of scaffold-myosin movement on the surface of the keratocyte actin network. Inward (Φin) and outward directional flux (Φout) are calculated as the fraction of myosin scaffolds moving towards the cell center and periphery, respectively. (B) Sample trajectories of scaffolds on keratocyte actin networks with movement towards the cell center in blue and the cell periphery in red. (C) Summary plot depicting influence of relative motor number on directionality (red and blue) and speed (radius). The plot is aligned such that the y-axis represents total motor number (myosin V + myosin VI), whereas the x-axis represents the difference between the two myosin types (myosin V − myosin VI). Red or blue dashed lines correspond to scaffolds with equal numbers of myosin V or VI motors, respectively. (D) Outward flux (Φout) varies linearly with the difference between the number of myosin V and VI (green line, R² = 0.80). Positive and negative values indicate net movement towards cell periphery and cell center, respectively. Error bars are S.E.M. and were generated by bootstrapping (N = 58–1897 trajectories; 3–4 keratocytes).
Figure 3—figure supplement 1
Scaffolds precisely patterned with myosin V and/or VI.
Configurations of myosin V and/or VI scaffolds (xV:yVI) used in this study. The table is aligned such that Y-axis represents total motor number (x + y), whereas X-axis represents the difference between the two myosin types (x − y). Red or blue dashed lines denotes scaffolds with equal numbers of myosin V or VI motors, respectively.
Figure 4
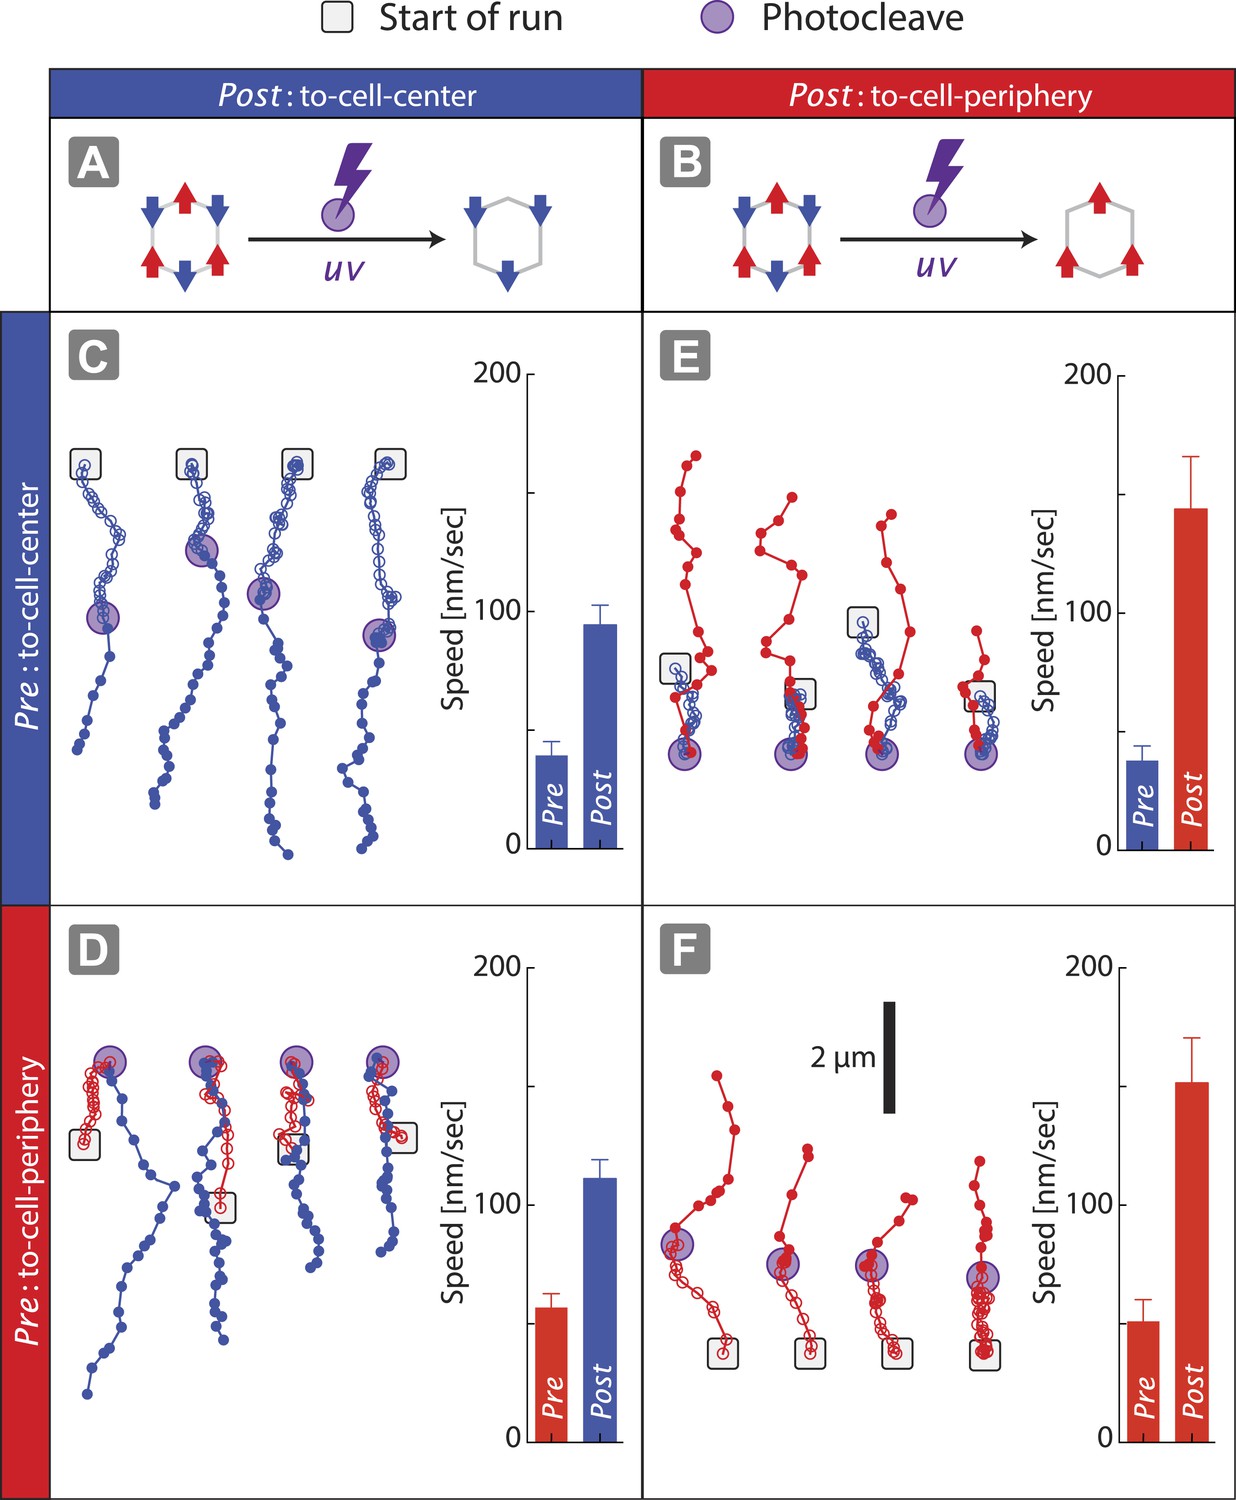
Disengagement of one motor species resolves the competition.
(A–B) Schematics of mixed-motor scaffolds (gray hexagons) with three myosin V (A; red arrows) or three myosin VI (B; blue arrows) attached by photo-cleavable linkers. UV-induced photo-cleavage (purple lightning bolt) converts mixed-motor scaffolds to scaffolds with only myosin VI (A) or only myosin V (B). (C–F) Representative scaffold trajectories for photo-cleavable experiments on keratocyte networks and their corresponding mean speed. Black squares mark the start of the trajectories, and purple circles indicate the start of photo-cleavage. Individual data points in each trajectory, before and after photo-cleavage, are indicated as open or closed circles, respectively. Disengagement of myosin V (C and D) or myosin VI (E and F) results in movement toward cell-center or cell-periphery, respectively. In all cases, photo-cleavage leads to significant increase in speed (p < 0.01). Error bars are S.E.M. (N ≥ 19 trajectories; ≥ 5 keratocytes).
Figure 5 with 3 supplements
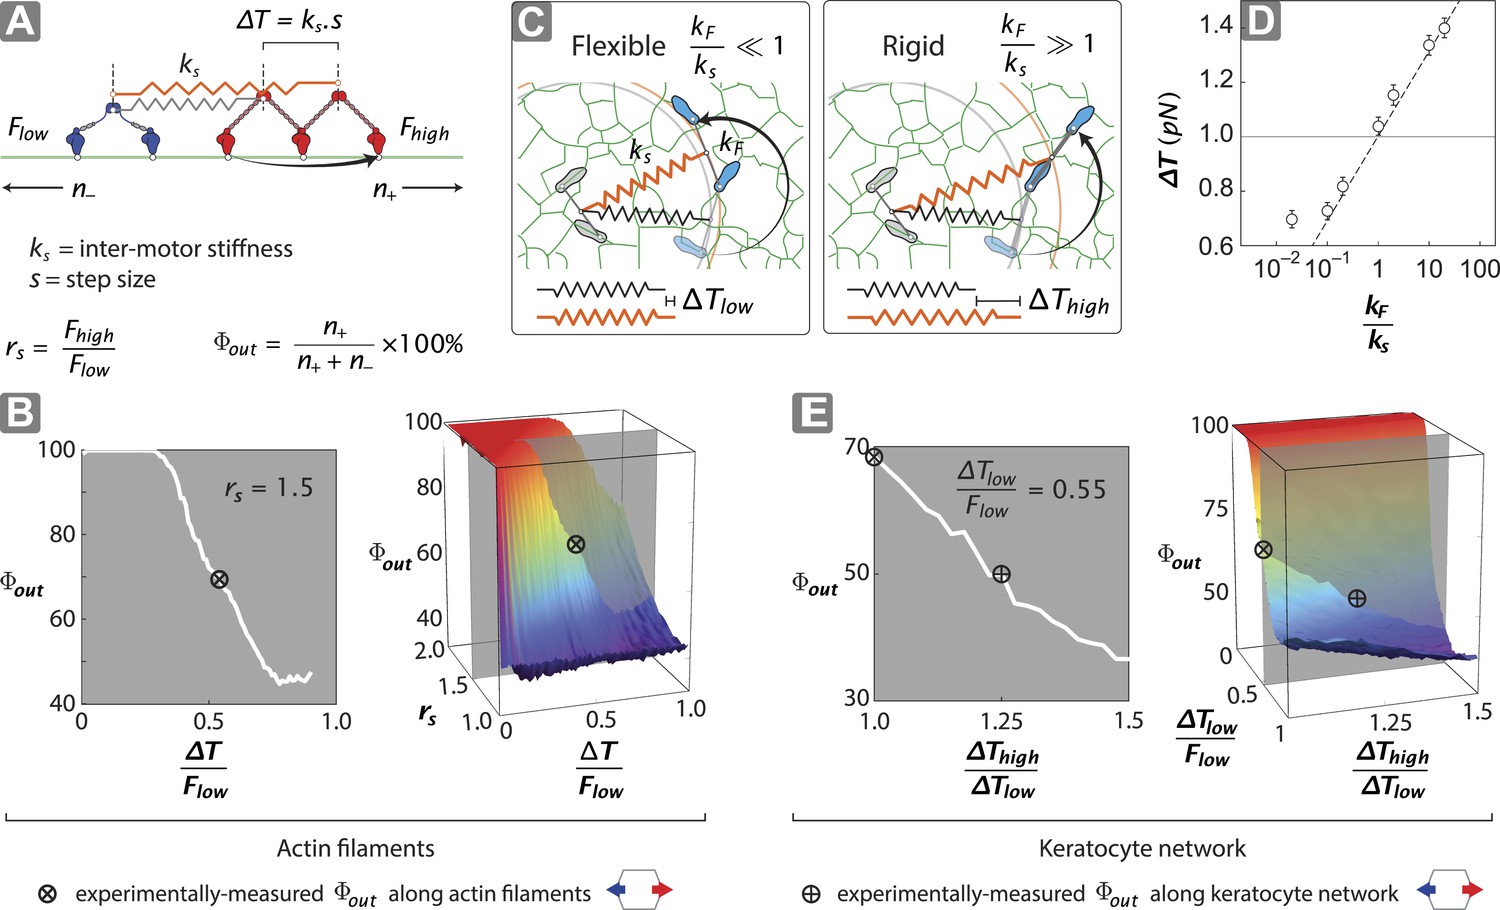
Stall force ratio, actin architecture, and myosin rigidity together tune directional flux.
(A) Minimal model of coupled myosin V (red) and myosin VI (blue) movement on an actin filament (green). The net compliance in the coupled system is modeled as a simple harmonic spring with stiffness ks. Each motor takes either a forward or backward step, based on whether the inter-motor tension after the step (T) is below or above the stall force (Flow − myosin VI; Fhigh − myosin V). (B) Outward flux of the mixed-motor ensemble (Φout) on single actin filaments as a function of the normalized inter-motor tension per step (∆T/Flow) and stall force ratio (rs = Fhigh/Flow). Based on previously reported stall forces for myosin V (Mehta et al., 1999; Uemura et al., 2004) and VI (Rock et al., 2001; Nishikawa et al., 2002; Altman et al., 2004), rs = 1.5 and is indicated by the gray shaded region (left). The corresponding experimentally measured Φout (⊗; Figure 2) and rs = 1.5 yield a ∆T/Flow = 0.55 ± 0.01. (C) Schematic forward step of a myosin with flexible (left) or rigid (right) lever arm on a digitized keratocyte actin network (green). The motor domains of the stepping motor (light blue shoes), non-stepping motor (gray shoes), lever arms, inter-motor linkage (pre-step—black spring; post-step—orange spring), and digitized actin network are drawn approximately to scale. The forward step results in an increase in both the inter-motor tension (∆T ks) and the intra-motor torsion (τ kF). A flexible forward stepping motor (kF/ks << 1) minimizes inter-motor tension (∆Tlow). A rigid forward stepping motor (kF/ks >> 1) minimizes intra-motor torsion (∆Thigh). (D) Simulated ∆T as a function of kF/ks. Varying lever arm rigidity (kF/ks) is sufficient to modulate ∆T. (E) Outward flux of the mixed-motor ensemble (Φout) on the keratocyte actin network as a function of the relative tension per step of the two motors (∆Thigh/∆Tlow). Gray shaded region (left) indicates the parameter space for ∆T/Flow = 0.55 ± 0.01 (see B). The corresponding experimentally measured Φout (⊕; Figures 2, 3) yields a ∆Thigh/∆Tlow = 1.20 ± 0.05. This enhanced ∆T for rigid motors evens out the competition on a branched 2D network compared to single filament tracks.
Figure 5—figure supplement 1
Description of stochastic simulation.
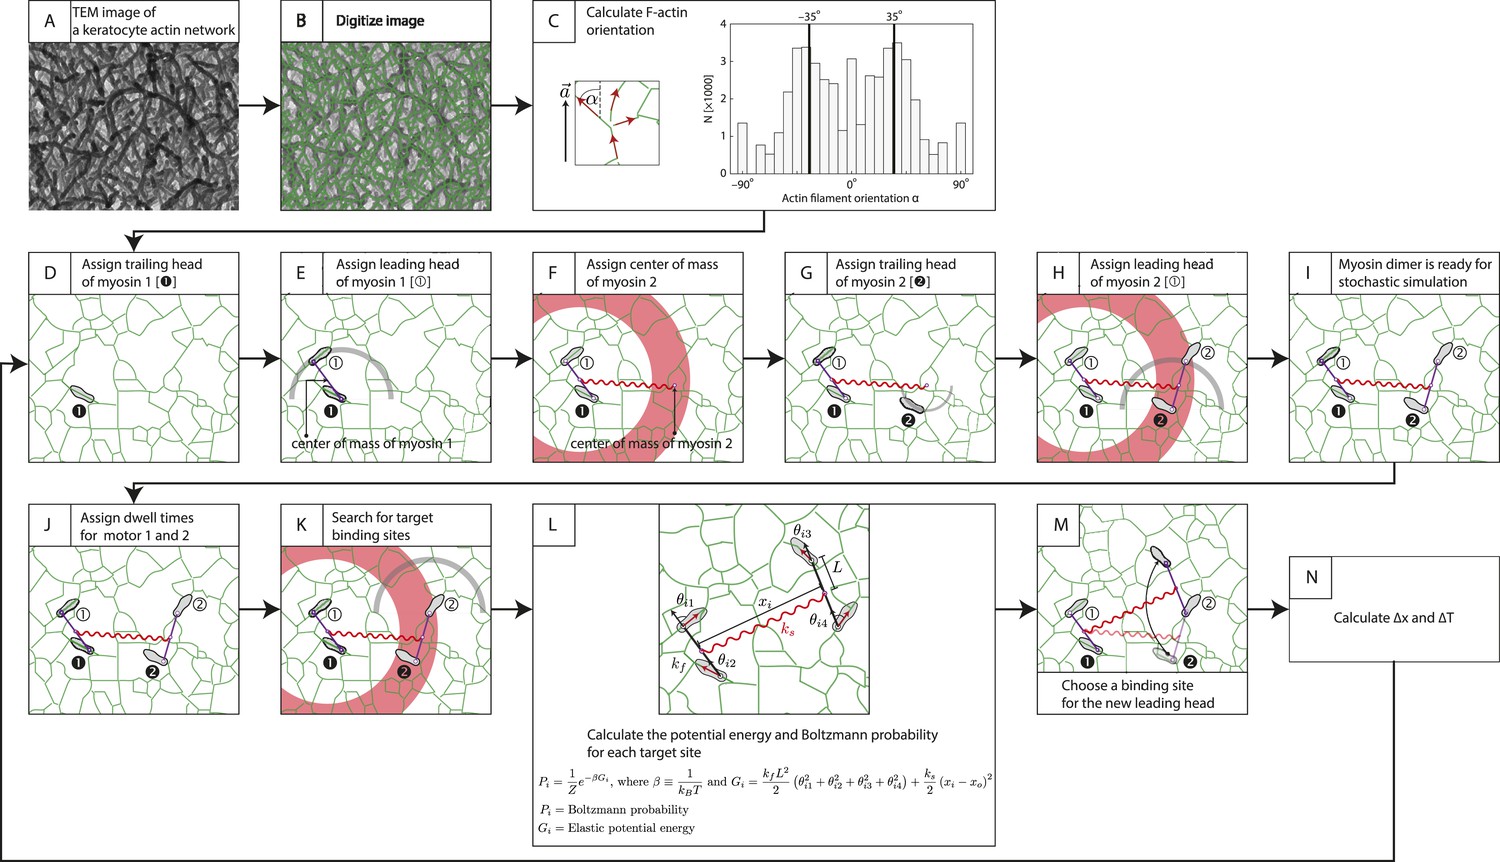
Stochastic simulations for myosin-scaffold movement along an actin network were performed in Mathematica based on the following rules (Hariadi et al., 2014). (A) TEM image of a keratocyte actin network (Hariadi et al., 2014). (B) To investigate the influence of network structure to the stepping dynamics (Figure 5—figure supplement 2), the TEM image in (A) was first scaled by a factor of 0.5–1.25. The image was then skeletonized to derive the position of actin filaments (green lines) as described in Sivaramakrishnan and Spudich (2009). Every pixel is a possible binding site for a myosin motor head. (C) Next, we calculated the orientation of each actin filament relative to the polarity field vector for each pixel in the digitalized image. A 7 × 7 box was centered over each pixel, and based on the skeletonized filament in the search box each pixel was fit to a linear function. The local filament direction was then calculated by taking the inverse tangent of this fit. Pixels that fit poorly ( < 0.25) were excluded (14% of the detected pixels in [B]) from the simulation. The energy for each binding site was calculated from these filament directions (see L). For our model, the myosin pair consisted of either two identical myosin dimers with lever arm stiffness kF. Each myosin dimer has two motor domains (gray sandals), and each myosin pair is linked through their centers of mass by a linear spring ks. Finally, in each myosin a leading (① or ②) and a trailing head is indicated. (D) Motor 1's trailing head is placed randomly on an actin filament. (E–H) The position of the leading head (E) and the second myosin (F–H) are randomly assigned with only two restrictions. First the inter-motor distance between myosin heads must be 36 ± 7.2 nm (gray arc; [E and H]). Second distance between the centers of mass of a motor pair must be 65 ± 15 nm (red ring; [F and H]). (I) The position of all motor heads, the centers of mass for each myosin dimer, and the center of the two centers of mass are tracked during each simulation step. (J) Myosin V and VI dimers step stochastically on actin filaments with exponentially distributed dwell times. In our simulations, an exponential distribution of mean dwell times based on the cycle rates of myosin V and VI (De La Cruz et al., 1999, De La Cruz et al., 2001) was used to derive the dwell times for each motor step. In this example, t1> t2 and myosin 2 moves first. (K) For a motor to step, the trailing head of motor (motor 2) pivots about the lead head and its binding site is determined by the following criteria: (a) The binding site must be 36 ± 7.2 nm pixel from the leading head (gray arc). (b) The new center of mass for stepping motor (motor 2) must be within 65 ± 15 nm (red ring) from the center of mass of the non-stepping motor (myosin 1). (c) The stepping myosin must proceed in a forward direction determined by the actin network polarity. (L) For each pixel meeting these requirements (i), the energy Gi and Boltzmann probability Pi are calculated. (M) A binding site for each new leading head is then stochastically choosen based on the calculated Boltzmann probabilities calculated in (L). (N) The change in inter-motor tension is then calculated (∆T = ∆Tpost − ∆Tpre). The simulation was repeated for ≥400 times. The tension change ∆T was quantified and presented in Figure 5D, Figure 5—figure supplements 2, 3.
Figure 5—figure supplement 2
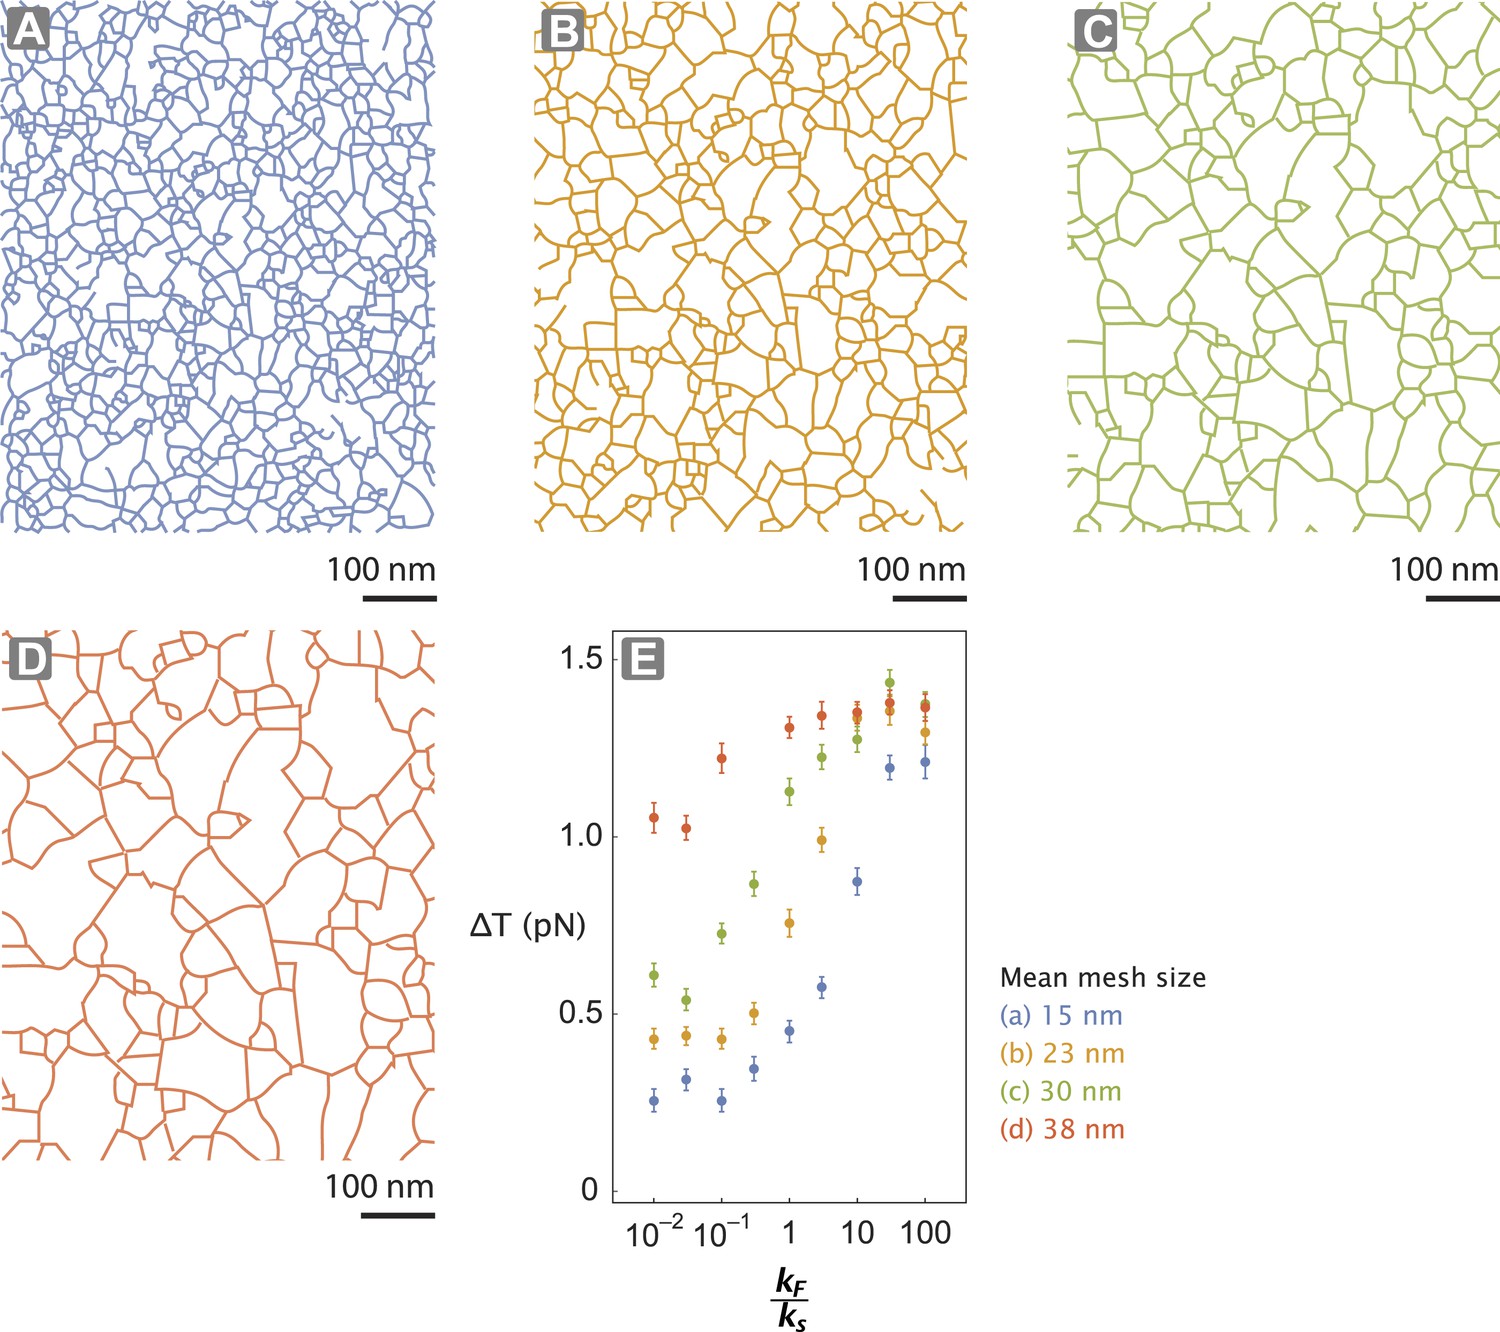
Actin network pore size alters tension generated.
(A–D) The interlaced actin network used in the stochastic simulation (Figure 5D–E and Figure 5—figure supplement 1). The network is generated by scaling a skeletonized TEM image of the keratocyte actin network by a factor of 0.5 (A—blue), 0.75 (B—orange), 1 (C—green), and 1.25 (D—red) (Figure 5—figure supplement 1). Given the mean pore size of the meshwork in the unscaled image (panel C; ∼30 nm (Svitkina and Borisy, 1998)), the mean mesh size of the generated networks is estimated to be 15 nm (A), 23 nm (B), 30 nm (C), and 38 nm (D). (E) For realistic flexibility of motor kF / ks < 10, tension generated per step (∆T) of myosin with kF / ks = 0.01–100 is influenced by the network structure. In these simulations, the inter-motor stiffness was set to 0.05 pN/nm.
Figure 5—figure supplement 3
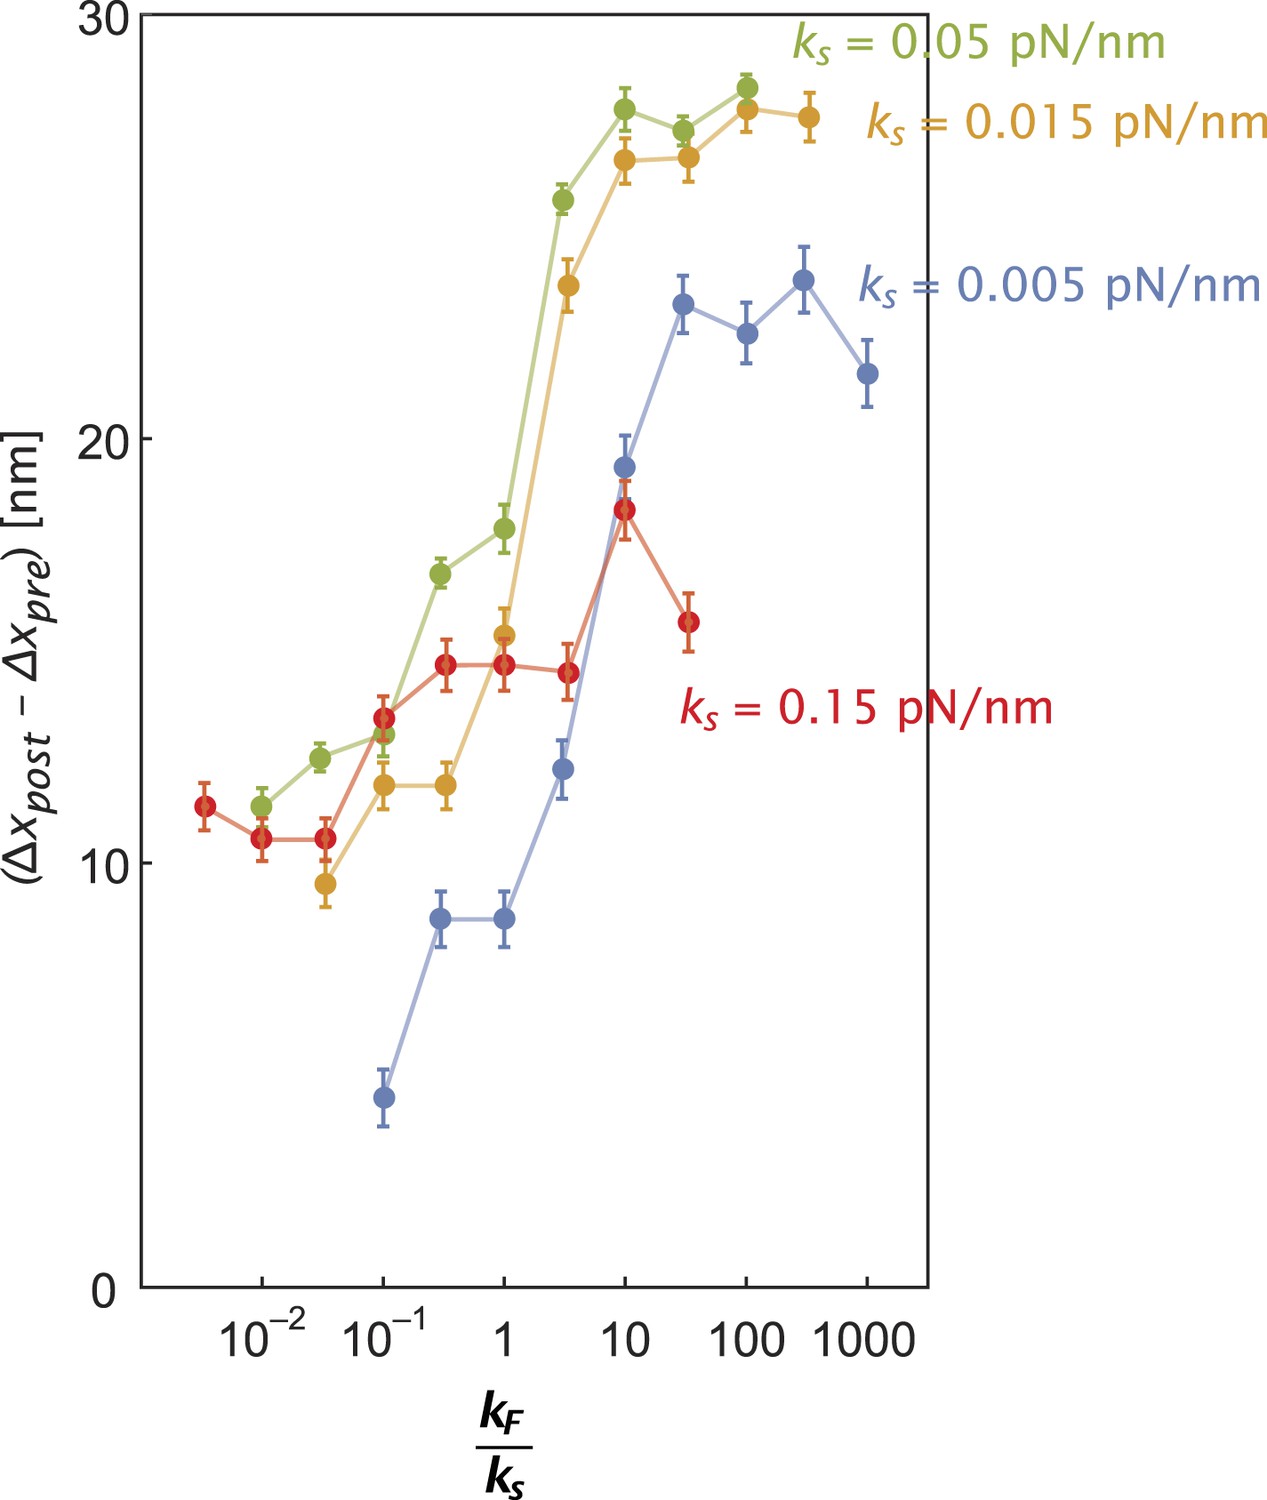
Inter-motor stiffness influences inter-motor tension.
Change in the inter-motor distance (∆xpost − ∆xpre = ∆T/ks) for the simulated steps of two myosin motors (Figure 5—figure supplement 1) with flexural rigidity kF, connected by an inter-motor spring of varying stiffness (ks = 0.005 (blue), 0.015 (orange), 0.05 (green), and 0.15 (red) pN/nm).
Figure 6
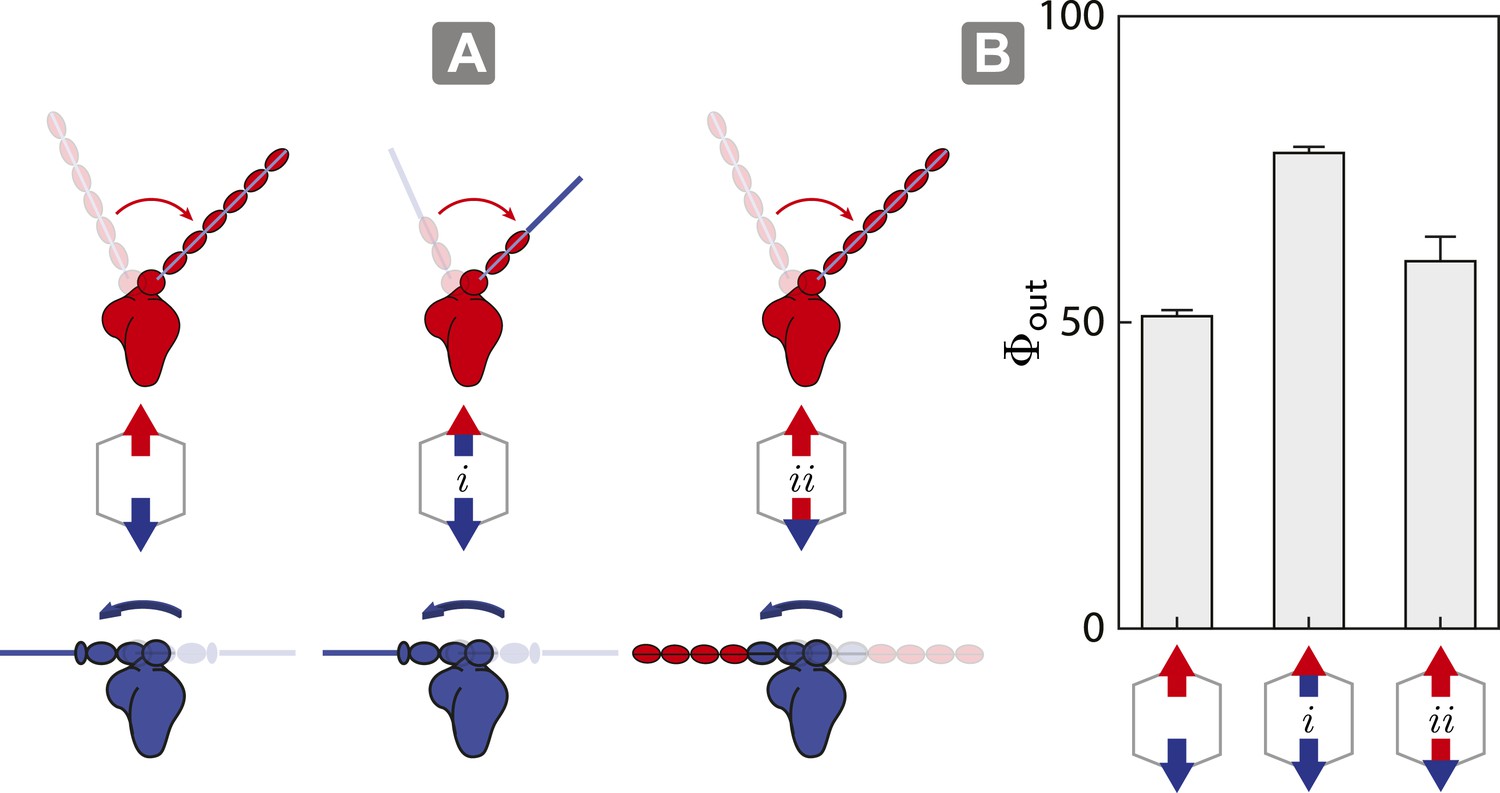
Switching lever arms restores myosin V dominance.
(A) Scaffold and motor schematics used in the lever arm competition experiments. Lever arm rigidity was balanced by engineering the myosin V motor domain with the flexible lever arm of myosin VI (i; flexible vs flexible competition), or the myosin VI motor domain chimera with the rigid lever arm of myosin V (ii; rigid vs rigid competition). Arrowheads and arrowtails depict the myosin heads and lever arms, respectively (red—myosin V; blue—myosin VI). (B) Outward flux (Φout) of indicated motor ensembles. Error bars are S.E.M. and were generated by bootstrapping (N ≥ 126 trajectories; ≥ 3 keratocytes).
Additional files
-
Supplementary file 1
Computer aided staple strand sequences for the flat-rectangular DNA origami scaffold.
- https://doi.org/10.7554/eLife.05472.015
-
Supplementary file 2
Summary of run length measurements.
- https://doi.org/10.7554/eLife.05472.016
Download links
A two-part list of links to download the article, or parts of the article, in various formats.
Downloads (link to download the article as PDF)
Open citations (links to open the citations from this article in various online reference manager services)
Cite this article (links to download the citations from this article in formats compatible with various reference manager tools)
Tuning myosin-driven sorting on cellular actin networks
eLife 4:e05472.
https://doi.org/10.7554/eLife.05472


