Homeostatic synaptic depression is achieved through a regulated decrease in presynaptic calcium channel abundance
- University of California, San Francisco, United States
Figures
Figure 1
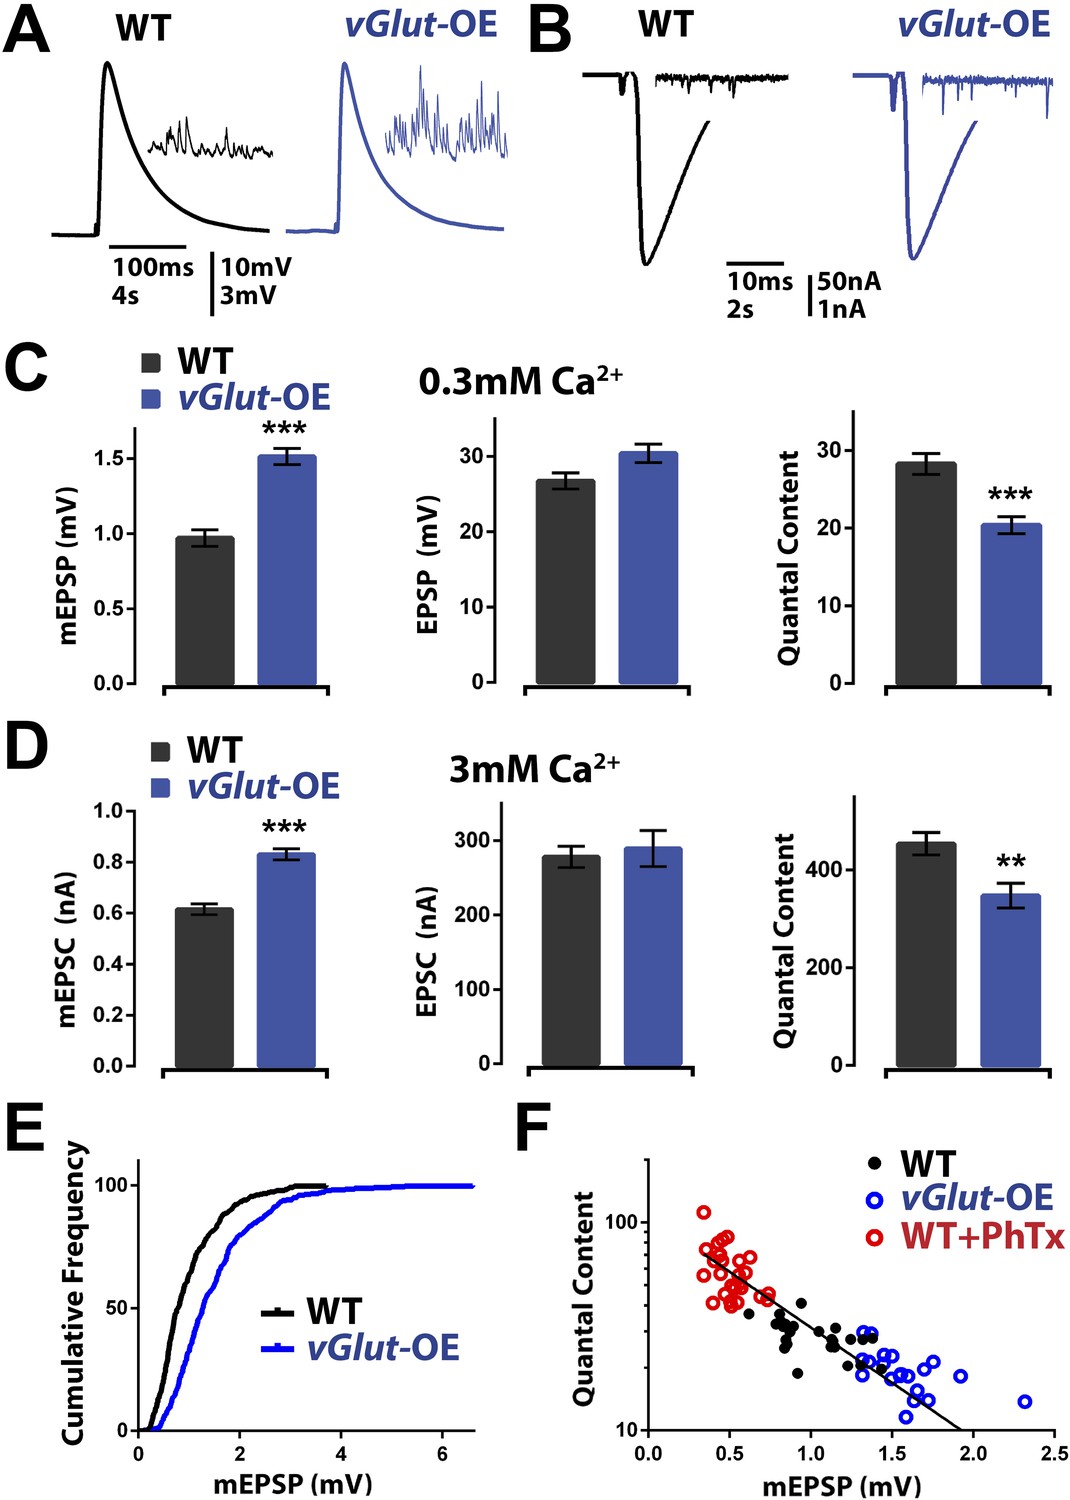
vGlut-OE animals display increased miniature EPSP amplitude and a compensatory decrease in vesicle release.
(A) Representative EPSP traces following stimulation of a single action potential in wild type and vGlut-OE animals; representative mEPSP traces in inset. (B) Representative EPSC traces following stimulation of a single action potential in wild type and vGlut-OE animals; representative mEPSC traces in inset. (C) vGlut-OE animals have increased mEPSP amplitudes (p < 0.0001) with no change in evoked EPSP amplitudes (p = 0.08), resulting in a decrease in calculated quantal content (p < 0.0001, n > 12 NMJ per genotype). (D) vGlut overexpression results in increased mEPSC amplitudes (p < 0.0001), but no significant change in evoked EPSC amplitudes, resulting in a decrease in calculated quantal content (p < 0.01, n > 8 per genotype, error bars = SEM). (E) The cumulative frequency of mEPSPs is shifted to greater amplitudes in vGlut-OE animals. (F) Quantal content is able to scale across an order of magnitude in response to perturbations that increase (vGlut2 overexpression) or decrease (PhTx treatment) quantal amplitude. An exponential function was fit to these data points with R2 = 0.7491. [Ca]e = 3 mM for (B) and (D), 0.3 mM for all others. Error bars = SEM for all.
Figure 2
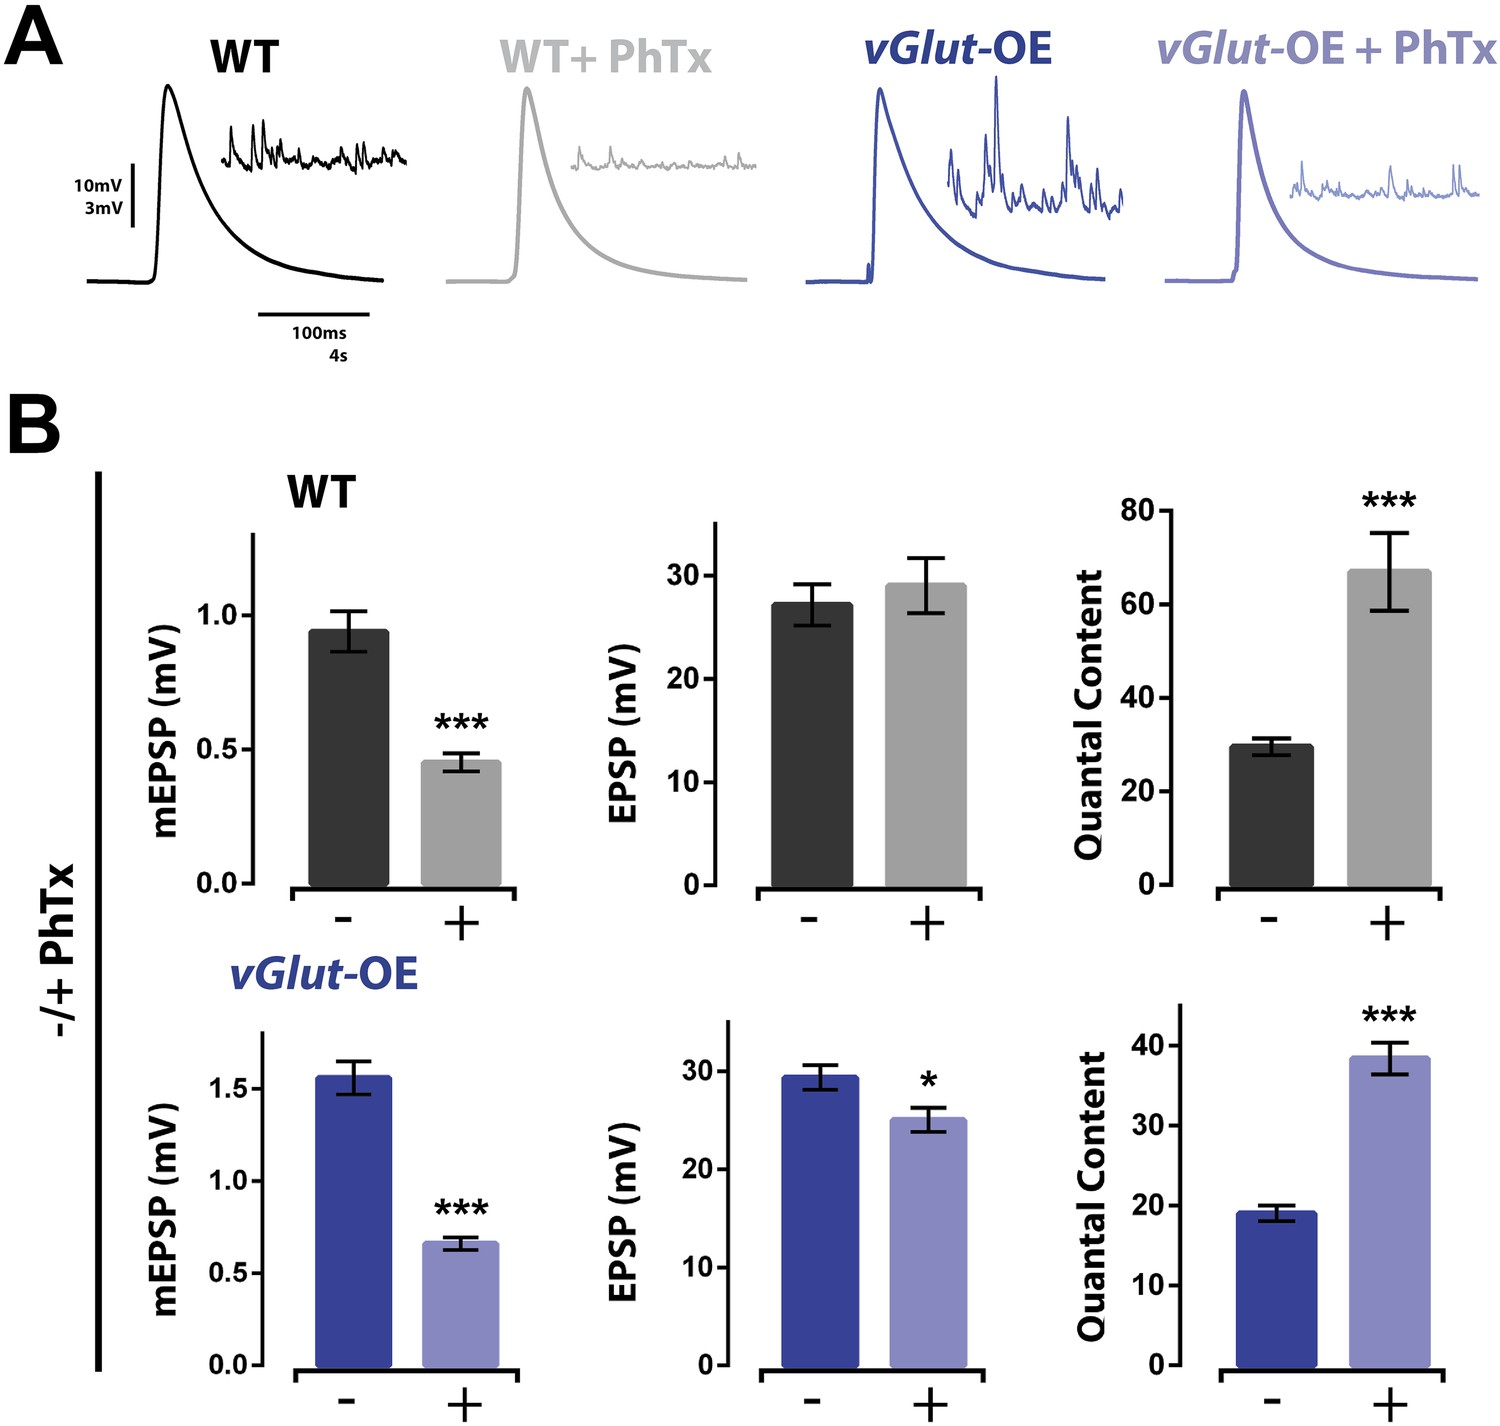
Homeostatic potentiation can be induced at NMJ already expressing presynaptic homeostatic depression (PHD).
(A) Representative evoked EPSP traces from wild type and vGlut-OE NMJ without and with the application of PhTx. Corresponding mEPSP traces in inset for each condition. (B) The addition of PhTx to either wild type (top) or vGlut-OE (bottom) animals results in decreased mEPSP amplitude (p < 0.0001 for both) with a minimal change in evoked EPSP amplitude (p = 0.5 for wt, p = 0.03 for vGlut-OE), resulting in a decrease in calculated quantal content (p < 0.0001 for both, n = 11 for wt -PhTx, n = 8 for wt +PhTx, n = 6 for vGlut-OE–PhTx, n = 9 for vGlut-OE +PhTx. Error bars = SEM). [Ca]e = 0.3 mM for all.
Figure 3
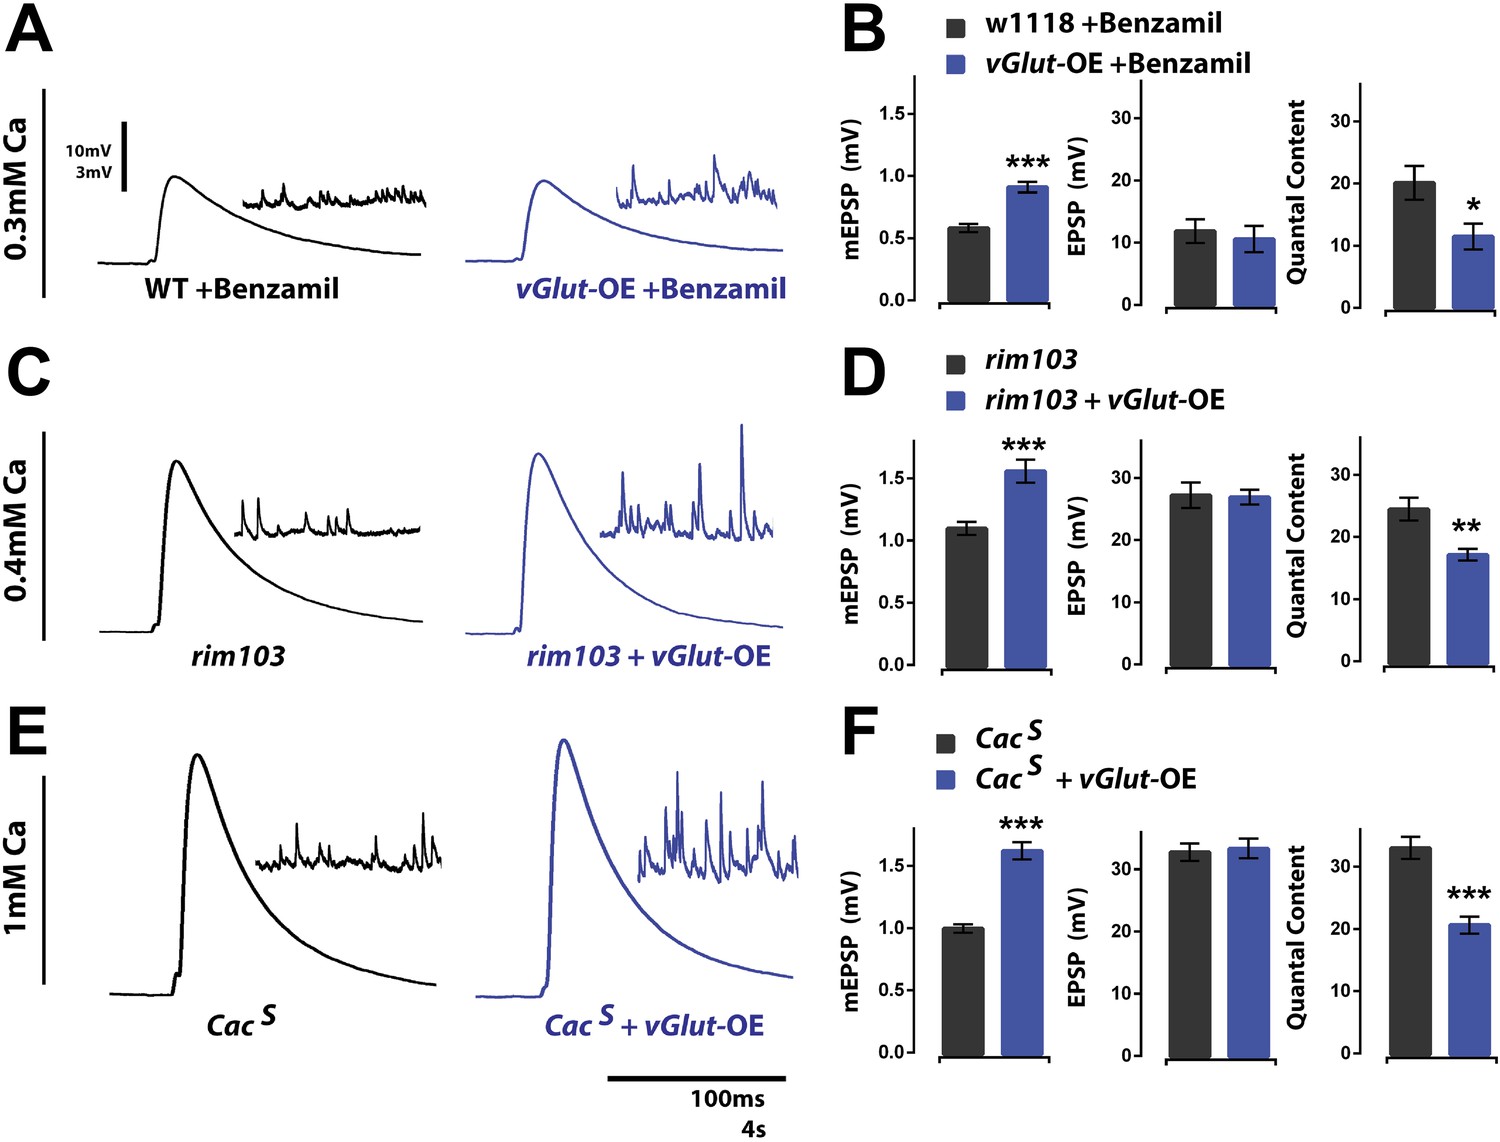
Presynaptic homeostatic potentiation and depression operate through distinct molecular mechanisms.
(A) Representative single action potential stimulated EPSP traces from wild type and vGlut-OE animals in the presence of the drug Benzamil with corresponding mEPSP traces in the inset. (B) vGlut-OE animals have increased mEPSP amplitudes in the presence of Benzamil as compared to similarly treated wild type animals (p < 0.0001) but have unchanged evoked EPSP amplitudes, resulting in a decrease in calculated quantal content (p = 0.05, n = 9 for wt, n = 5 for vGlut-OE). (C) Representative EPSP traces as in (A) from rim103 homozygotes in a wild type (left) and vGlut2 overexpressing (right) background. (D) vGlut2 overexpression in rim103 mutants results in increased mEPSP amplitudes (p = 0.0002) and decreased quantal content (p = 0.003, n = 12 for rim103 and n = 10 for rim103 +vGlut-OE). (E) Representative EPSP traces as in (A) from CacS homozygotes in a wild type (left) and vGlut2 overexpressing (right) background. (F) vGlut2 overexpression in CacS mutants results in increased mEPSP amplitudes (p < 0.0001) and decreased quantal content (p < 0.0001, n = 22 for CacS, n = 11 for CacS +vGlut-OE). Error bars = SEM for all.
Figure 4
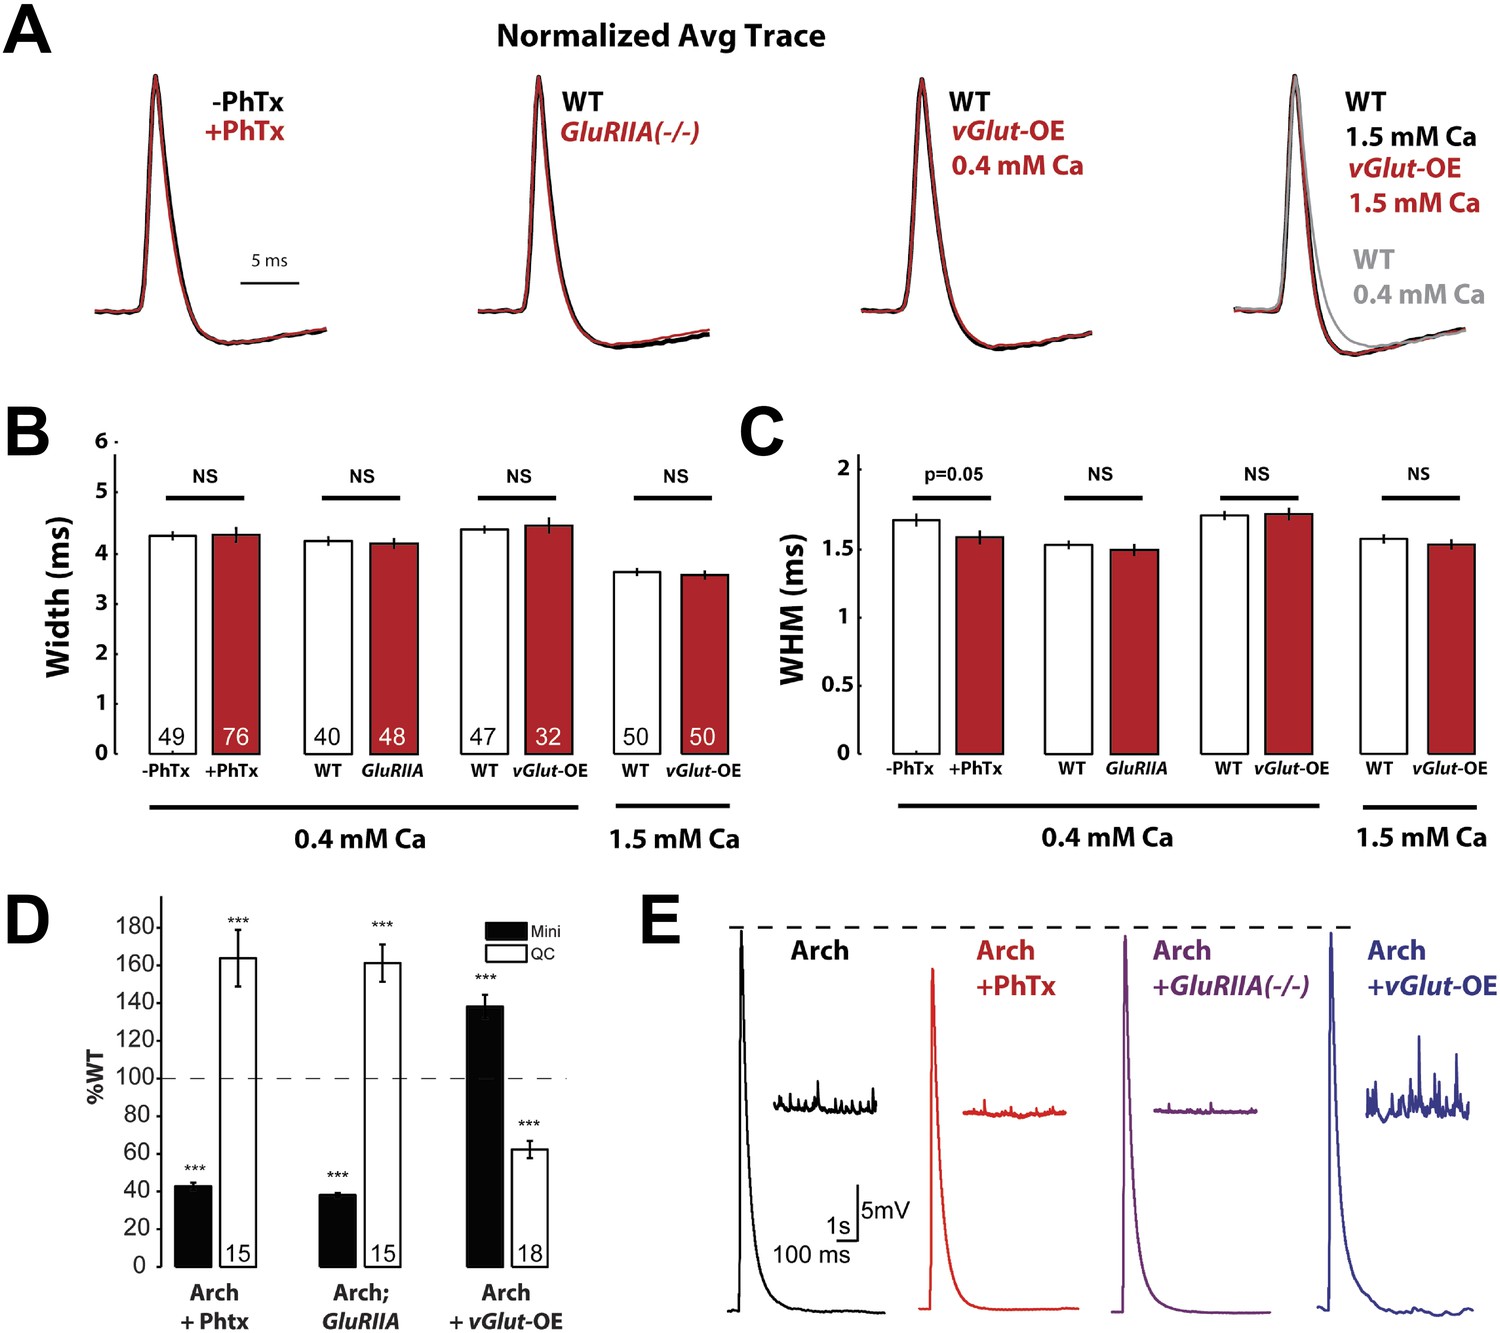
Action potential waveforms do not change during presynaptic homeostasis.
(A) Normalized average AP traces comparing PhTx-treated, GluRIIA mutant, and vGlut-OE animals to WT animals. (B) AP width does not change in animals in which presynaptic homeostasis has been induced (n labeled within bars for all). (C) AP width at half maximum amplitude does not change in animals where presynaptic homeostasis has been induced, except for a small decrease in PhTx treated animals; p = 0.05; n for all is same as (B). (D) Quantal content homeostatically changes in response to perturbed mEPSP amplitude in animals that express Arch (p < 0.001, n labeled within bars for all). (E) Example traces of the data summarized in (D). [Ca]e = 0.4 mM, errors bars = SEM for all.
Figure 5
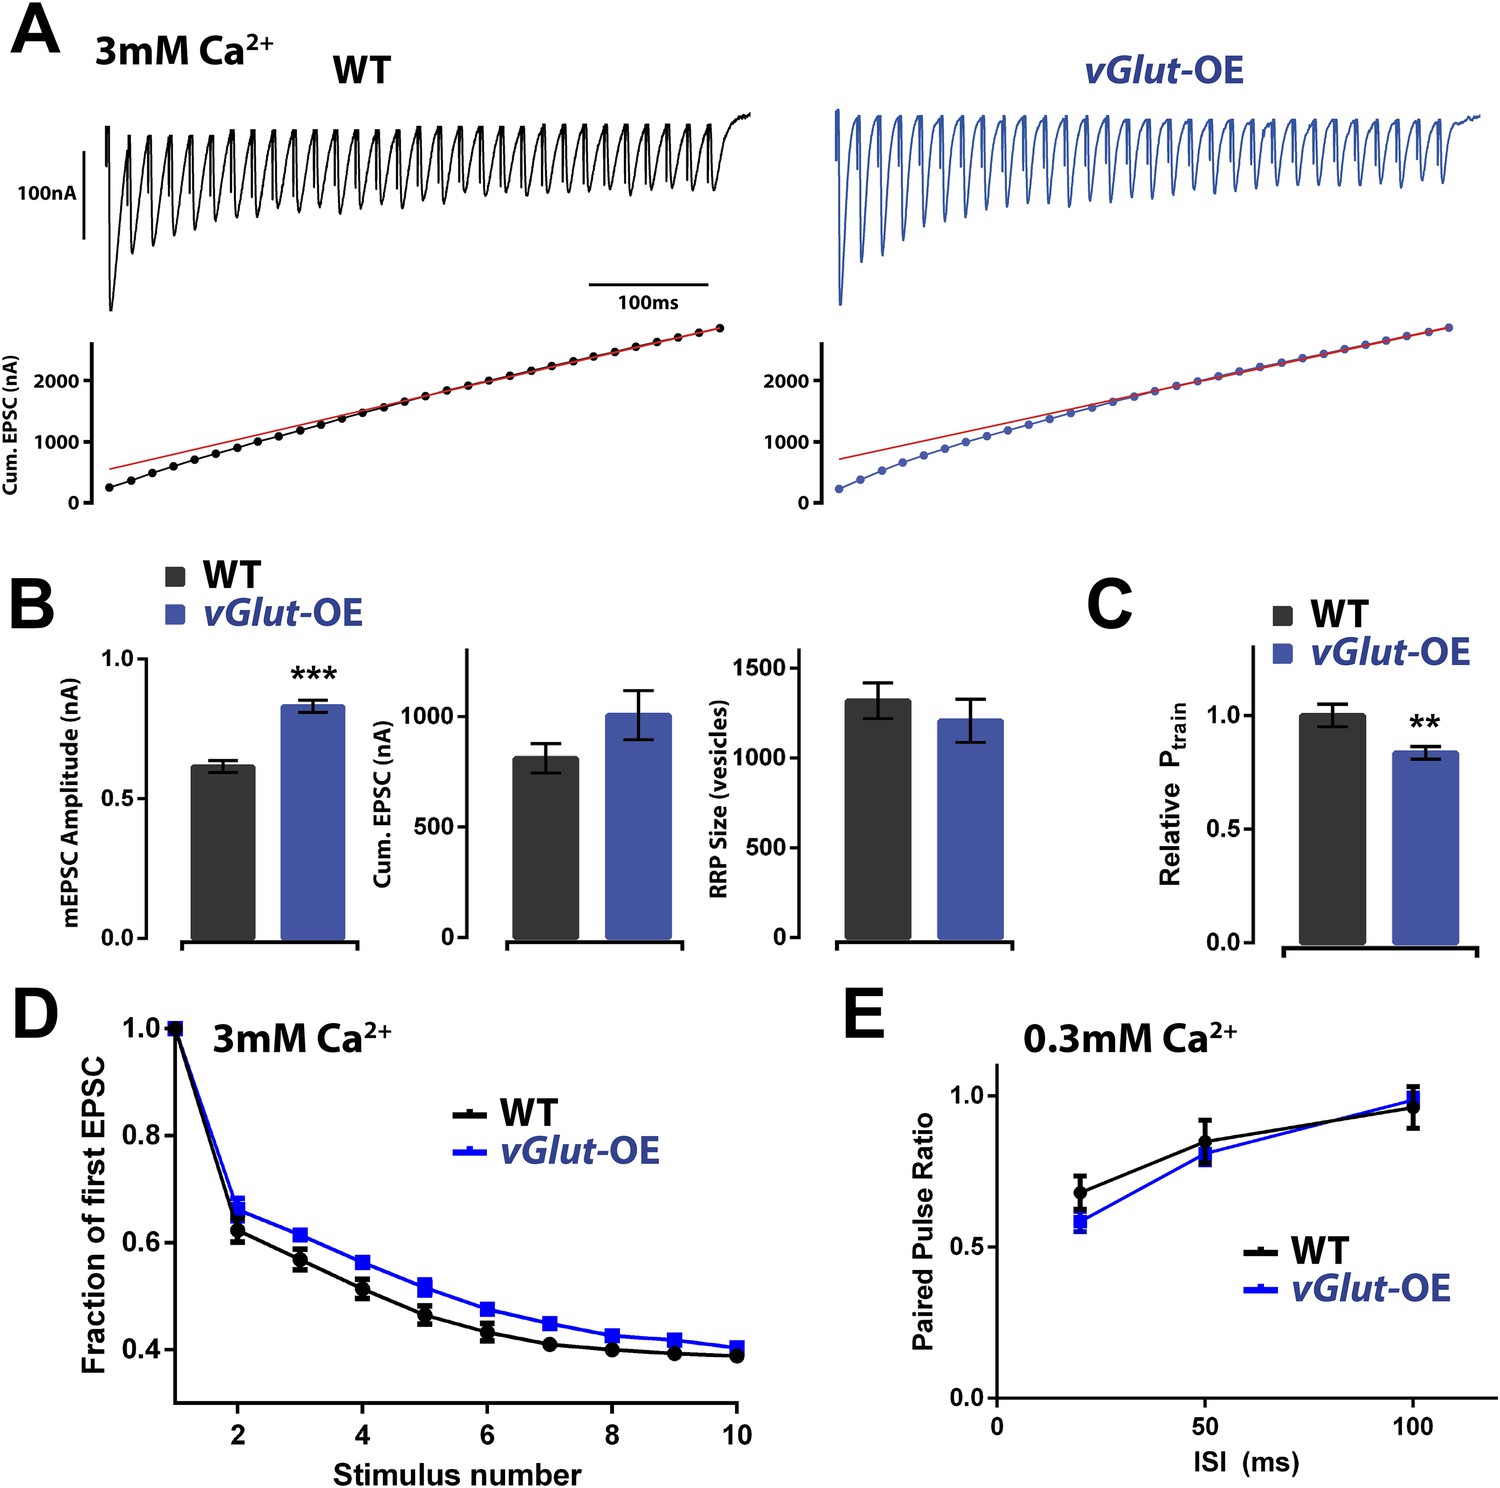
Effects of PHD on RRP size and Pr.
(A) Top: representative EPSC trains from wild type (left) and vGlut-OE (right) animals in response to 60 Hz stimulation (30 stimuli). Bottom: cumulative EPSC amplitude for the traces shown. The line fit to the cumulative EPSC data and back extrapolated to time 0 is shown in red (see ‘Materials and methods’). (B) vGlut-OE animals had increased mEPSC amplitudes (p < 0.0001), and cumulative EPSC amplitudes that trended upward (p = 0.16). The calculated RRP size was unchanged (p = 0.49). (C) The relative probability of release as calculated by the train method was decreased in vGlut-OE animals at 3 mM external Ca2+ (p = 0.008). (D) vGlut-OE animals were not significantly more resistant to depression over the first 10 stimuli of the 60 Hz trains described (a single phase decay function was fitted to points 2–10 for each muscle, generating a decay constant which was averaged across each genotype; p = 0.24). (E) The probability of release was unchanged in vGlut-OE animals as measured by the paired pulse ratio at 0.3 mM external Ca2+ (n = 5 for vGlut-OE, n = 6 for wt). For (A) through (D): n = 9 for WT, n = 10 for vGlut-OE and [Ca]e = 3 mM. Error bars = SEM for all.
Figure 6
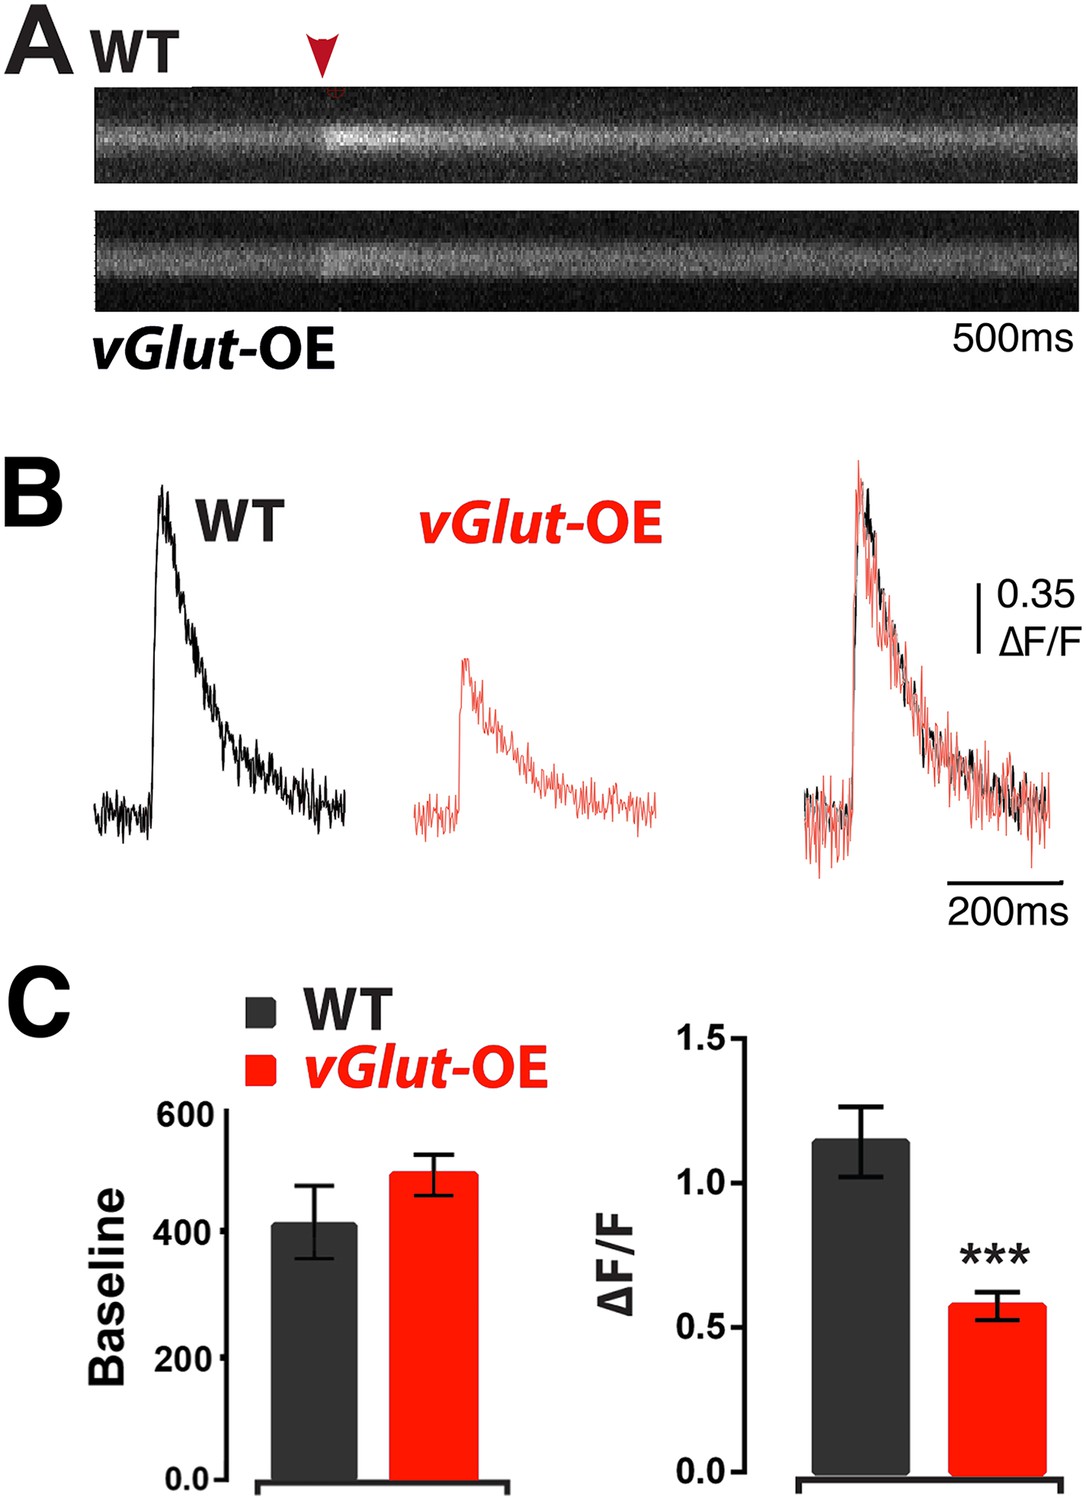
Animals expressing PHD have reduced presynaptic calcium influx.
(A) Representative line-scans of WT and vGlut-OE boutons. Red arrowhead: moment of stimulation. (B) Example Ca2+ transients from WT and vGlut-OE animals. vGlut-OE transients are identical to WT when normalized by amplitude (right). (C) vGlut-OE animals displayed a ∼50% drop in ΔF/F (right) with no change in baseline OGB-1 fluorescence (left). n = 12 for WT, n = 19 for vGlut-OE, p < 0.0001, see ‘Materials and methods’ for details.
Figure 7
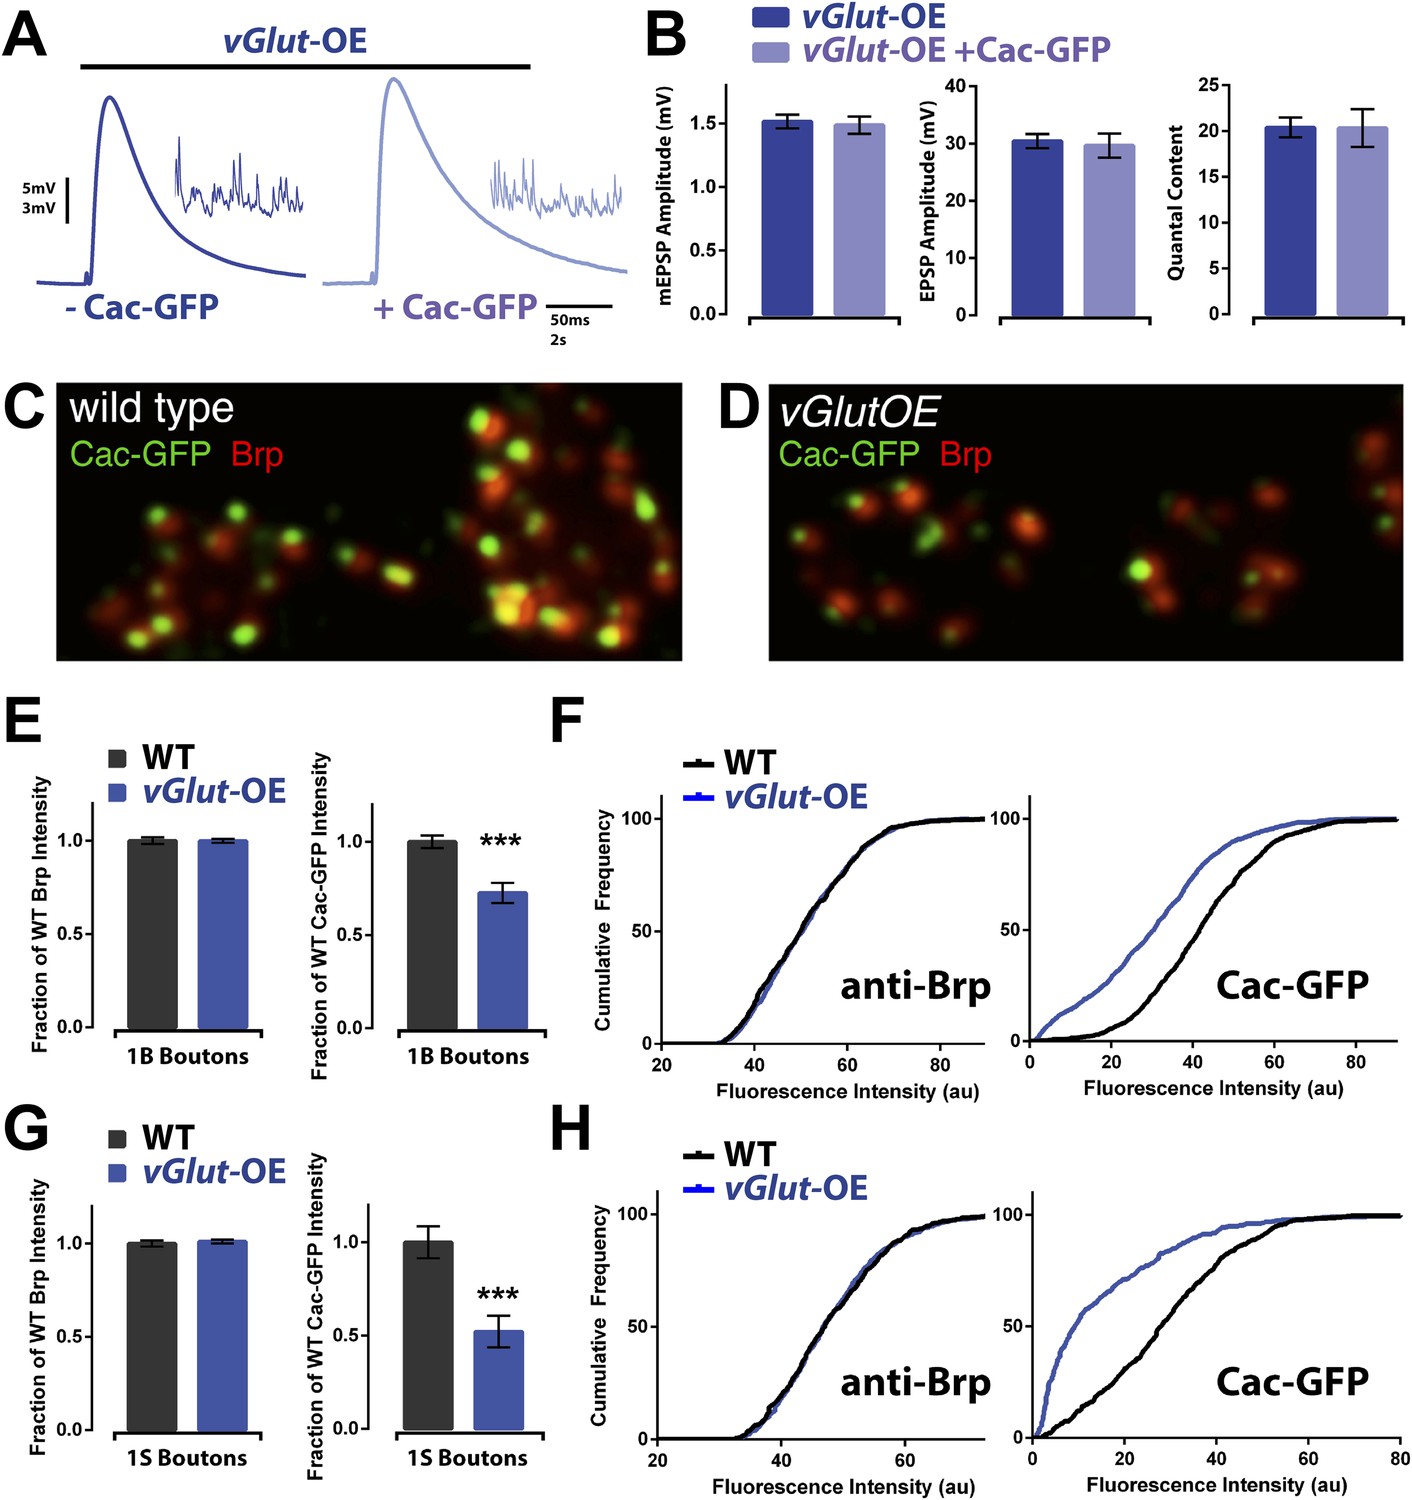
Animals expressing PHD have reduced CaV2.1 channel levels.
(A) Example EPSP traces of vGlut-OE animals with (right) and without (left) a Cac-GFP transgene; example mEPSPs in inset. (B) vGlut-OE animals expressing a Cac-GFP transgene had unchanged synaptic transmission (n = 15 for vGlut-OE, n = 6 for vGlut-OE +Cac-GFP, [Ca]e = 0.3 mM). (C) Representative image of a wild type NMJ labeled with antibodies against the active zone component Brp and a transgenically expressed GFP-tagged Cac channel. (D) Representative vGlut-OE NMJ labeled as in (C). (E) vGlut-OE animals displayed no change in synaptic Brp signal as compared to wild type, but had greatly reduced synaptic Cac-GFP signal at type 1B boutons (p = 0.0002, n > 1000 active zones across >10 NMJ for each). (F) The cumulative frequency of fluorescence intensity at 1B boutons for the antibodies described in (C). The distribution of vGlut-OE animals was shifted to the left as compared to wild type. (G) Synaptic Cac-GFP signal was also reduced at type 1S boutons in vGlut-OE animals (p = 0.0007, n > 400 active zones across >10 NMJ for each.) (H) The cumulative frequency for 1S boutons as described in (F). Error bars = SEM for all.
Download links
A two-part list of links to download the article, or parts of the article, in various formats.
Downloads (link to download the article as PDF)
Open citations (links to open the citations from this article in various online reference manager services)
Cite this article (links to download the citations from this article in formats compatible with various reference manager tools)
Homeostatic synaptic depression is achieved through a regulated decrease in presynaptic calcium channel abundance
eLife 4:e05473.
https://doi.org/10.7554/eLife.05473


