Nuclear genomic signals of the ‘microturbellarian’ roots of platyhelminth evolutionary innovation
- Harvard University, United States
- University of Bergen, Norway
Figures
Figure 1 with 2 supplements
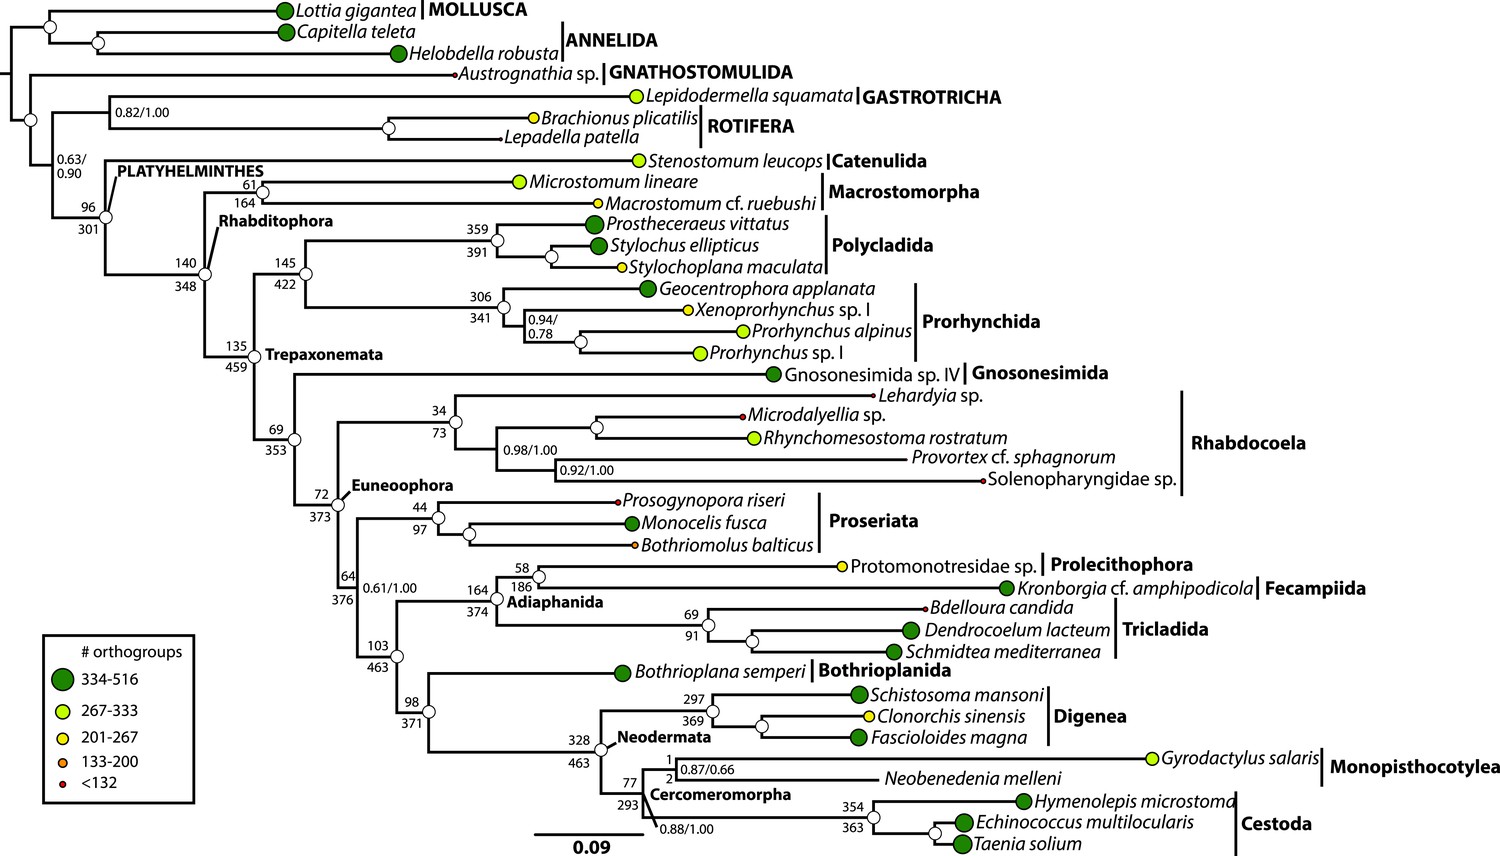
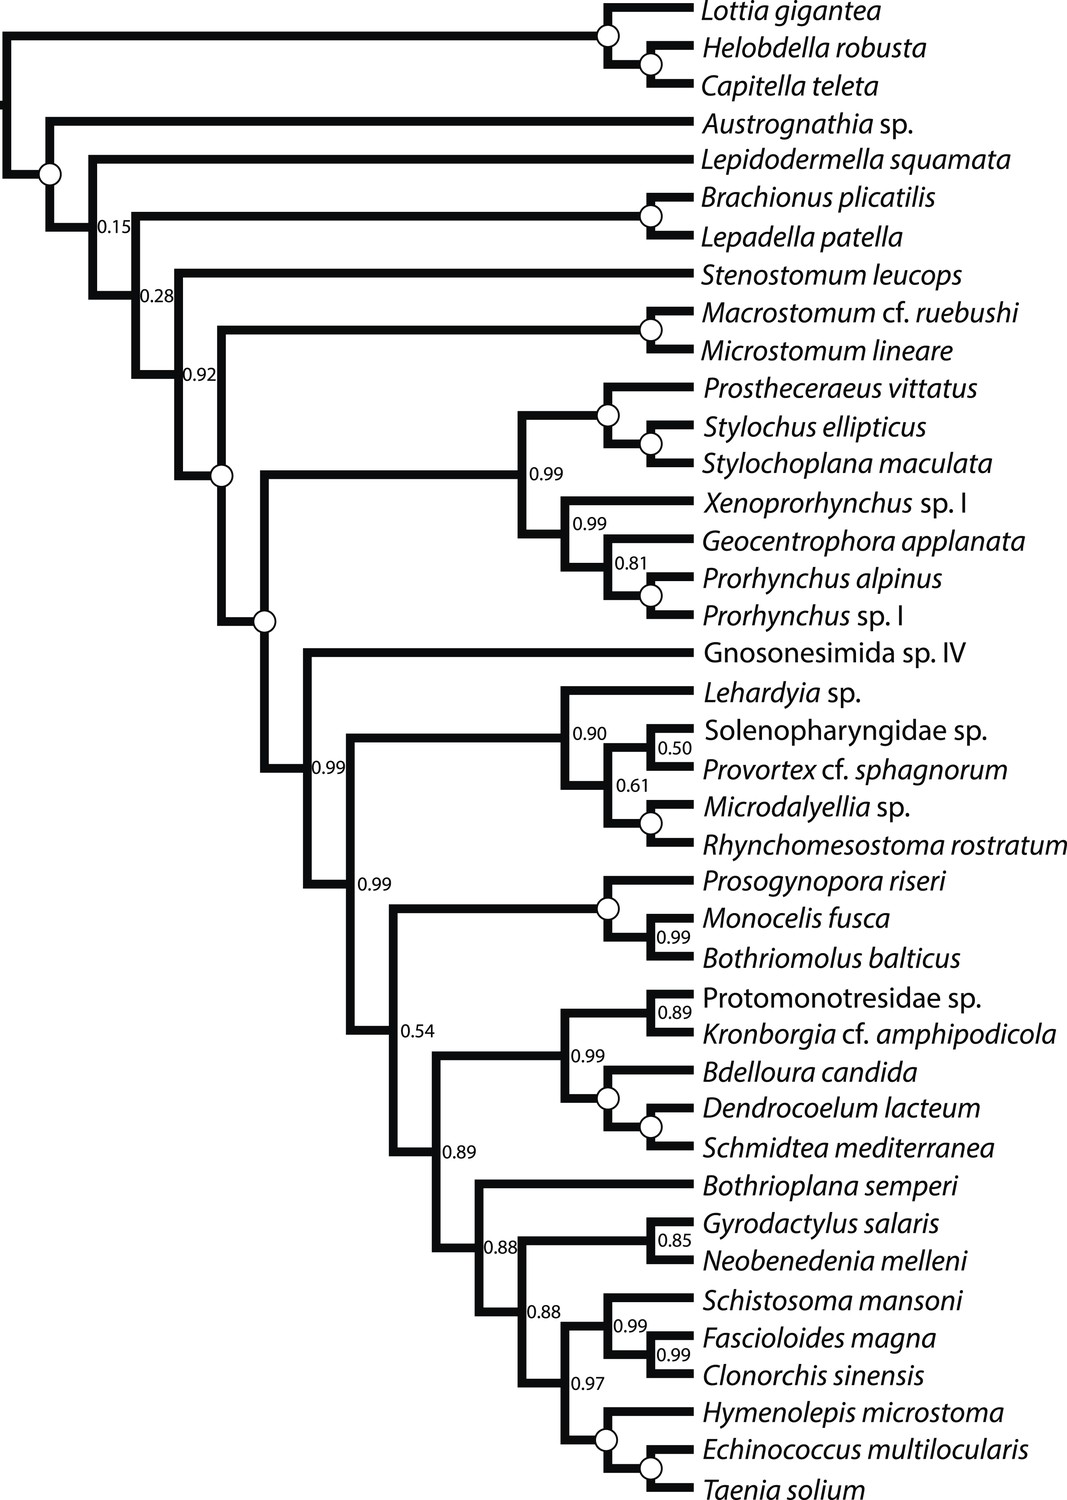
Phylogenetic relationships of Platyhelminthes, encompassing 25 ‘turbellarian’ species, 8 representatives of Neodermata, and 7 spiralian outgroups.
Phylogram represents results from a maximum likelihood (ML) analysis of 516 predicted orthogroups (120,527 aligned amino acid sites trimmed of nonstationary and poorly aligned residues), analysed in ExaML v1.0.0 under LG4M+F (from which the phylogram shown was taken), and also in phyML (v20130927) under LG+FR4+F+IL, with support values to the right of each node representing clade frequency in 100 bootstraps or aBayes supports, respectively (complete support in both measures indicated by a white dot). Values below internodal edges represent the number of genes available to test each clade (decisive genes); values above such edges represent the percentage of these genes whose ML trees are consistent with this clade (congruence frequency). Colored circles at tips of tree are given with diameter in proportion to the number of orthogroups represented for that taxon in the supermatrix, and colored as per the legend in the lower left.
Figure 1—figure supplement 1
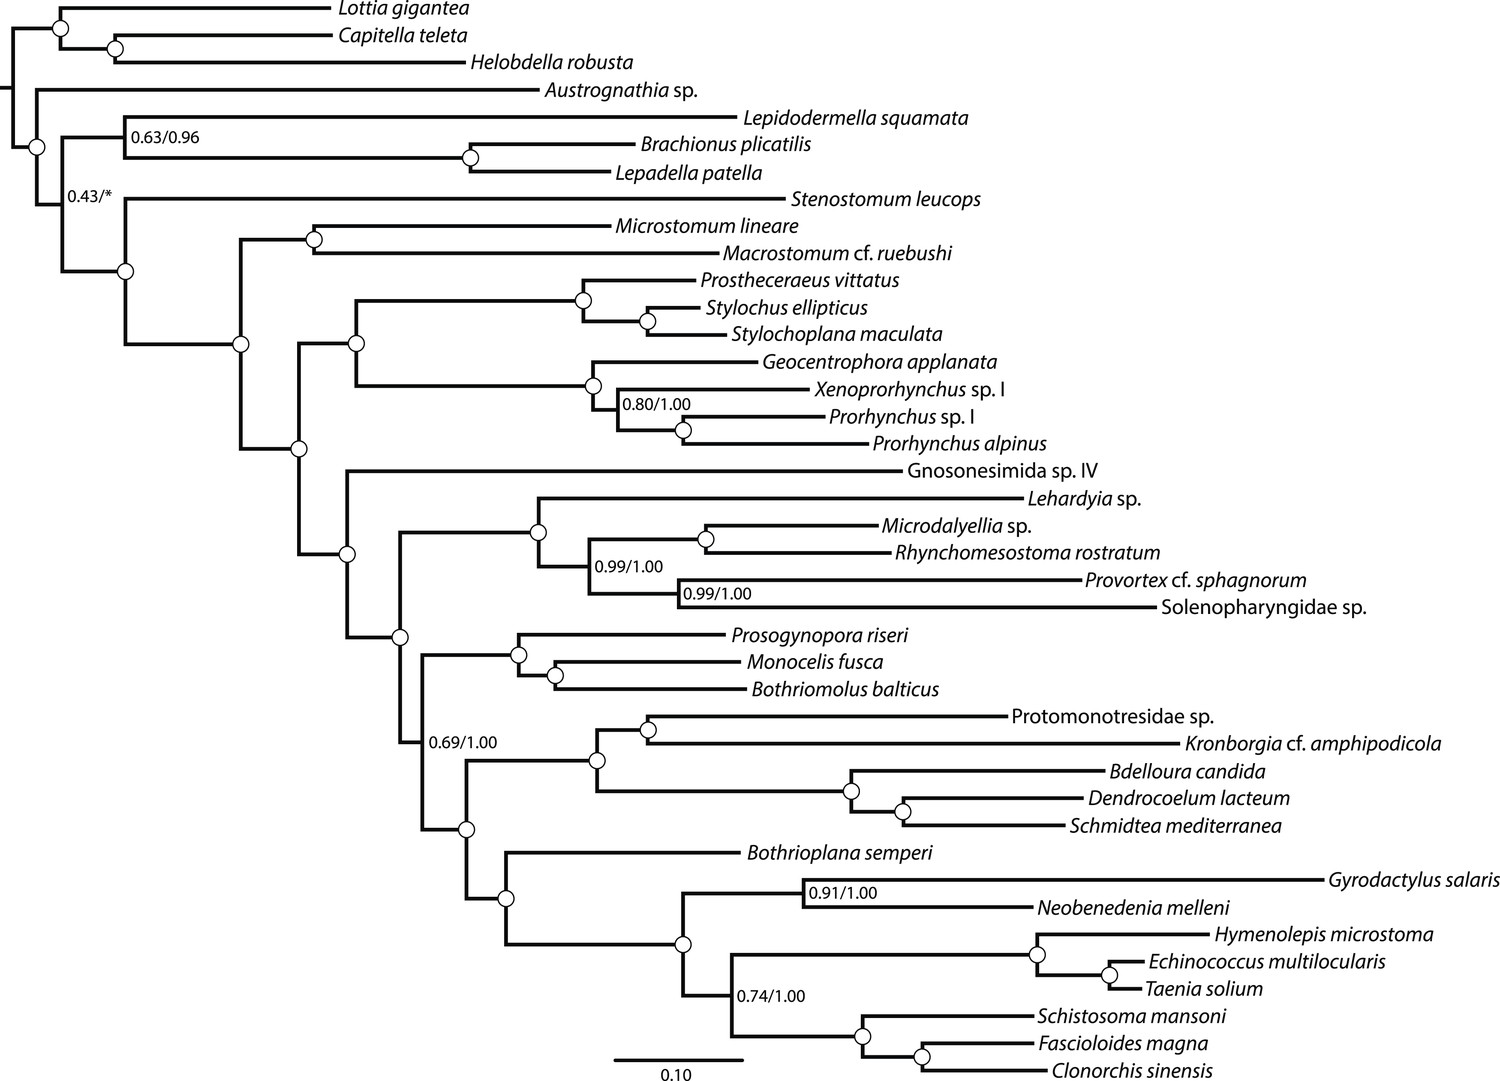
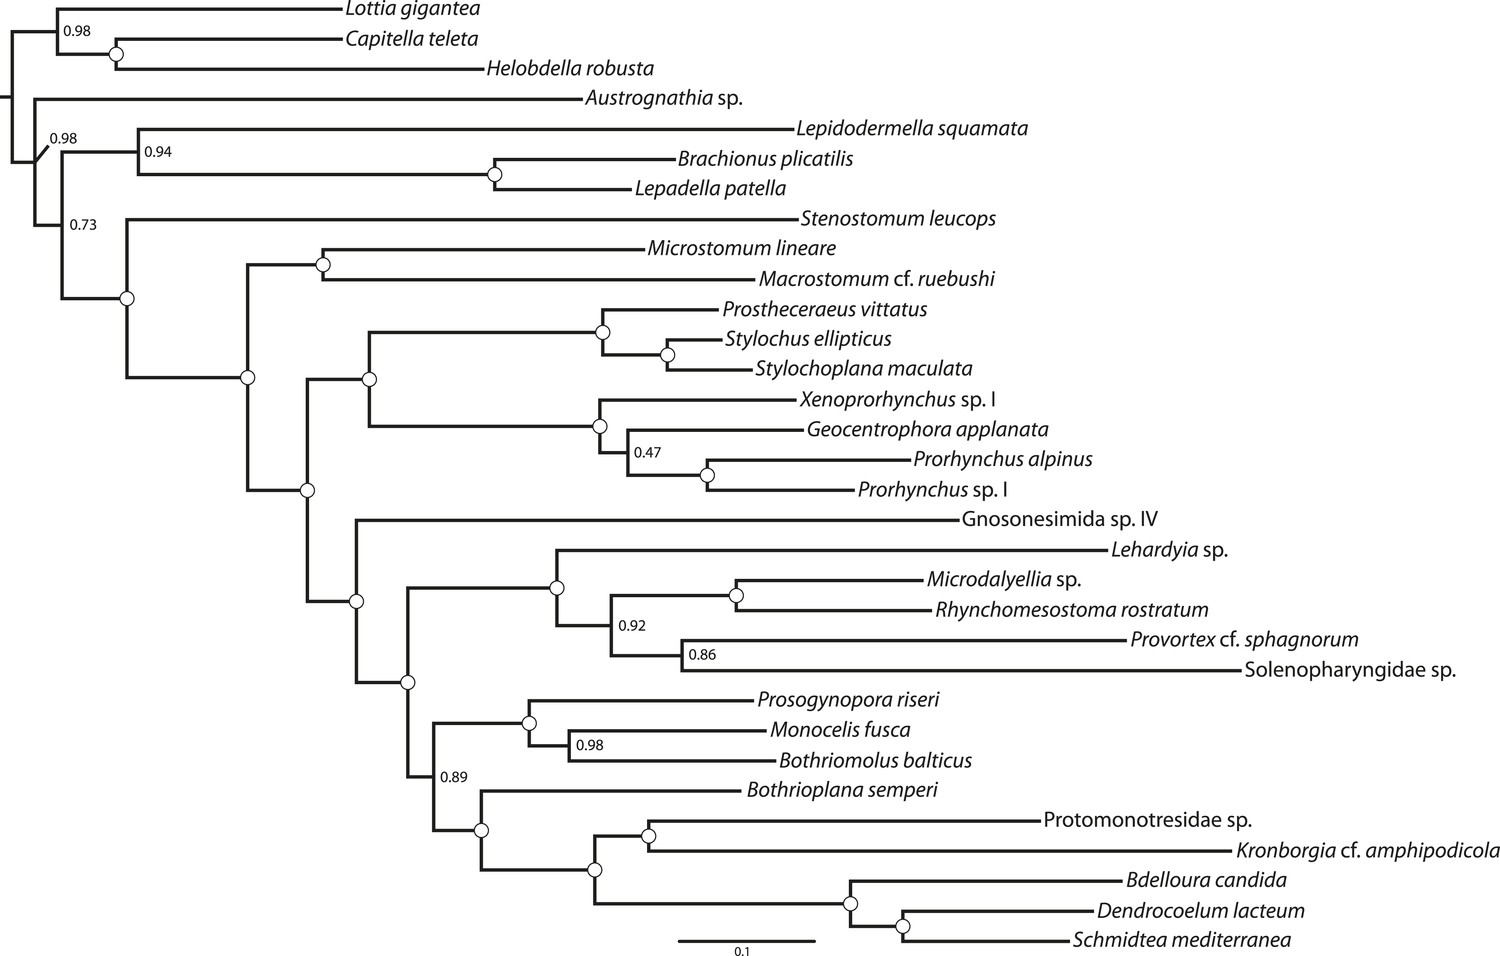
Maximum likelihood phylogram resulting from analysis of untrimmed 516-gene matrix.
132,299 aligned amino acid sites, analyzed in ExaML under LG4M+F and also in phyML (v20130927) under LG+FR4+F+IL, with support values to the right of each node representing clade frequency in 100 bootstraps or aBayes supports, respectively (complete support in both measures indicated by a white dot). The clade indicated with an asterisk was not recovered in the phyML analysis; rather, this analysis recovered Austrognathia sp. as sister to Rotifera+Gastrotricha, with an aBayes support value of 0.8117.
Figure 1—figure supplement 2
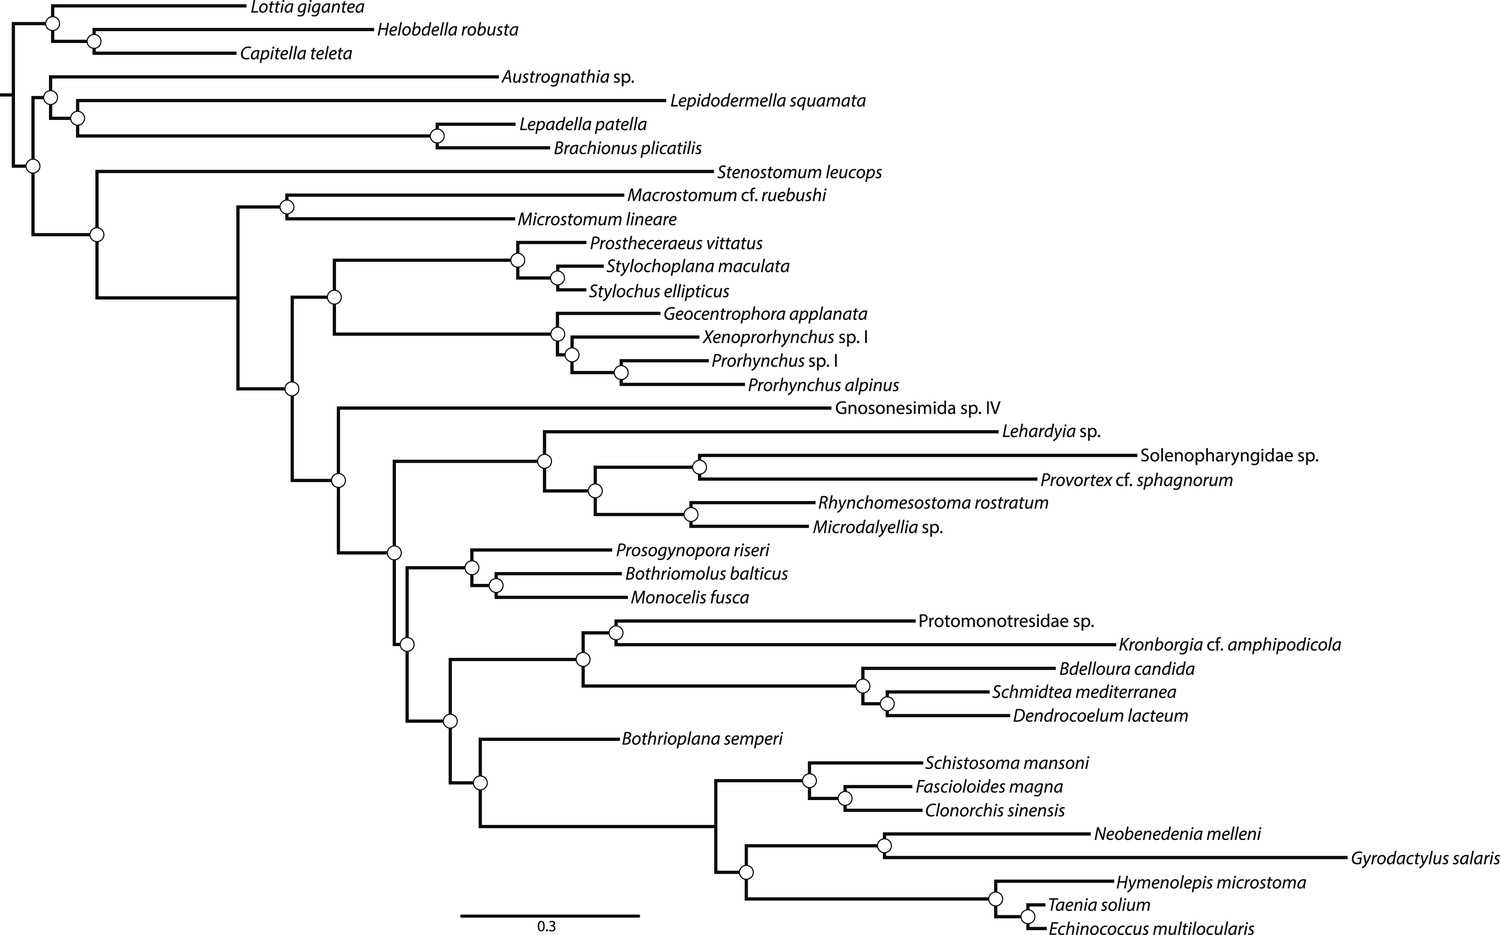
Majority rule consensus (MRC) phylogram of a Bayesian Markov Chain Monte Carlo sampling with the CAT+GTR+Γ4 model in PhyloBayes-MPI v1.4e.
Phylogram shown represents a summary of 517 and 219 trees sampled from two chains which had run for 4236 and 3638 generations, respectively; the first 3200 trees sampled were discarded as ‘burn-in’, and every other remaining tree was included in the posterior summary. All clades showed maximum posterior probability (denoted with a white circle). Convergence diagnostics assessed via bpcomp showed a maximum and mean bipartition discrepancy of 0 between these chains. An alternative pair of chains run for 3931 and 3554 showed identical evidence for convergence, but a separate topology. However, the MRC phylogram from this pair of chains differed from that of the pair shown only in the positions of Proseriata and Rhabdocoela, which were inverted relative to the topology sampled in the chain shown; all clades were maximally supported in this second pair of chains as well. The negative log likelihood from the first pair of chains (which generated the MRC phylogram shown) has a smaller average than that sampled by the second pair (−1.878634E + 06 vs −1.880144E + 06).
Figure 2
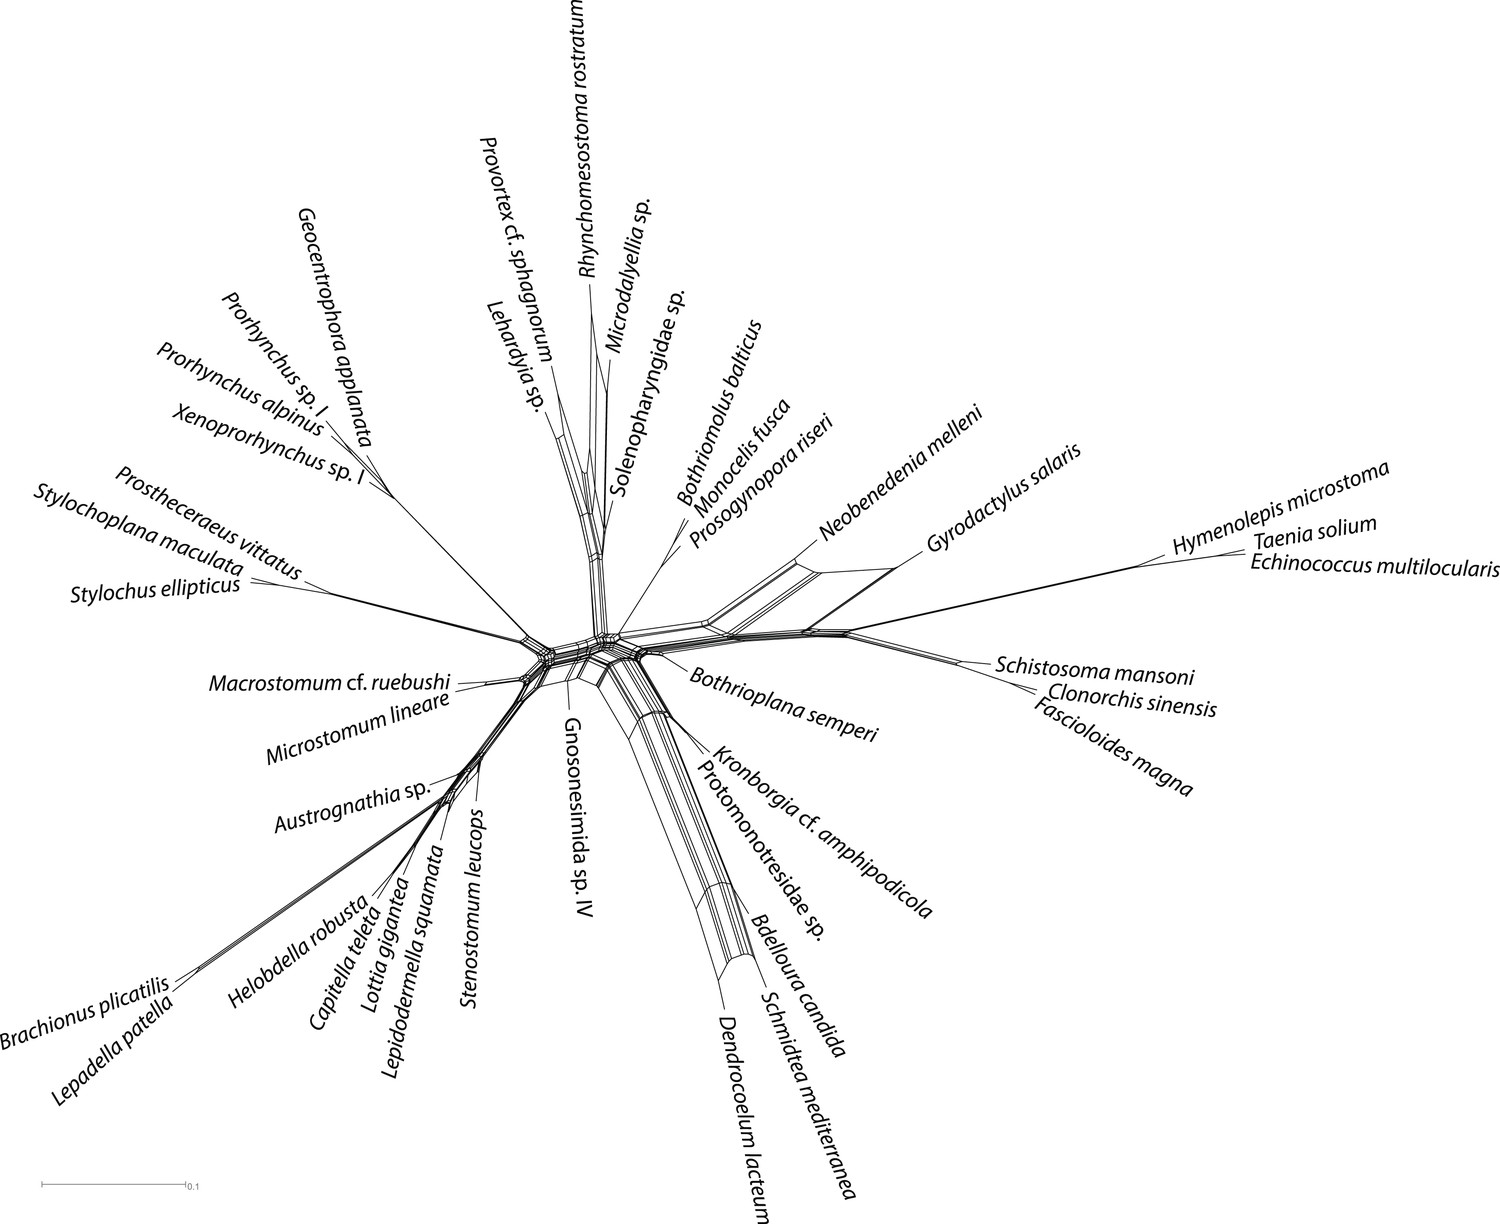
Quartet supernetworks built from 516 individual ML gene trees, showing predominant inter-gene conflicts in genes selected for concatenation.
A qualitatively nearly identical topology (not shown) was recovered using bootstrap majority rule consensus trees as input. Edge weights were calculated in SuperQ v1.1, with the ‘balanced’ linear objective function, and no filter applied. Supernetwork was visualized in SplitsTree v4 using default settings.
Figure 3
ASTRAL species tree.
Constructed under default settings from 516 input unrooted partial gene trees inferred in RAxML v8.0.20. Nodal support values reflect the frequency of splits in trees constructed by ASTRAL from 100 bootstrap replicate gene trees using the -b flag; gene- and site-level bootstrapping (-g) was not performed.
Figure 4
ML phylogram inferred from a version of the BMGE-trimmed matrix in which all taxa of Neodermata have been deleted.
Tree inferred in ExaML v1.0.0 under the LG4M+F model; nodal support values represent the frequency of splits in 100 bootstrap replicates.
Figure 5

ML phylogram inferred from a version of the BMGE-trimmed matrix from which Bothrioplana semperi has been deleted.
Tree inferred in ExaML v1.0.0 under the LG4M+F model; nodal support values represent the frequency of splits in 100 bootstrap replicates.
Figure 6
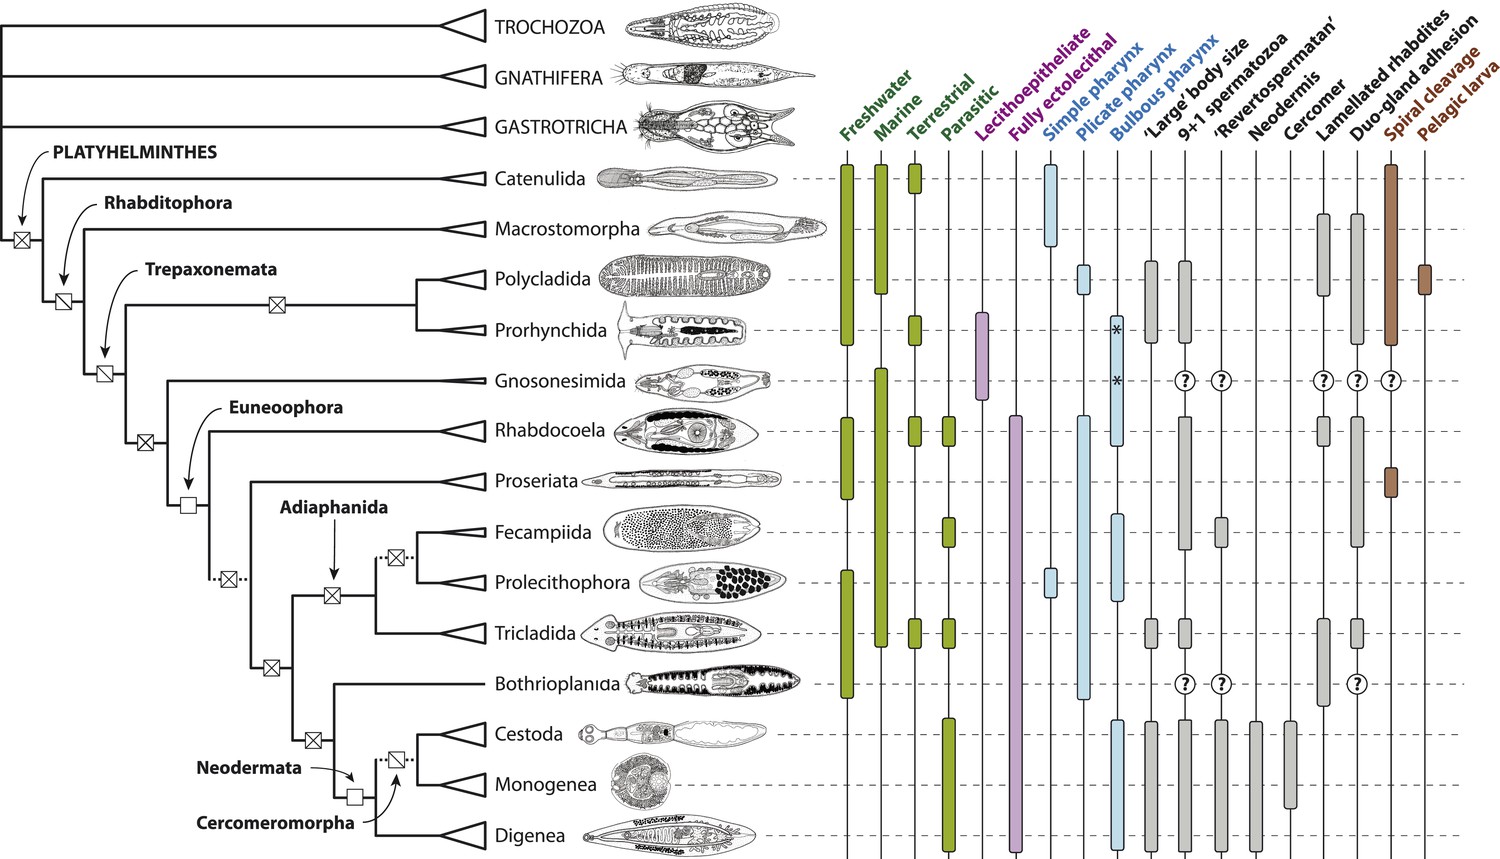
Summary depiction of the phylogenetic results presented in the present study.
All terminal taxa (turbellarian orders, neodermatan classes, and outgroup clades) are shown with equilateral triangles log-scaled in proportion to described species number (largely following [Martín-Durán and Egger, 2012]). Clades deemed to have equivocal or only preliminary support in these analyses are shown with a dashed subtending branch. Named clades discussed in the text are labeled. Clades with known homoplasy-free synapomorphies are labeled with an open square, whereas those with proposed synapomorphies showing inferred losses are labeled with a single diagonal line, and clades without any known synapomorphies are shown with a cross. Traits commonly referred to in discussions of platyhelminth phylogenetics are given to the right of the phylogeny; terminal taxa are shown filled in if any representatives have been reported in published studies to manifest the trait in question (although numerous reversals apparently occurring subsequent to the origin of a clade are not depicted), and clades for which no published observations are available are labeled with a question mark. The orders Prorhynchida and Gnosonesimida are given with a ‘*’ in the ‘Bulbous pharynx’ column to indicate that although the pharyngeal types manifested in these orders have been described under separate names (variable and coniform pharynx, respectively), both represent, by definition, a bulbous pharynx.
Line drawings in Figure 6 modified with permission from the following sources:
Gastrotricha (unspecified chatonotoid) – BIODIDAC database (http://biodidac.bio.uottawa.ca/)
Gnathostomulida (Gnathostomula peregrina) – Kirsteuer, 1969
Annelida (Hirudinea sp.) – BIODIDAC database (http://biodidac.bio.uottawa.ca/)
Prorhynchida (after Geocentrophora marcusi) – original
All others – Images modified from original illustrations provided courtesy of Janine Caira (Caira and Littlewood, 2013).
Additional files
-
Supplementary file 1
Summary statistics and accession numbers for each species used in this study. Summarizes quality-controlled RNA-Seq data, de novo transcriptome assemblies, peptide predictions (incl. those from published genome data), and gene occupancy in the 516-orthogroup matrix. Libraries marked with a single asterisk represent stranded libraries made using the IntegenX mRNA sample prep kit, whereas those marked with two asterices represent libraries prepared from amplified cDNA made using the PMA method (Pan et al., 2013); all other libraries were produced using the Illumina TruSeq RNA Sample Prep Kit v2.
- https://doi.org/10.7554/eLife.05503.011
Download links
A two-part list of links to download the article, or parts of the article, in various formats.
Downloads (link to download the article as PDF)
Open citations (links to open the citations from this article in various online reference manager services)
Cite this article (links to download the citations from this article in formats compatible with various reference manager tools)
Nuclear genomic signals of the ‘microturbellarian’ roots of platyhelminth evolutionary innovation
eLife 4:e05503.
https://doi.org/10.7554/eLife.05503


