Structural basis for ligand and innate immunity factor uptake by the trypanosome haptoglobin-haemoglobin receptor
- University of Oxford, United Kingdom
- University of Cambridge, United Kingdom
Figures
Figure 1 with 2 supplements

The structure of the T. brucei haptoglobin-haemoglobin receptor.
(A) The structure of the T. brucei haptoglobin-haemoglobin receptor, with helix I (red), helix II (orange) and helix V (blue). These three helices form an elongated bundle with a ∼50° kink towards the membrane proximal C-terminal end. The inset shows a molecular envelope derived from small angle x-ray scattering. (B) The structure of the T. congolense haptoglobin-haemoglobin receptor (Higgins et al., 2013) for comparison. (C) A change in the pattern of hydrophobic residues results in a rigid kink in the three helical bundle of the TbHpHbR. Corresponding regions of the structures of TbHpHbR and TcHpHbR are shown with side chains of the hydrophobic residues that pack in the core of the bundle coloured red and residues at the kink sites in TbHpHbR coloured green. Also shown are sequence alignments of TbHpHbR and TcHpHbR for these regions of each helix, coloured in the same way.
Figure 1—figure supplement 1
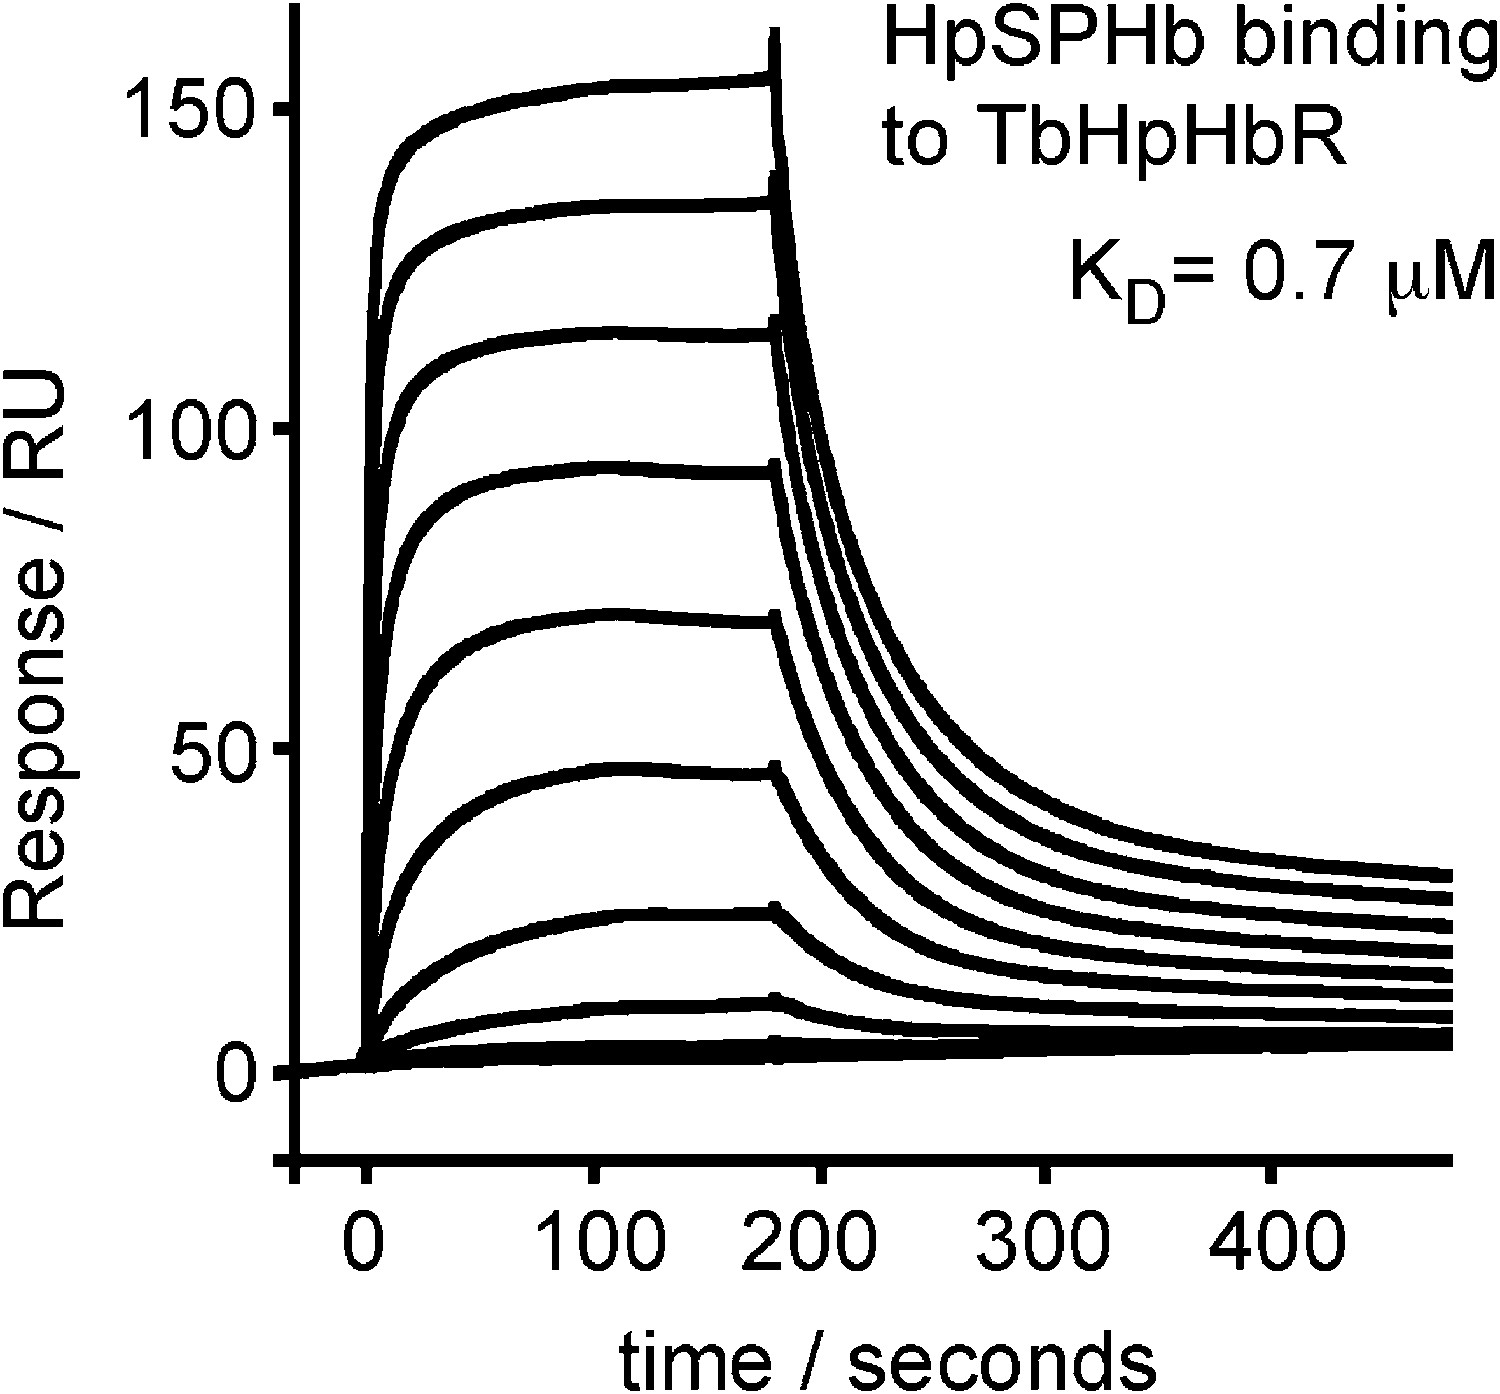
Surface plasmon resonance analysis of the binding of HpSPHb to TbHpHbR.
Surface plasmon resonance signals for twofold dilutions of HpSPHb complex from a maximum concentration of 16 μM, binding to a surface coated with the truncated version of T. brucei HpHbR.
Figure 1—figure supplement 2
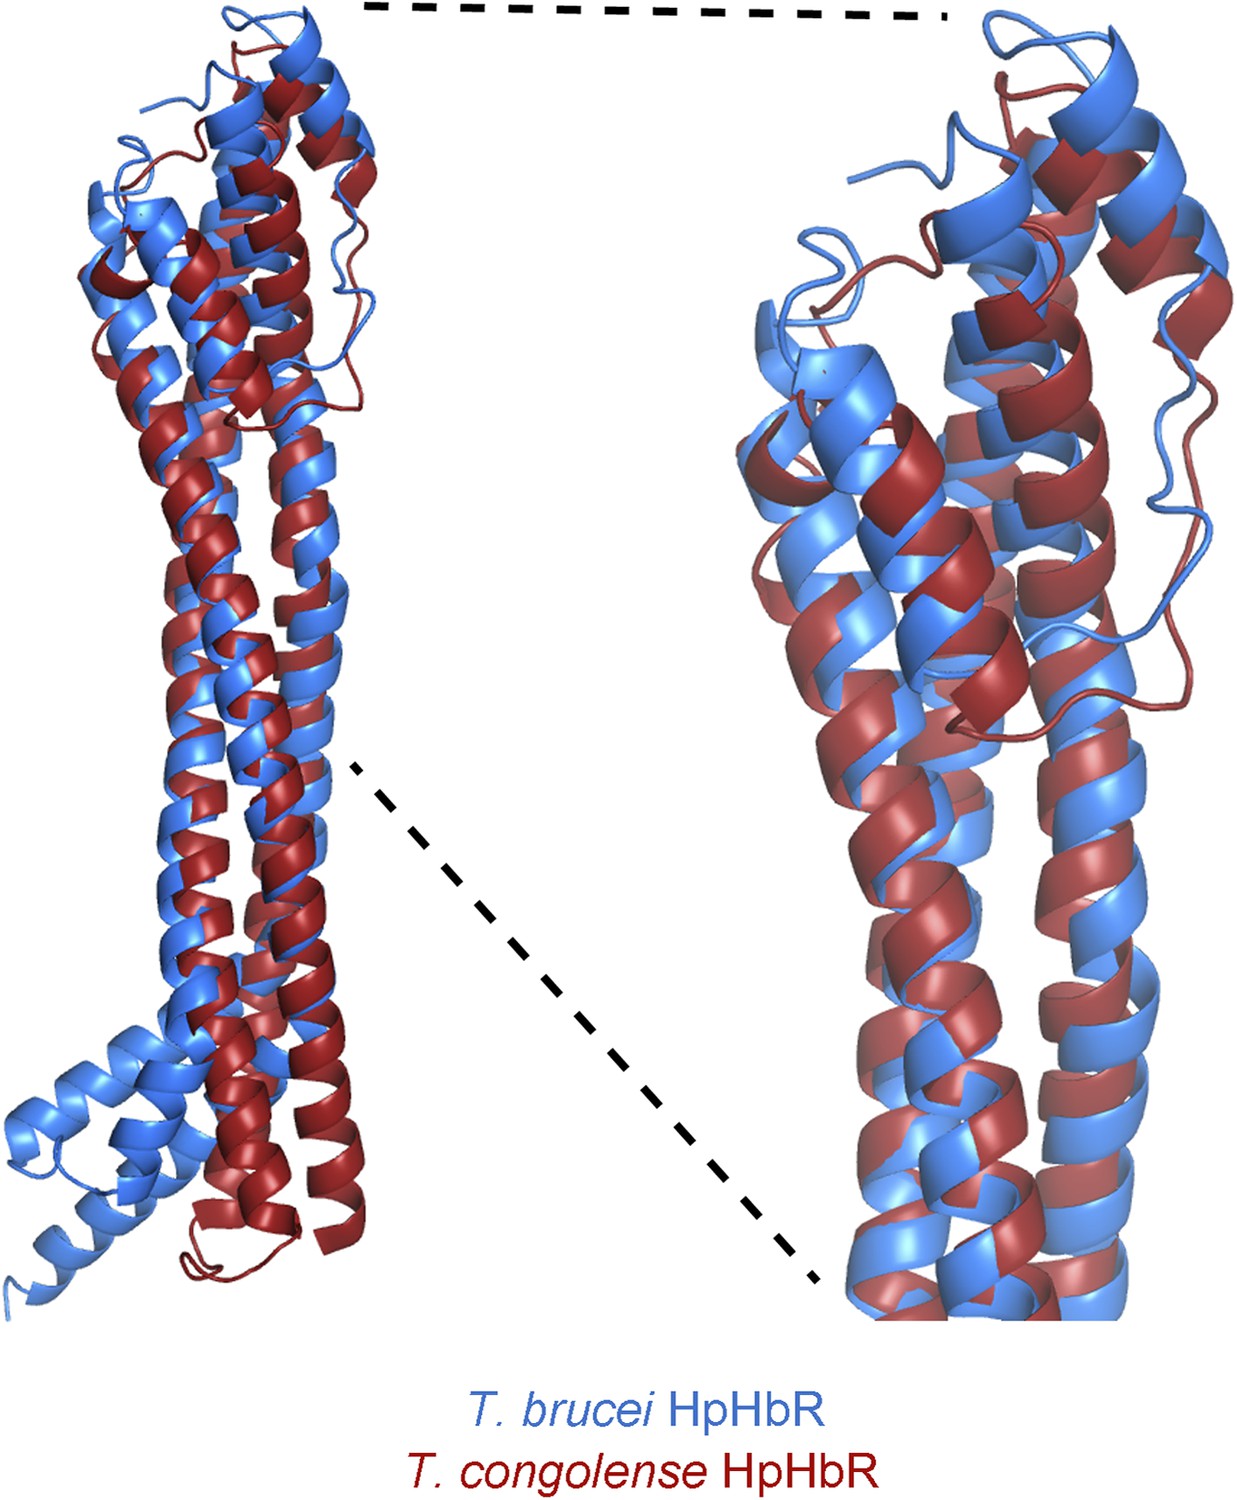
Alignment of the TbHpHbR and TcHpHbR structures.
Structural alignment of T. brucei HpHbR (blue) with T. congolense HpHbR (red). The membrane distal (upper) halves of the receptors align with a root mean square deviation of 1.1 Å while the membrane proximal (lower) halves differ due to the presence of a ∼50° kink in TbHpHbR.
Figure 2 with 4 supplements
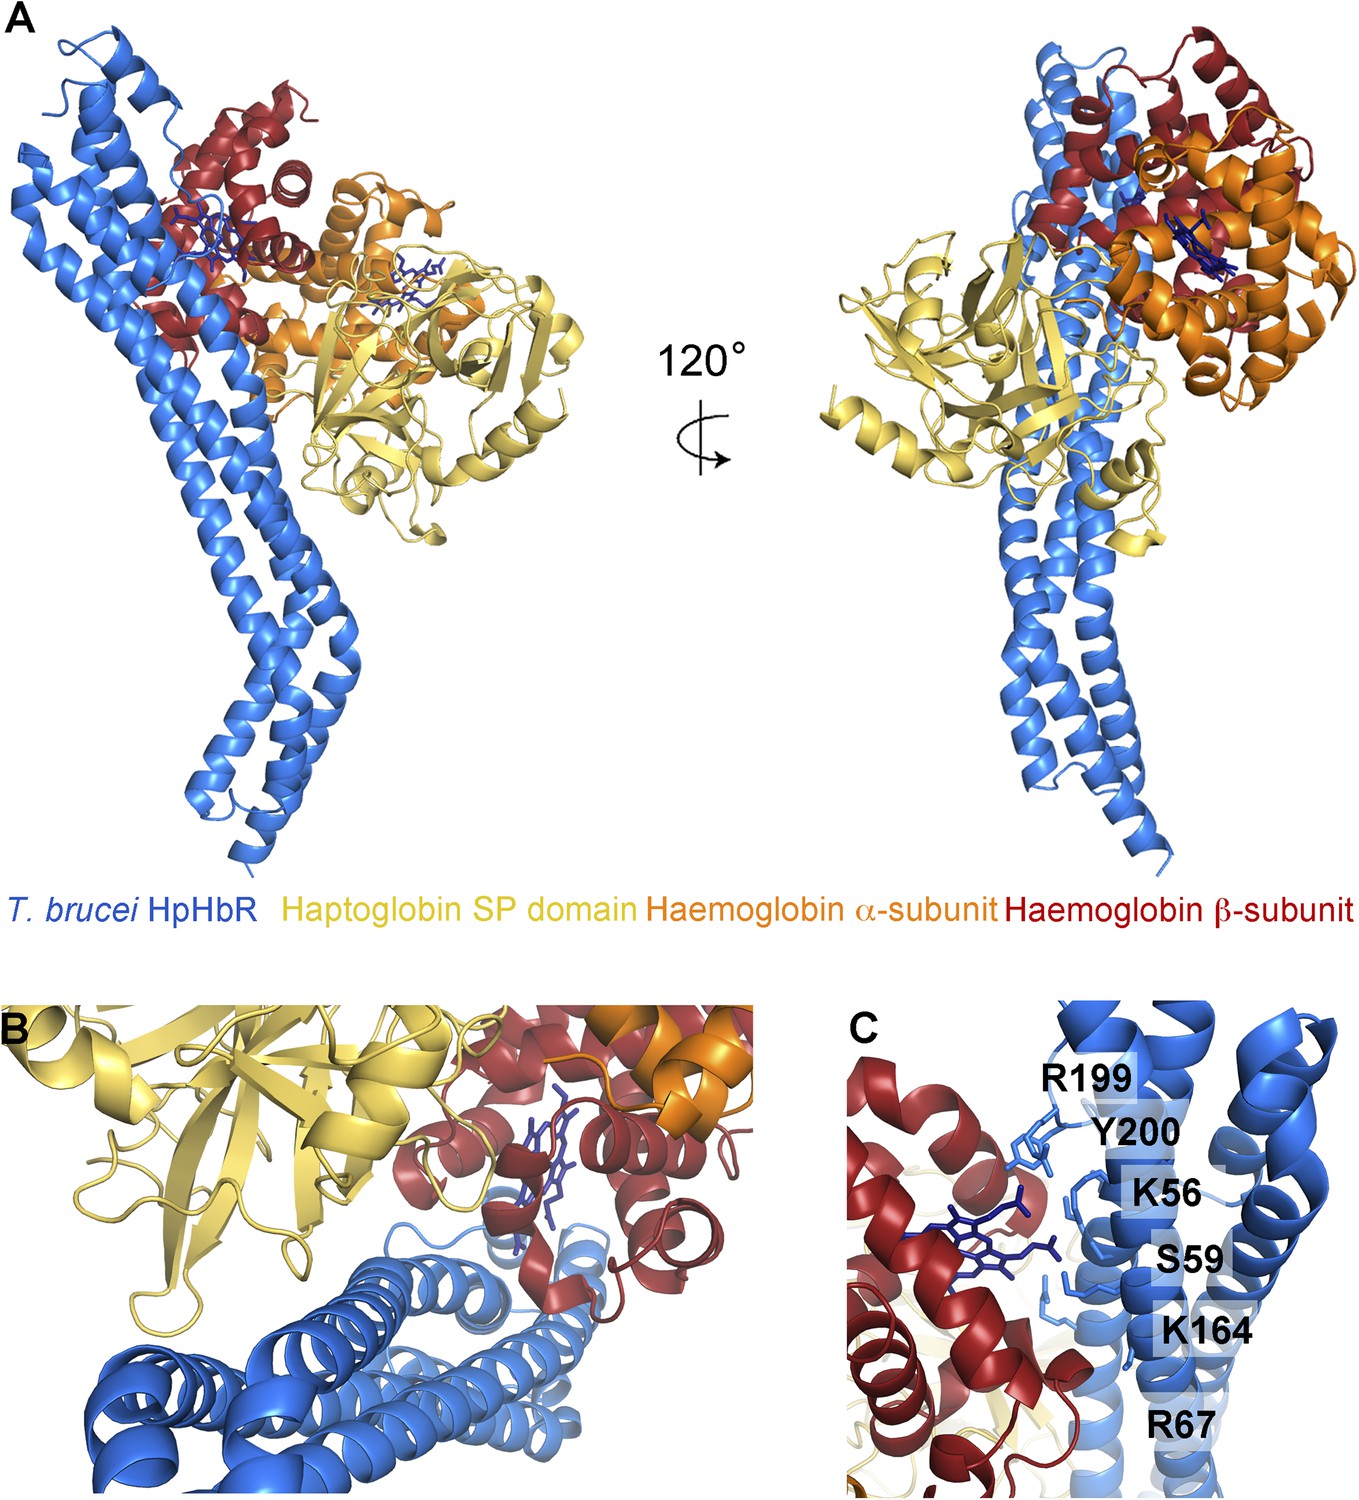
The structural basis for haptoglobin-haemoglobin binding by TbHpHbR.
(A) The structure of the complex between T. brucei HpHbR (blue) bound to its ligand, HpSPHb (haptoglobin is yellow, the β-subunit of haemoglobin is red and the α-subunit of haemoglobin is orange). (B) The complex viewed from the membrane proximal end, showing the contacts made by haptoglobin and the β-subunit of haemoglobin. (C) A view of the haemoglobin-binding site showing direct contacts between the haem and the receptor. Residues from the receptor that directly contact the haemoglobin subunit are shown as sticks and are numbered.
Figure 2—figure supplement 1
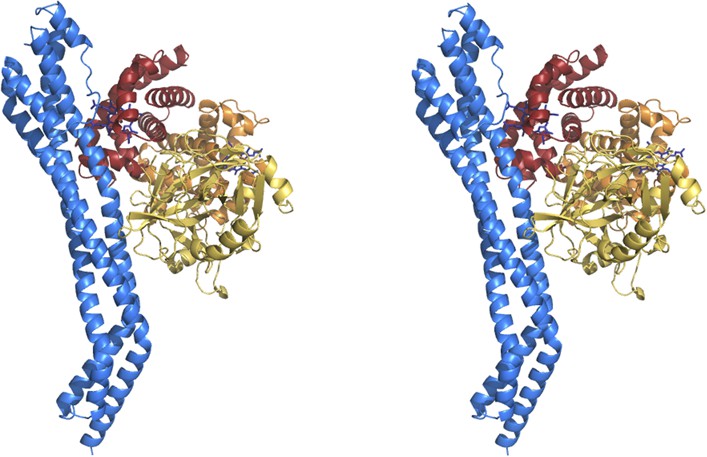
Stereoview of the TbHpHbR in complex with HpHb.
https://doi.org/10.7554/eLife.05553.009
Figure 2—figure supplement 2
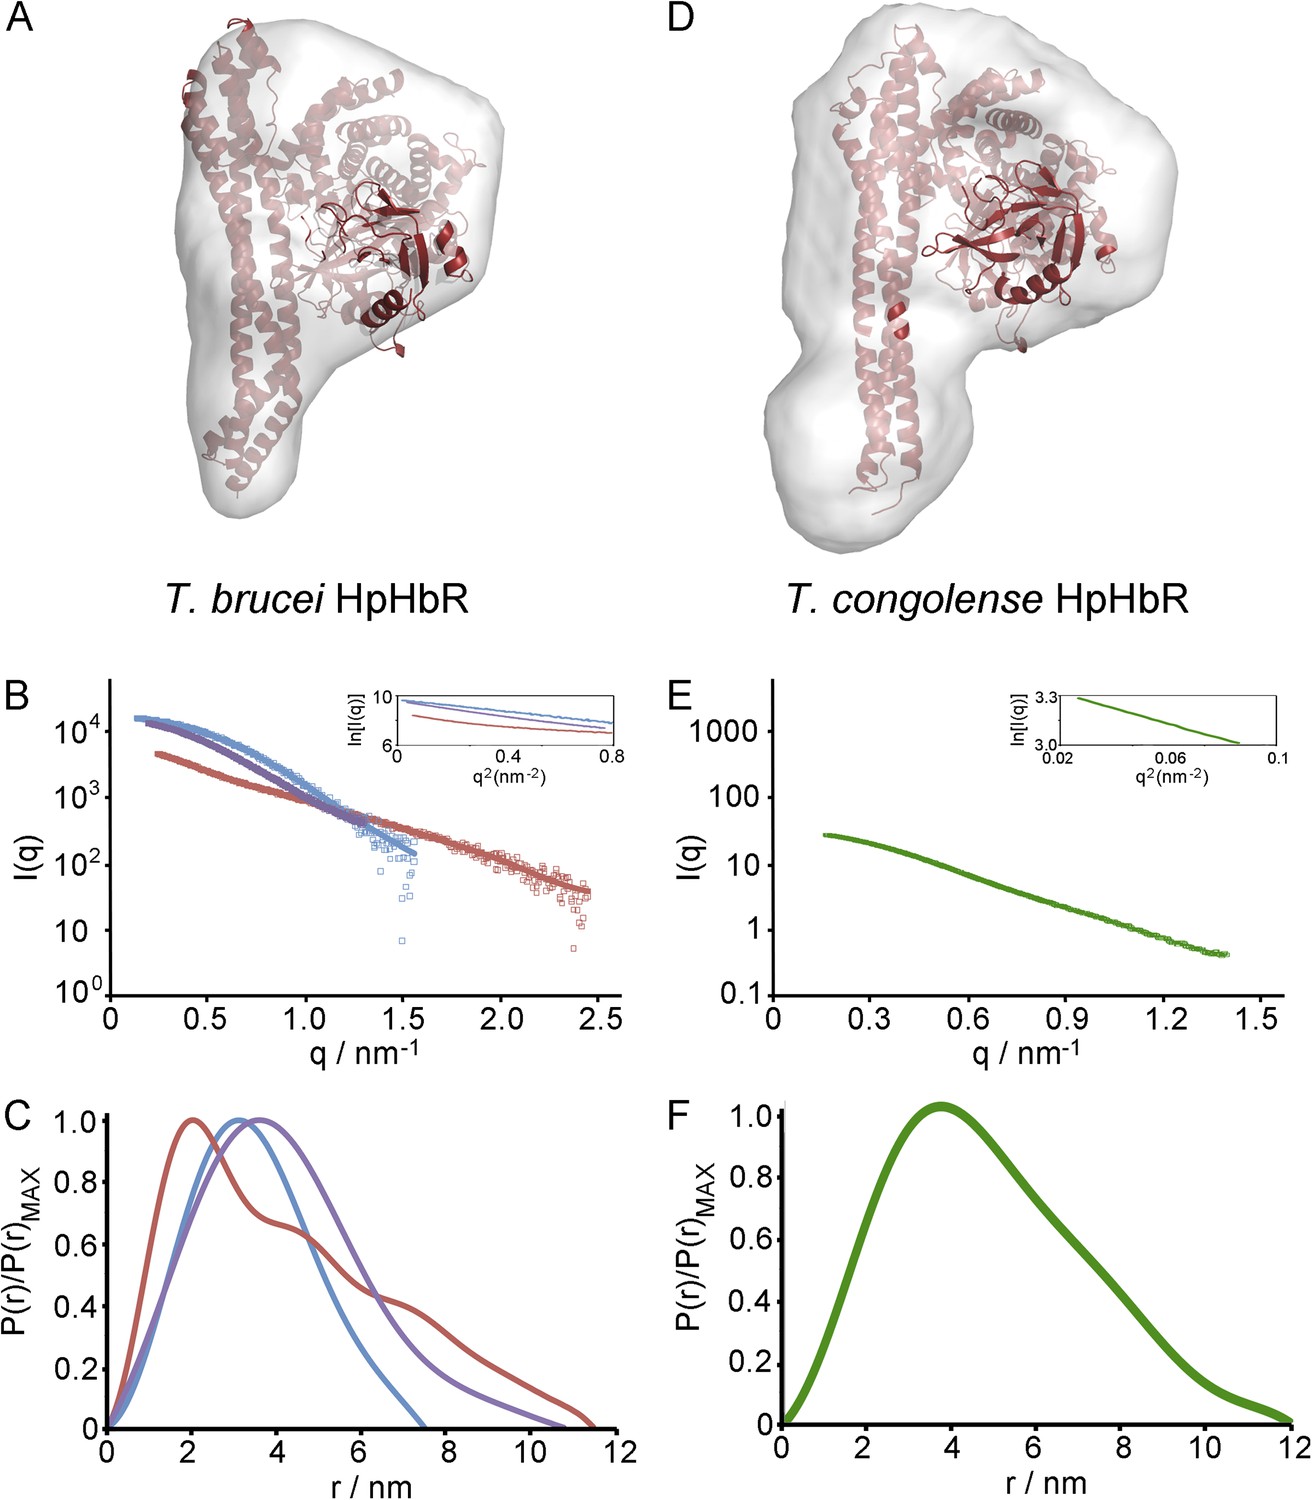
Small angle x-ray scattering of complexes of TcHpHbR and TbHpHbR with HpSPHb.
(A) The structure of the TbHpHbR:HpSPHb complex docked into an ab initio molecular envelopes calculated from scattering data. (B) The theoretical scattering calculated from ab initio reconstructions (blue for HpSPHb, red for TbHpHbR and purple for TbHpHbR:HpSPHb), superimposed into experimental scattering data. Guinier plots are shown as an insert. (C) Distance distribution functions of HpSPHb (blue), TbHpHbR (red) and TbHpHbR:HpSPHb (purple) derived from small angle x-ray scattering. (D) A model of the TcHpHbR:HpSPHb complex docked into an ab initio molecular envelope calculated from scattering data. (E) The theoretical scattering calculated from an ab initio reconstruction of the TcHpHbR:HpSPHb complex. (F) Distance distribution function of TcHpHbR:HpSPHb derived from small angle x-ray scattering.
Figure 2—figure supplement 3
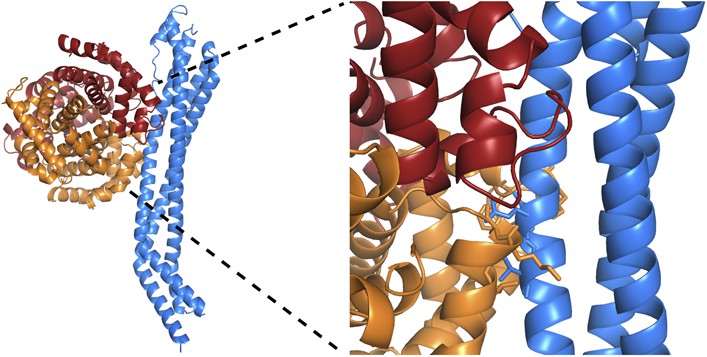
Clashes between TbHpHbR and a haemoglobin tetramer explain why the receptor does not bind to haemoglobin.
A model for a complex of TbHpHbR bound to haemoglobin. This was derived by docking a haemoglobin tetramer onto the receptor with the β-subunit binding to the receptor as in the TbHpHbR:HpSPHb complex. TbHpHbR is shown in blue, the α-subunits of haemoglobin are orange and the β-subunits are red. A close up of the model is shown in the right hand panel with side chains involved in clashes shown as sticks.
Figure 2—figure supplement 4
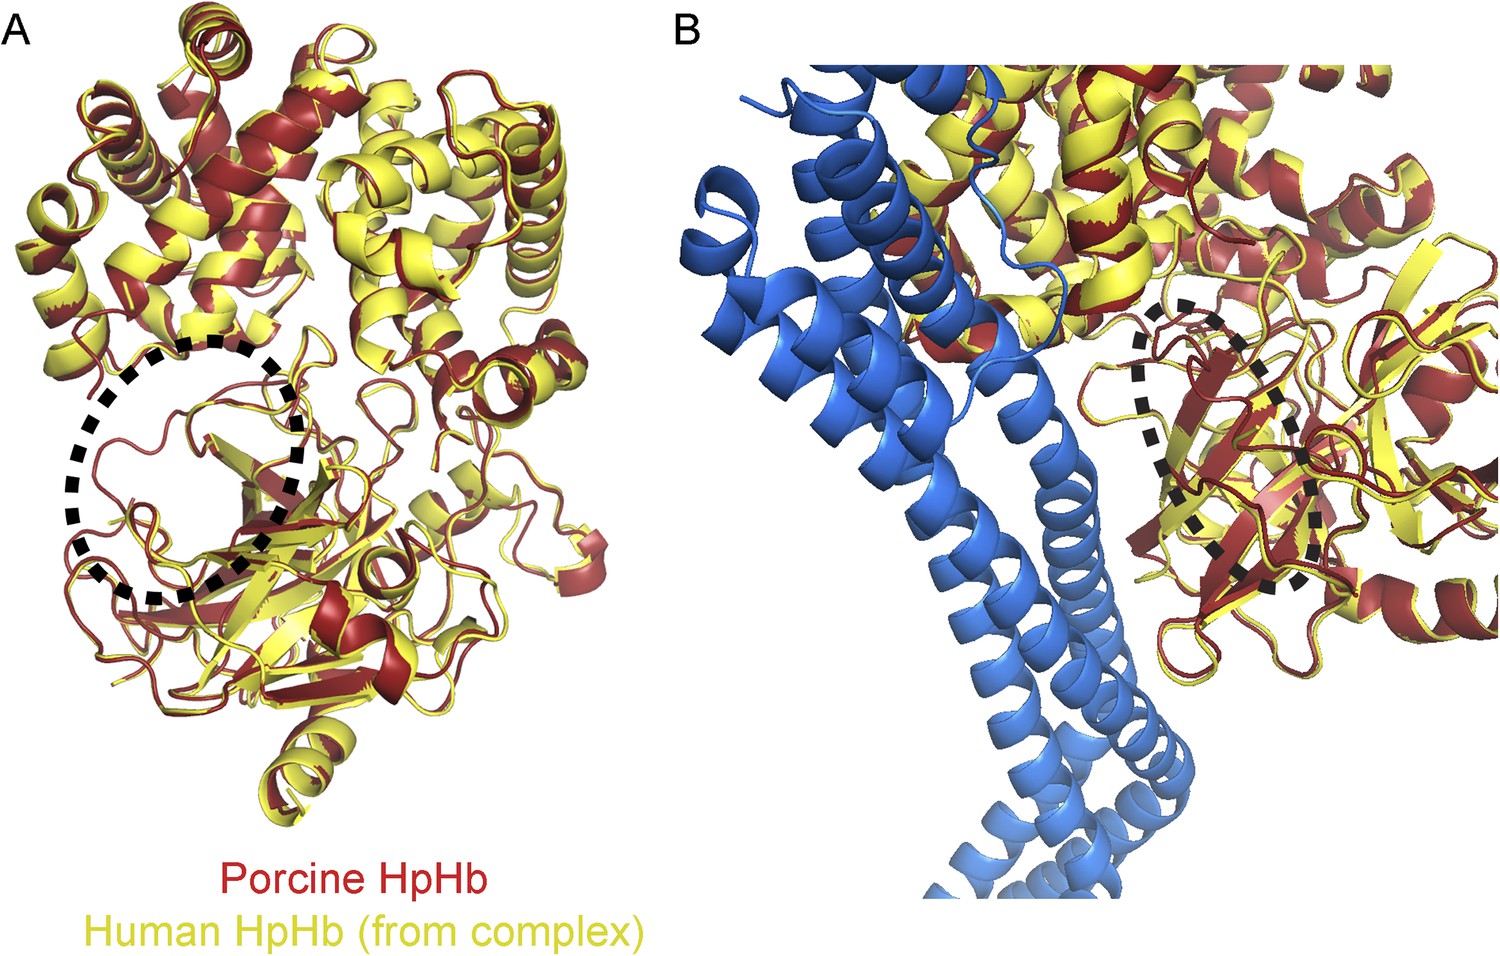
The region affected by haptoglobin cleavage is not involved in interaction with TbHpHbR.
(A) The structures of the HpSPHb region of porcine HpHb (red) aligned to the equivalent region of human HpSPHb from the structure of the TbHpHbR:HpSPHb complex (yellow). The structures align with a root mean square deviation of ∼0.5 Å. The major difference is circled and lies around the site at which haptoglobin is cleaved during a processing event in the endoplasmic reticulum, which is disordered in the TbHpHbR:HpSPHb complex. (B) A structural alignment of the porcine HpSPHb structure onto the TbHpHbR:HpSPHb structure. The region that is structurally altered by cleavage is circled and is not involved in contacts with the receptor. This is confirmed by surface plasmon resonance data (Figure 1—figure supplement 1) which shows that TbHpHbR binds with similar affinity to HpSPHb as to previously measured native, cleaved HpHb.
Figure 3
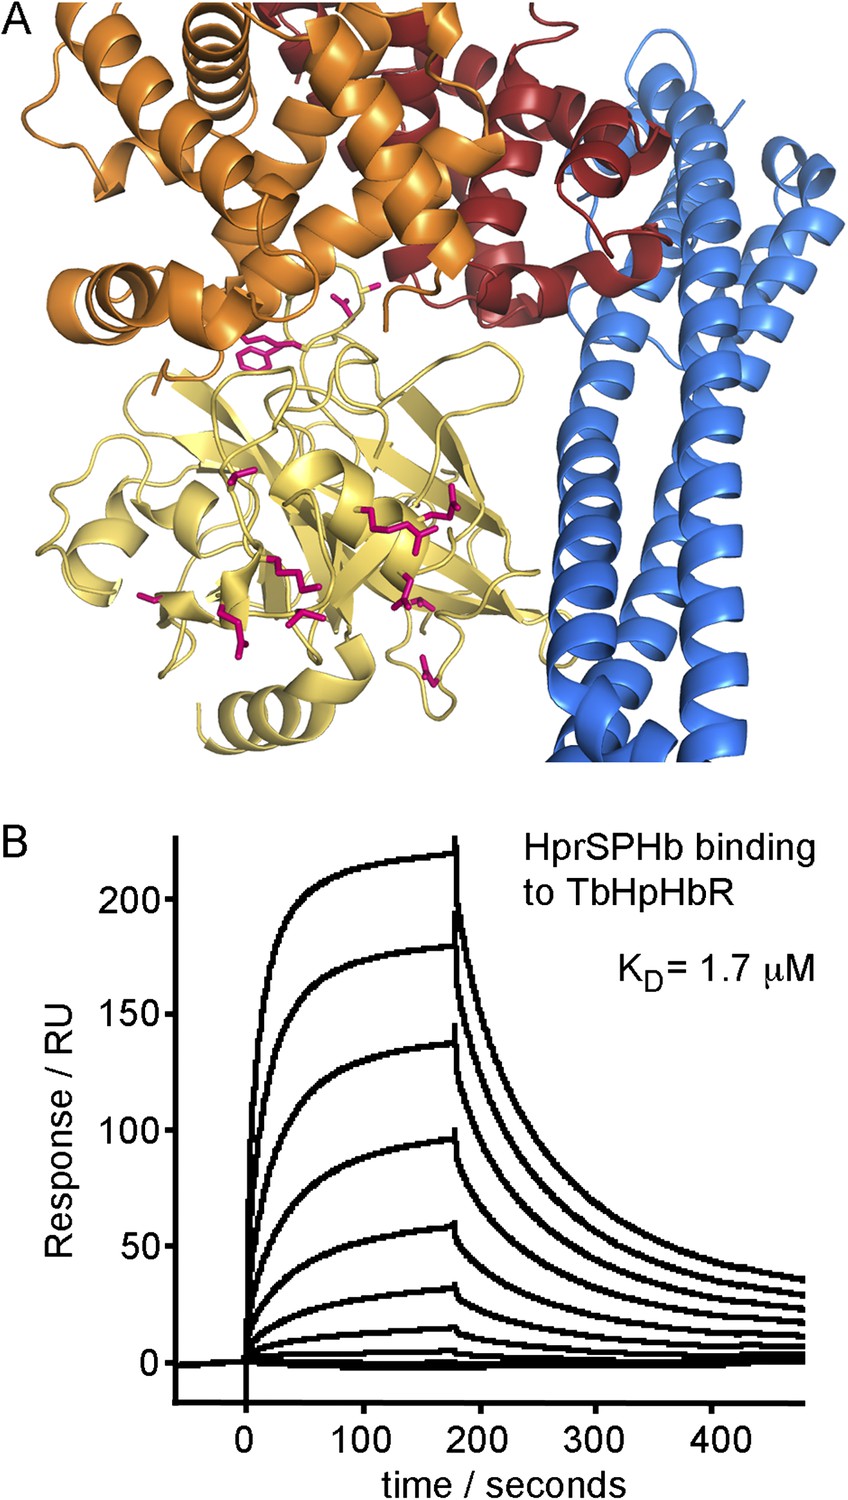
Differences between haptoglobin and haptoglobin-related protein do not alter affinity for TbHpHbR.
(A) The structure of the TbHpHbR:HpSPHb complex is shown with the receptor in blue and haptoglobin in yellow. Side chains in haptoglobin that are different in haptoglobin-related protein are highlighted in pink and are not involved in making interactions with the receptor. (B) Surface plasmon resonance signals for two-fold dilutions of HprSPHb complex from a maximum concentration of 8 μM, binding to a surface coated with T. brucei HpHbR. The measured affinity of 1.7 μM can be compared with the affinity of 0.7 μM for HpSPHb.
Figure 4 with 3 supplements
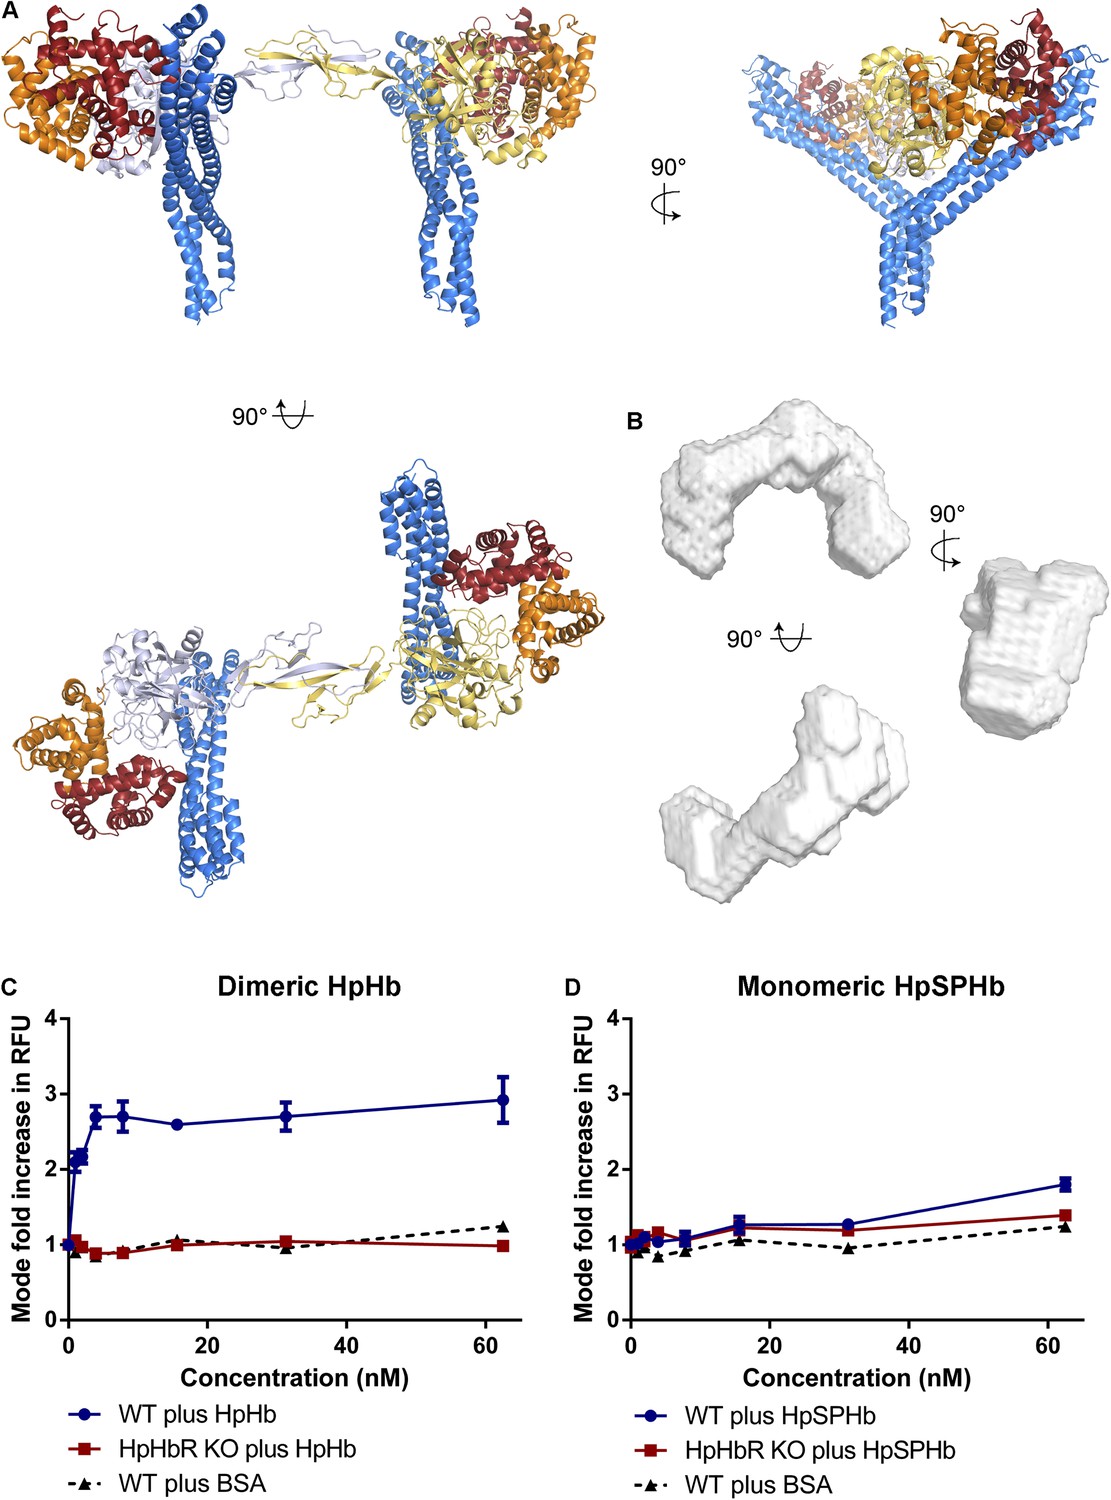
Simultaneous binding of two receptors to each HpHb dimer leads to more efficient uptake into trypanosomes.
(A) A model for a complex of one HpHb dimer bound to two receptors, generated by docking the structure of the TbHpHbR:HpSPHb complex onto that of porcine HpHb (Andersen et al., 2012). The receptors are organized such that two receptors, both associated with the membrane through attachment at their C-termini, can simultaneously bind to one HpHb dimer. (B) An ab initio molecular envelope derived from small angle x-ray scattering analysis of the TbHpHbR:HpHb complex supports the formation of a complex containing one HpHb dimer bound to two receptors. (C) Uptake of fluorescently labelled dimeric HpHb into live cells was monitored via flow cytometry across a range of 1–62.5 nM. Uptake saturated by 4 nM in wild-type cells whereas no uptake was observed in the HpHbR null cell line. No fluid phase uptake of labelled BSA was observed at these concentrations. (D) Uptake of fluorescently labelled monomeric HpSPHb was not readily detected until 62.5 nM, at which point uptake had not saturated. HpSPHb uptake at 62.5 nM was lost in the HpHbR null cell line. Each uptake assay was carried out in triplicate. Error bars represent standard error of the mean, n = 3.
Figure 4—figure supplement 1
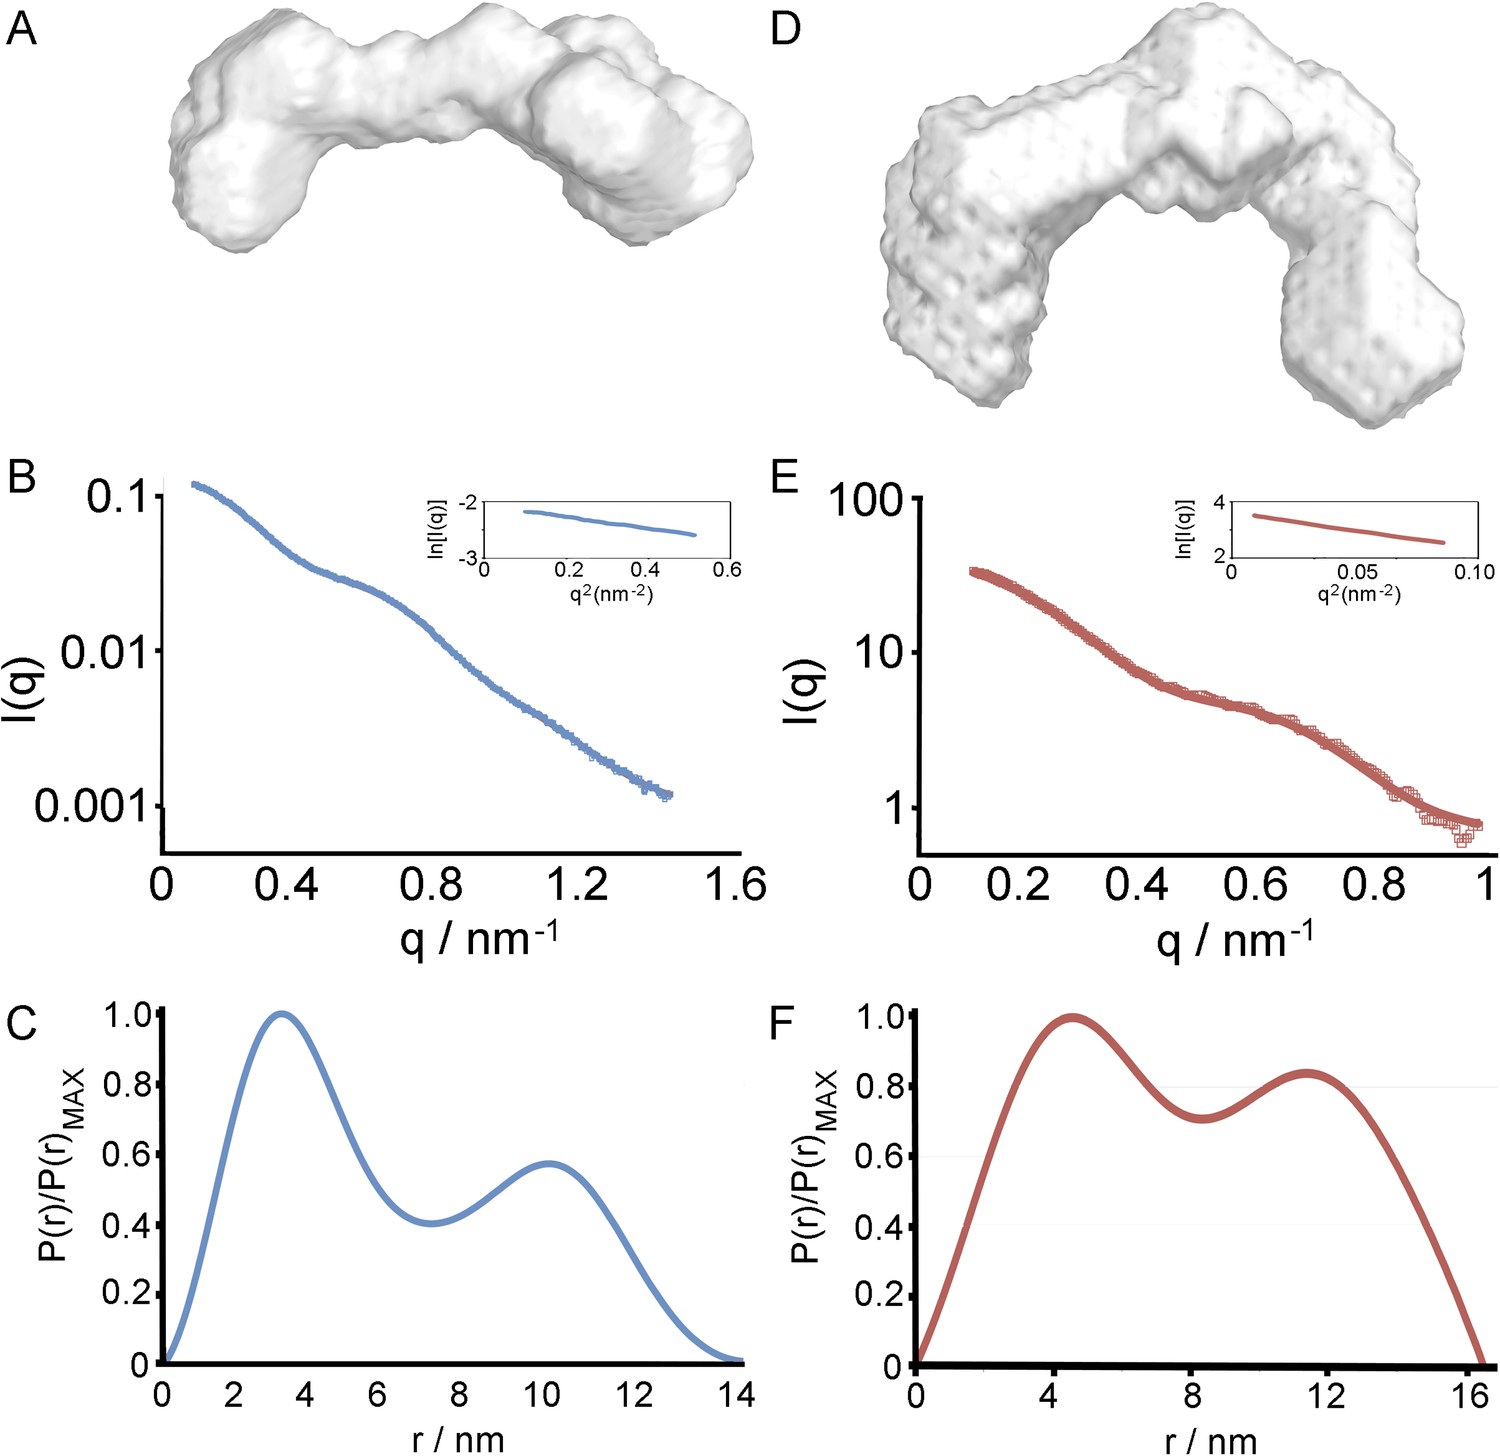
Small angle x-ray scattering of HpHb, alone and in complex with TbHpHbR.
(A) An ab initio molecular envelopes calculated from scattering data from the HpHb complex. (B) The theoretical scattering calculated from ab initio reconstructions for HpHb superimposed into experimental scattering data. Guinier plots are shown as an insert. (C) Distance distribution functions of HpHb derived from small angle x-ray scattering. (D) An ab initio molecular envelopes calculated from scattering data from the TbHpHbR:HpHb complex. (E) The theoretical scattering calculated from ab initio reconstructions for TbHpHbR:HpHb superimposed into experimental scattering data. Guinier plots are shown as an insert. (F) Distance distribution functions of TbHpHbR:HpHb derived from small angle x-ray scattering.
Figure 4—figure supplement 2
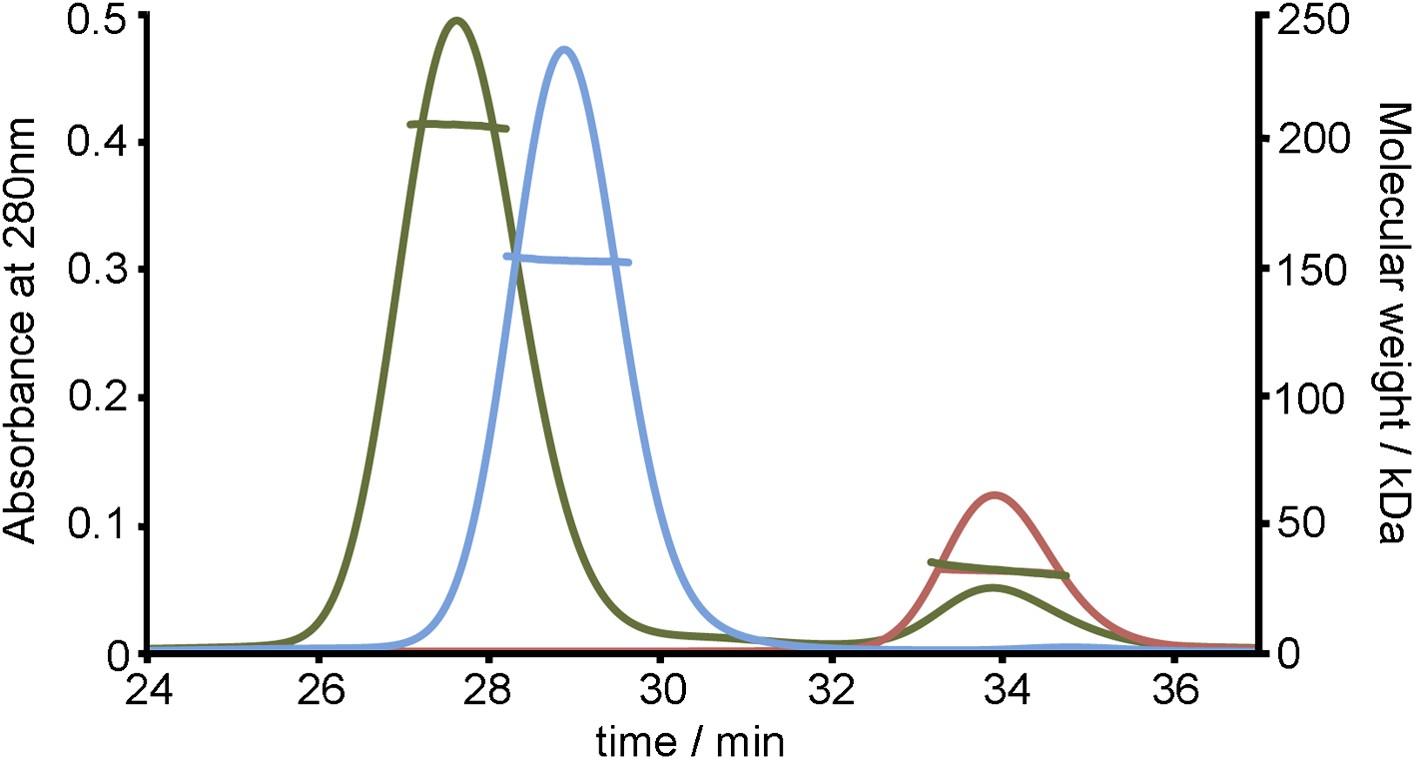
SEC MALLS data to assess the stoichiometry of the TbHpHbR:HpHb complex.
Multi-angle light scattering (MALLS) measurements of TbHpHbR (red), HpHb (blue) and the TbHpHbR:HpHb complex (green). The molecular weights determined from scattering data (∼30 kDa for TbHpHbR, ∼150 kDa for HpHb and ∼210 kDa for the TbHpHbR:HpHb complex) show the formation of a complex containing two receptors bound to a single HpHb.
Figure 4—figure supplement 3
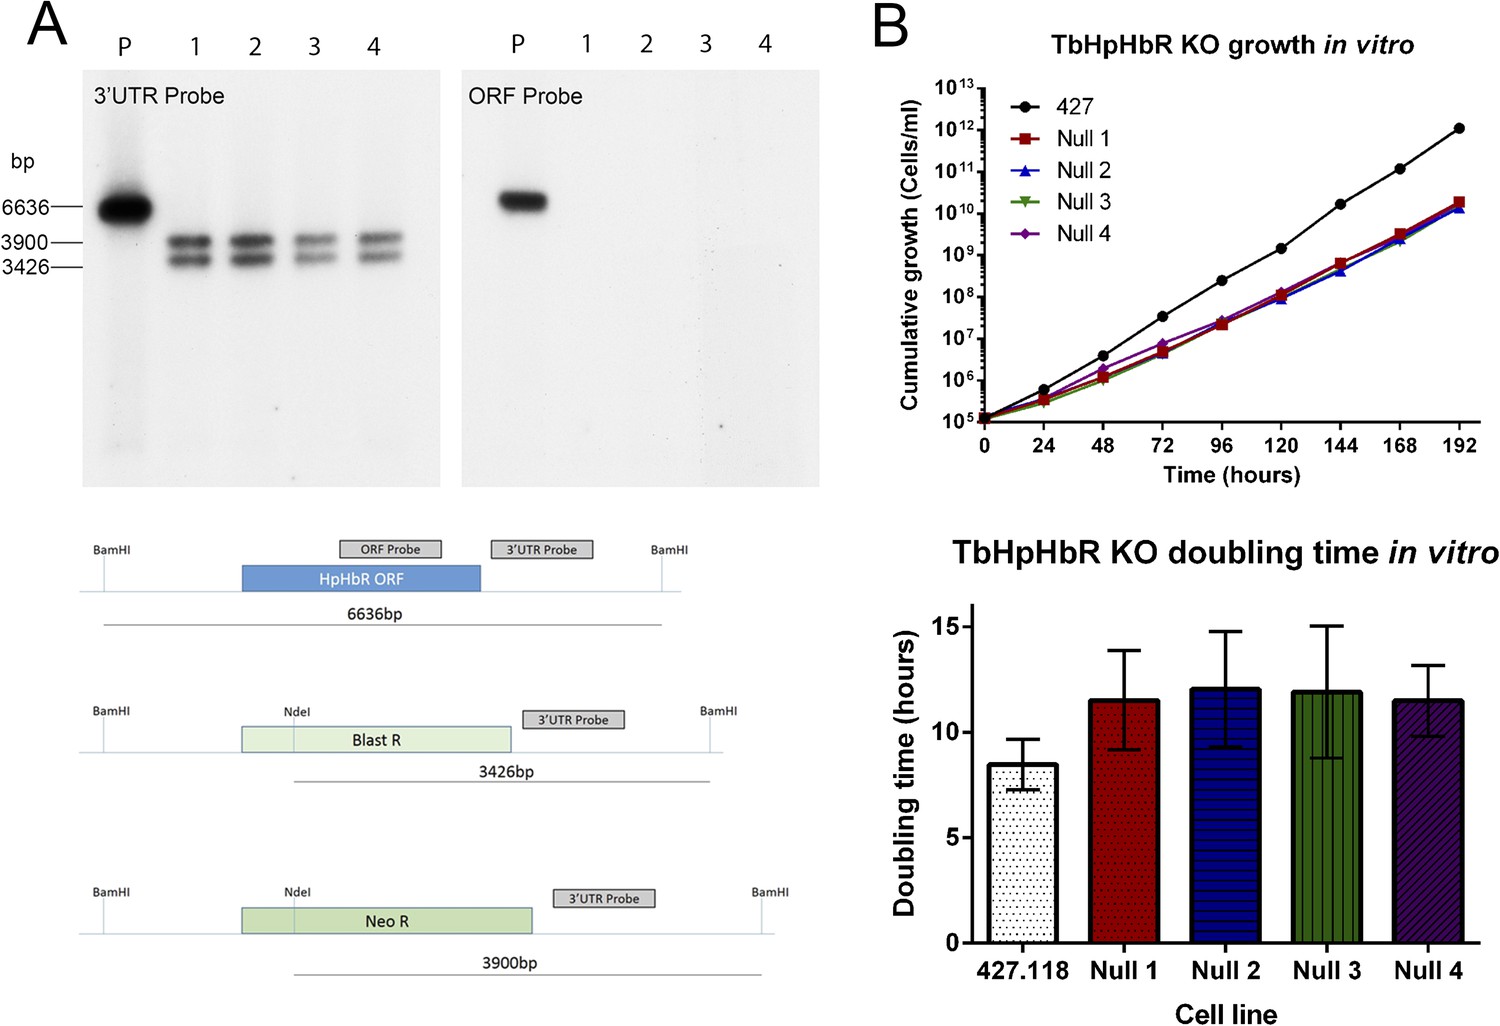
Establishment and characterization of an HpHb−/− cell line of T. brucei.
TbHpHbR null cell lines were generated in T. b. brucei Lister 427 bloodstream form (BSF) cells. (A) The TbHbHbR gene was knocked out in Lister 427 BSF cells by replacement of one allele with a blasticidin resistance gene and the other allele with a neomycin resistance gene in four independent clones, as confirmed by Southern blot (P = Parental cell line, 1–4 = TbHpHbR null clones 1–4). The schematic depicts the original (top) and replacement (middle and lower) TbHpHbR loci and the positions of Southern blot probes and restriction enzyme sites used. Expected fragment sizes are annotated. (B) Growth of the TbHpHbR null clones was monitored in vitro over 192 hr. Parental L427 cells grew with a mean doubling time of 8.4 hr whereas the TbHpHbR null clones had an increased mean doubling time of 11.5–12.0 hr. Error bars represent standard deviation, n = 8.
Figure 5
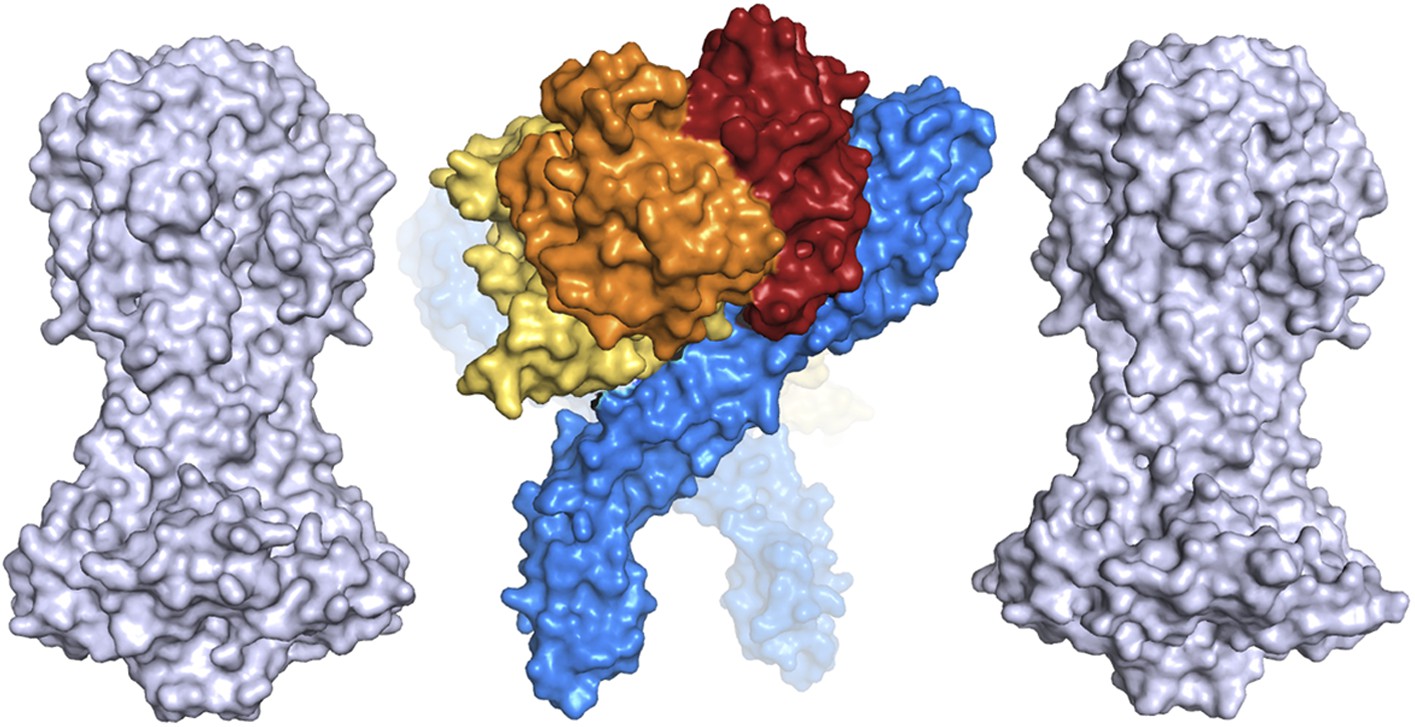
A comparison of the dimensions of the TbHpHbR:HpHb complex with those of the N-terminal domains of the variant surface glycoproteins (shown in grey).
This suggests that HpHb will lie at least partially within the VSG layer when bound to two receptors.
Tables
Table 1
Crystallographic data collection statistics
| HpSPHb | Tbb HpHbR | TbbHpHbR:HpSPHb | |
|---|---|---|---|
| Beamline | Diamond I04-1 | Diamond I03 | Diamond I03 |
| Space Group | p3121 | p21 | c2 |
| Cell dimensions (Å) | a = b = 96.6, c = 132.77 | a = 27.90, b = 47.79, c = 203.38, β = 92.79 | a = 223.4, b = 56.59, c = 65.29, β = 92.99 |
| Resolution (Å) | 2.05 | 1.85 | 3.1 |
| Wavelength (Å) | 0.916 | 0.9763 | 0.9750 |
| RPIM (%) | 8.1 (37.4) | 4.5 (42.9) | 6.3 (72.6) |
| I/ σ(I) | 8.7 (2.3) | 10.2 (2.0) | 9.8 (1.6) |
| Completeness (%) | 99.8 (100) | 97.4 (96.5) | 96.9 (97.1) |
| Multiplicity | 9.6 (10.2) | 3.1 (3.1) | 3.2 (3.3) |
Table 2
X-ray refinement statistics
| Complex | HpSPHb | Tbb HpHbR | TbbHpHbR:HpSPHb |
|---|---|---|---|
| Resolution (Å) | 2.05 | 1.85 | 3.1 |
| No. reflections | 43,170 | 44,685 | 17,302 |
| Rwork / Rfree (%) | 18.0 / 22.4 | 19.84 / 23.95 | 19.5 / 21.7 |
| No. of protein residues in model | 544 | 523 | 782 |
| rmsd bond lengths (Å) | 0.020 | 0.017 | 0.012 |
| rmsd bond angles (°) | 2.0 | 1.6 | 1.5 |
| Ramachandran plot | |||
| Allowed region | 89.0% | 98.8% | 92.5% |
| Additional allowed region | 11% | 1.2% | 7.5% |
| Generously allowed region | 0% | 0% | 0% |
| Disallowed region | 0% | 0% | 0% |
Table 3
Small angle x-ray scattering statistics
| MW (kDa) | RG (nm) | Dmax (nm) | Volume (nm3) | Mwapp (kDa) | |
|---|---|---|---|---|---|
| HpSPHb | 59.7 | 2.6 | 7.5 | 75 | 36 |
| TbHpHbR | 32.2 | 3.5 | 11.5 | 44 | 22 |
| TbHbHbR:HpSPHb | 91.8 | 3.2 | 10.8 | 110 | 55 |
| TbHpHbR:HpSPHb | 89.6 | 3.8 | 12.0 | 140 | 70 |
| HpHb | 152 | 5.6 | 18.2 | 214 | 107 |
| TbHpHbR:HpHb | 217 | 6.3 | 16.5 | 370 | 185 |
Table 4
Interactions between TbHpHbR and HpSPHb
| Receptor | HpSPHb | ||||
|---|---|---|---|---|---|
| Residue | Group | Chain | Residue | Group | Interaction |
| Hbβ | |||||
| K56 | side chain | B | Haem144 | O1D | Hydrogen bond |
| E57 | side chain | B | K96 | Side chain | Salt bridge |
| S59 | side chain | B | Haem144 | O1D/O2D | Hydrogen bond |
| I60 | side chain | B | Patch | Hydrophobic | |
| R67 | side chain NH1 | B | R41 | Backbone CO | Hydrogen bond |
| E70 | side chain OE1/OE2 | B | R41 | Side chain NE/NH2 | Salt bridge |
| S161 | side chain | B | K60 | Side chain | Hydrogen bond |
| S161 | side chain | B | S45 | Backbone CO | Hydrogen bond |
| K164 | side chain | B | Haem144 | O2D | Hydrogen bond |
| R199 | side chain NE | B | Haem144 | O2A | Hydrogen bond |
| Y200 | side chain OH | B | Haem144 | O2A | Hydrogen bond |
| S203 | backbone CO | B | K96 | Side chain | Hydrogen bond |
| HpSP | |||||
| S73 | side chain | C | K345 | Side chain | Hydrogen bond |
| V74 | hydrophobic | C | Patch | Hydrophobic | |
| Q75 | OE1 | C | G276 | Backbone CO | Hydrogen bond |
| A78 | side chain | C | Patch | Hydrophobic | |
| A82 | side chain | C | Patch | Hydrophobic | |
| K85 | side chain | C | D305 | Side chain O2D | Salt bridge |
Download links
A two-part list of links to download the article, or parts of the article, in various formats.
Downloads (link to download the article as PDF)
Open citations (links to open the citations from this article in various online reference manager services)
Cite this article (links to download the citations from this article in formats compatible with various reference manager tools)
Structural basis for ligand and innate immunity factor uptake by the trypanosome haptoglobin-haemoglobin receptor
eLife 3:e05553.
https://doi.org/10.7554/eLife.05553


