Range-dependent flexibility in the acoustic field of view of echolocating porpoises (Phocoena phocoena)
- Aarhus University, Denmark
- University of Southern Denmark, Denmark
- University of Toronto Mississauga, Canada
- University of St Andrews, Scotland
- University of Tübingen, Germany
- Fjord and Belt, Denmark
Figures
Figure 1
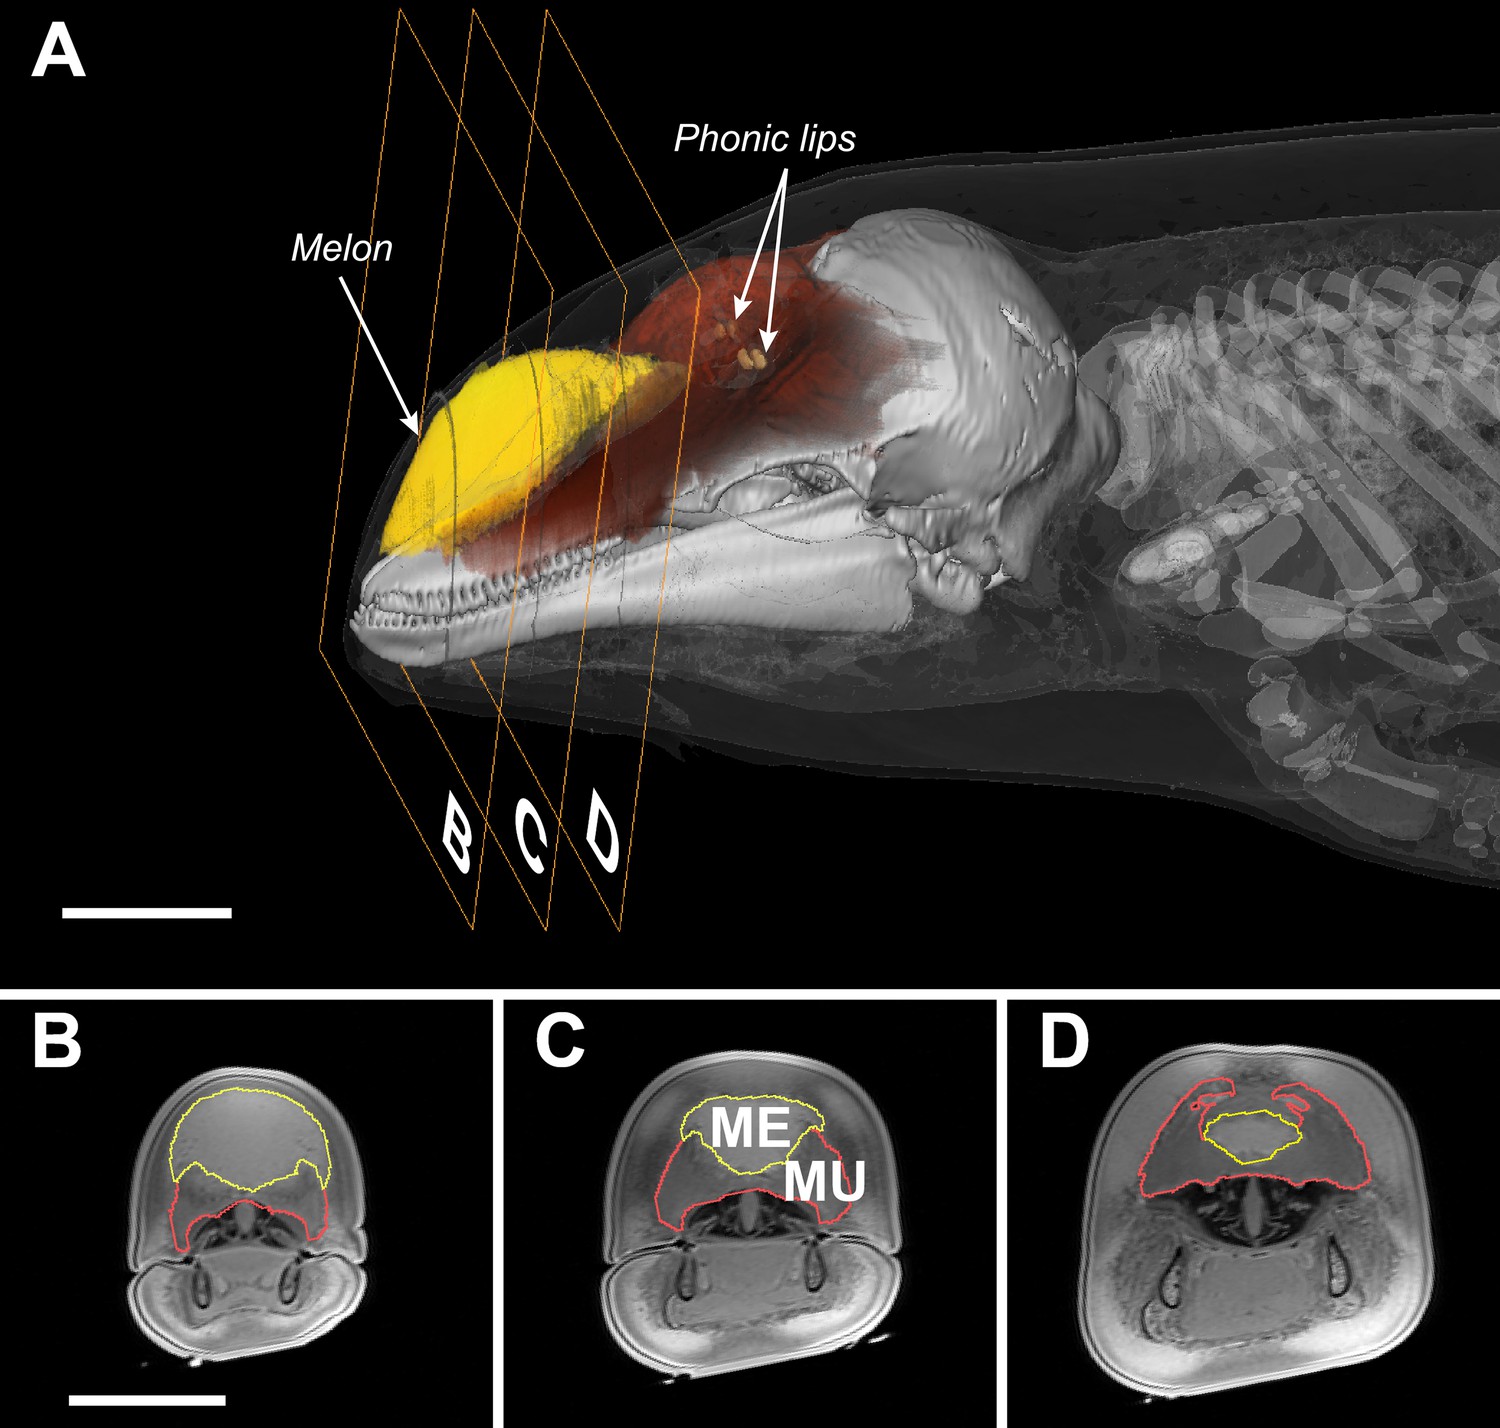
Transverse MRI scans of a young harbour porpoise.
The scale bars indicate 5 cm (bar in B applies also to C and D). The caudal part of the melon (yellow, A) abuts against layers of connective tissue, muscles, and tendons (red, A) forming a dense theca, which, along with the skull and a collection of nasal air sacs, reflect the vibrations that originate in the phonic lips (light brown, A) into the melon (Aroyan et al., 1992; Cranford et al., 1996). The melon is under control of highly developed facial musculature (Harper et al., 2008; Huggenberger et al., 2009). The fibers and tendons of the muscles (Mu) associated with the melon (Me) lie at oblique angles relative to the frontal, transverse, and sagittal body planes (Harper et al., 2008; Huggenberger et al., 2009). The actions of these richly innervated muscles can change the three-dimensional shape and/or stiffness of the melon (Harper et al., 2008; Huggenberger et al., 2009), and thus likely adjust the properties of the emitted sound.
Figure 2
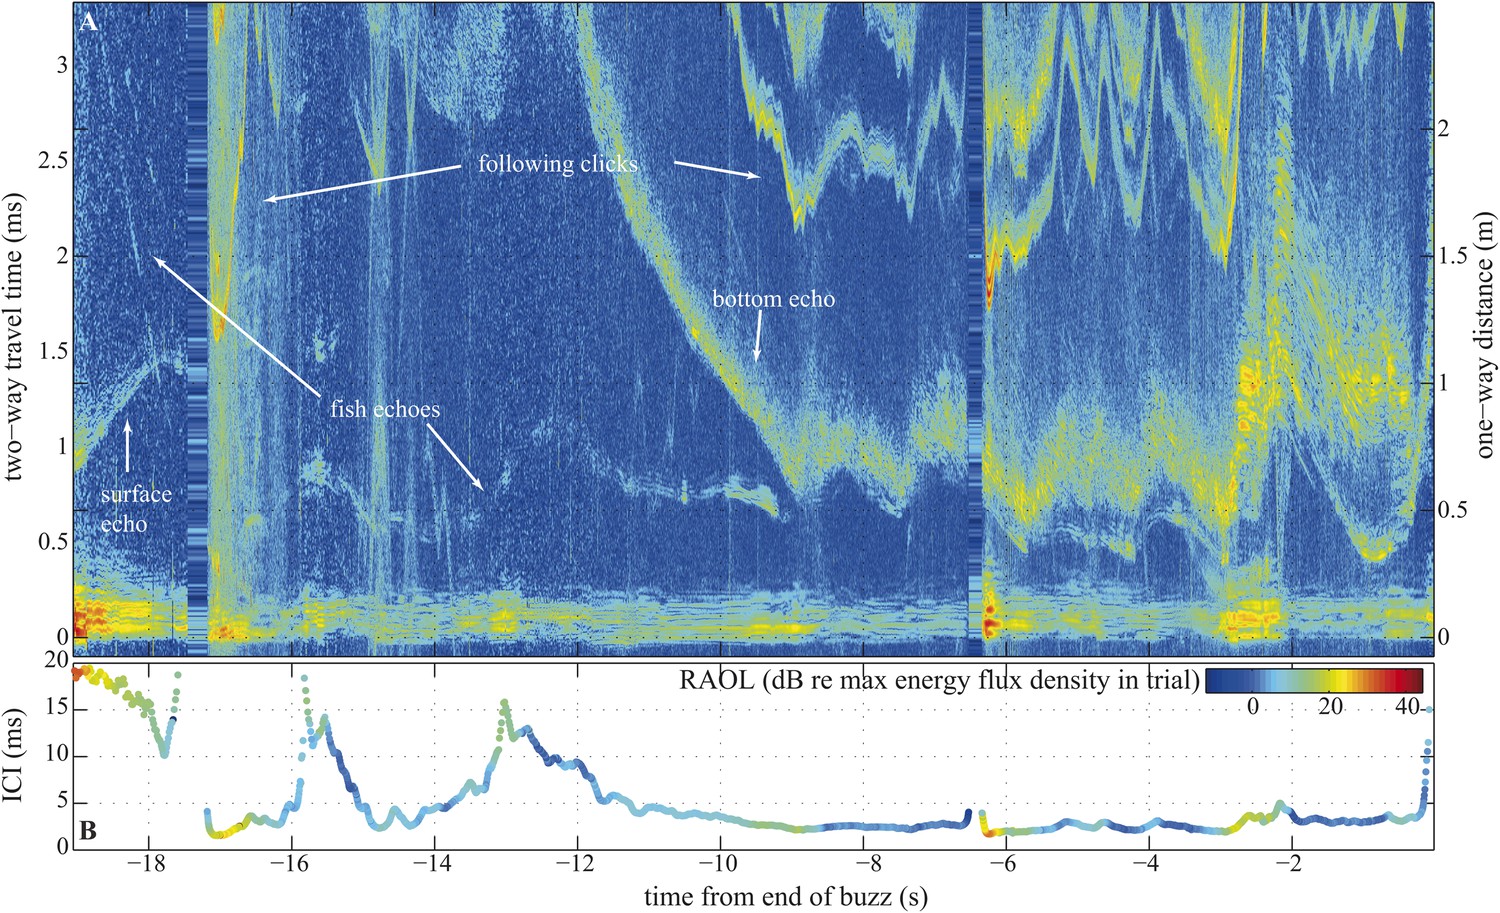
Long terminal phase of prey pursuit by an echolocating harbour porpoise.
(A) Echogram (see ‘Material and methods’: Live prey capture) displaying sonar clicks and echoes recorded by an acoustic tag attached to the animal just behind its blowhole (Johnson et al., 2004). y-axis (left) indicates time elapsed from emitted clicks to returning echoes, expressed also as target range (right). Clicks emitted at rates corresponding to inter-click intervals shorter than 3.3 ms time-window are displayed repeatedly. The color scale indicates signal energy from blue (faint) to red (intense). As pursuit proceeds from water column (0.7–1.1 m from surface, 2–2.5 m above sea floor) to sea bottom the immediate acoustic scene becomes more cluttered with complex bottom echoes shortly following fish echoes (from −9 s onwards). (B) Inter-click intervals color-coded for relative apparent output level (RAOL; [Wisniewska et al., 2012]) of signals as recorded by the tag. RAOL variation may stem from rapid head movements, source level adjustments, and/or beam directionality changes (with less energy reaching the tag from a narrow beam). On two occasions, when the fish escaped into the open space of the water column (at −16 s and −13 s), the porpoise increased its ICIs significantly, beyond the values considered as buzz (Wisniewska et al., 2012). However, when the fish escaped to similar distances while being at the bottom (and thus moving in arguably a more predictable way) the porpoise increased the ICIs only slightly, which might point to anticipatory acoustic tracking on the part of the echolocating animal.
Figure 3
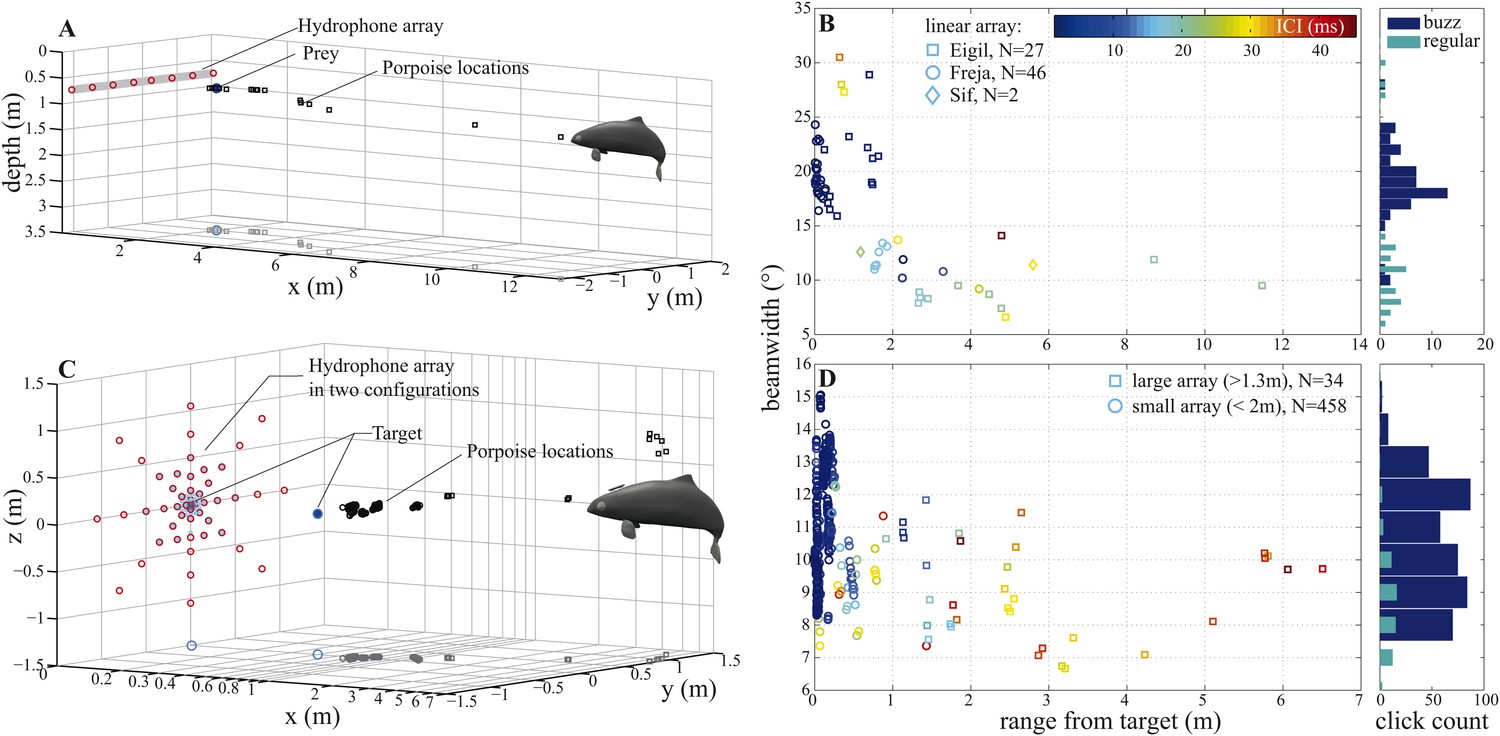
Porpoise biosonar beam widens at short target ranges.
3 dB beamwidth recorded in two experimental setups: (A, B) three harbour porpoises closing on prey and (C, D) a harbour porpoise approaching an aluminum sphere target. (A, C) show reconstructed porpoise locations for clicks fulfilling inclusion criteria in one trial per array configuration. Targets and their projections in the x–y plane are marked with dark-blue filled and open circles, respectively. For the small array recordings (light blue in C), the target was displaced outward to 0.4 m from the array to maintain high spatial resolution at short ranges. (B) Data collected using a horizontal array with effective angular resolution (EAR) of ∼12° at ranges of target interception (N = 75). Data points from Freja, the porpoise participating in experiment two, are represented with circles. (D) Data gathered with star-shaped arrays in two configurations: large (red in C), for long-range recordings (>1.3 m from array to sound source, squares, N = 34) and small (light blue in C), for greater resolution at short ranges (<2 m from array to sound source, circles, N = 458) (see Figure 4—figure supplement 1 for a detailed view of hydrophone spacing in the two array configurations). Hydrophone spacing provided EAR of ∼5° at the shortest ranges from the source examined. Color in (B) and (D) indicates inter-click intervals (ICI), with buzz starting at 13 ms (Wisniewska et al., 2012). Buzz- and regular-click datasets in (D), used at short- and long-ranges, respectively, have different distributions, but similar medians, because during buzzes the animal repeatedly changed its beamwidth (Figure 6). Beam of the long-range clicks varied less and is better approximated by the median.
Figure 4 with 1 supplement
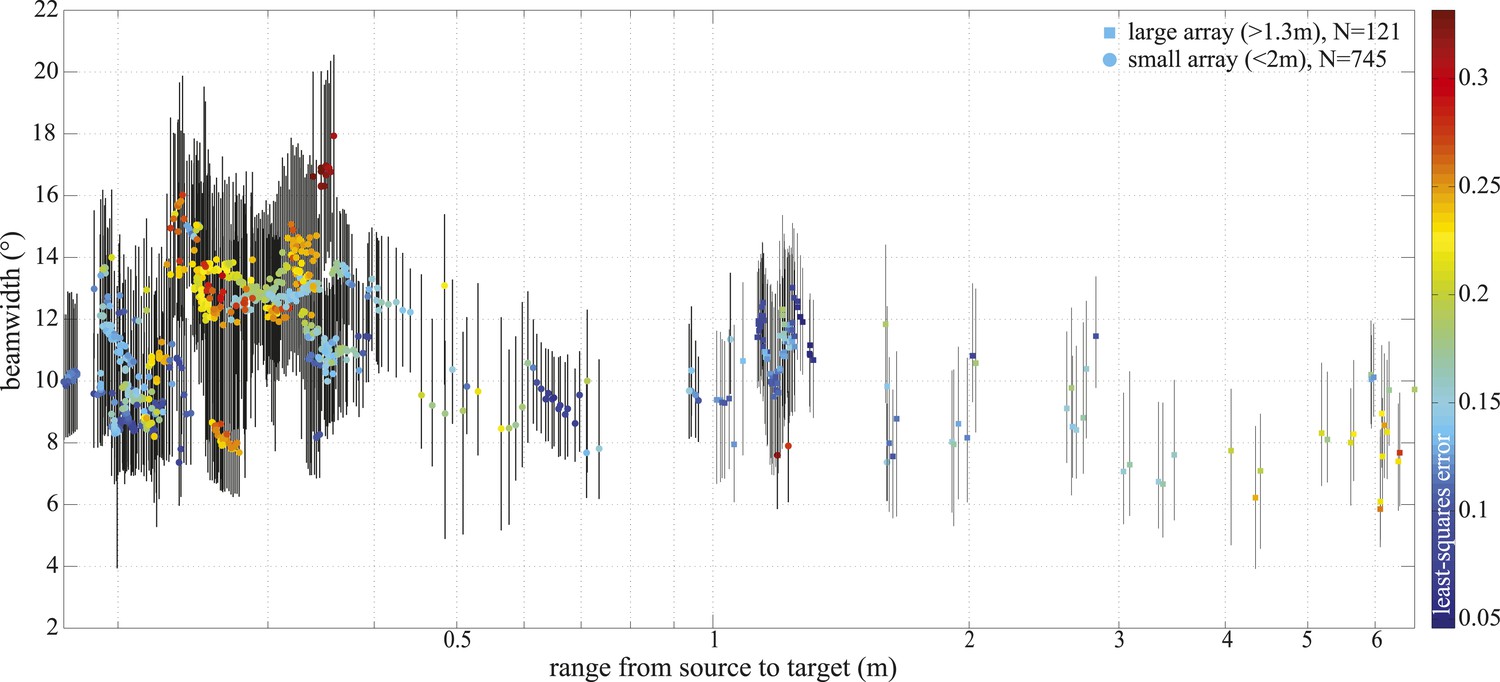
−3 dB beamwidth variation with range.
Colored markers indicate beamwidth estimates based on the best fitting piston aperture, while the black vertical lines show the spread around the best fit (see lower panels in Figure 4—figure supplement 1). Data were gathered with star-shaped arrays in two configurations (Figure 3C and Figure 4—figure supplement 1): large (squares, N = 121) and small (circles, N = 745). Color indicates the least-square error associated with the fits. Only fits with error <0.2 were considered in the final analysis and presented in Figure 3. Distance from the sound source to the tip of the animal's rostrum was 17 cm.
Figure 4—figure supplement 1
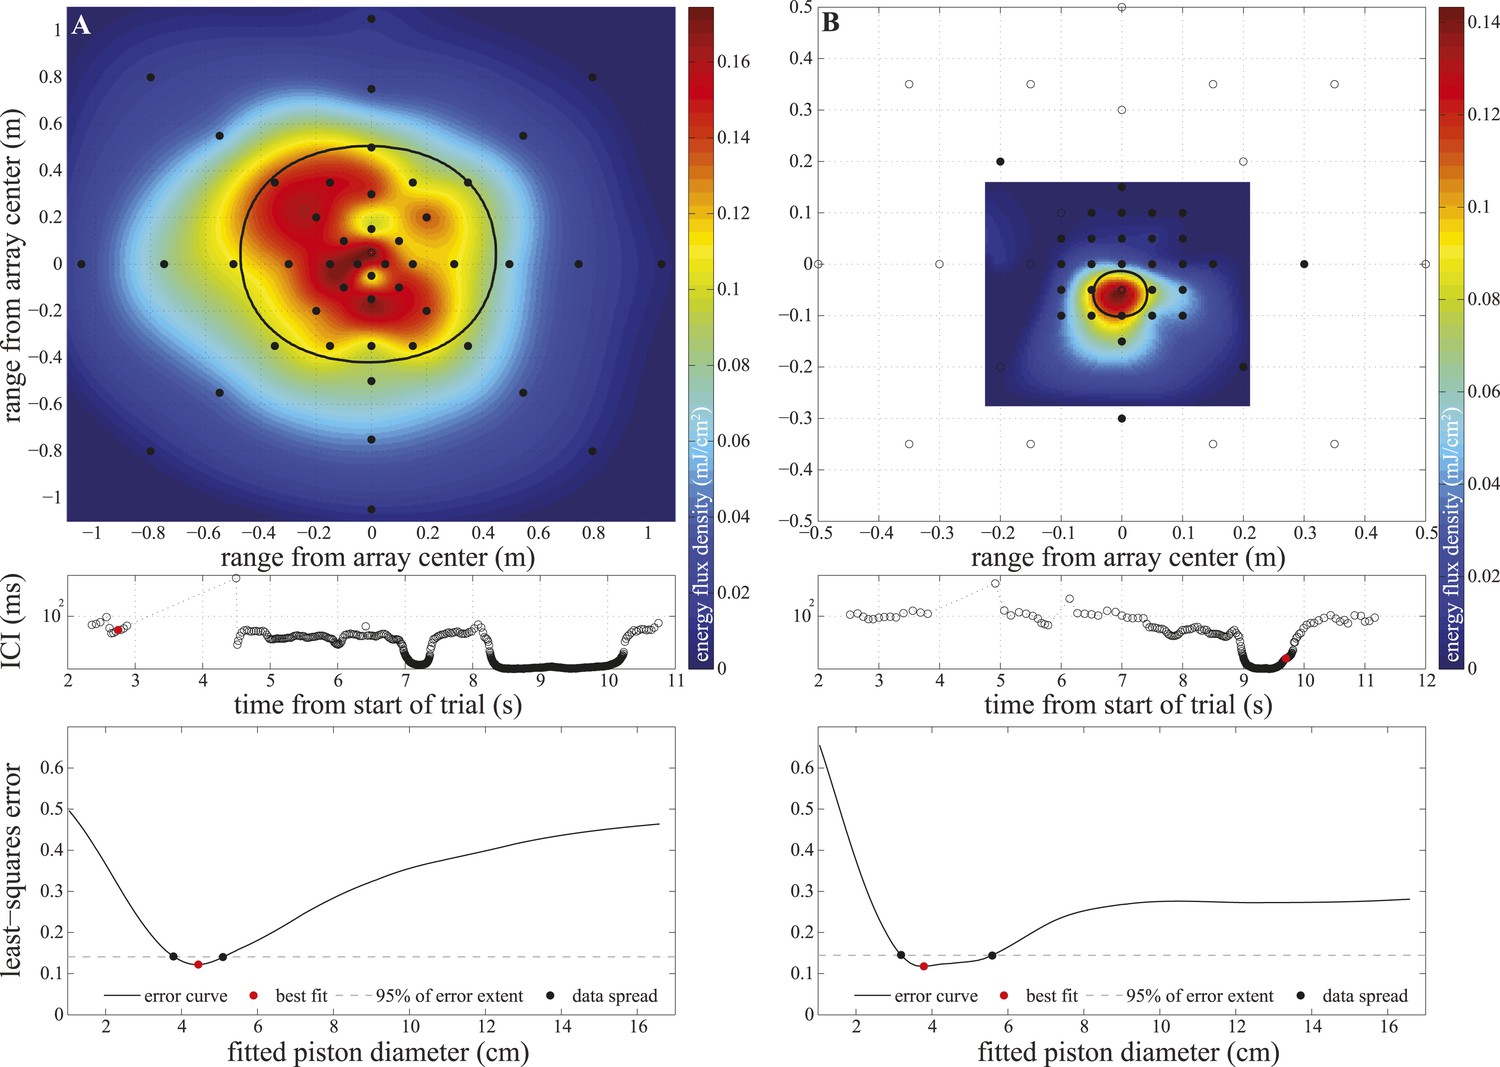
Array configurations and data fitting in experiment two.
Upper panels: hydrophone (black circles) arrangement in the large (A) and small (B) star-shaped arrays. The filled circles show hydrophones selected for analysis (having received peak levels exceeding the rms noise level of the channel by at least 14 dB). We calculated click energy on each of the selected channels and fitted a surface to the values using the Matlab ‘gridfit’ function (grid spacing 0.5 cm). The surface was fitted over an area corresponding to ±20° at the range of signal emission. The color of the fitted surface represents the received energy from blue indicating faint to red indicating intense. The location of the beam axis was determined as the peak of the fitted surface and the purple star indicates the hydrophone closest to the estimated beam axis. The thick solid line shows the extent of the 3 dB beamwidth of the best-fitting piston source centered on the estimated beam axis. Middle panels: inter-click intervals used by the porpoise during the approach. The red circles mark the clicks shown in the upper panels, which were emitted at 6 m (A) and 0.2 m (B) from the array. Lower panels: results of the piston-fitting procedure for the click shown in the upper panel. The curve shows the least-square error at different piston sizes. The best fit is marked with a red circle. The dashed line limits the lowest 5% of the extent of the error curve, which was used to estimate the data spread around the best fit (black circles) shown in Figure 4.
Figure 5
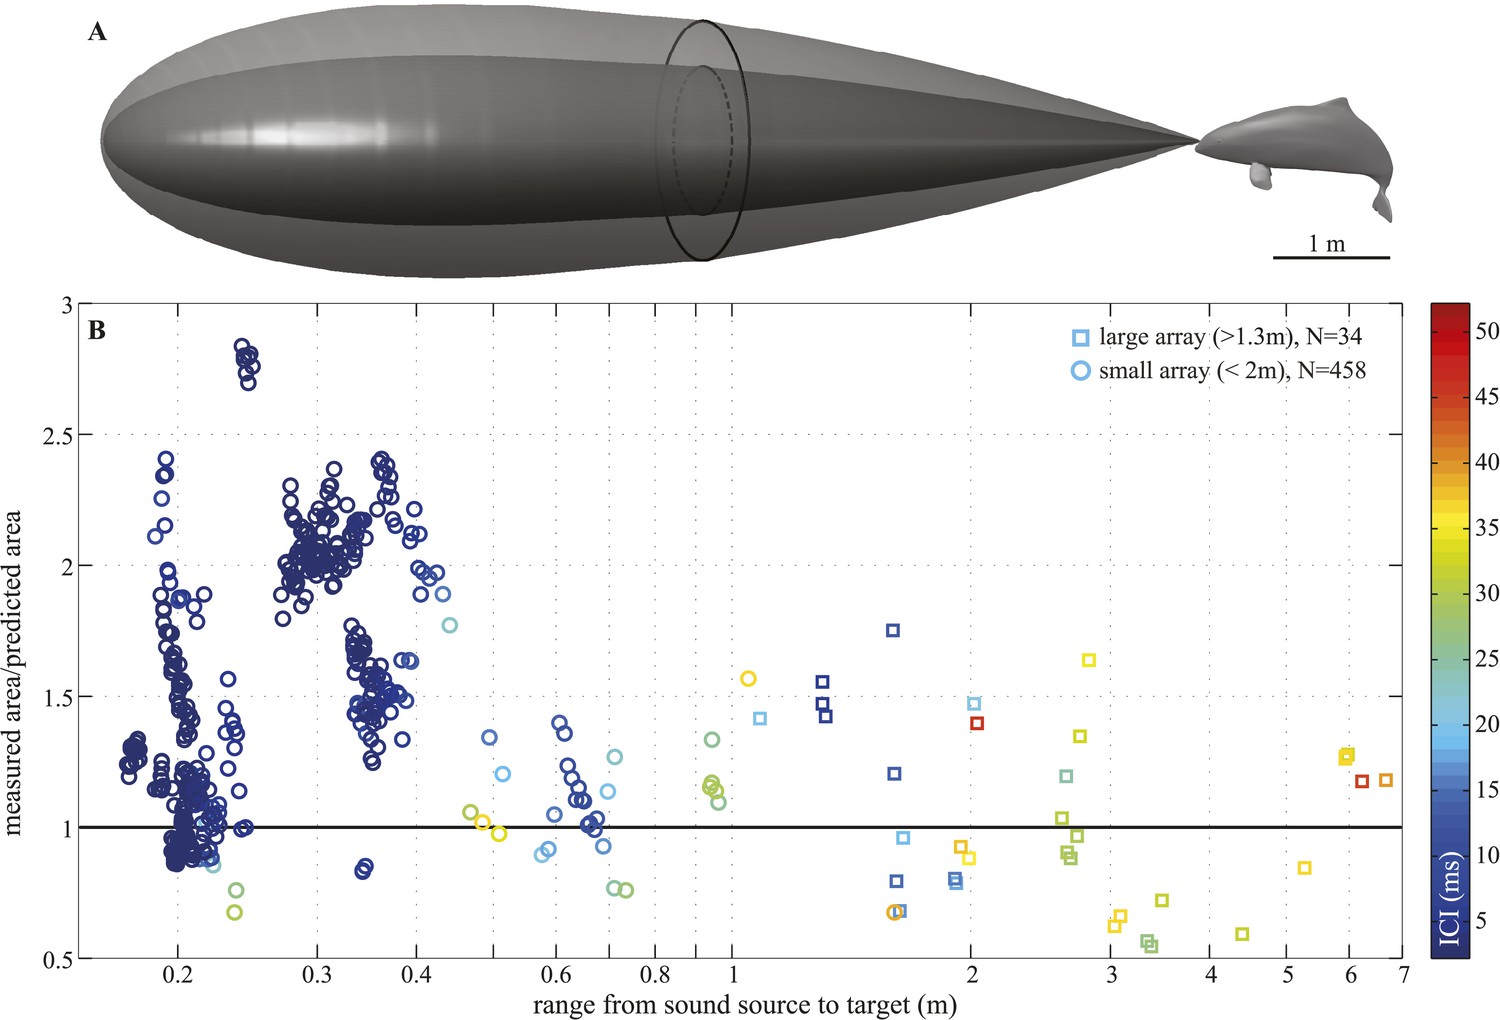
Beam adjustments can triple the ensonified area.
(A) Approximate detection volume for a harbour porpoise tracking fish in a quiet environment, based on the active sonar equation (1) and source energy levels as measured. Fixed detection threshold (Kastelein et al., 1999) of 27 dB re 1 µPa2s and target strength of −36 dB for the Atlantic cod of 29–30 cm (Au et al., 2007) is assumed. Pattern of the outer beam (solid line cross section) is based on beamwidth estimates obtained at short target ranges. The inner, narrow beam (dashed line) is based on the directionalities measured at long range, representing predicted beam pattern had the porpoise not switched to ‘wide-angle view’. (B) Relative change in the size of ensonified area ahead of the porpoise as it approaches a target. Surface area was computed as base of a cone with height equal to target range and an opening angle corresponding to the measured −3 dB beam angle (measured area, solid line in A) or median −3 dB beam angle calculated for long ranges (>2 m; predicted area, dashed line in A). Color indicates inter-click intervals. Squares and circles mark data points obtained with the large (N = 34) and small (N = 458) array, respectively. The bold horizontal line indicates points where the measured and the predicted areas are equal.
Figure 6 with 1 supplement
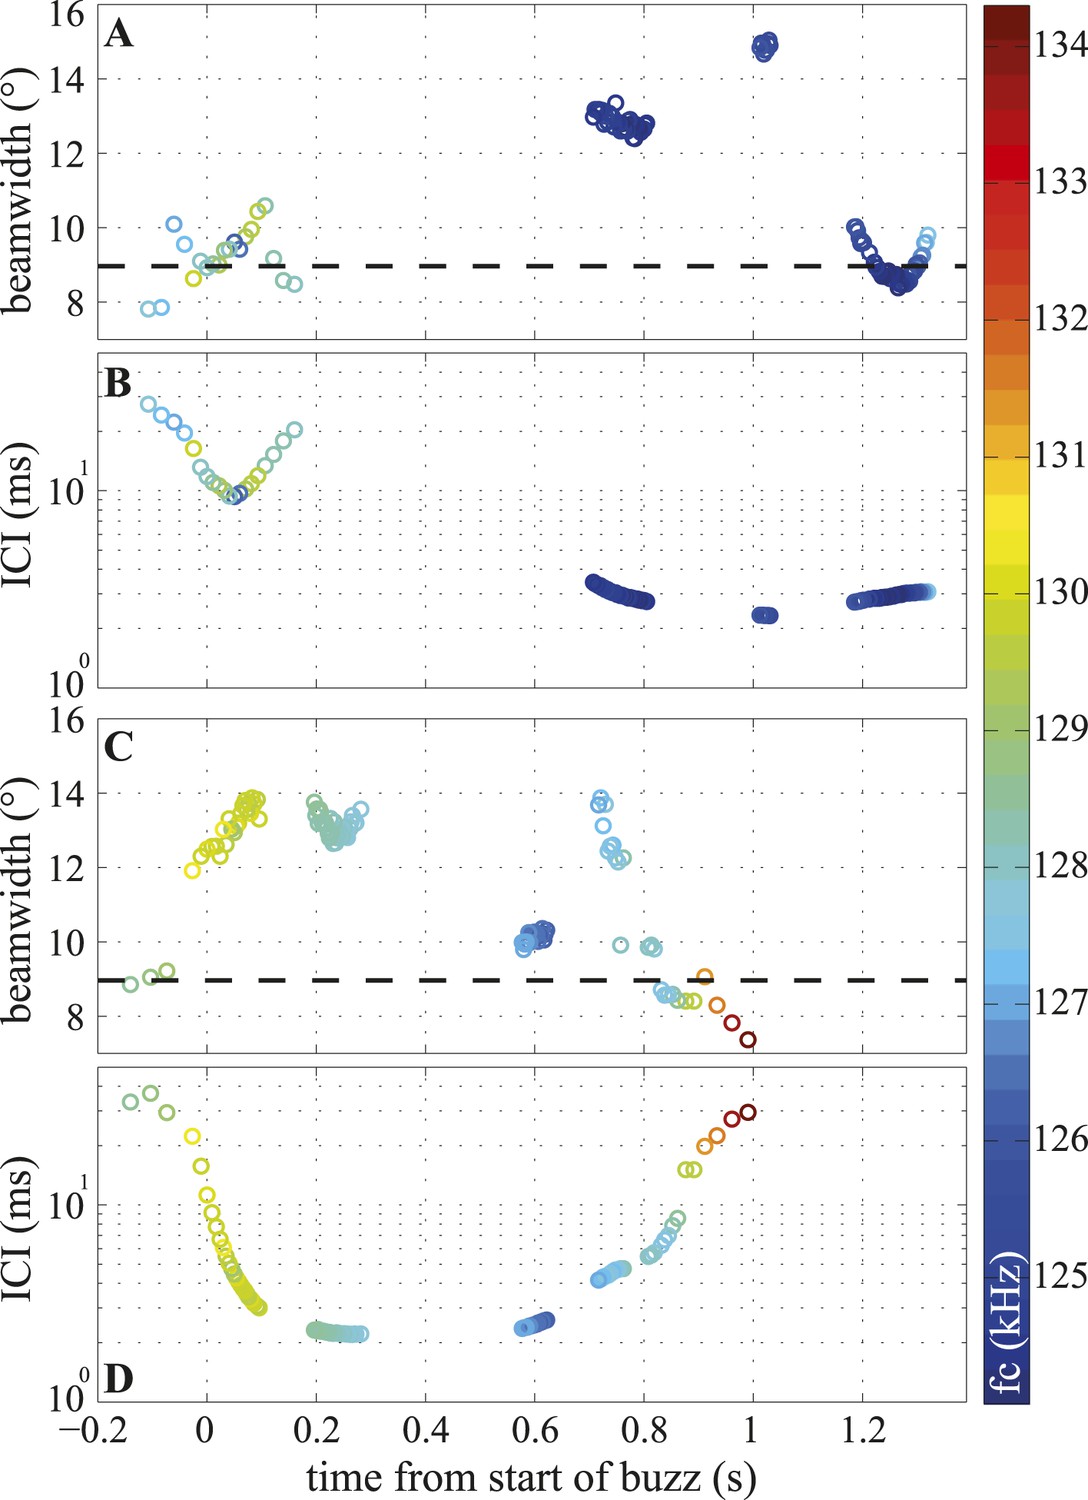
Temporal variation in beamwidth within the terminal buzz.
Beamwidth changes in terminal phases of two trials (A, C) and their respective inter-click intervals (ICI; B, D). Color-coding represents centroid frequencies (fc) of signals. Dashed line in (A, C) corresponds to median beamwidth at long ranges (>2 m). The porpoise used different beamwidths whilst maintaining ICIs and vice versa. Both trials were recorded with the small star-shaped array (light blue in Figure 3C), but during the trial shown in (C, D) the porpoise was not blindfolded. Only data for clicks fulfilling inclusion criterion are presented.
Figure 6—figure supplement 1
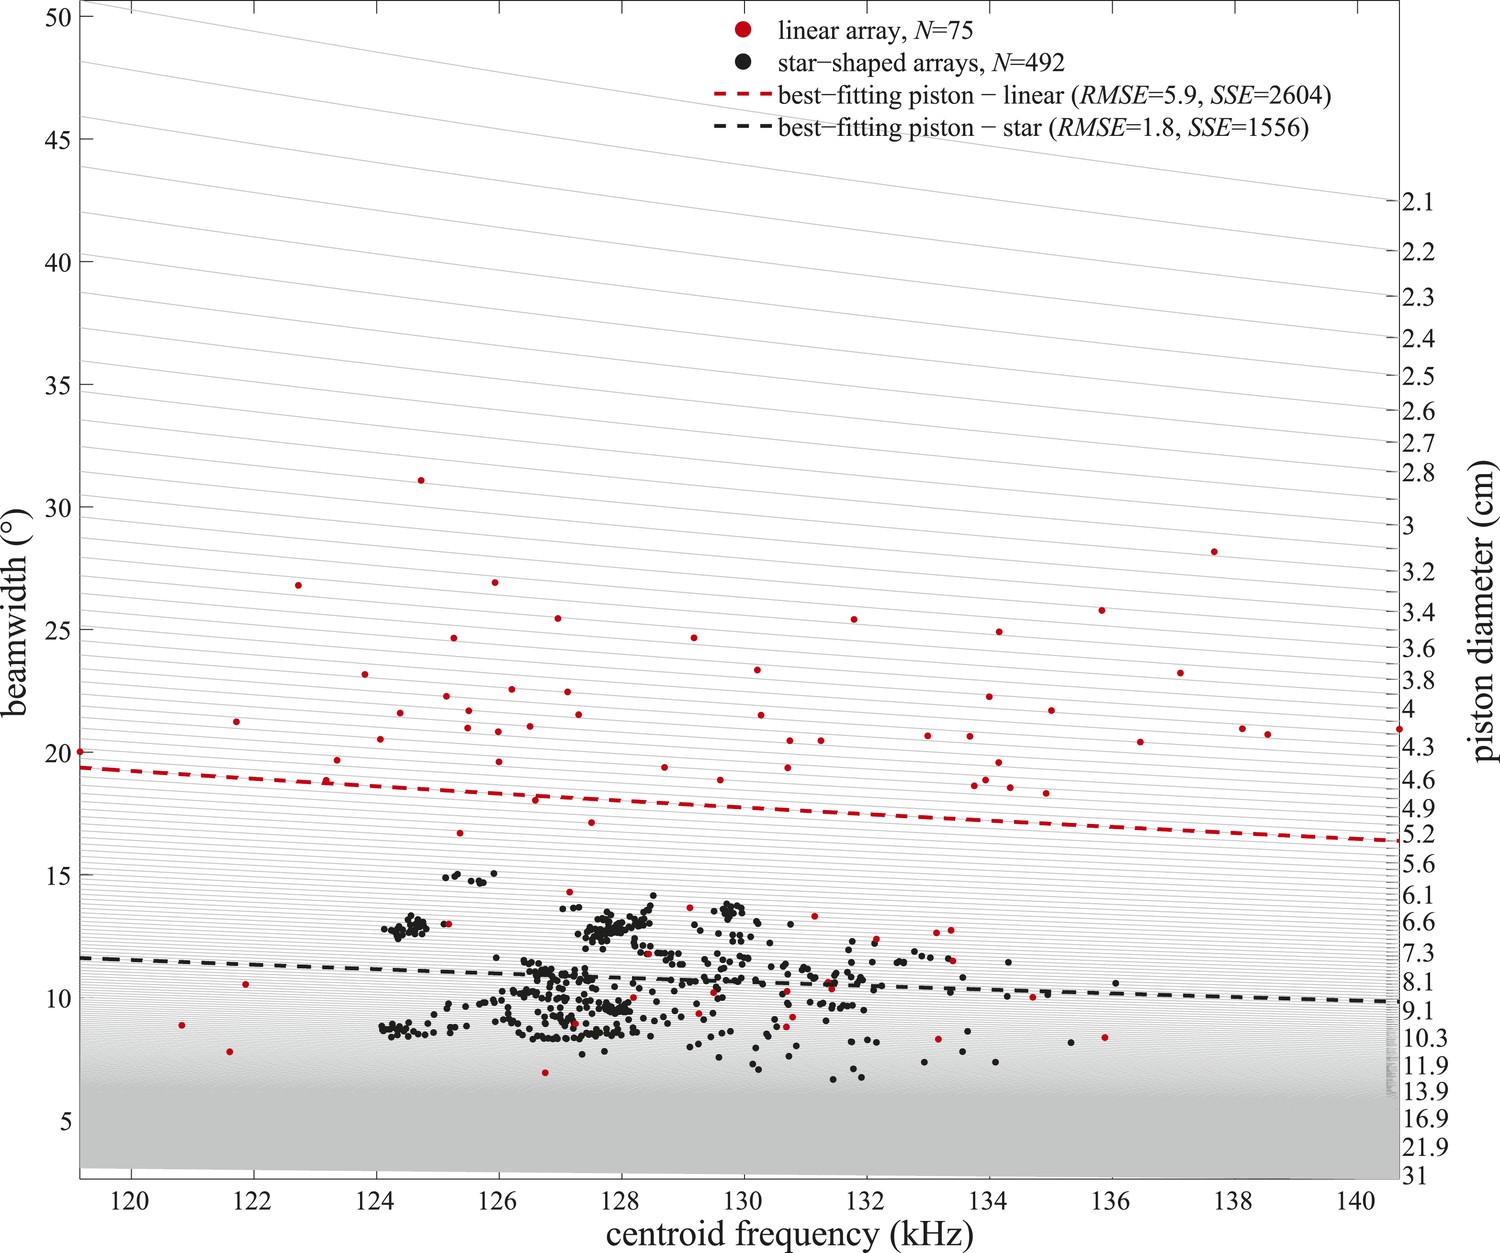
Frequency variation alone cannot explain the observed beamwidth changes.
Beamwidths of clicks recorded with the linear (red circles) and star-shaped (black circles) arrays plotted as a function of the clicks' centroid frequencies. Light gray lines represent beamwidth variation with frequency as modeled for static circular pistons of sizes considered in the piston-fitting procedures of the present study (right y-axis). Only centroid frequencies within the ranges measured in the two experiments were considered. Piston models fitting best (based on the lowest root-mean-square errors (RMSE) and sum of squared errors (SSE)) to the beamwidths and centroid frequencies measured with the linear and star-shaped arrays are marked with dashed red and black lines, respectively.
Videos
Video 1
A representative trial from experiment one.
Video shows a porpoise capturing fish in front of the linear hydrophone array. Hydrophones were lowered to a depth of 75 cm along the short side of the pool. Prior to the experiment the blindfolded (i.e., wearing opaque silicone eyecups) porpoise was stationed at the opposite end of the pool. As freshly thawed fish were introduced approx. 3 m from the array, the animal was cued to perform the capture task. The porpoise did not roll throughout the approach. Thus, the observed beam changes could not result from the beam not being rotationally symmetric and the animal rolling consistently during the buzz.
Video 2
A representative trial from experiment two.
Video shows a blindfolded porpoise closing on an aluminum target in front of a 48-element hydrophone array. The sequence was recorded in a short-range trial, that is, with the array extending to 0.5 m on either side of the centre hydrophone and the target moved to 0.4 m from array centre. Only clicks recorded when the porpoise was <2 m away from the array, at an angle of <15° to its centre and with acoustic axis within 6 cm from the centre hydrophone were selected for the beamwidth analysis. The video's soundtrack was replaced with audio recording from the camera-synchronized DTAG-3 carried by the porpoise.
Video 3
Harbour porpoises can manipulate their melon while producing clicks.
Video shows a harbour porpoise emitting echolocation click trains during a hearing test. It has been slowed down by a factor of two and synchronized with the output of a porpoise click detector. The porpoise depresses the melon as it switches to high repetition rate click trains. Conformation changes in the nasal complex can modulate the degree of sound collimation in the whale's forehead ([Harper et al., 2008; Moore et al., 2008; Huggenberger et al., 2009]) to change the field of view. Courtesy of Lee Miller.
Additional files
-
Source code 1
LabVIEW (2012 version) source code files for the National Instruments PXIE-6358 system, sampling 48 AD channels at 500 kHz/channel. An independent multifunction USB device (National Instruments USB-6251) delivered a trigger pulse for the PXIE system alongside a high-frequency pulse (a frequency-modulated sweep) that was transmitted into the water to synchronize the hydrophone and DTAG-3 recordings. The main VI is ‘use_this_sampler_for_now03.vi’. Supporting VIs should be kept in the same folder. This software was built for a specific PXIE system, and modifications will be necessary for it to run other systems. Any questions regarding this should be addressed to kristian.beedholm@bios.au.dk.
- https://doi.org/10.7554/eLife.05651.014
Download links
A two-part list of links to download the article, or parts of the article, in various formats.
Downloads (link to download the article as PDF)
Open citations (links to open the citations from this article in various online reference manager services)
Cite this article (links to download the citations from this article in formats compatible with various reference manager tools)
Range-dependent flexibility in the acoustic field of view of echolocating porpoises (Phocoena phocoena)
eLife 4:e05651.
https://doi.org/10.7554/eLife.05651


