Methylation at the C-2 position of hopanoids increases rigidity in native bacterial membranes
- Howard Hughes Medical Institute, California Institute of Technology, United States
- California Institute of Technology, United States
Figures
Figure 1
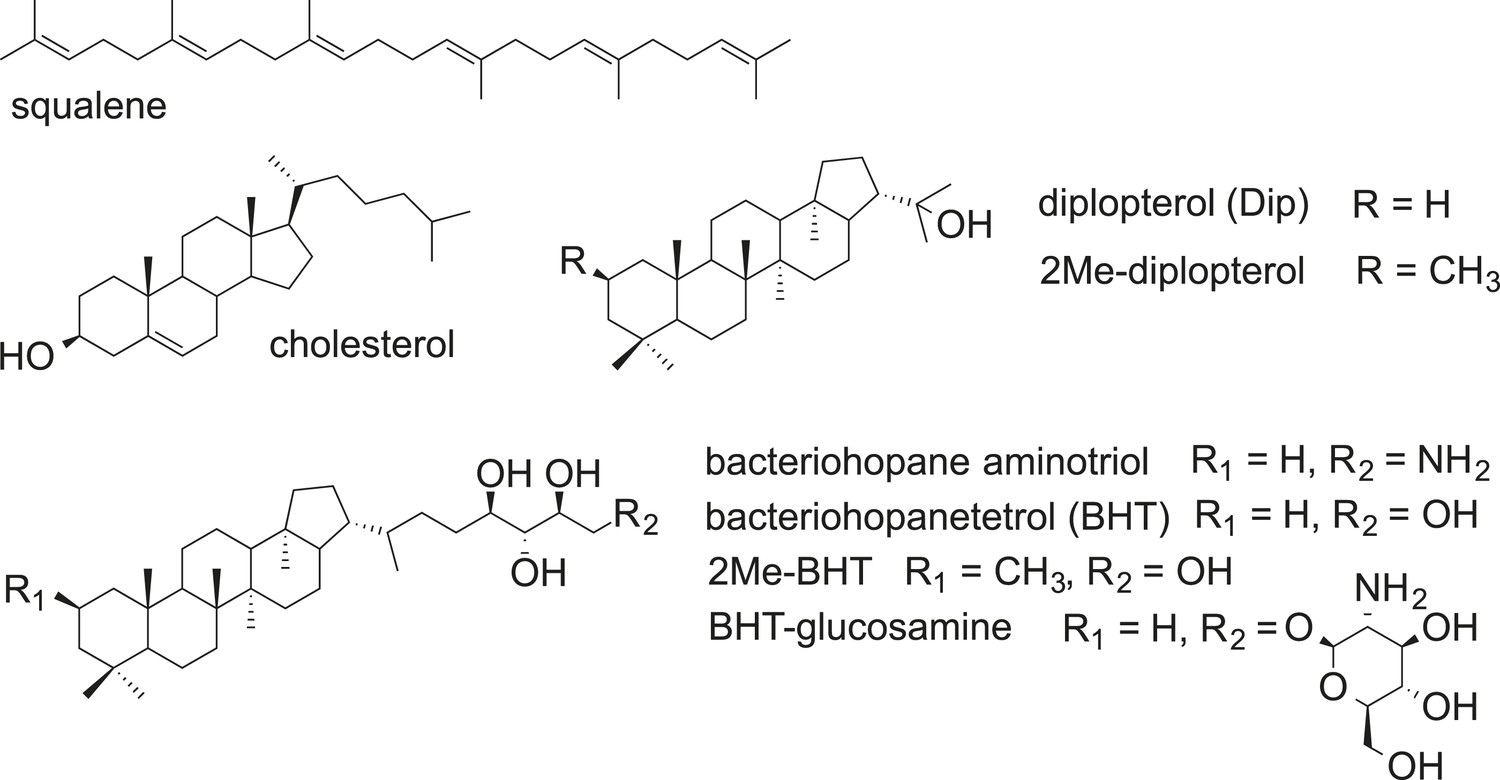
Structures of selected hopanoids, cholesterol, and squalene.
https://doi.org/10.7554/eLife.05663.003
Figure 2

Whole cell membrane fluidity.
Error bars represent the standard deviation from three biological replicates (total 21–26 technical replicates).
Figure 3
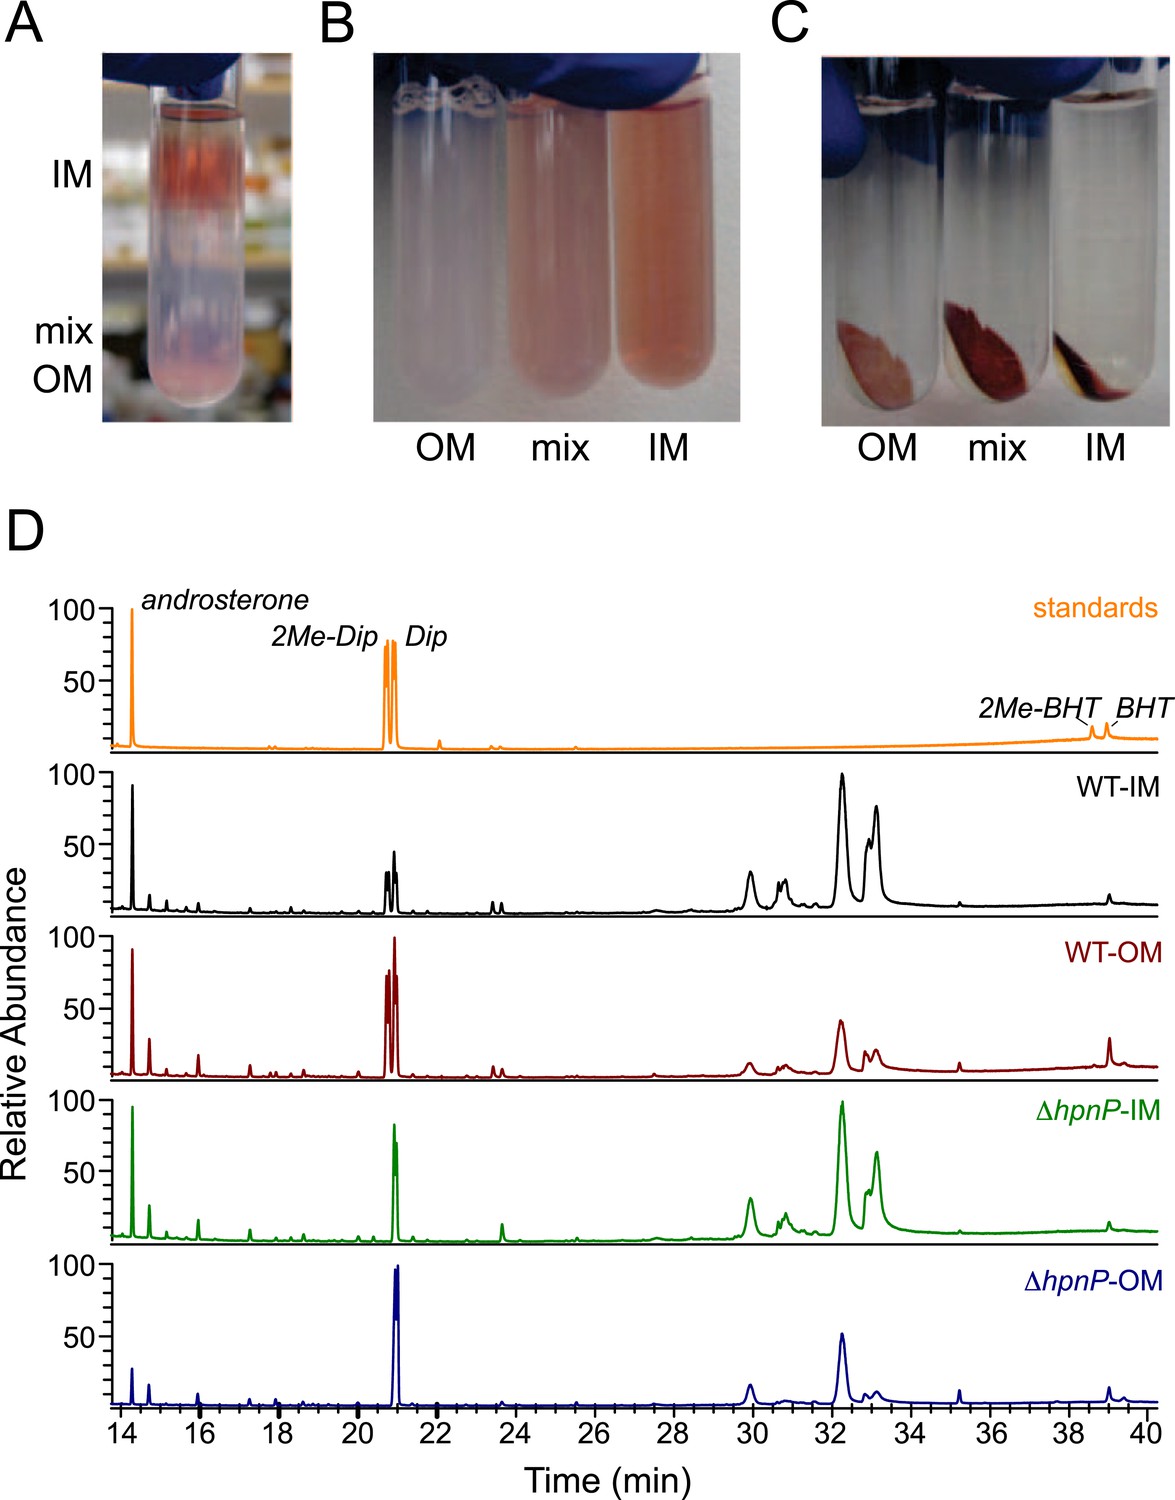
Membrane fractionation and hopanoids analysis using GC–MS.
(A) Three distinct bands were formed after ultracentrifugation in a Percoll gradient. (B) The bands were recovered and resuspended. (C) Samples were ultracentrifuged to pellet down the purified membranes, which sat on top of a transparent solid Percoll layer. (D) GC–MS of fractionated membranes of R. palustris TIE-1 WT and ΔhpnP.
Figure 4
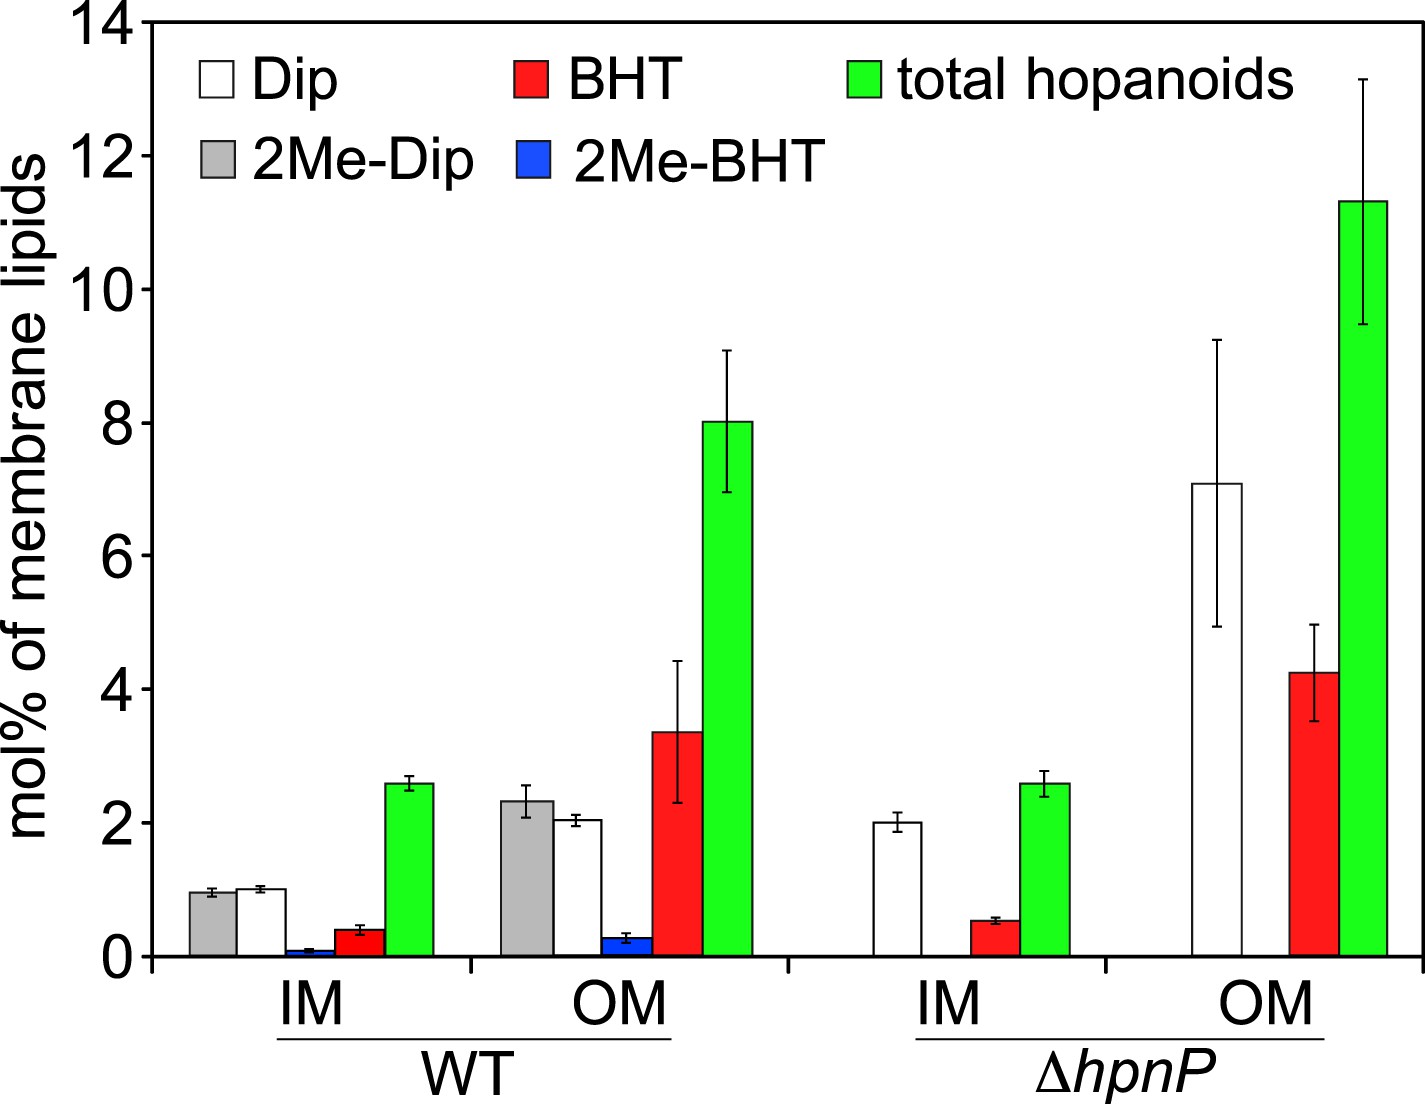
Molar percentage of hopanoids in the inner membrane (IM) and outer membrane (OM) of WT and ΔhpnP determined by GC–MS.
Error bars represent the standard deviation from three biological replicates. Total hopanoids = sum of (2Me)-Dip and (2Me)-BHT.
Figure 5
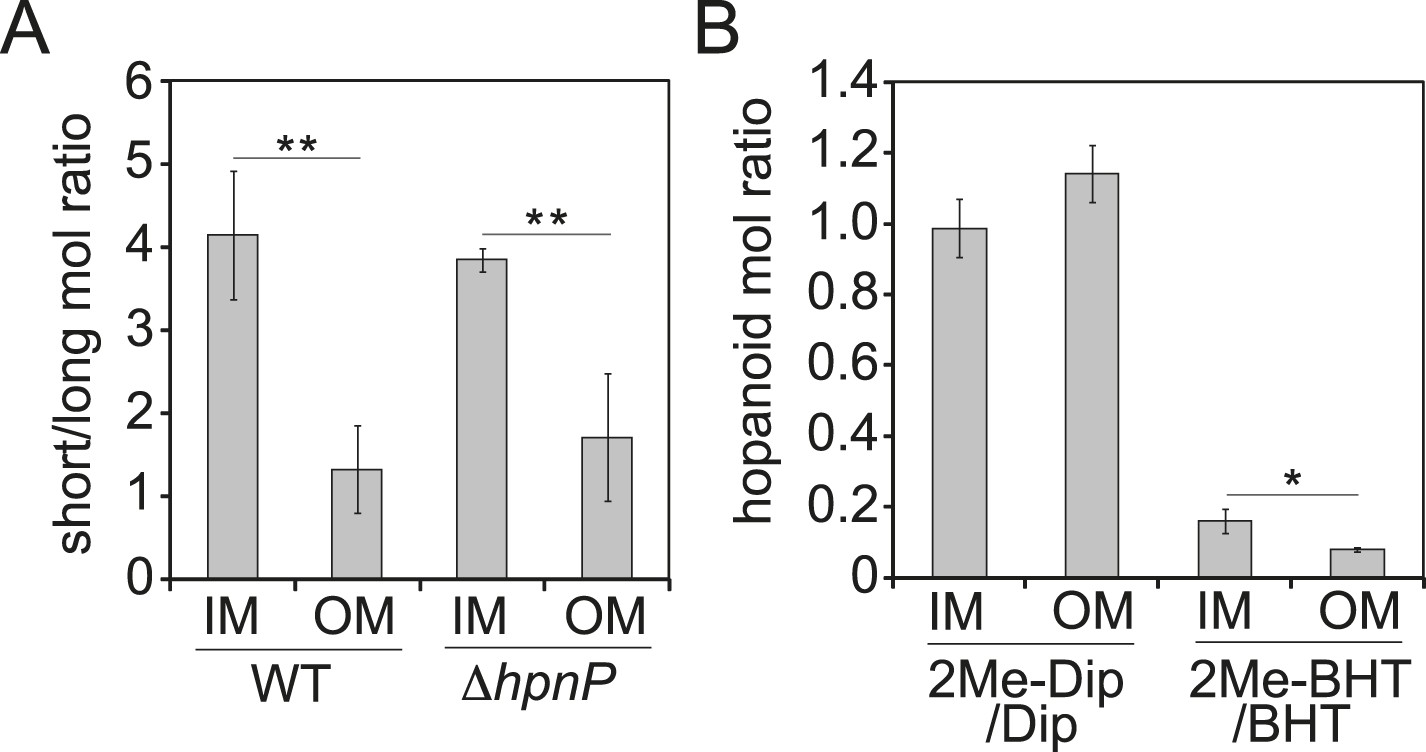
Partitioning of hopanoids in the inner membrane (IM) and outer mebraane (OM) of R. palustris TIE-1.
(A) Molar ratio between short (Dip and 2Me-Dip) and long (BHT and 2Me-BHT) hopanoids in WT and ΔhpnP. (B) Molar ratio between methylated and desmethylated hopanoid in WT. Error bars represent the standard deviation from three biological replicates. *p = 0.015; **p < 0.01.
Figure 6 with 1 supplement

Membrane rigidity measurements at 25°C using model lipids.
(A) Dioleoyl phosphatidylcholine (DOPC) and (B) E. coli polar lipid extract (PLE) were mixed with different mol% of cholesterol, squalene, and hopanoids. Error bars represent the standard deviation from three biological replicates (total 21 technical replicates).
Figure 6—figure supplement 1
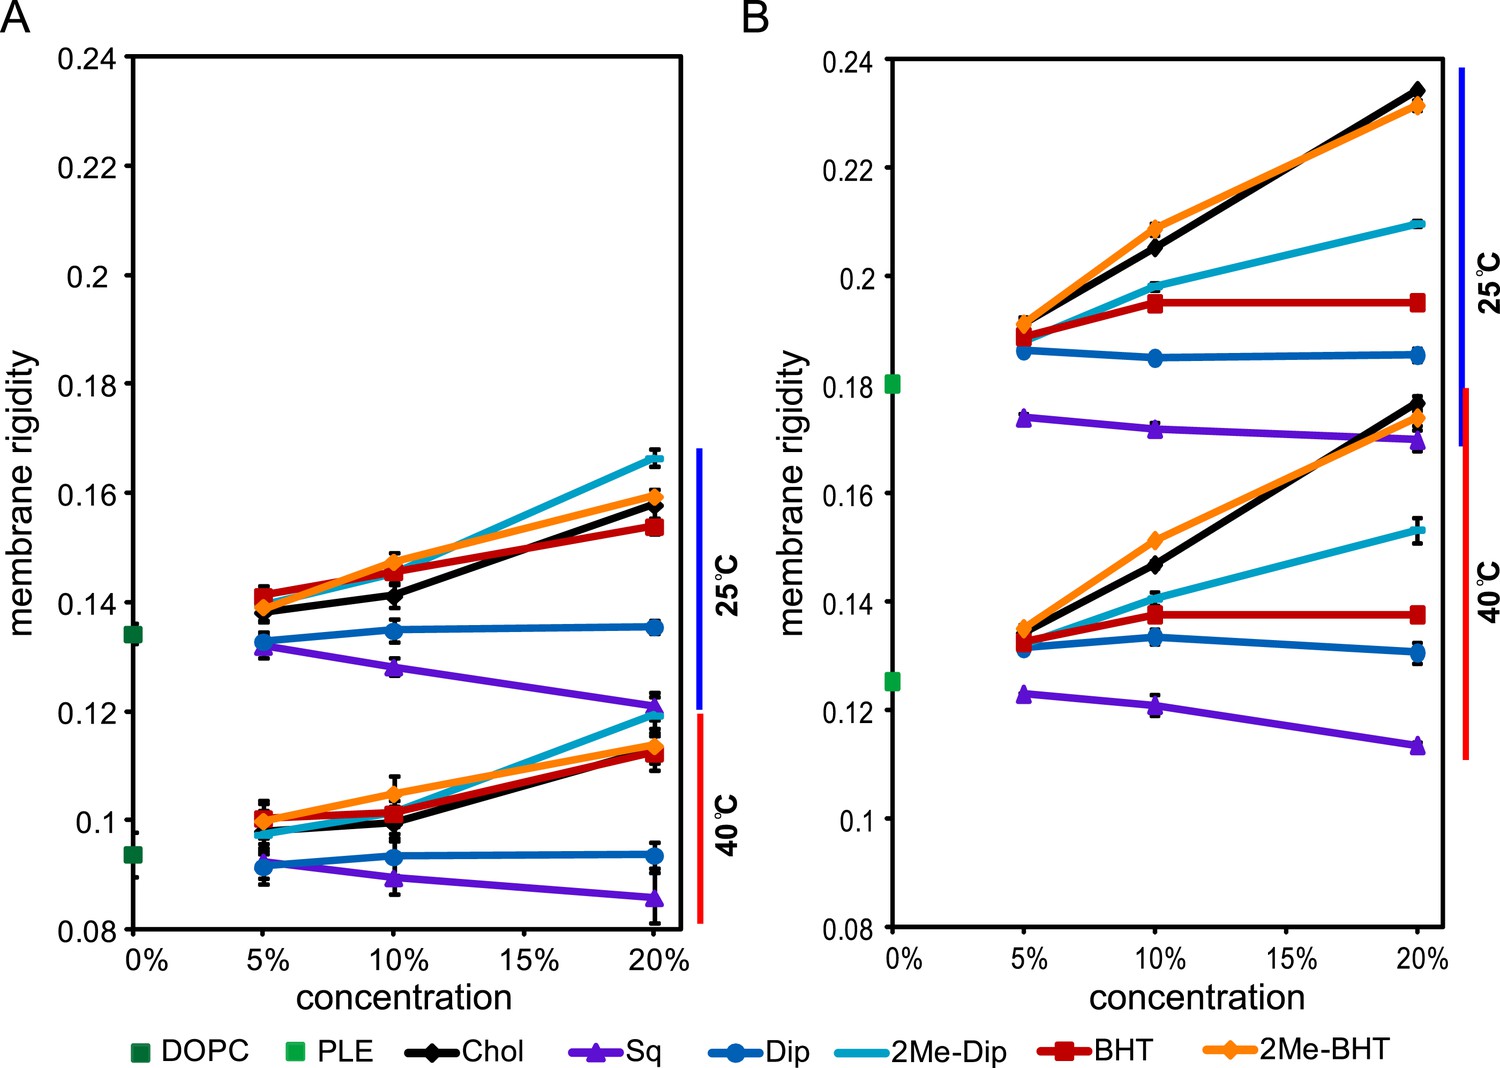
Membrane rigidity measurements at 25°C and 40°C using model lipids.
(A) DOPC and (B) E. coli polar lipid extract (PLE) were mixed with different mol% of cholesterol, squalene, and hopanoids. Error bars represent standard deviation from three biological replicates (total 21 technical replicates).
Figure 7
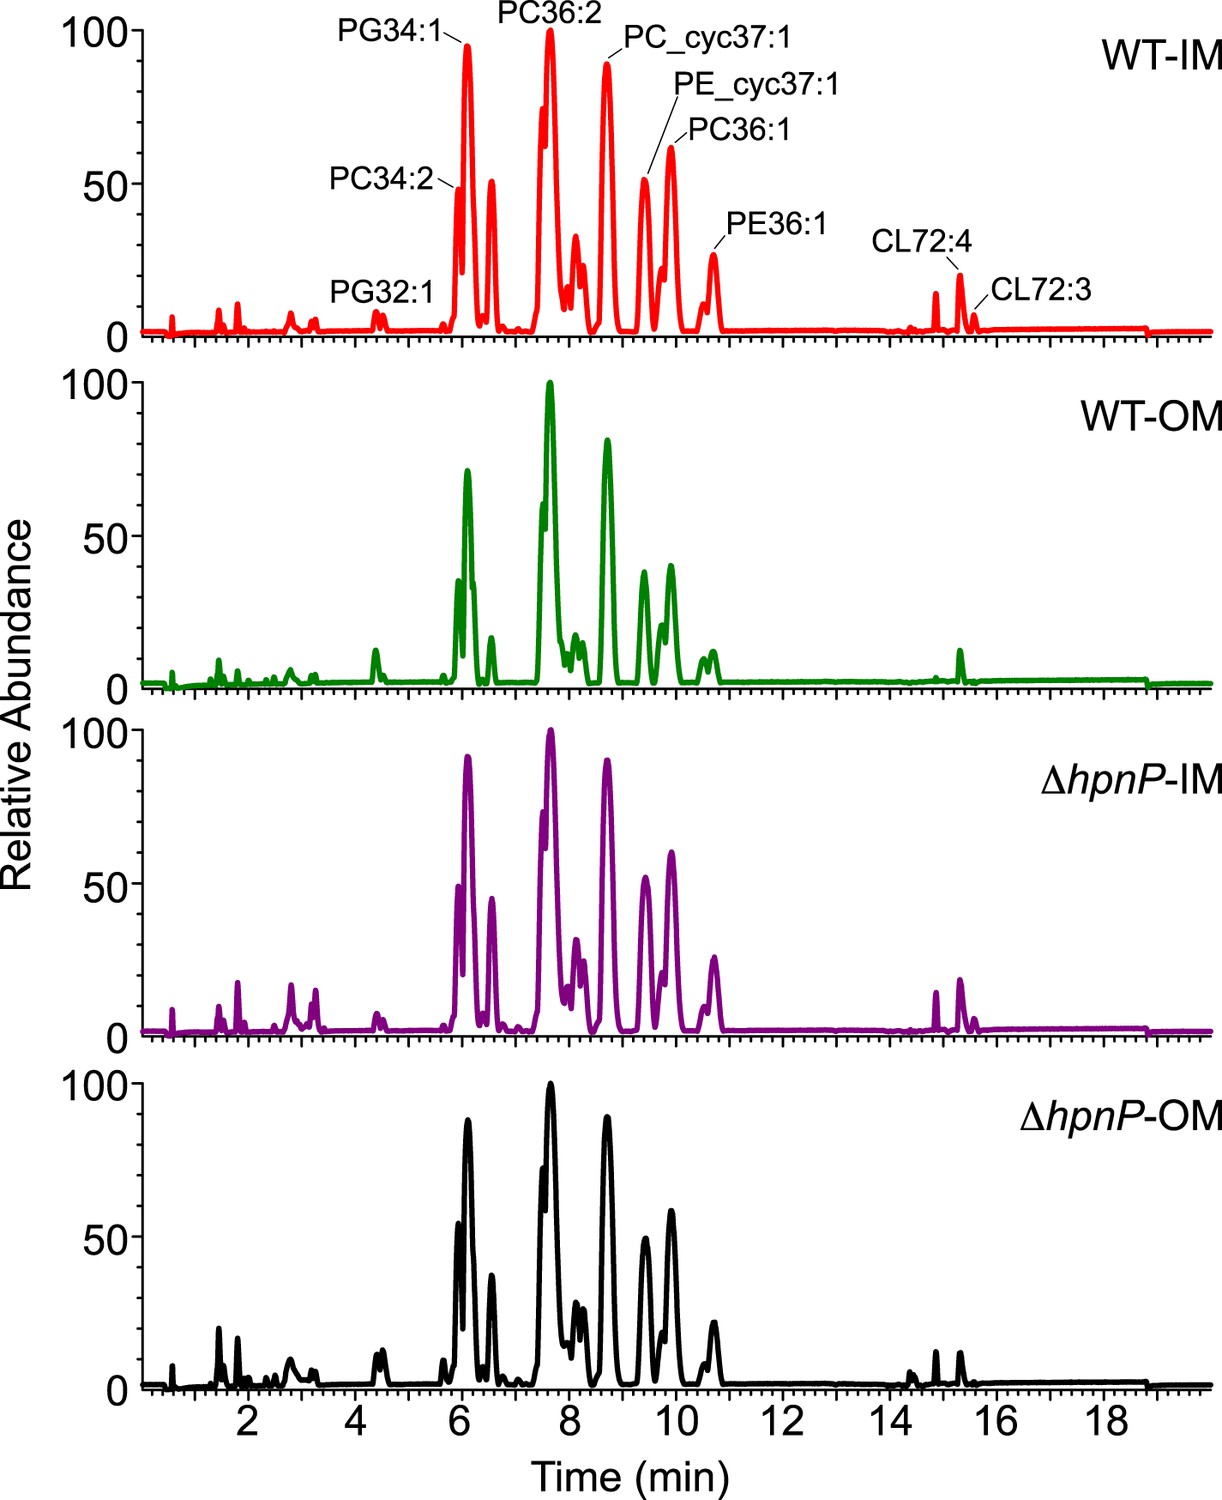
LC-MS profiles of the inner membrane (IM) and outer membrane (OM) of R. palustris TIE-1 WT and ΔhpnP.
https://doi.org/10.7554/eLife.05663.012
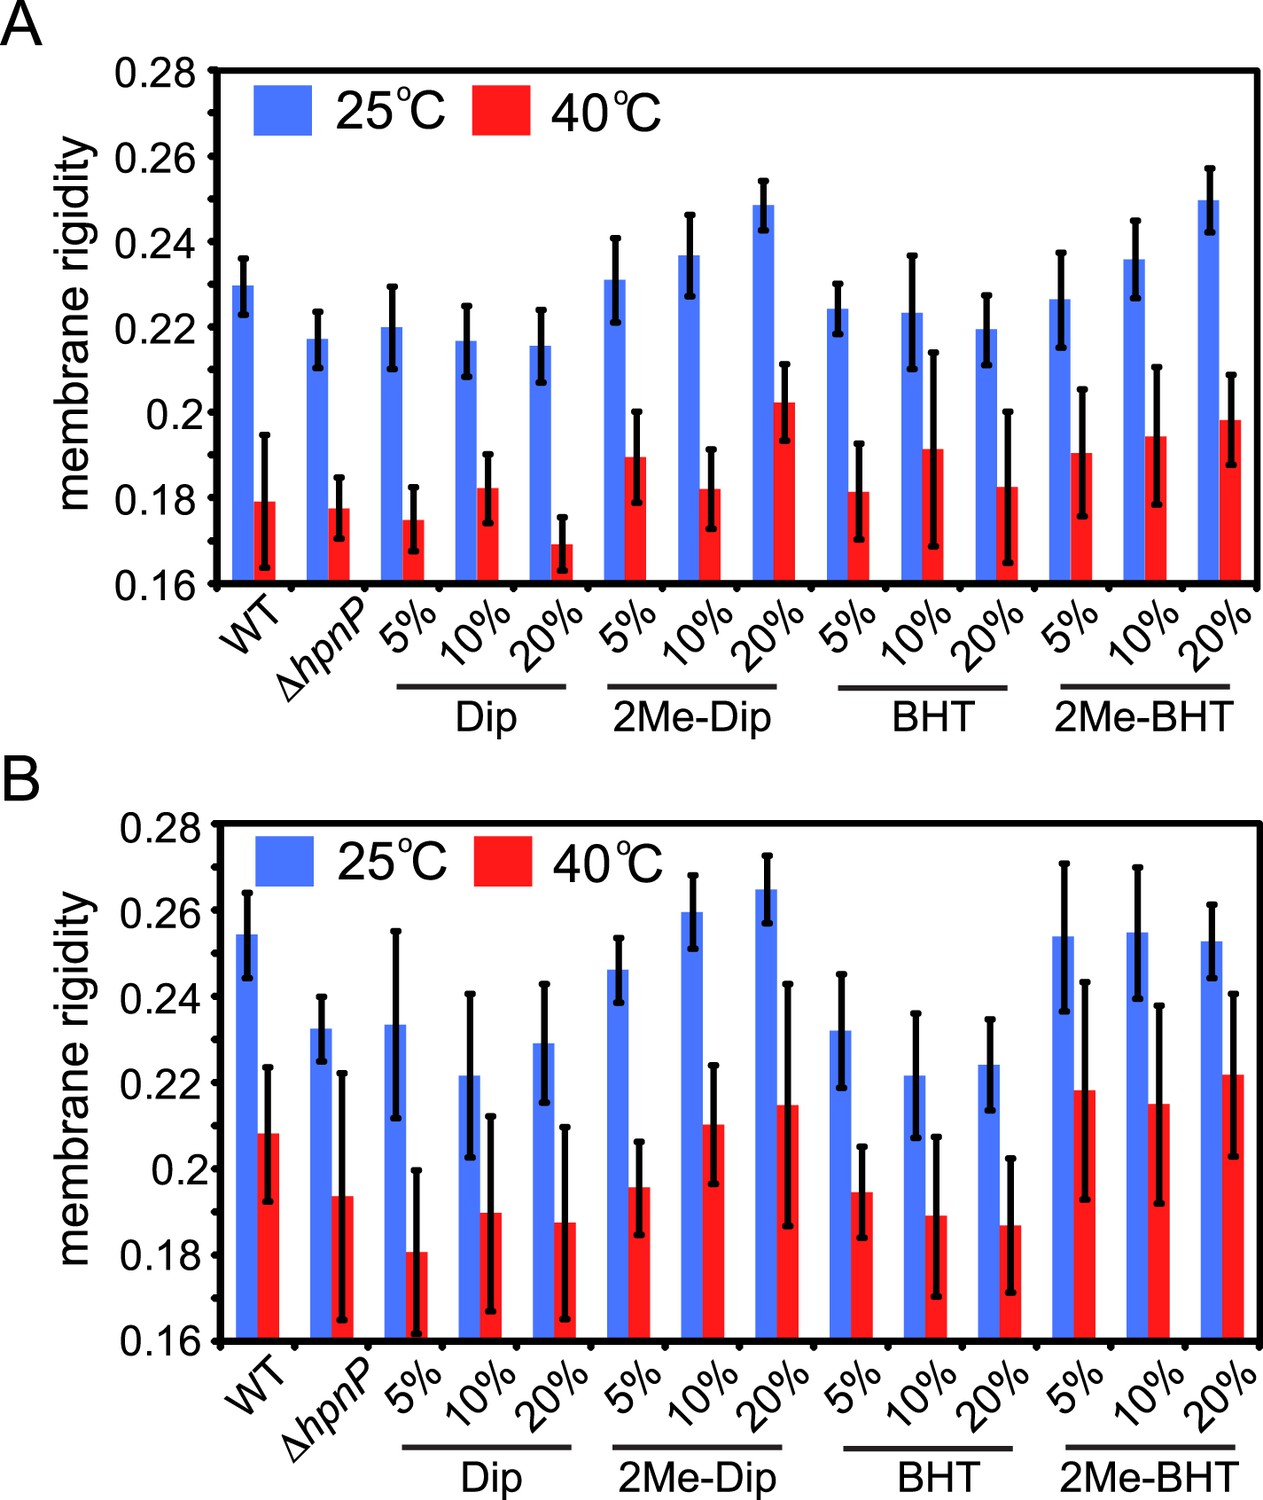
Figure 8 with 1 supplement

Membrane rigidity measurements at 25°C using total lipid extract from R. palustris TIE-1 inner membrane (IM) and outer membrane (OM).
The IM (A) or OM (B) from ΔhpnP was mixed with different mol% of hopanoids. Error bars represent the standard deviation from three biological replicates (total 21 technical replicates). *p < 0.001 (relative to ΔhpnP).
Figure 8—figure supplement 1
Membrane rigidity measurements at 40°C using total lipid extract from R. palustris TIE-1 inner membrane (IM) and outer membrane (OM).
The IM (A) or OM (B) from ΔhpnP was mixed with different mol% of hopanoids. Small unilamellar vesicles from the lipid mixtures were prepared, and the membrane rigidity was measured by fluorescence polarization of a reporter dye diphenyl hexatriene. Error bars represent standard deviation from three biological replicates (total 21 technical replicates).
Tables
Table 1
Mutant strains used for the whole cell membrane rigidity measurements
| Gene | Function | Deletion effect |
|---|---|---|
| shc (hpnF) | Cyclization of squalene to form C30 hopanoids (diploptene and diplopterol) | No hopanoid production and accumulation of squalene |
| hpnH | Addition of adenosine to diploptene to generate adenosylhopane, a precursor for extended hopanoid production | No extended hopanoid production, accumulation of C30 hopanoids |
| hpnG | Removal of adenine from adenosyl hopane | No BHT and aminoBHT production, accumulation of adenosylhopane |
| hpnN | An IM transporter that transports hopanoids to the outer membrane | Absence of hopanoids in the OM and accumulation of hopanoids in the IM |
| hpnO | Production of aminoBHT | No aminoBHT production |
| hpnP | Methyl transfer to A ring at C-2 | No hopanoid methylation |
-
The function of the gene and the effect of its deletion are listed.
Table 2
Purification yields of membrane fractionation using Percoll gradient
| Weight % membranes in dry cells | Total | Weight % TLE in membranes | ||
|---|---|---|---|---|
| WT | inner | 4.7 ± 0.5 | 12.4 ± 0.8 | |
| mix | 3.7 ± 1.2 | 5.6 ± 0.1 | ||
| outer | 3.3 ± 0.4 | 11.6 ± 1.4 | 4.9 ± 0.6 | |
| ΔhpnP | inner | 4.2 ± 1.3 | 15 ± 2.3 | |
| mix | 2.3 ± 0.8 | 8.3 ± 2.3 | ||
| outer | 2.9 ± 0.6 | 9.4 ± 2.2 | 5.3 ± 1.4 | |
-
The yields in wt% of membrane fractionation. Errors represent standard deviation from three biological replicates.
Table 3
Annotation of phospholipids identified by LC-MS analyses (see Figure 7)
| Compound | RT (min) | [M+H]+ | [M−C3H7O2HPO4]+ | [M+NH4]+ |
|---|---|---|---|---|
| PG32:1 | 4.39 | 549.4895 | ||
| PG34:2 | 4.89 | 575.505 | ||
| PC34:2 | 5.94 | 758.5694 | ||
| PG34:1 | 6.11 | 577.5208 | ||
| PG36:2 | 6.2 | 603.5364 | ||
| PE34:2 | 6.38 | 716.5225 | ||
| PC_cyc35:1 | 6.76 | 772.5851 | ||
| PG_cyc35 | 6.95 | 591.5364 | ||
| PG_cyc37:1 | 7.05 | 617.5521 | ||
| PC(35:2) | 7.06 | 772.5851 | ||
| PE_cyc35:1 | 7.28 | 730.5381 | ||
| PC34:1 | 7.51 | 760.5851 | ||
| PC36:2 | 7.65 | 786.6007 | ||
| PG(17:0/17:0) | 7.86 | 579.5364 | ||
| PG36:1 | 7.99 | 605.5521 | ||
| PE34:1 | 8.14 | 718.5381 | ||
| PE36:2 | 8.27 | 744.5538 | ||
| PC_cyc35 | 8.58 | 774.6007 | ||
| PC_cyc37:1 | 8.72 | 800.6164 | ||
| PE_cyc35 | 9.28 | 732.5538 | ||
| PE_cyc37:1 | 9.42 | 758.5694 | ||
| PC(17:0/17:0) | 9.75 | 762.6007 | ||
| PC36:1 | 9.91 | 788.6164 | ||
| PE(17:0/17:0) | 10.53 | 720.5538 | ||
| PE36:1 | 10.71 | 746.5694 | ||
| PC_cyc37 | 11.23 | 802.632 | ||
| PE_cyc37 | 12.1 | 760.5851 | ||
| PC36:0 | 12.79 | 790.634 | ||
| PE36 | 12.98 | 748.5851 | ||
| PC36:4 | 13.39 | 782.569 | ||
| CL70:4 | 15.09 | 1447.0373 | ||
| CL68:3 | 15.1 | 1421.0217 | ||
| CL72:4 | 15.31 | 1475.0686 | ||
| CL70:3 | 15.34 | 1449.053 | ||
| CL68:2 | 15.35 | 1423.0373 | ||
| CL72:3 | 15.58 | 1477.0843 | ||
| CL70:2 | 15.6 | 1451.0686 |
-
The types of lipids (PC: phosphatidylcholine, PE: phosphotidylethanolamine, PG: phosphatidylglycerol, CL: cardiolipin, cyc: cyclopropanation; the first number indicates the total number of carbon of the fatty acid chains and the second number indicates the number of double bonds in these chains) and their retention time (RT, min) and m/z value of the base peak are shown. For PC and PE, the base peak is the proton adduct and for CL, the base peak is the ammonium adduct. For PG, the base peak indicates a loss of glycerophosphate (−171 m/z).
Table 4
Phospholipid compositions in the inner membrane (IM) and outer membrane (OM) of R. palustris TIE-1 WT and ΔhpnP analyzed by LC-MS
| Weight % of TLE | |||||
|---|---|---|---|---|---|
| Compound | RT (min) | WT IM | WT OM | ΔhpnP IM | ΔhpnP OM |
| PC36:2 | 7.65 | 5.15 ± 0.47 | 5.34 ± 0.26 | 5.44 ± 0.57 | 5.94 ± 0.48 |
| PC_cyc37:1 | 8.72 | 4.33 ± 0.45 | 4.01 ± 0.48 | 4.07 ± 1.13 | 3.96 ± 1.24 |
| PC36:1 | 9.91 | 2.90 ± 0.3 | 1.84 ± 0.52 | 2.59 ± 0.93 | 2.15 ± 1.08 |
| PC34:1 | 7.51 | 2.66 ± 0.22 | 2.23 ± 0.33 | 2.53 ± 0.58 | 2.38 ± 0.57 |
| PC34:2 | 5.94 | 1.56 ± 0.12 | 1.24 ± 0.44 | 1.41 ± 0.51 | 1.44 ± 0.48 |
| PC_cyc35 | 8.58 | 0.23 ± 0.01 | 0.14 ± 0.05 | 0.20 ± 0.07 | 0.17 ± 0.1 |
| PC_cyc35:1 | 6.76 | 0.12 ± 0.01 | 0.07 ± 0.02 | 0.11 ± 0.04 | 0.09 ± 0.06 |
| PC(35:2) | 7.06 | 0.09 ± 0.01 | 0.05 ± 0.03 | 0.08 ± 0.03 | 0.06 ± 0.05 |
| PC_cyc37 | 11.23 | 0.07 ± 0.01 | 0.04 ± 0.01 | 0.06 ± 0.02 | 0.05 ± 0.03 |
| PC36:0 | 12.79 | 0.02 ± 0 | 0.01 ± 0 | 0.02 ± 0.01 | 0.01 ± 0.01 |
| Sum | 17.12 | 14.96 | 16.50 | 16.25 | |
| PE_cyc37:1 | 9.42 | 4.92 ± 0.36 | 3.36 ± 0.94 | 4.68 ± 1.5 | 4.18 ± 1.64 |
| PE34:1 | 8.14 | 2.49 ± 0.19 | 1.44 ± 0.49 | 2.28 ± 0.84 | 1.82 ± 0.92 |
| PE36:1 | 10.71 | 2.29 ± 0.28 | 1.08 ± 0.38 | 2.05 ± 0.85 | 1.43 ± 0.95 |
| PE36:2 | 8.27 | 1.88 ± 0.21 | 1.22 ± 0.46 | 1.74 ± 0.65 | 1.59 ± 0.72 |
| PE34:2 | 6.38 | 0.43 ± 0.02 | 0.23 ± 0.08 | 0.42 ± 0.16 | 0.33 ± 0.21 |
| PE_cyc35 | 9.28 | 0.20 ± 0.02 | 0.11 ± 0.04 | 0.19 ± 0.07 | 0.15 ± 0.09 |
| PE_cyc35:1 | 7.28 | 0.12 ± 0.01 | 0.06 ± 0.02 | 0.11 ± 0.05 | 0.09 ± 0.06 |
| PE_cyc37 | 12.1 | 0.07 ± 0.01 | 0.04 ± 0.01 | 0.07 ± 0.02 | 0.05 ± 0.03 |
| PE36 | 12.98 | 0.04 ± 0 | 0.03 ± 0.01 | 0.04 ± 0.01 | 0.03 ± 0.01 |
| Sum | 12.44 | 7.58 | 11.58 | 9.67 | |
| PG36:2 | 6.2 | 2.59 ± 0.24 | 1.68 ± 0.54 | 2.25 ± 0.67 | 1.87 ± 0.8 |
| PG36:1 | 7.99 | 1.13 ± 0.08 | 0.69 ± 0.19 | 0.98 ± 0.31 | 0.81 ± 0.35 |
| PG34:1 | 6.11 | 0.77 ± 0.17 | 0.5 ± 0.2 | 0.6 ± 0.24 | 0.51 ± 0.19 |
| PG_cyc37:1 | 7.05 | 0.11 ± 0.02 | 0.07 ± 0.05 | 0.08 ± 0.02 | 0.07 ± 0.04 |
| PG34:2 | 4.89 | 0.05 ± 0 | 0.03 ± 0.01 | 0.04 ± 0.01 | 0.03 ± 0.02 |
| PG_cyc35 | 6.95 | 0.02 ± 0 | 0.01 ± 0 | 0.02 ± 0.01 | 0.01 ± 0.01 |
| PG32:1 | 4.39 | 0.00 ± 0 | 0.01 ± 0 | 0 ± 0 | 0.01 ± 0 |
| Sum | 4.67 | 3 | 3.97 | 3.31 | |
| PC + PE + PG | Total % of TLE | 34.23 | 25.54 | 32.06 | 29.23 |
Download links
A two-part list of links to download the article, or parts of the article, in various formats.
Downloads (link to download the article as PDF)
Open citations (links to open the citations from this article in various online reference manager services)
Cite this article (links to download the citations from this article in formats compatible with various reference manager tools)
Methylation at the C-2 position of hopanoids increases rigidity in native bacterial membranes
eLife 4:e05663.
https://doi.org/10.7554/eLife.05663


