Kin cell lysis is a danger signal that activates antibacterial pathways of Pseudomonas aeruginosa
- University of Washington, United States
- University of Maryland, United States
Figures
Figure 1
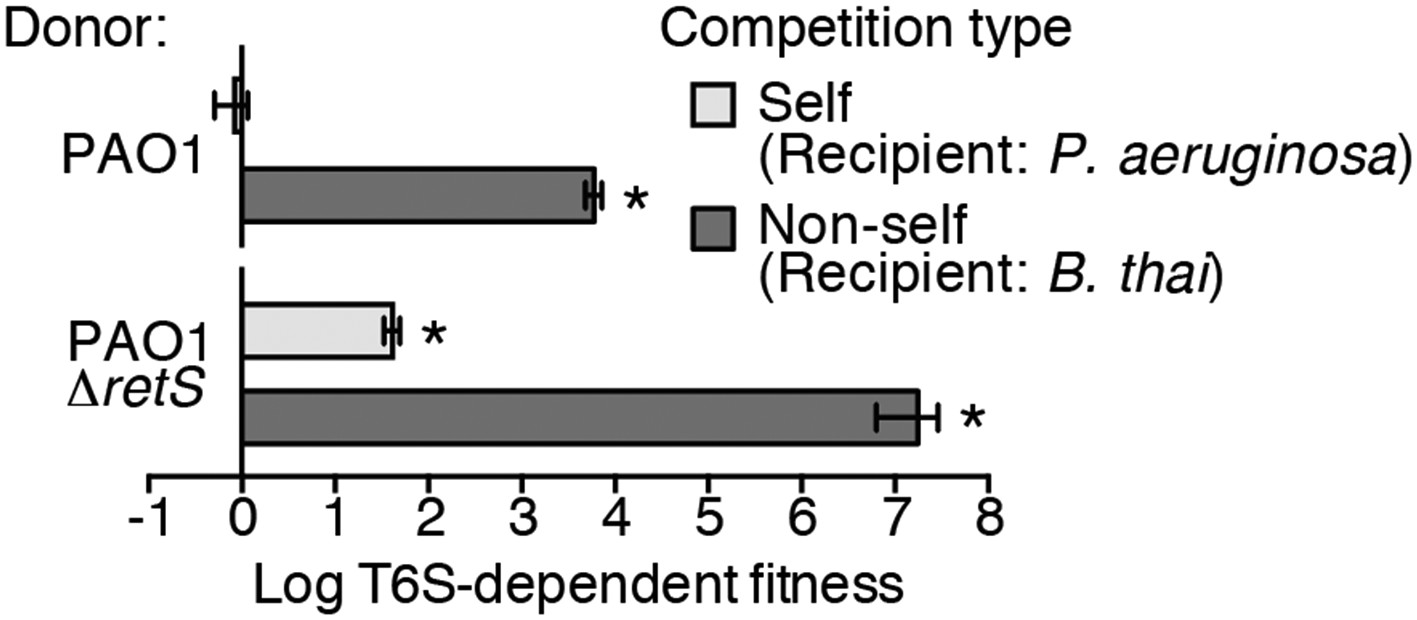
Wild-type P. aeruginosa cells display a strong T6S-dependent fitness advantage in co-culture with non-self but not self competitors.
Outcome of growth competition experiments measuring fitness of P. aeruginosa PAO1 parental or ∆retS strains in co-cultures with self or non-self recipients under T6SS-promoting conditions. The self recipient was P. aeruginosa ∆tse1-4 ∆tsi1-4 in the strain background corresponding to the donor genotype (PAO1 or PAO1 ∆retS). T6S-dependent fitness was parental donor competitive index (change [final/initial] in ratio of donor and recipient colony forming units [c.f.u.]) normalized to ∆tssM1 competitive index. Error bars represent ±standard deviation (SD); n = 3 co-cultures. Asterisks denote a fitness advantage significantly >1 (p < 0.01).
Figure 2 with 4 supplements
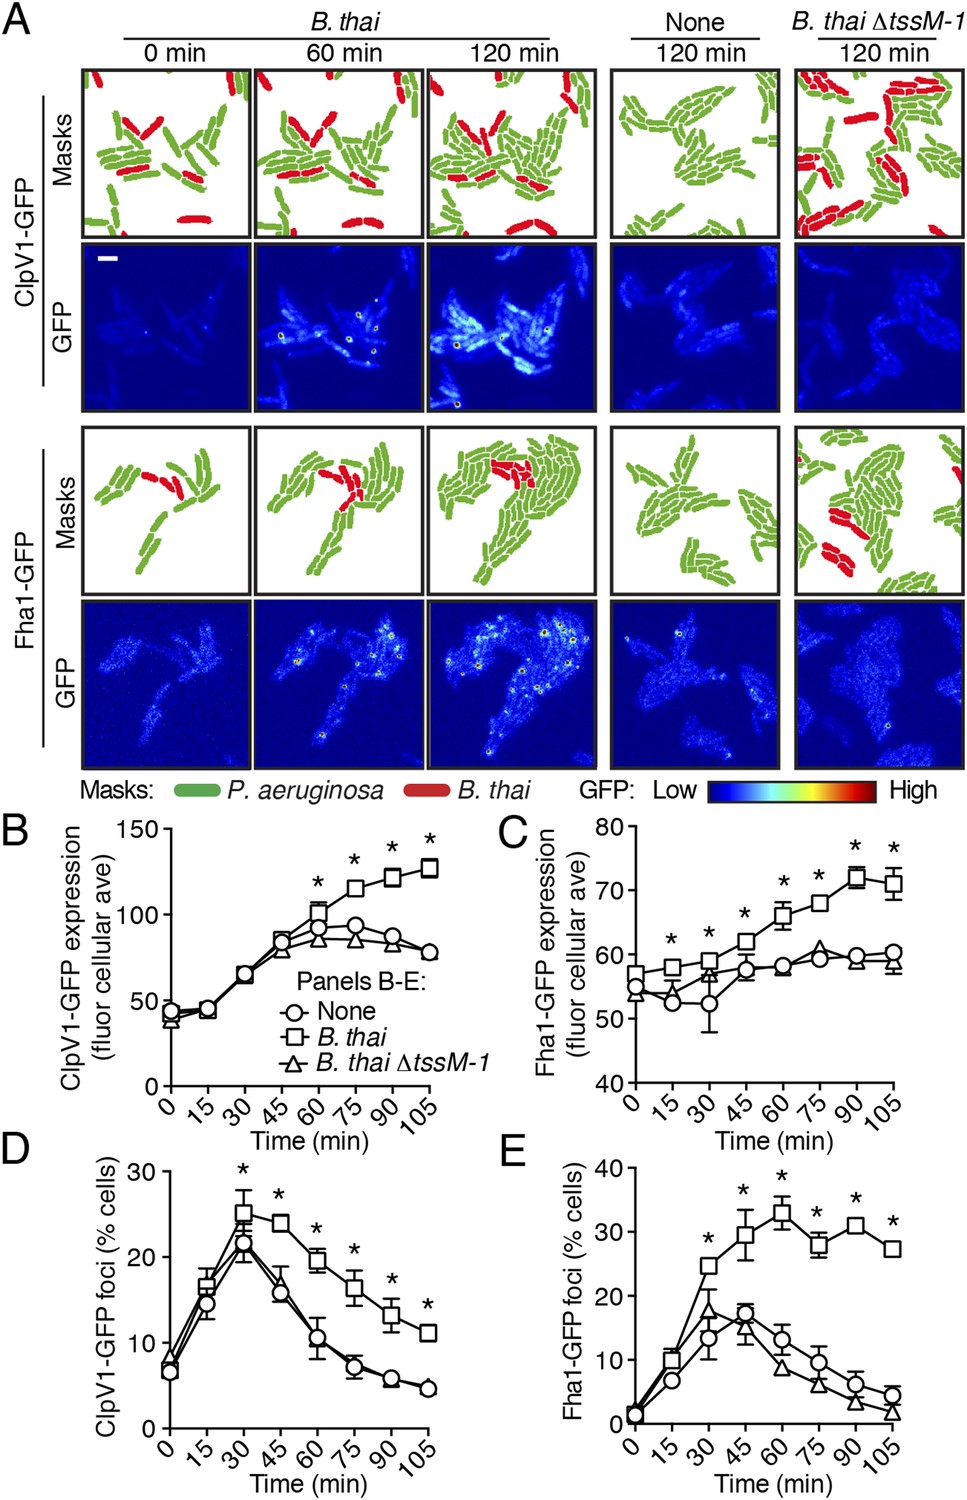
Non-self competitor bacteria stimulate expression and activity of the H1-T6SS.
(A) H1-T6SS expression is increased in P. aeruginosa co-cultured with B. thai expressing an active T6SS. Time-lapse fluorescence microscopy (TLFM) sequences of P. aeruginosa clpV1-gfp (upper) or fha1-gfp (lower) in monoculture or in co-culture with the indicated competitor. Cropped regions from representative time-points are displayed. Remaining time points for monoculture and co-culture with B. thai ∆tssM-1 are depicted in Figure 2—figure supplement 1; see also Videos 1 and 2. Masks colored by cell identity depict automated cell identification generated from the phase image. Scale bar, 6 µm. (B–C) Quantification of H1-T6SS expression from the P. aeruginosa clpV1-gfp (B) and fha1-gfp (C) monoculture and co-culture TLFM experiments described in (A). Average cellular GFP intensity for P. aeruginosa cells was calculated from background-subtracted images. (D–E) H1-T6SS activity is increased in the presence of B. thai with an active T6SS. Percentage of P. aeruginosa clpV1-gfp (D) or fha1-gfp (E) cells with GFP foci for experiments described in (A). Error bars represent ±SD; n = 3 fields. Asterisks indicate significant differences when B. thai was present (p < 0.05).
Figure 2—figure supplement 1
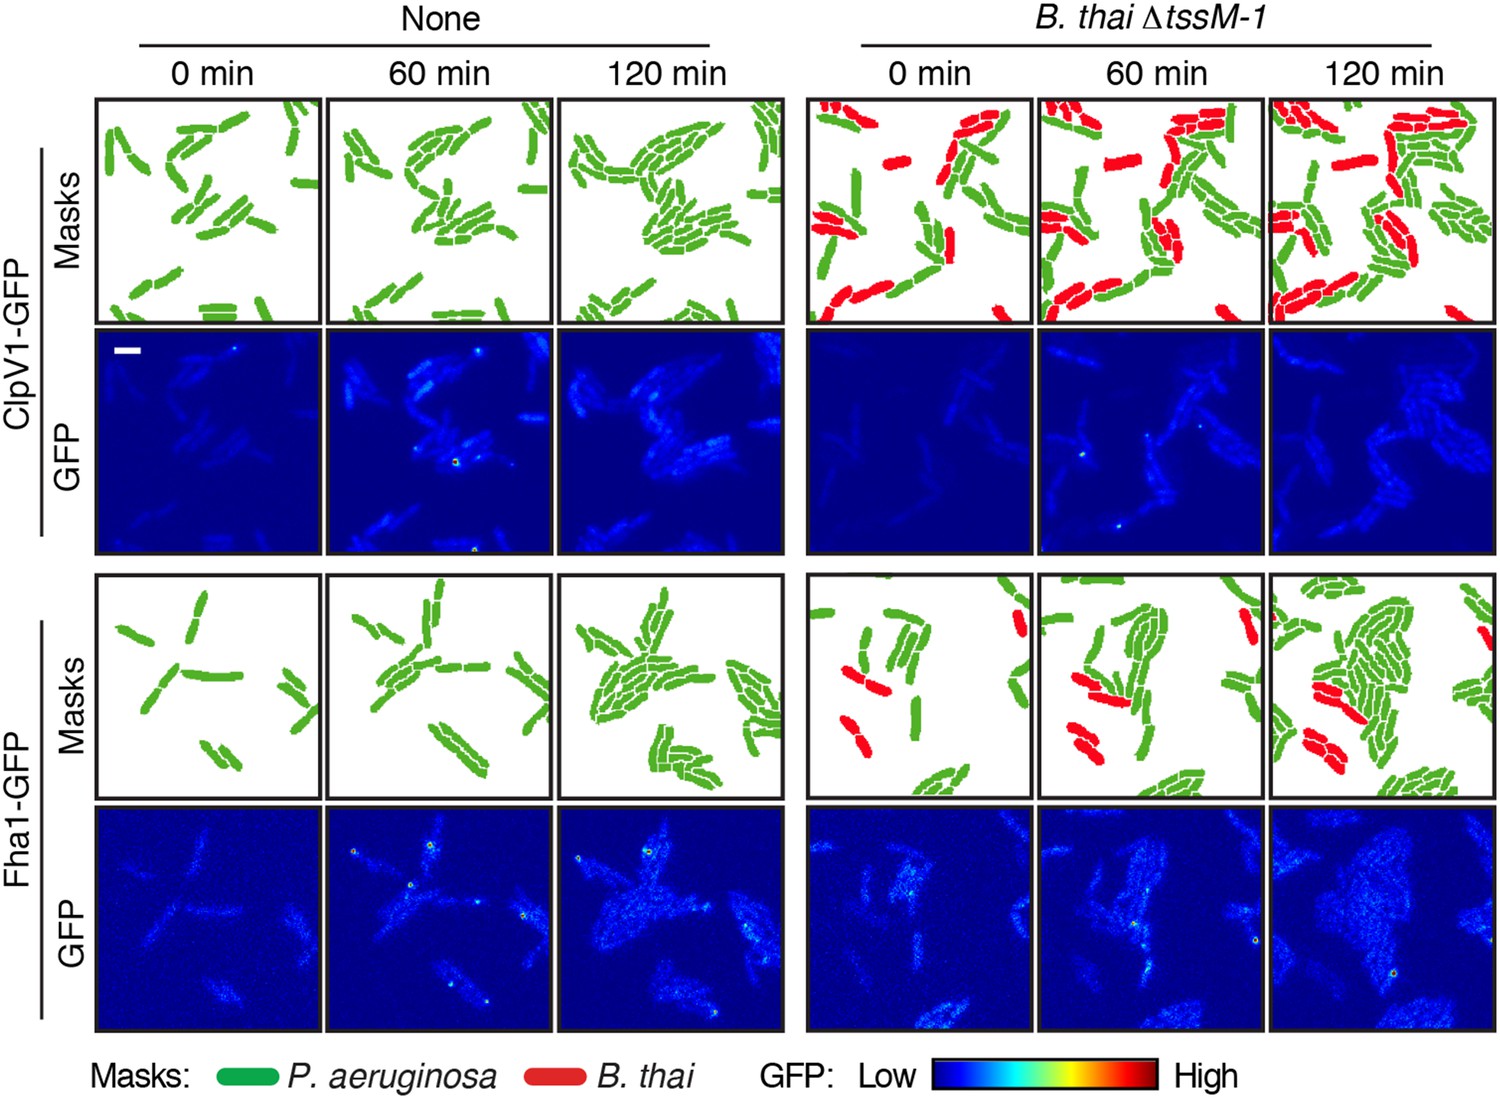
Competitors require an active T6SS to stimulate the P. aeruginosa H1-T6SS.
TLFM sequences of P. aeruginosa clpV1-gfp (upper) and fha1-gfp (lower) cultivated either without competitor or with B. thai ∆tssM-1 as depicted in Figure 2A. Scale bar, 6 µm.
Figure 2—figure supplement 2
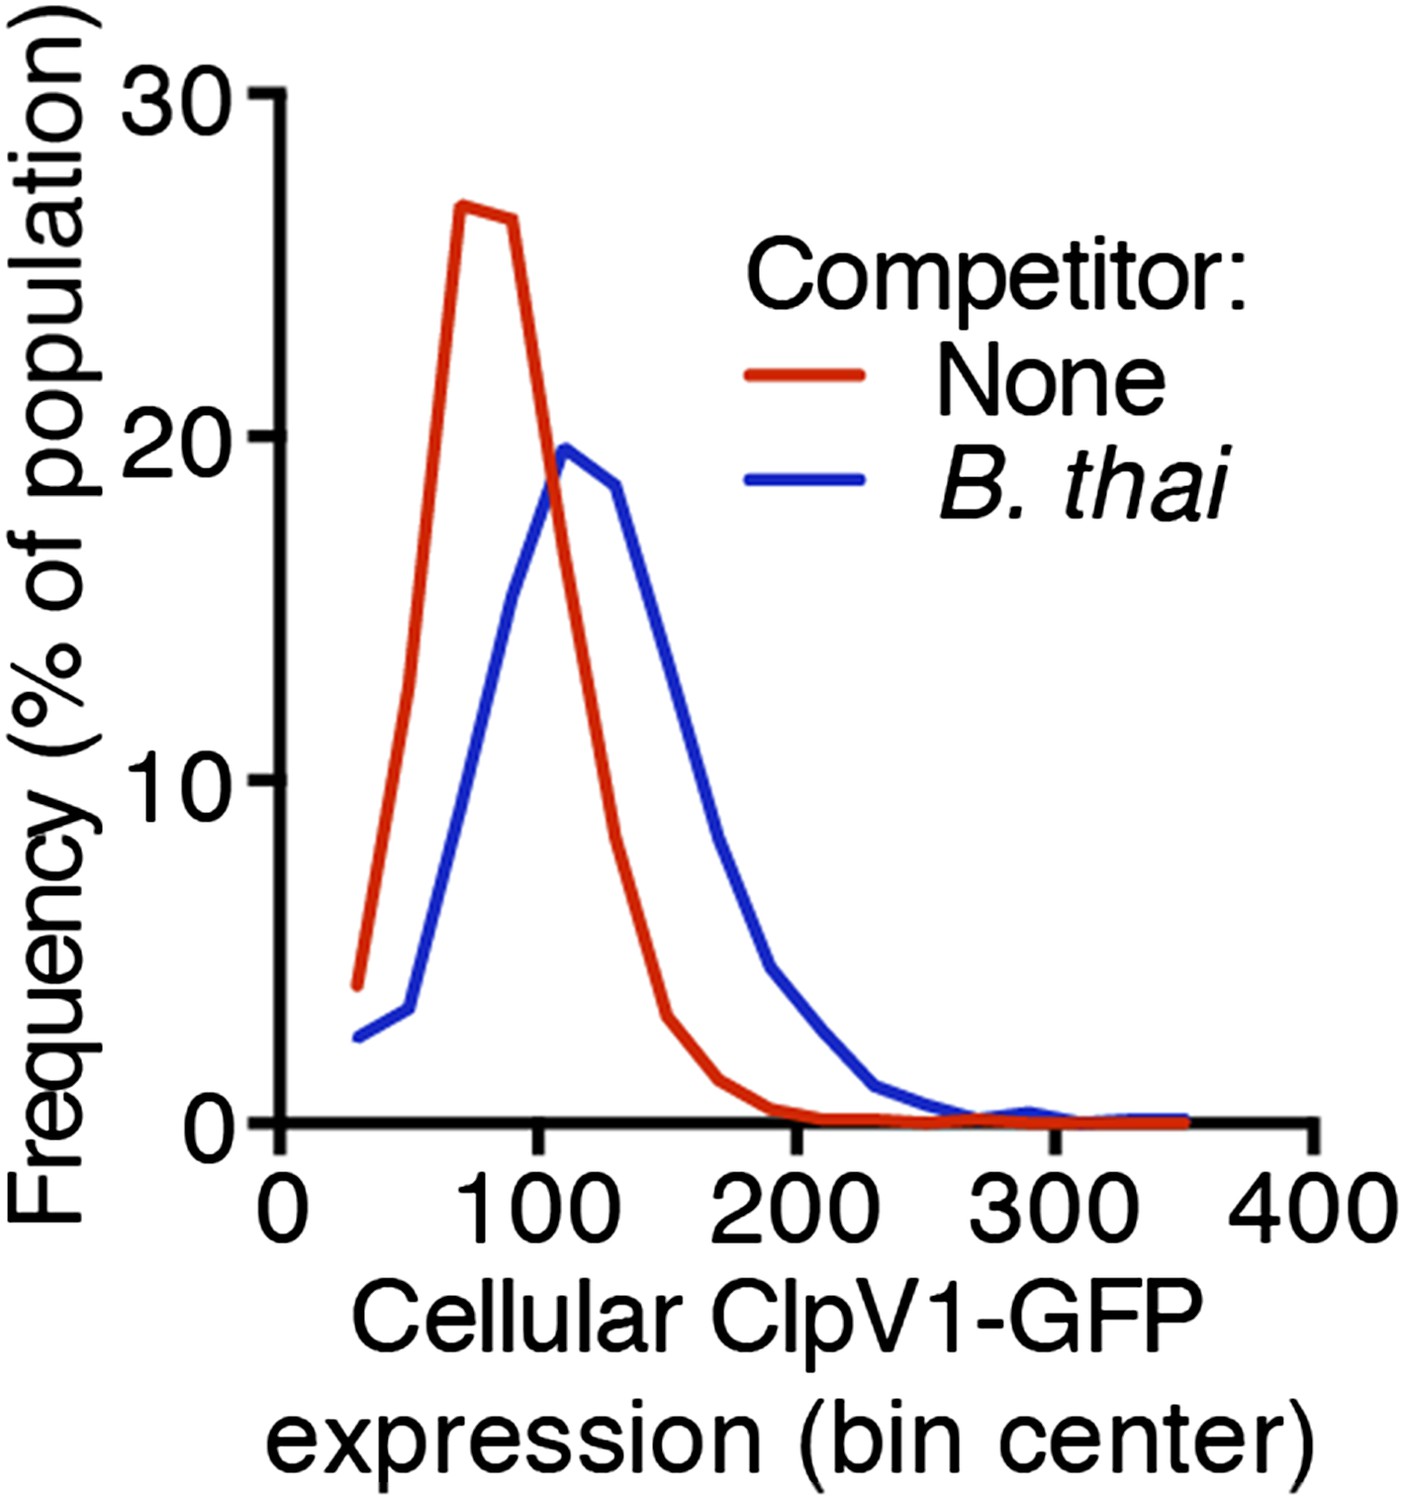
Increased H1-T6SS expression occurs throughout the population.
Histograms of cellular ClpV1-GFP intensity of P. aeruginosa clpV1-gfp following 90 min of growth in monoculture or in co-culture with B. thai. Histogram bin size is 20 intensity units and is normalized to total cells.
Figure 2—figure supplement 3
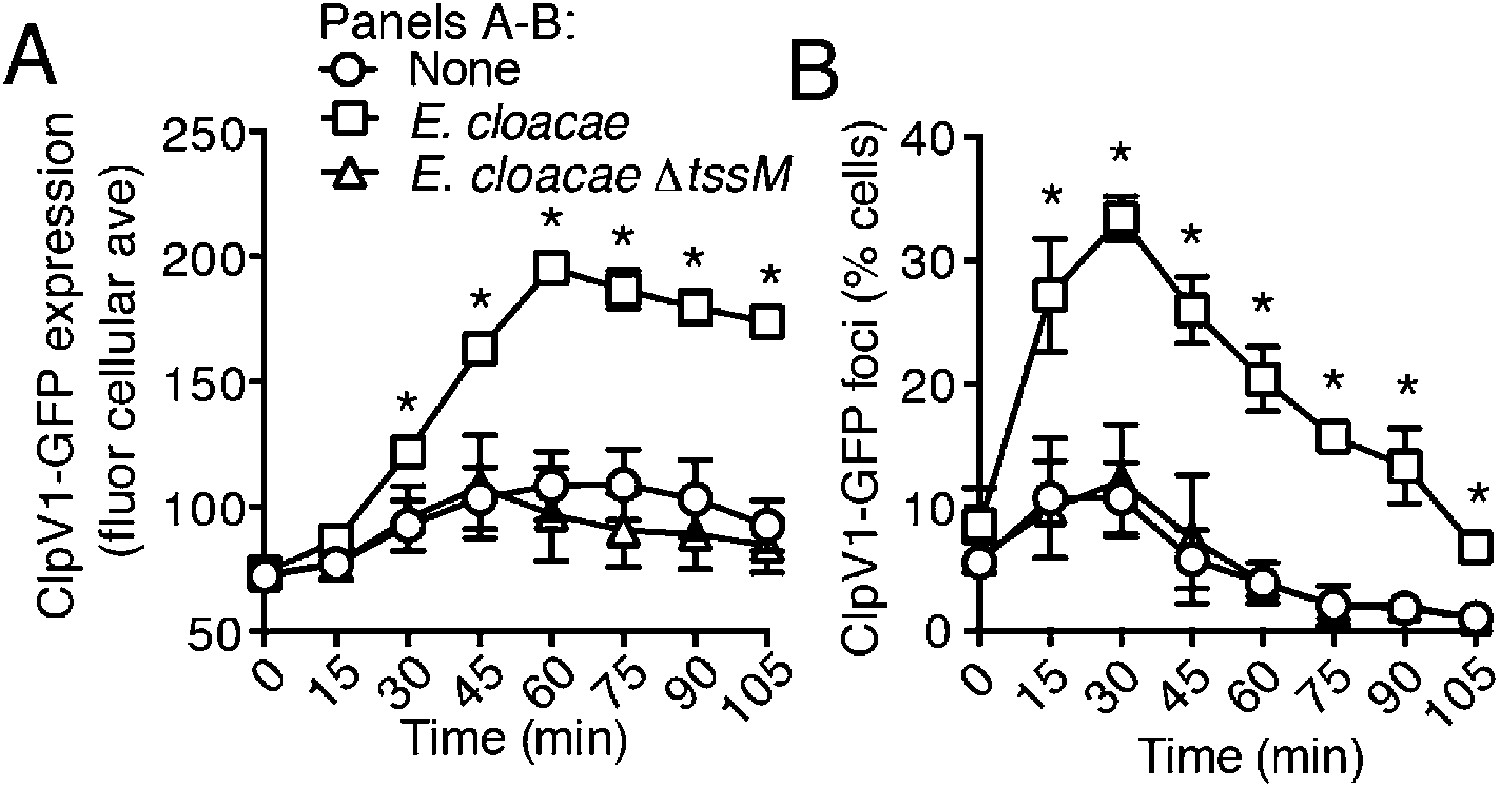
E. cloacae stimulates the H1-T6SS of P. aeruginosa in a T6S-dependent manner.
Average cellular ClpV1-GFP expression (A) and the percentage of cells with ClpV1-GFP foci (B) of P. aeruginosa clpV1-gfp in monoculture or in co-culture with the indicated E. cloacae competitor. Data was collected and analyzed as described in Figure 2. Error bars represent ±SD; n = 3 fields. Asterisks indicate significant differences when E. cloacae was present (p < 0.05). See also Video 3.
Figure 2—figure supplement 4
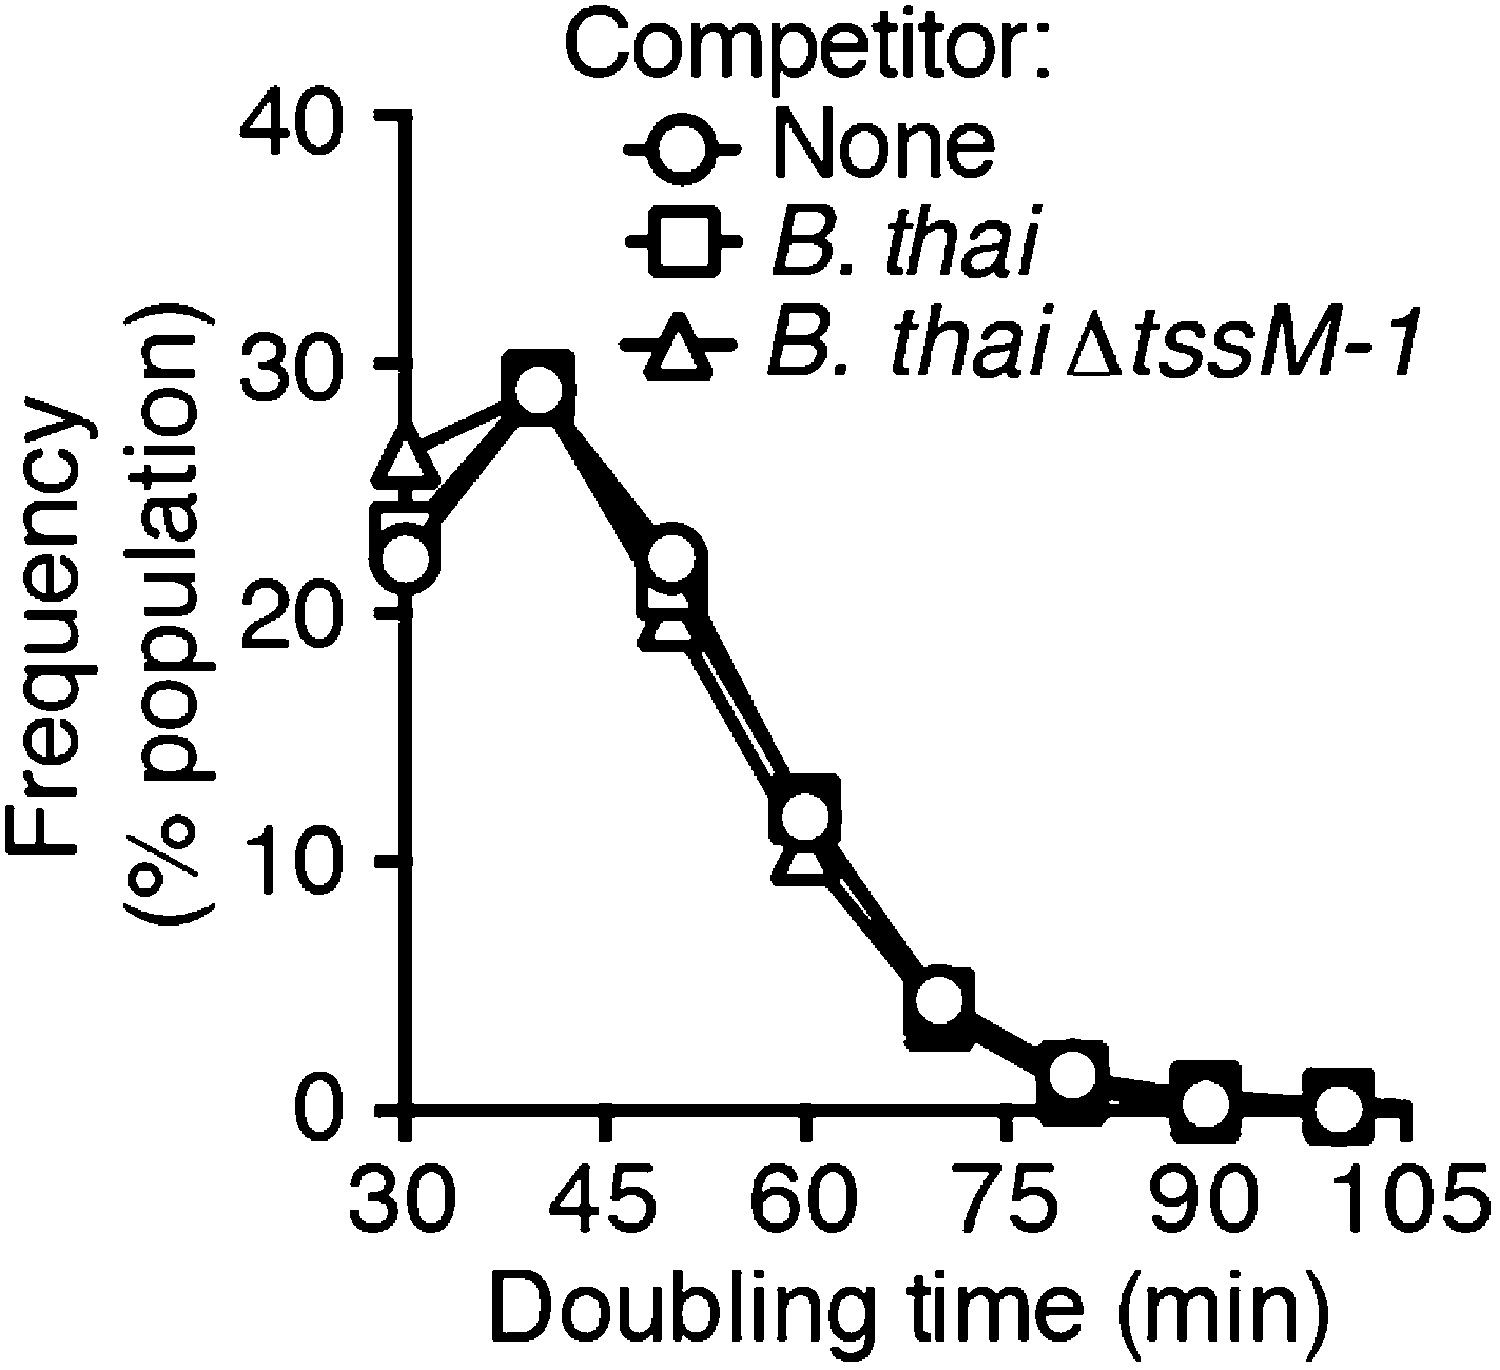
P. aeruginosa doubling time is not affected by the presence of B. thai.
Histograms depicting P. aeruginosa doubling times during growth in monoculture or co-culture with B. thai under TLFM conditions. Error bars represent ±SD; n = 3 fields.
Figure 3 with 2 supplements
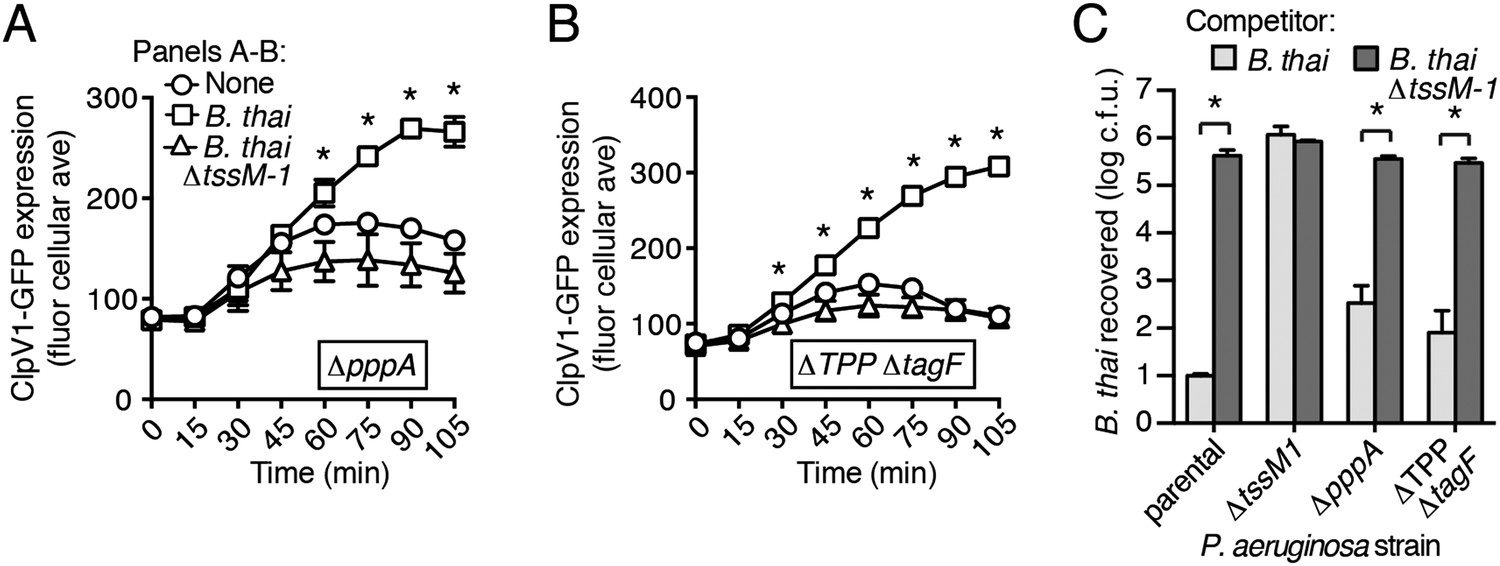
PARA does not require the TPP.
(A–B) Increased H1-T6SS expression in the presence of B. thai does not require a functional TPP. Average ClpV1-GFP cellular fluorescence intensity in P. aeruginosa clpV1-gfp ∆pppA (A) and ∆TPP ∆tagF (B) backgrounds during monoculture or co-culture with the indicated competitors. Error bars represent ±SD; n = 3 fields. Asterisks indicate significant differences when B. thai was present (p < 0.05). Corresponding H1-T6SS activity is shown in Figure 3—figure supplement 1. (C) The TPP is not required for preferential targeting of B. thai with an active T6SS. Outcome of growth competition experiments measuring survival of B. thai following co-culture with the indicated P. aeruginosa strain under T6SS-promoting conditions. Error bars represent ±SD; n = 3 co-cultures.
Figure 3—figure supplement 1
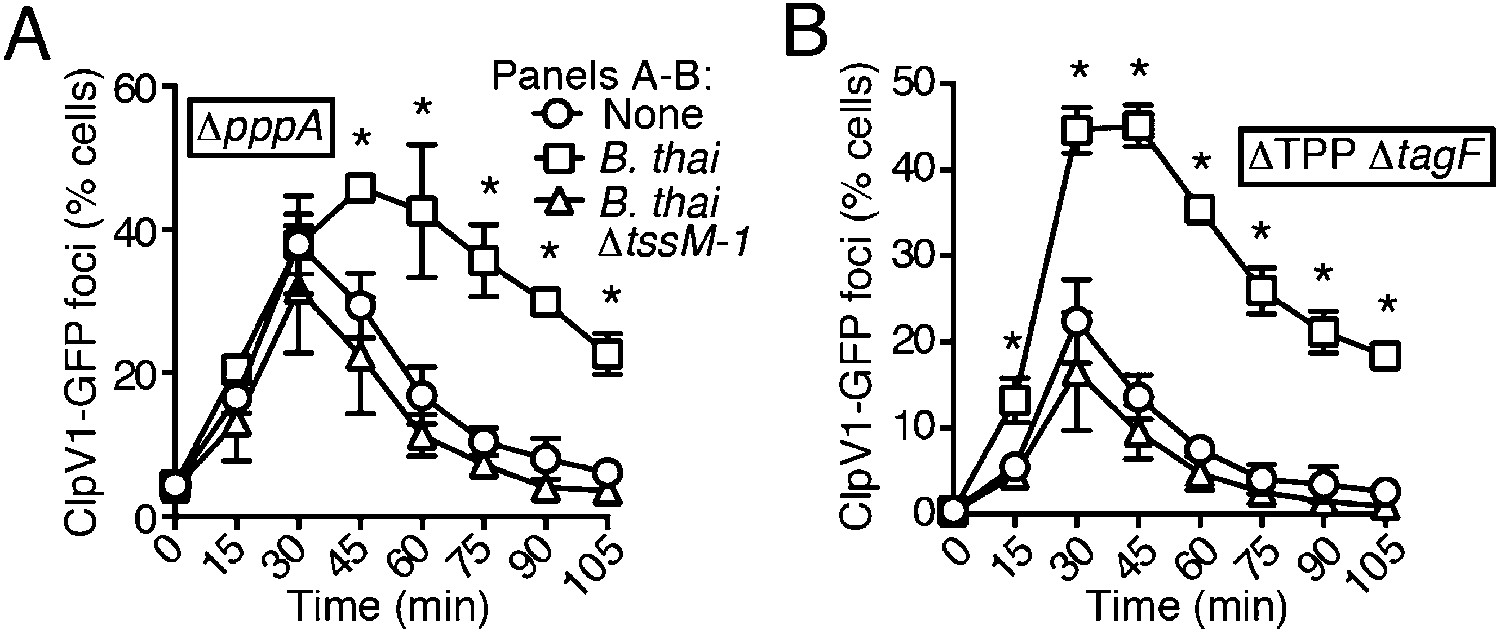
Elevated H1-T6SS activity in the presence of B. thai does not require the TPP.
Percentage of cells containing ClpV1-GFP foci from P. aeruginosa clpV1-gfp strains of ∆pppA (A) or ∆TPP ∆tagF (B) backgrounds in monoculture or in co-culture with the indicated competitor. Error bars represent ±SD; n = 3 co-cultures. Asterisks indicate significant differences when B. thai was present (p < 0.05).
Figure 3—figure supplement 2
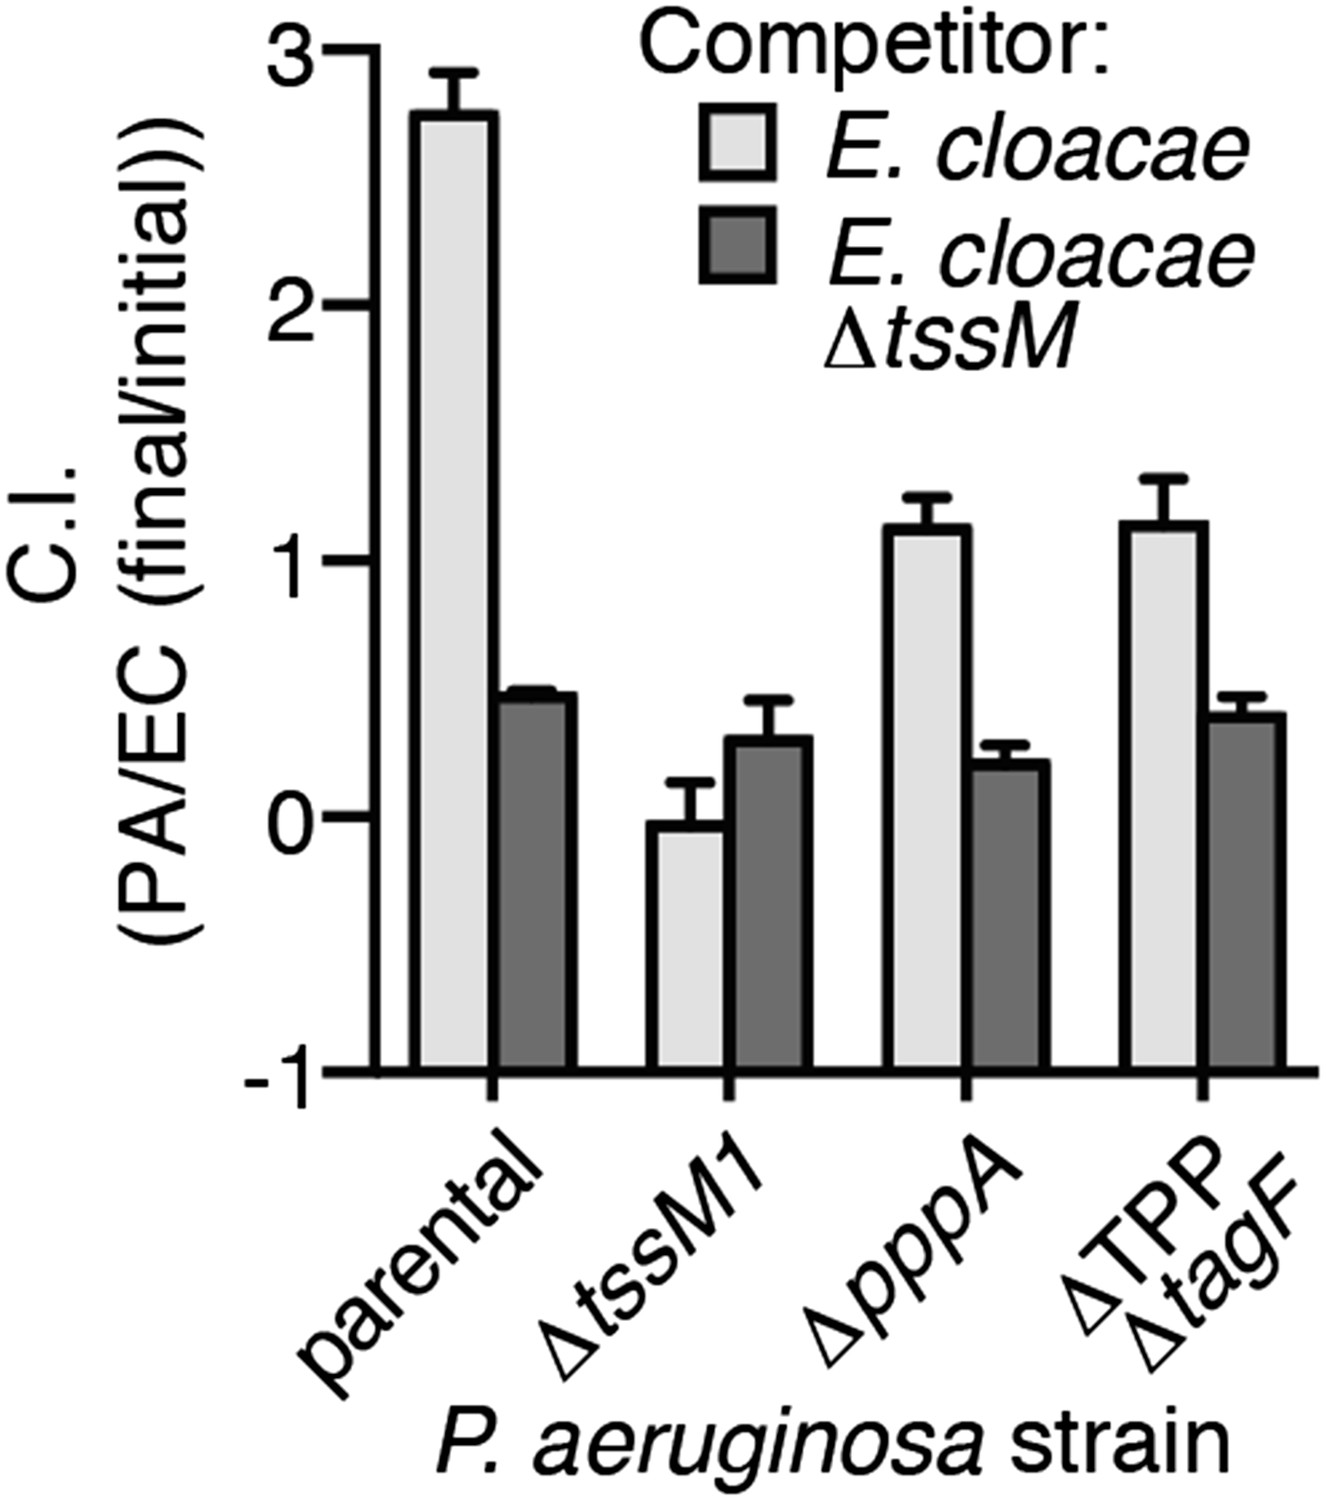
P. aeruginosa does not require the TPP to differentially target E. cloacae with a T6SS.
Outcome of interspecies growth competition experiments measuring competitive index (C.I.) of P. aeruginosa–E. cloacae co-cultures grown under T6SS-promoting conditions. PA, P. aeruginosa; EC, E. cloacae. Error bars represent ±SD; n = 3 co-cultures.
Figure 4 with 2 supplements

The Gac/Rsm pathway is required for PARA.
(A) Schematic depicting the Gac/Rsm pathway of P. aeruginosa. The orphan sensor kinases RetS and LadS exert opposing activity on a third sensor kinase, GacS, which in turn activates its cognate response regulator, GacA. Once active, GacA promotes increased transcription of the small RNAs rsmY and rsmZ. These molecules bind and sequester RsmA; therefore, when abundant, they prevent RsmA binding and destabilization of target mRNAs, including H1-T6SS transcripts. (B) Elevated H1-T6SS expression in the presence of B. thai occurs primarily at the post-transcriptional level. P. aeruginosa strains bearing chromosomally encoded transcriptional or translational fusions to tssA1 (Brencic and Lory, 2009) were incubated with the indicated competitor. Fold H1-T6SS increase in expression was determined by normalizing P. aeruginosa co-cultures to the corresponding strain cultivated in monoculture. n = 3 co-cultures; asterisk indicates significant differences between translational and transcriptional activity (p < 0.05). (C) RsmZ expression is elevated in the presence of B. thai containing a T6SS. Cells masks and the GFP fluorescence channel from representative TLFM sequences of the indicated P. aeruginosa p-rsmZ-gfp co-cultures. Additional time points are shown in Figure 4—figure supplement 1; see also Video 4. (D) Average cellular fluorescence intensity from P. aeruginosa p-rsmZ-gfp corresponding to (C). (E) Expression of MagA is elevated in the presence of T6SBT. Average cellular GFP intensity of P. aeruginosa p-magA-gfp in co-culture with B. thai or B. thai ∆tssM-1. (F) GacS is required for H1-T6SS activation in response to T6SBT. ClpV1-GFP expression was quantified for co-cultures of P. aeruginosa ∆gacS clpV1-gfp with the indicated B. thai competitor. (G) LadS is not required for elevated H1-T6SS expression in the presence of B. thai. Average cellular ClpV1-GFP intensity of P. aeruginosa ∆ladS clpV1-gfp in co-culture with the indicated competitor. See Figure 4—figure supplement 2A for H1-T6SS activity. (H) P. aeruginosa cells lacking retS are unable to respond to T6SBT. Average cellular ClpV1-GFP intensity of P. aeruginosa ∆retS clpV1-gfp in co-culture with the indicated competitor. See Figure 4—figure supplement 2B for H1-T6SS activity. (I) A conserved residue in the periplasmic domain of RetS is required for P. aeruginosa response to T6SBT. Average cellular ClpV1-GFP intensity of P. aeruginosa clpV1-gfp retSW90A cultivated in the presence of the indicated competitor. See Figure 4—figure supplement 2C for H1-T6SS activity. n = 3 fields; asterisks indicate significant differences when B. thai was present (p < 0.05).
Figure 4—figure supplement 1
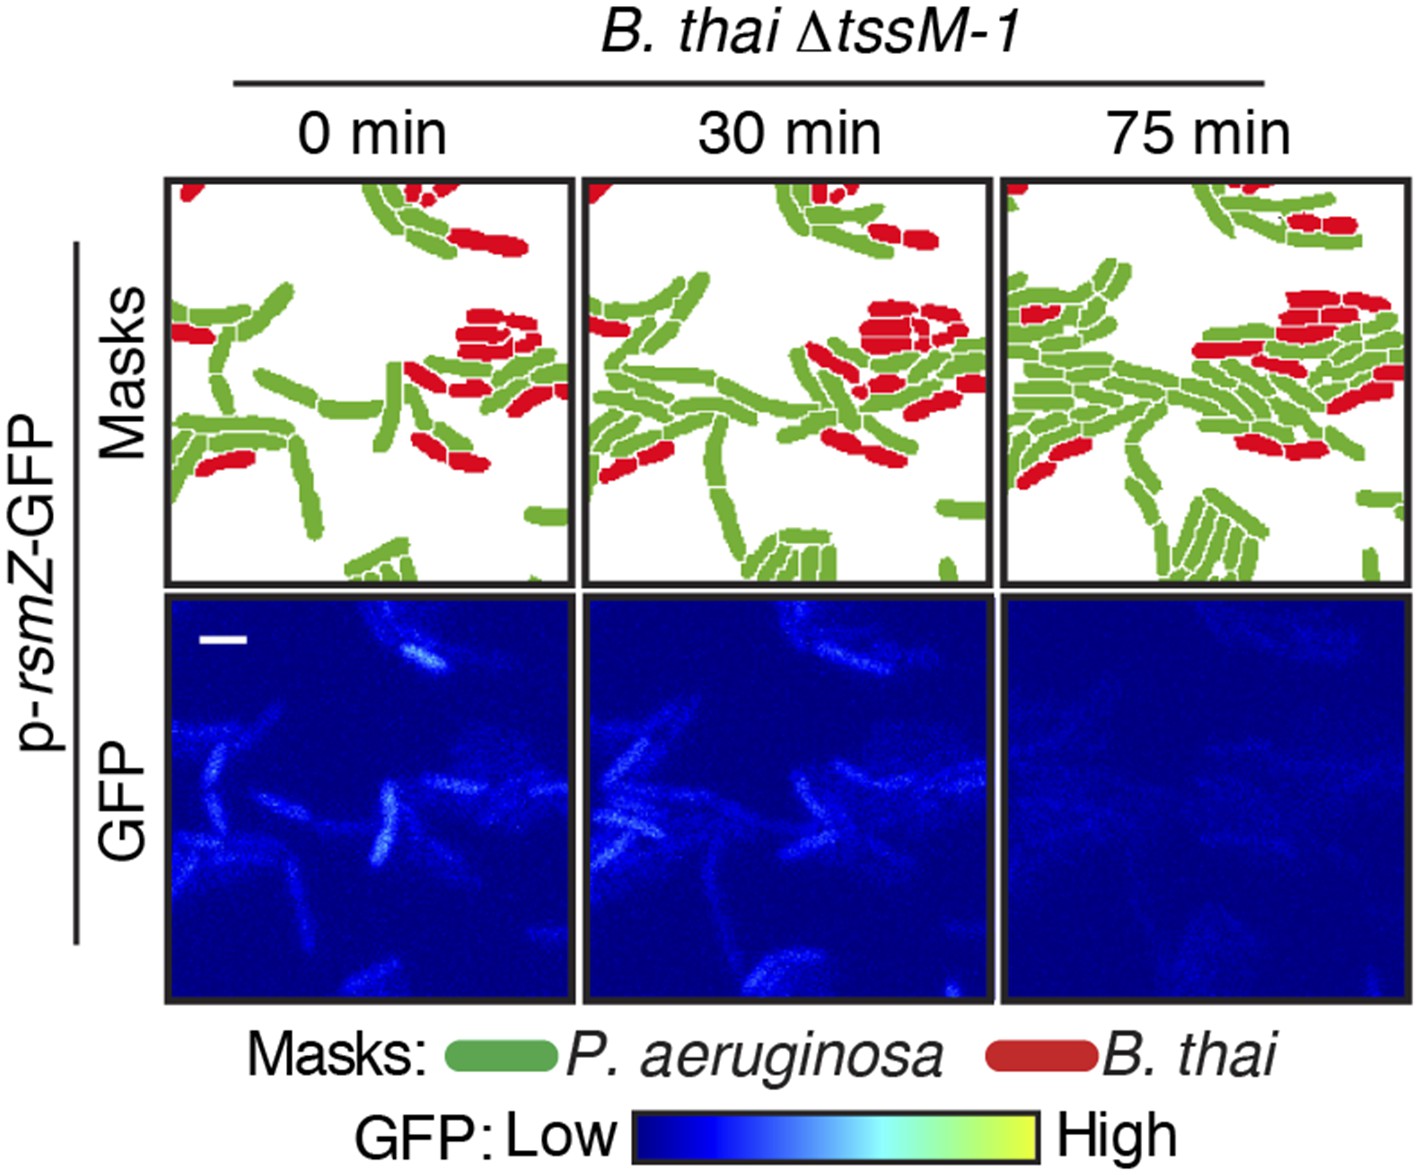
RsmZ expression is not stimulated by B. thai lacking an active T6SS.
Representative TLFM sequences of P. aeruginosa p-rsmZ-gfp cultivated with B. thai ∆tssM-1.
Figure 4—figure supplement 2
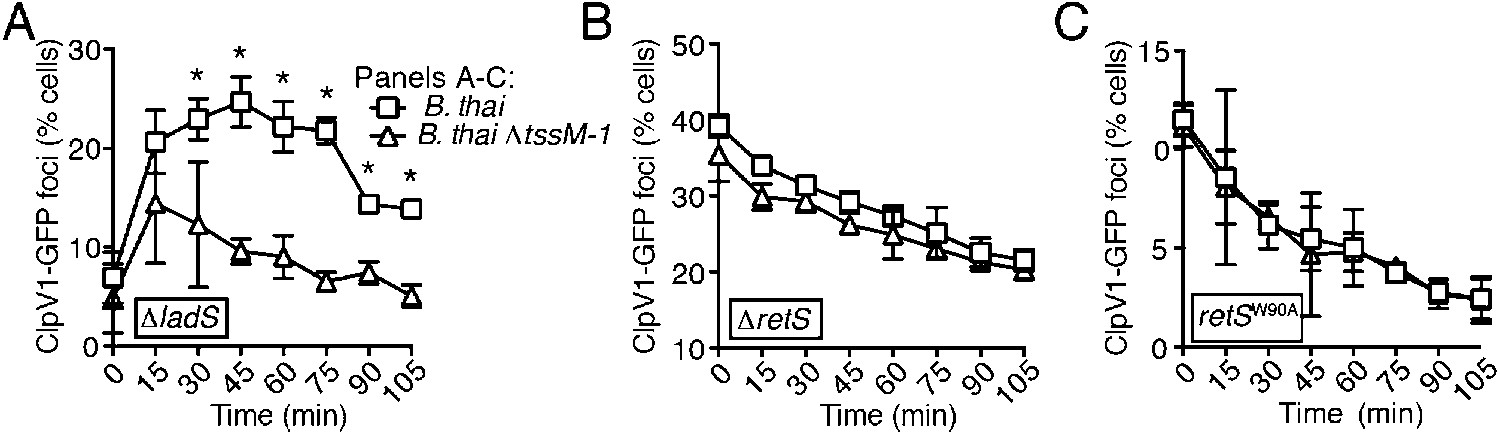
PARA-associated increases in H1-T6SS activity depend on RetS but not LadS.
(A) LadS is not required for increased activity of the H1-T6SS in the presence of B. thai. Percentage of P. aeruginosa clpV1-gfp ∆ladS cells with fluorescent foci during co-culture with the indicated B. thai strain. (B) Stimulation of H1-T6SS activity by B. thai requires RetS. Percentage of P. aeruginosa clpV1-gfp ∆retS cells with fluorescent foci during co-culture with the indicated B. thai strain. (C) A putative signal-binding RetS mutant does not respond to the presence of B. thai. Percentage of P. aeruginosa clpV1-gfp retSW90A cells with fluorescent foci during co-culture with the indicated B. thai strain. Error bars represent ±SD; n = 3 co-cultures. Asterisks indicate significant differences when B. thai was present (p < 0.05).
Figure 5
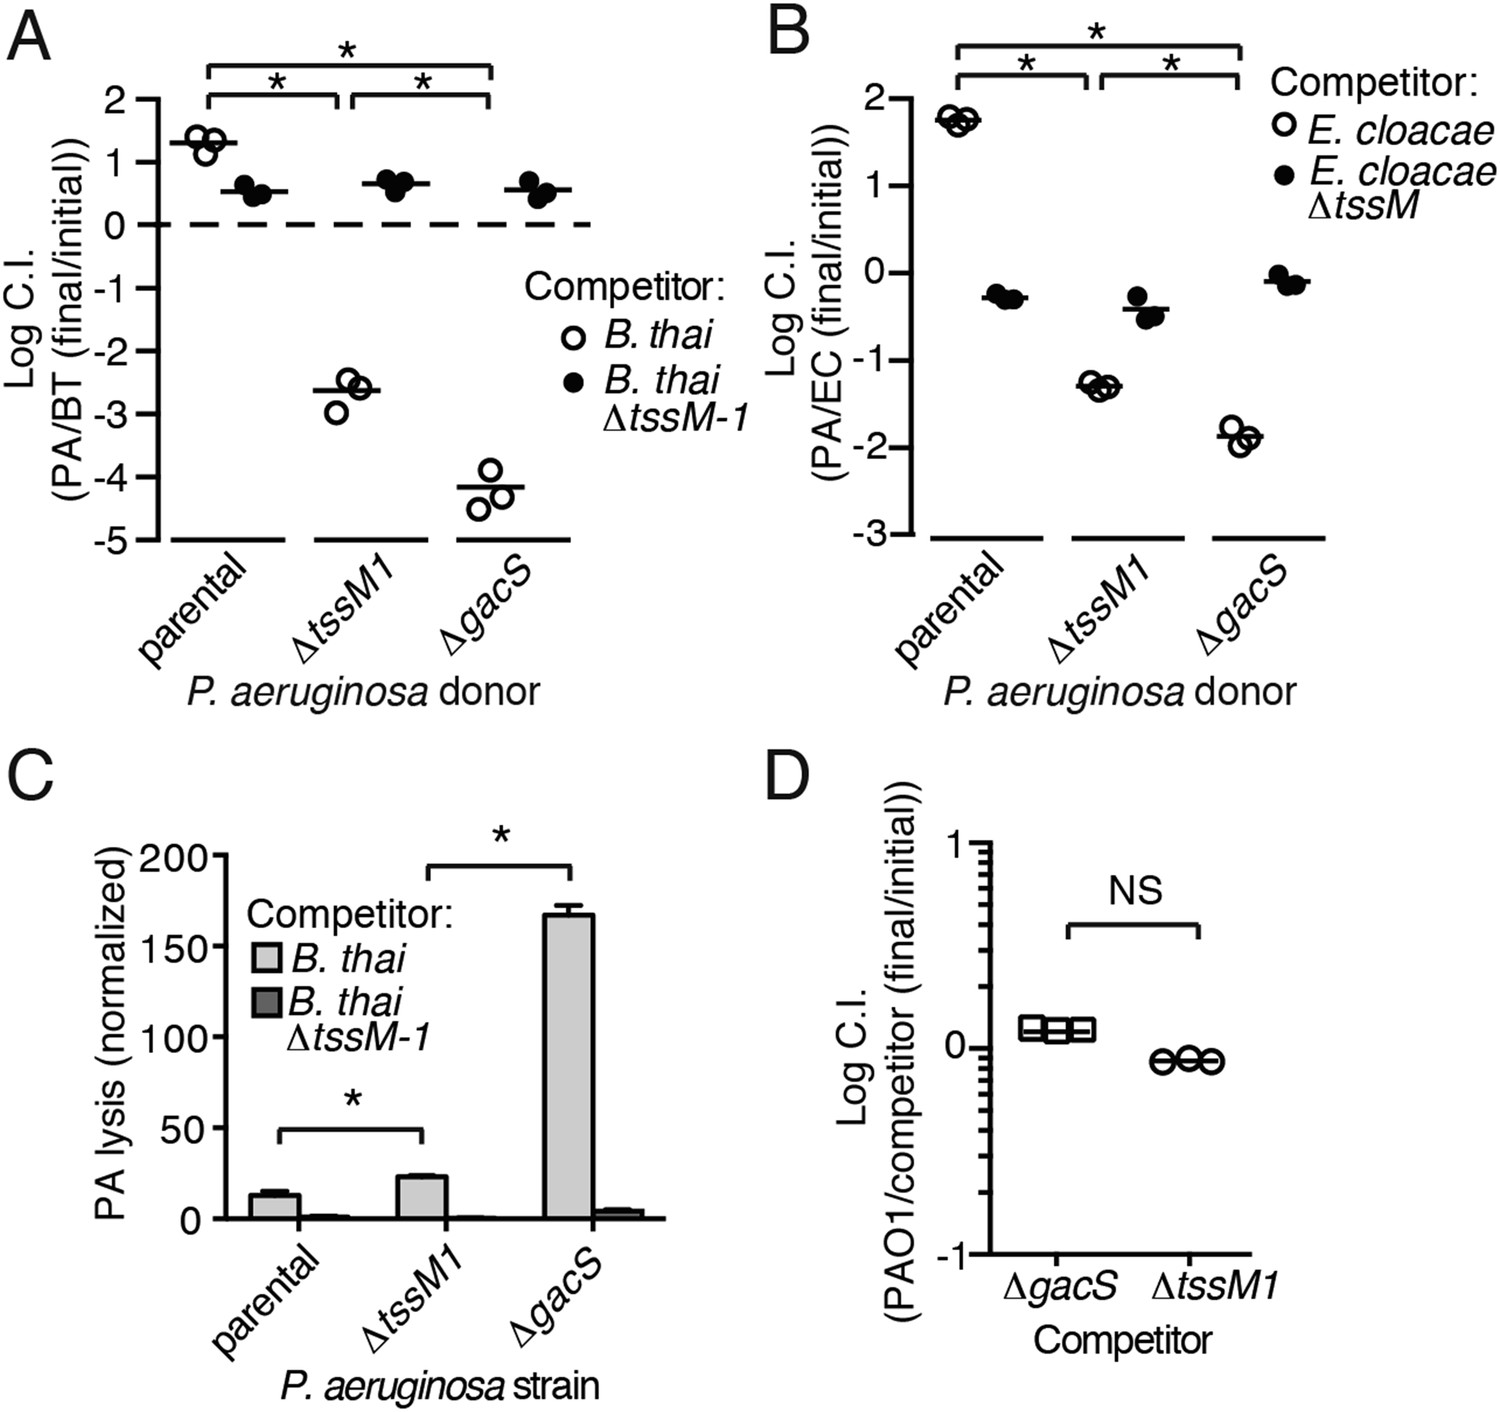
Disruption of the Gac/Rsm pathway results in a profound fitness defect in interspecies co-culture.
(A–B) A P. aeruginosa strain with an inactivated Gac/Rsm pathway displays fitness defects beyond a strain lacking H1-T6S. Outcome of interspecies growth competition experiments between the indicated P. aeruginosa and B. thai (A) or E. cloacae (B) strains. n = 3 co-cultures. C.I., competitive index. PA, P. aeruginosa. BT, B. thai. EC, E. cloacae. (C) P. aeruginosa lysis promoted by T6SBT is increased in a strain lacking a functional Gac/Rsm pathway. P. aeruginosa lysis events from TLFM sequences were normalized to initial number of contacts with B. thai. See also Video 5. n = 3 fields. (D) A gacS deletion does not alter growth rate. Outcome of intraspecies growth competition experiments between PAO1 and the indicated competitor strains under conditions identical to those used in (A–B). n = 3 co-cultures. (A–D) Error bars represent ±SD; asterisks indicate significant differences between indicated groups (p < 0.05). NS, not significant.
Figure 6
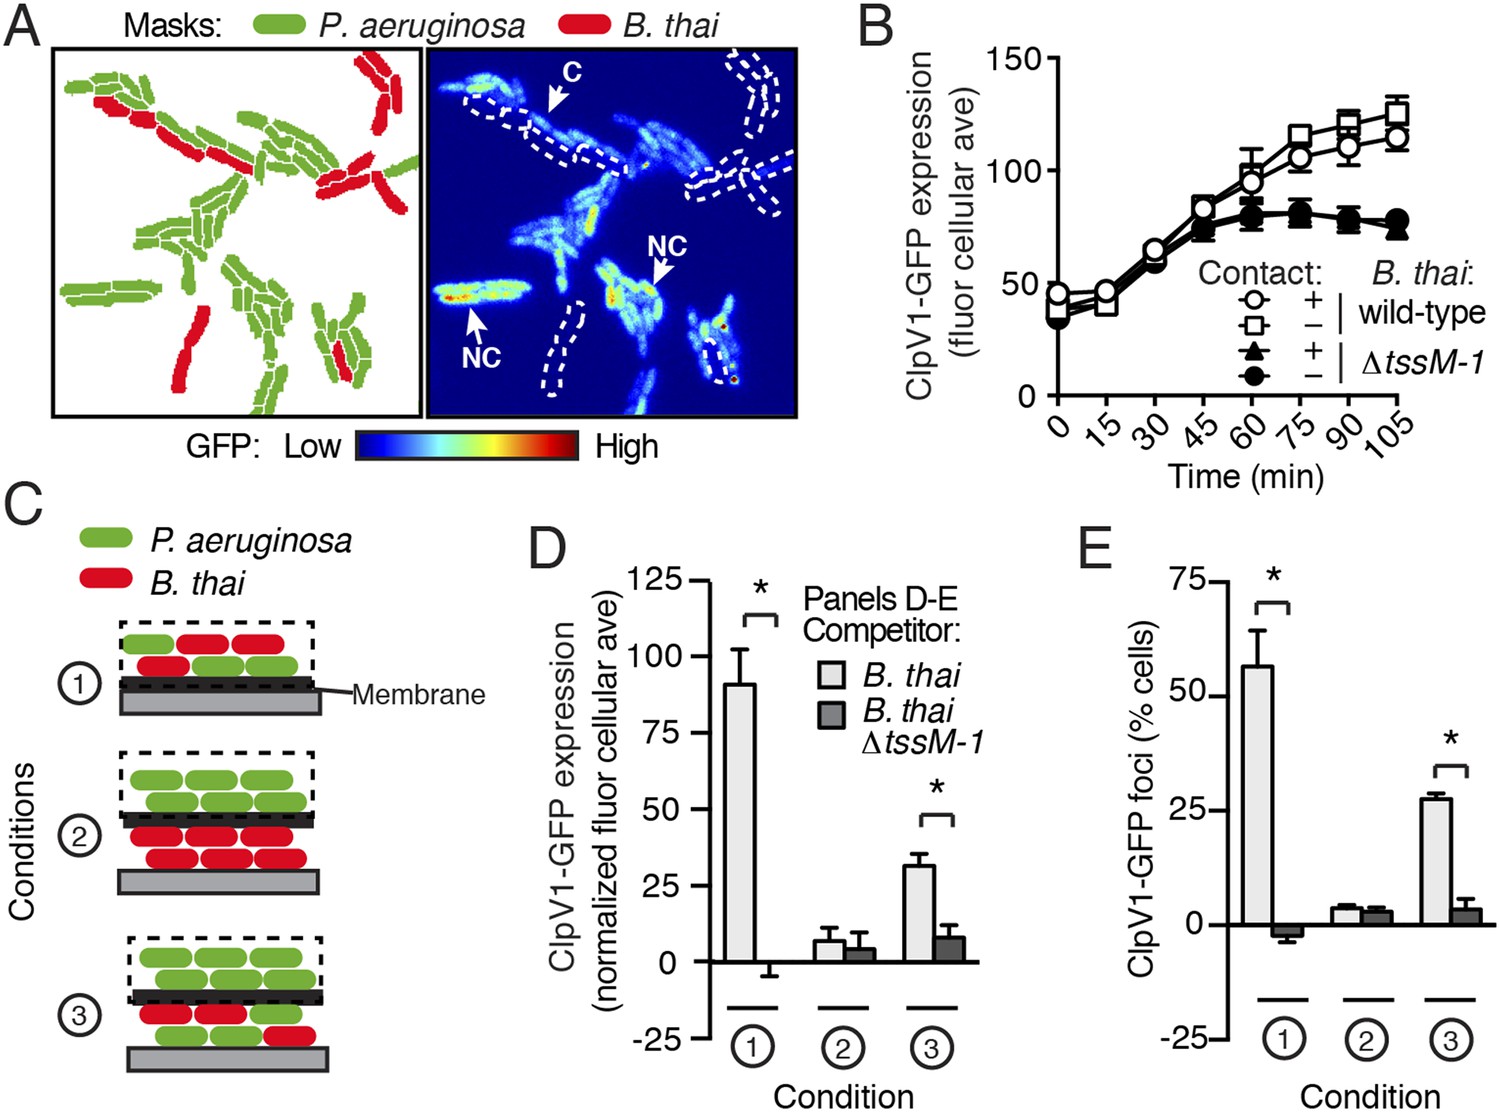
PARA is induced by a diffusible signal.
(A) The PARA-associated increase in H1-T6SS expression is not contact-dependent. A representative region from a P. aeruginosa clpV1-gfp–B. thai co-culture following 120 min of growth is depicted. Cells masks are colored by cell identity (left panel); GFP intensity with B. thai cell positions outlined in white dashed lines (right panel). Arrows indicate P. aeruginosa cells contacting (C) or not contacting (NC) B. thai. (B) Average cellular ClpV1-GFP expression for contacting and non-contacting subpopulations described in (A). (C) Schematic depicting the experimental setup for (D). (D–E) PARA induction requires proximity to contacting P. aeruginosa–B. thai cells. Bacterial growth was initiated as pictured in (C). ClpV1-GFP was measured in populations on the membrane (black dashed lines). Average cellular ClpV1-GFP expression (D) and percentage of cells with foci (E) was determined. ClpV1-GFP expression measured in co-cultures was normalized by subtracting P. aeruginosa monoculture measurements. Error bars represent ±SD; n = 3 fields. Asterisks indicate significant differences between indicated groups (p < 0.05).
Figure 7

P. aeruginosa lysis is sufficient to induce PARA.
(A) T6SBT promotes P. aeruginosa lysis. Lysis of P. aeruginosa was measured under TLFM conditions and data were normalized to contacts with B. thai. n = 3 fields. Asterisk indicates significant difference between B. thai and B. thai ∆tssM-1 (p < 0.05). (B) P. aeruginosa lysis precedes induction of H1-T6SS expression and B. thai lysis. Lysis (left axis) and fold increase in ClpV1-GFP (blue line, right axis) measured concurrently under TLFM conditions. ClpV1-GFP levels from P. aeruginosa–B. thai co-cultures were normalized to P. aeruginosa monocultures. Error bars and light blue shading, ± SD. n = 4 fields. See also Video 6. (C) P. aeruginosa lysate stimulates the Gac/Rsm pathway. Average cellular p-rsmZ-GFP expression in P. aeruginosa cultivated on lysate-infused growth pads. Cellular GFP expression was calculated as described in Figure 2. (D) H1-T6SS expression is stimulated by P. aeruginosa lysate. Average cellular ClpV1-GFP expression of P. aeruginosa cultivated on lysate-infused growth pads. (C–D) n = 3 fields; asterisks indicated significant differences between P. aeruginosa lysate and no lysate (p < 0.05). (E) Expression of Gac/Rsm-regulated proteins is increased in lysate-treated P. aeruginosa cells. Quantitative mass spectrometry was used to compare the proteome of PBS (control) and lysate treated P. aeruginosa. Previously identified Gac/Rsm targets are indicated and H1-T6SS proteins discussed in this study are labeled. Data derive from two biological replicates. (F) Lysate stimulates H1-T6SS-mediated killing of B. thai ∆tssM-1. Outcome of interspecies growth competition experiments between the indicated P. aeruginosa and B. thai in the presence or absence of P. aeruginosa-derived lysate. Error bars represent ±SD; n = 3 co-cultures. Asterisk indicates significant difference between lysate and no lysate treatments (p < 0.05).
-
Figure 7—source data 1
Proteins and corresponding spectral counts identified by quantitative mass spectrometry for P. aeruginosa cells with and without lysate exposure.
Filtering criteria are described in ‘Materials and methods’. Mean and total spectral counts for the combined replicates are provided. Blue shading corresponds to Gac/Rsm targets as defined by Lory et al. (Goodman et al., 2004).
- https://doi.org/10.7554/eLife.05701.023
Figure 8 with 2 supplements
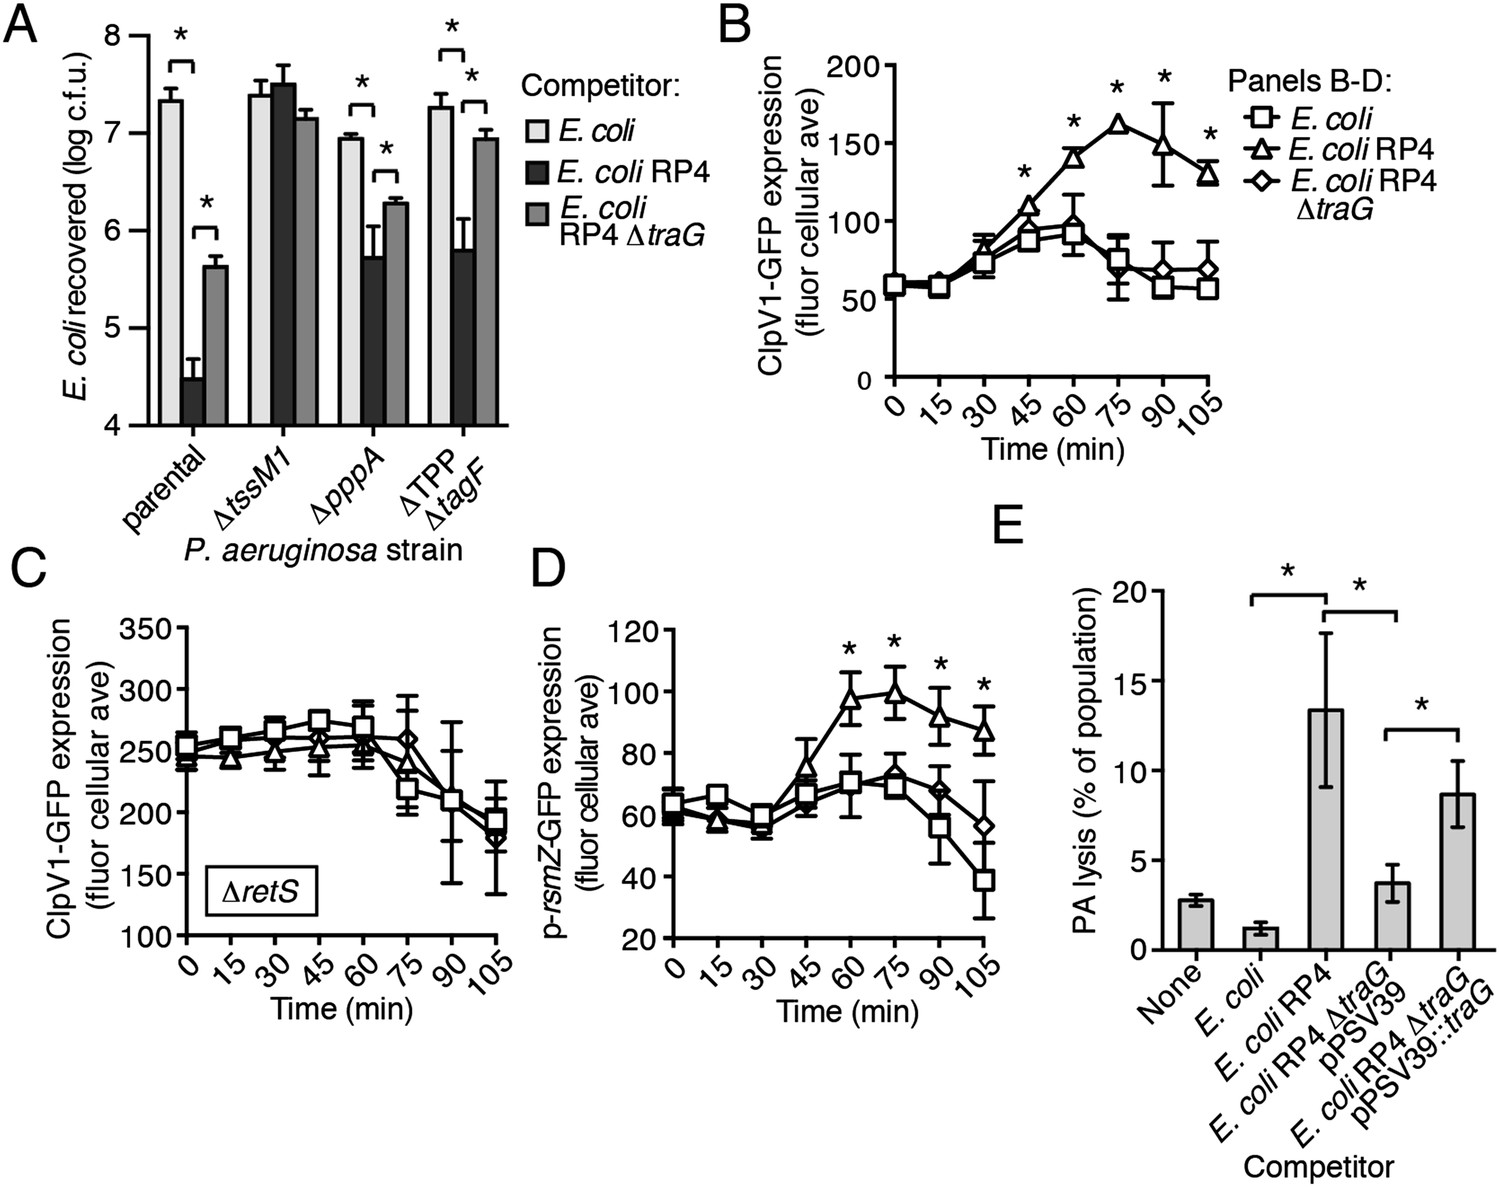
The RP4-encoded IncP-type T4SS induces PARA through lysis of P. aeruginosa.
(A) The TPP is not required for differential targeting of E. coli with a T4SS. Outcome of growth competition experiments demonstrating increased susceptibility of T4S+ E. coli to the H1-T6SS of P. aeruginosa. See also Figure 8—figure supplement 1 for genetic complementation data of the traG deletion. n = 4 co-cultures. (B) H1-T6SS expression is elevated in the presence of E. coli containing a T4SS. Average cellular ClpV1-GFP expression of the P. aeruginosa clpV1-gfp throughout co-culture with the indicated E. coli strains. (C) RetS is required for increased H1-T6SS expression. Average cellular ClpV1-GFP expression of the P. aeruginosa clpV1-gfp ∆retS throughout co-culture with the indicated E. coli strains. (D) E. coli bearing a T4SS stimulates rsmZ expression. Average cellular GFP levels of P. aeruginosa p-rsmZ-gfp in TLFM co-culture experiments with the indicated E. coli strains. (B–D) n = 3 fields; asterisks indicate significant differences between E. coli and E. coli RP4 co-cultures (p < 0.05). (E) The T4SS encoded on RP4 promotes P. aeruginosa lysis. Relative P. aeruginosa attB::lacZ lysis was measured following co-cultivation with the indicated E. coli strain by comparing extracellular to total β-galactosidase activity. Error bars represent ±SD; (A) and (E) n = 3 co-cultures; asterisks indicate significant differences between indicated groups (p < 0.05).
Figure 8—figure supplement 1
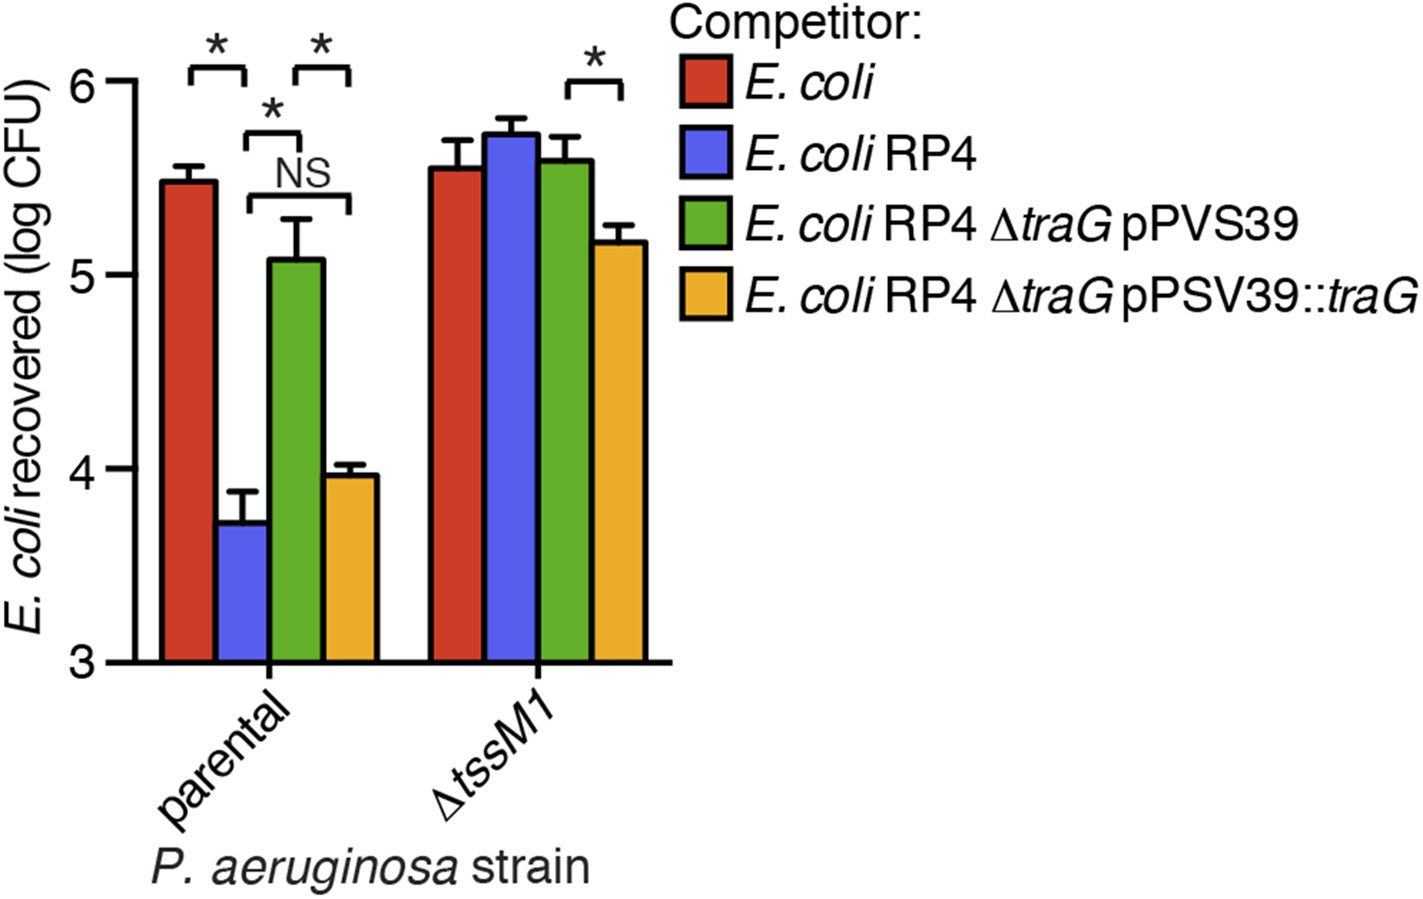
Genetic complementation of traG restores H1-T6SS-dependent targeting of E. coli RP4.
Outcome of growth competition experiment in which P. aeruginosa and E. coli were co-cultivated under T6SS-promoting conditions. n = 4 co-cultures. Asterisks indicates significant differences between groups (p < 0.05); NS, not significant.
Figure 8—figure supplement 2
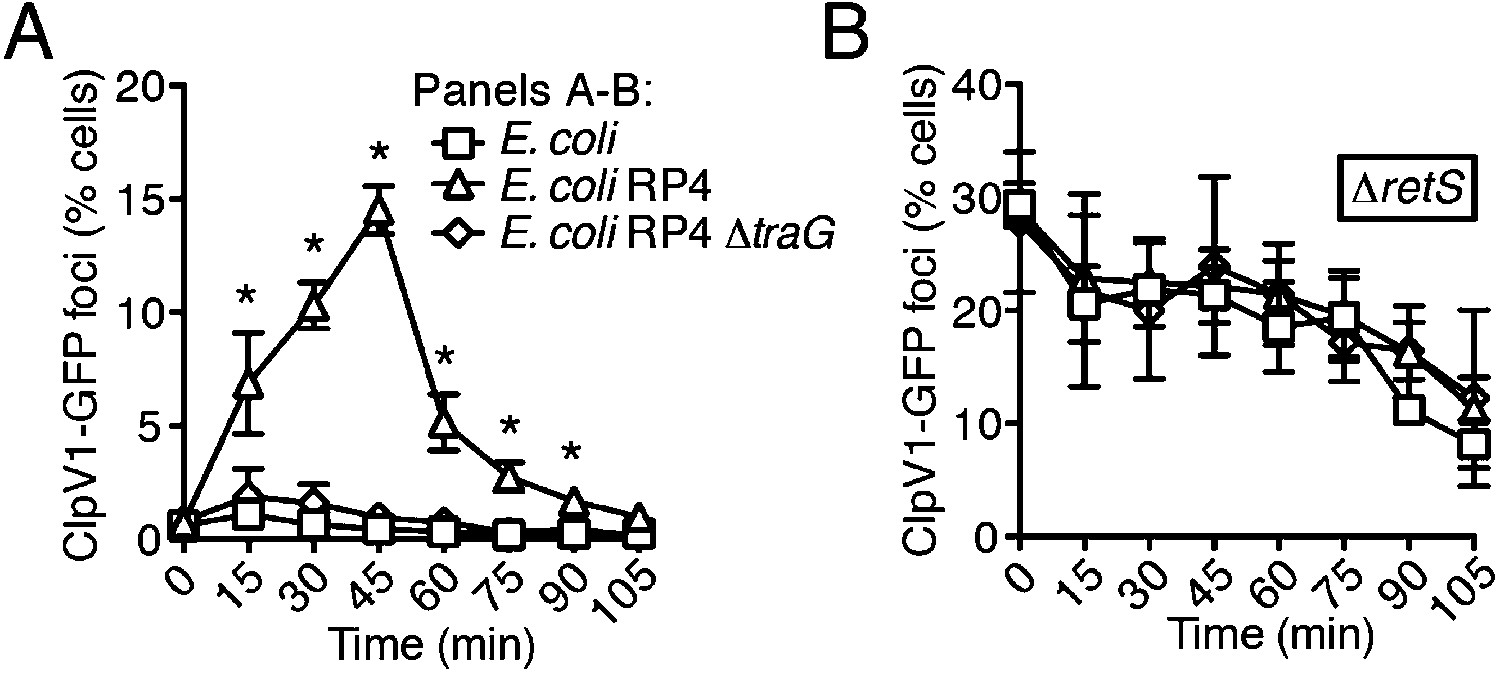
The RP4-encoded T4SS induces a PARA-associated increase in H1-T6SS activity.
Percentage of cells containing ClpV1-GFP foci in P. aeruginosa clpV1-gfp (A) or ∆retS clpV1-gfp (B) cultivated with the indicated competitor. Error bars represent ±SD; n = 3 co-cultures. Asterisks indicate significant differences between co-cultures with E. coli and E. coli RP4 (p < 0.05).
Figure 9
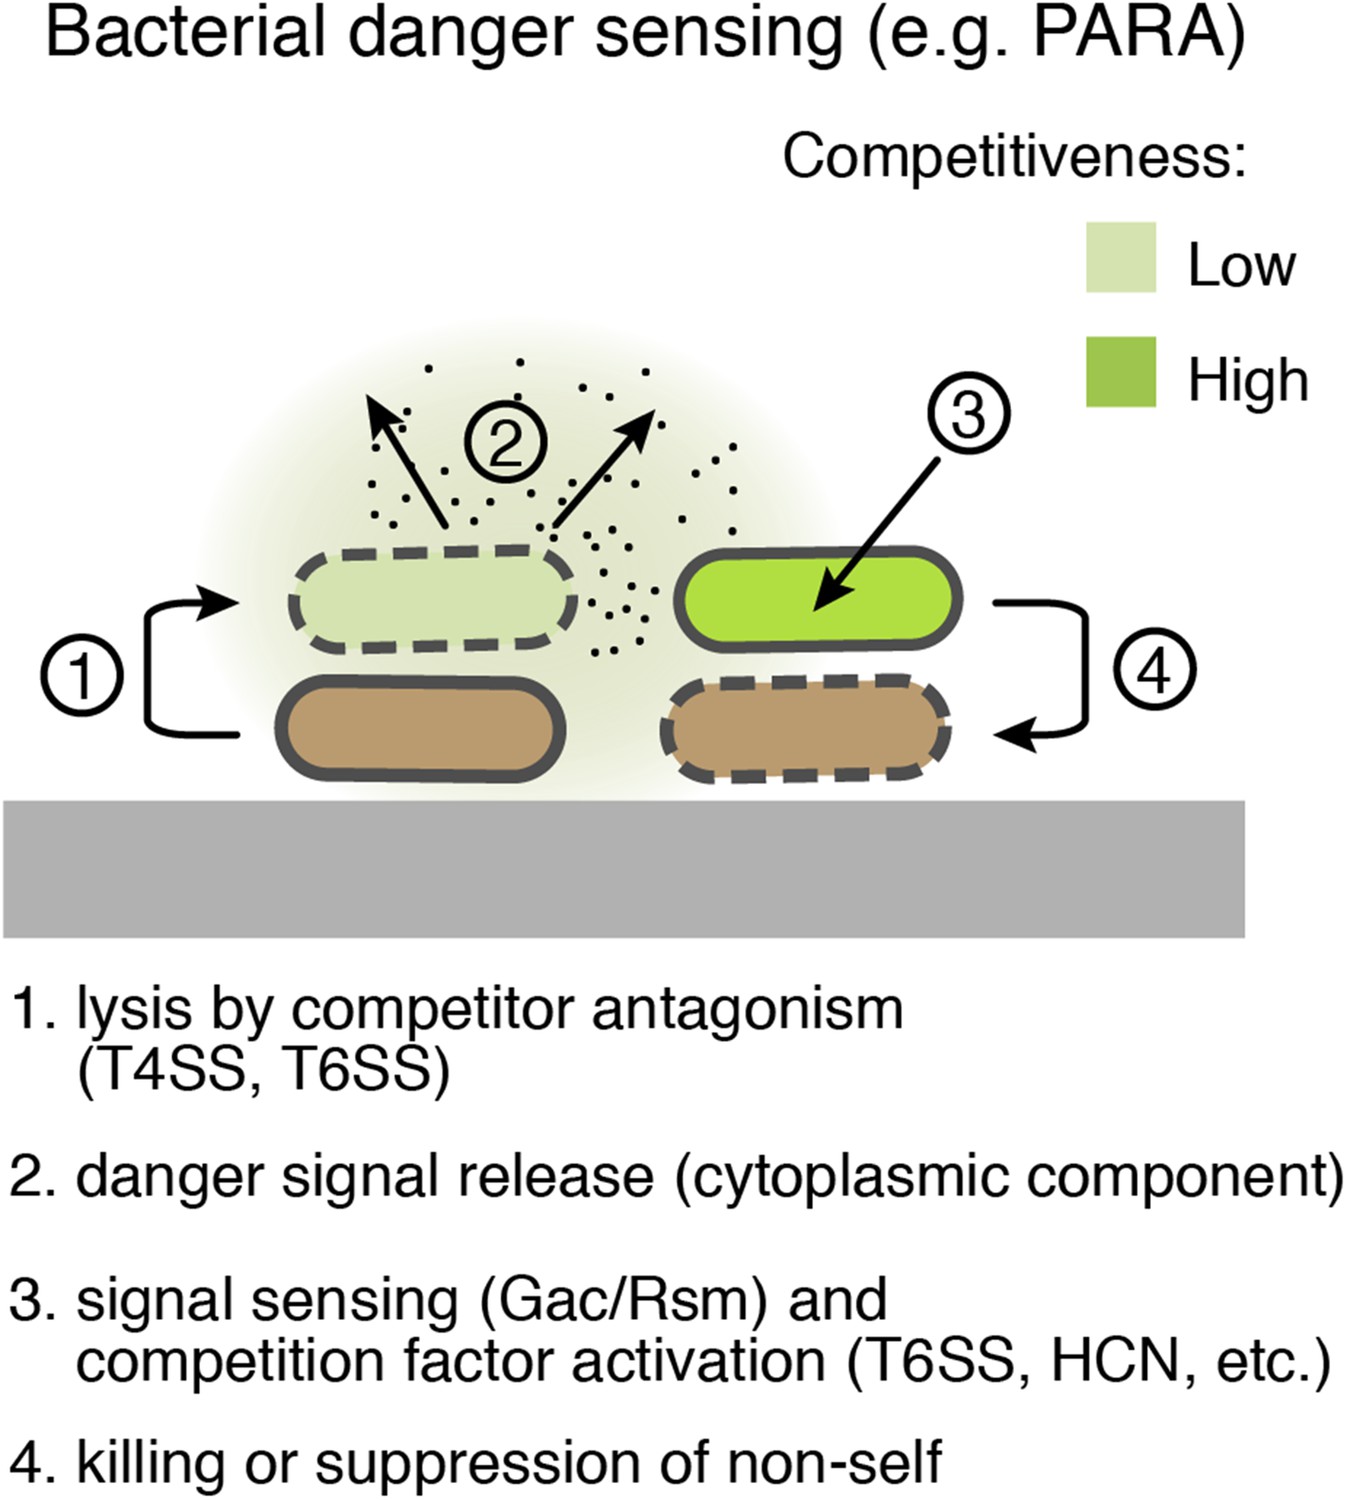
Bacterial danger sensing.
The model depicts antagonism between two species of bacteria, represented in green and brown. The green cells possess a danger sensing pathway; specifics of PARA are provided in parentheses.
Author response image 1

P. aeruginosa mCherry cells 30 minutes after exposure to antibiotic. Cells lose fluorescence upon permeabilization and death.
Videos
Video 1
ClpV1 expression increases in the presence of B. thai bearing an active T6SS.
TLFM sequences of ClpV1-GFP in P. aeruginosa during monoculture or interspecies co-culture. P. aeruginosa clpV1-gfp cells without competitor (left sequence), with B. thai mCherry (middle sequence), or with B. thai ∆tssM-1 mCherry (right sequence) were imaged at 15 min intervals. Overlays of GFP and mCherry channels are displayed. The same thresholds were applied to all background-subtracted GFP channels. See Figure 2B,D for quantification.
Video 2
Fha1 expression increases in the presence of B. thai bearing an active T6SS.
TLFM sequences depicting expression of Fha1-GFP in P. aeruginosa during monoculture or interspecies co-cultures. P. aeruginosa fha1-gfp cells without competitor (left sequence), with B. thai mCherry (middle sequence), or with B. thai ∆tssM-1 mCherry (right sequence) were imaged at 15 min intervals. Overlays of GFP and mCherry channels are displayed. The same thresholds were applied to all background-subtracted GFP channels. Quantification is provided in Figure 2C,E.
Video 3
ClpV1 expression increases in the presence of E. cloacae bearing an active T6SS.
TLFM sequences depicting expression of ClpV1-GFP in P. aeruginosa during monoculture or interspecies co-cultures. P. aeruginosa clpV1-gfp mCherry cells without competitor (left sequence), with E. cloacae (middle sequence), or with E. cloacae ∆tssM (right sequence) were imaged at 15 min intervals. Overlays of GFP and mCherry channels are displayed. P. aeruginosa cells were labeled with constitutive mCherry and therefore the overlay of GFP and mCherry appears yellow. The unlabeled E. cloacae cells are visible (light green) due to autofluorescence in the GFP channel. The same thresholds were applied to all background-subtracted GFP channels. Quantification is provided in Figure 2—figure supplement 3.
Video 4
RsmZ expression is elevated in the presence of B. thai bearing an active T6SS.
TLFM sequences depicting expression of rsmZ in P. aeruginosa during interspecies co-cultures. P. aeruginosa p-rsmZ-gfp mCherry cells with B. thai (left sequence) and B. thai ∆tssM (right sequence) were imaged at 15 min intervals. Overlays of GFP and mCherry channels are displayed. P. aeruginosa cells were labeled with constitutive mCherry, thus cells appear yellow. The unlabeled B. thai cells are visible (light green) due to autofluorescence in the GFP channel. The same thresholds were applied to all background-subtracted GFP channels. See Figure 4D for quantification.
Video 5
Inactivation of the Gac/Rsm pathway results in a loss of interbacterial fitness.
TLFM sequences of the indicated P. aeruginosa mCherry strains cultivated with B. thai GFP. Overlays of GFP and mCherry channels are displayed. Lysing P. aeruginosa cells are outlined in white. Quantification is provided in Figure 5C.
Video 6
Lysis of P. aeruginosa precedes an increase in H1-T6SS expression and B. thai lysis.
TLFM sequences depicting lysis (left) and ClpV1-GFP expression (right) in a P. aeruginosa–B. thai co-culture. A mixture of P. aeruginosa clpV1-GFP mCherry and B. thai CFP were imaged at 5-min intervals. Right panel displays the background-subtracted GFP channel with P. aeruginosa cells outlined in red and B. thai outlined in blue. Left panel displays an overlay of mCherry (P. aeruginosa) and CFP (B. thai) channels; lysing P. aeruginosa (white outlines) and lysing B. thai (magenta) are indicated. See Figure 7B for quantification.
Tables
Table 1
Strains used in this study
| Organism | Genotype | Reference |
|---|---|---|
| P. aeruginosa PAO1 | Type strain | (Stover et al., 2000) |
| attB::lacZ | (Mougous et al., 2006a) | |
| ∆tssM1 attB::lacZ | This study | |
| ∆retS attB::lacZ | (Mougous et al., 2006a) | |
| ∆retS ∆tssM1 attB::lacZ | This study | |
| ∆tse1 ∆tsi1 ∆tse2 ∆tsi2 ∆tse3 ∆tsi3 ∆tse4 ∆tsi4 | This study | |
| ∆retS ∆tse1 ∆tsi1 ∆tse2 ∆tsi2 ∆tse3 ∆tsi3 ∆tse4 ∆tsi4 | This study | |
| clpV1-gfp | (Mougous et al., 2006a) | |
| fha1-sfgfp | This study | |
| clpV1-gfp attTn7::mCherry | This study | |
| ∆pppA clpV1-gfp | (Silverman et al., 2011) | |
| ∆TPP ∆tagF clpV1-gfp | This study | |
| ∆pppA | (Mougous et al., 2007) | |
| ∆TPP ∆tagF | (Silverman et al., 2011) | |
| ∆tssM1 | (Silverman et al., 2011) | |
| attTn7::PA0082-lacZ10-Gm | (Brencic and Lory, 2009) | |
| attB::PA0082-lacZ-tet | (Brencic and Lory, 2009) | |
| p-rsmZ-gfp attTn7::Gm-mCherry | This study | |
| ∆retS clpV1-gfp | (LeRoux et al., 2012) | |
| ∆ladS clpV1-gfp | This study | |
| ∆gacS clpV1-gfp attTn7::Gm-mCherry | This study | |
| p-magA-sfgfp | This study | |
| retSW90A | This study | |
| ∆gacS | This study | |
| attTn7::Gm-gfp | (LeRoux et al., 2012) | |
| attTn7:: Gm-mCherry | (LeRoux et al., 2012) | |
| ∆tssM1 attTn7::Gm-mCherry | This study | |
| ∆gacS attTn7:: Gm-mCherry | This study | |
| B. thailandensis E264 | Type strain | (Yu et al., 2006) |
| ∆tssM-1 | This study | |
| attTn7::Tp-PS12-mCherry | (LeRoux et al., 2012) | |
| ∆tssM-1 attTn7::Tp-PS12-mCherry | This study | |
| attTn7::Tp-PS12-GFP | (LeRoux et al., 2012) | |
| ∆tssM-1 attTn7::Tp-PS12-GFP | This study | |
| attTn7::Tp-CFP | This study | |
| E. cloacae ATCC 13047 | Type strain | (Ren et al., 2010) |
| ∆tssM | (Whitney et al., 2014) | |
| E. coli XK1502 | Type strain | (Panicker and Minkley, 1985) |
| RP4 | (Pansegrau et al., 1994) | |
| RP4 ∆traG | This study | |
| RP4 ∆traG pPSV39 | This study | |
| RP4 ∆traG pPSV39::traG | This study |
Table 2
Plasmids used in this study
| Plasmid | Utility | Reference |
|---|---|---|
| P. aeruginosa PAO1 | ||
| miniCtx::lacZ | constitutive LacZ expression | (Vance et al., 2005) |
| pUC18T-miniTn7T-Gm-gfp | constitutive GFP expression | (Choi et al., 2005) |
| pUC18T-miniTn7T-Gm-mCherry | constitutive mCherry expression | (LeRoux et al., 2012) |
| pEXG2_∆PA4856 | retS deletion allele | (Mougous et al., 2006a) |
| pEXG2_∆PA0077 | tssM1 deletion allele | (Mougous et al., 2006a) |
| pEXG2_∆PA1844-5 | tse1 tsi1 deletion allele | (Russell et al., 2011) |
| pEXG2_∆PA2702-3 | tse2 tsi2 deletion allele | (Hood et al., 2010) |
| pEXG2_∆PA3484-5 | tse3 tsi3 deletion allele | (Russell et al., 2011) |
| pEXG2_∆PA2774-5 | tse4 tsi4 deletion allele | (Whitney et al., 2014) |
| pEXG2_PA0090-gfp | clpV1 functional translational GFP fusion allele | (Mougous et al., 2006a) |
| pEXG2_PA0081-sfgfp | fha1 functional translational GFP fusion allele | This study |
| pEXG2_∆PA0075 | pppA deletion allele | (Mougous et al., 2007) |
| pEXG2_∆PA0070-0076 | tagQRST ppkA pppA tagF deletion allele | (Silverman et al., 2011) |
| attTn7::PA0082-lacZ10-Gm | tssA1 translational lacZ reporter | (Brencic and Lory, 2009) |
| attB::PA0082-lacZ-tet | tssA1 transcriptional lacZ reporter | (Brencic and Lory, 2009) |
| miniCtx_p-PA3621.1-gfp | rsmZ transcriptional GFP reporter | This study |
| pEXG2_∆PA0928 | gacS deletion allele | This study |
| pEXG2_∆PA3974 | ladS deletion allele | This study |
| pEXG2_p-PA4492-gfp | magA translational GFP fusion allele | This study |
| pEXG2_PA4856W90A | retSW90A allele | This study |
| B. thailandensis E264 | ||
|---|---|---|
| pJRC115_∆BTH_I2954 | tssM-1 deletion allele | This study |
| pUC18T-miniTn7T-Tp-PS12-gfp | constitutive GFP expression | (Schwarz et al., 2010) |
| pUC18T-miniTn7T-Tp-PS12-mCherry | constitutive mCherry expression | (LeRoux et al., 2012) |
| pUC18T-miniTn7T-Tp-ecfp | Constitutive CFP expression | (Choi et al., 2005) |
| E. coli XK1502 | ||
|---|---|---|
| RP4 | Naturally occurring plasmid encoding IncP-type T4SS | (Pansegrau et al., 1994) |
| E. coli RP4 ∆traG | RP4 bearing traG deletion | This study |
| pPSV39 | Expression vector | (Silverman et al., 2013) |
| pPSV39-traG | IPTG-inducible TraG expression for complementation | This study |
Download links
A two-part list of links to download the article, or parts of the article, in various formats.
Downloads (link to download the article as PDF)
Open citations (links to open the citations from this article in various online reference manager services)
Cite this article (links to download the citations from this article in formats compatible with various reference manager tools)
Kin cell lysis is a danger signal that activates antibacterial pathways of Pseudomonas aeruginosa
eLife 4:e05701.
https://doi.org/10.7554/eLife.05701


