CaRuby-Nano: a novel high affinity calcium probe for dual color imaging
- UPMC Université Paris 06, Ecole Normale Supérieure, France
- University College London, United Kingdom
- Institut de Biologie de l'École Normale Supérieure, France
- Institut National de la Santé et de la Recherche Médicale, France
- Université Paris Descartes, France
Figures
Figure 1 with 5 supplements
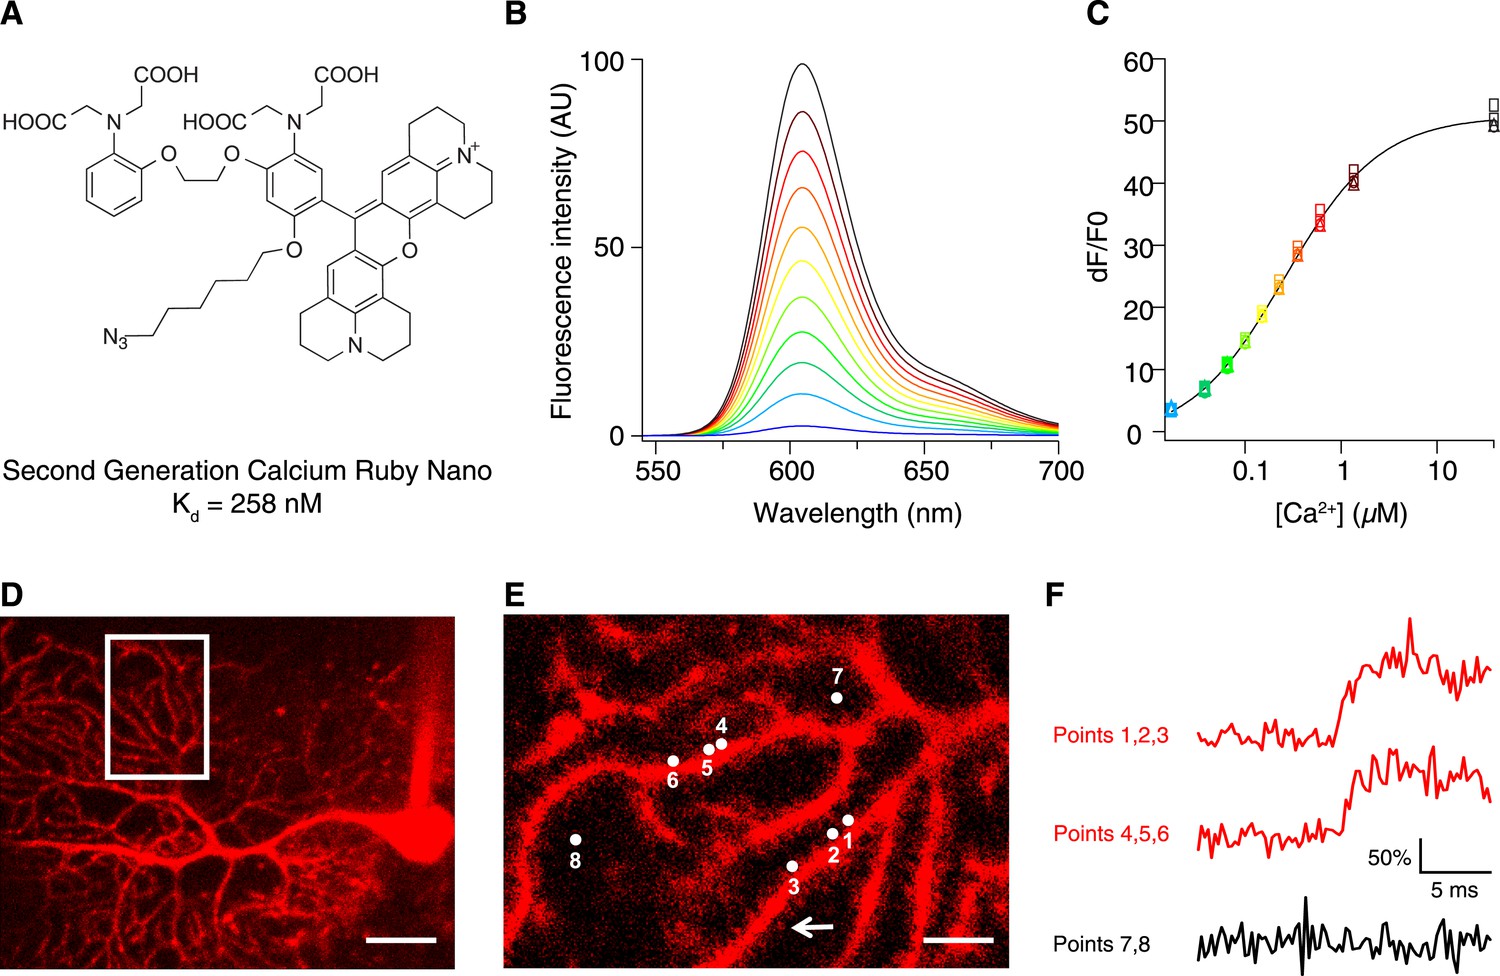
Chemical and photophysical properties of CaRuby-Nano.
(A) Structure of CaRuby-Nano. Note the oxygen substituent and the positioning of the fluorophore-BAPTA bond. (B) [Ca2+]-dependent change in CaRuby-Nano fluorescence ([Ca2+]free: 0 nM, 17 nM, 38 nM, 65 nM, 100 nM, 150 nM, 225 nM, 351 nM, 602 nM, 1.35 µM, 39 µM). (C) The titration curve corresponding to the spectra in (B) using the same color code. (D–F): Climbing fiber evoked dendritic calcium signals in Purkinje cells in vitro. (D) Purkinje cell filled with 300 µM CaRuby-Nano dextran, with region of interest indicated by the white rectangle (scale bar = 20 µm). (E) Region of interest with points of interest indicated. Note that many spines can be readily distinguished (white arrow). Points 1–3 and 4–6 are on different spiny branchlets while points 7 and 8 are background (scale bar = 5 µm). (F) Ca2+ transients following climbing fiber activation recorded at 2.8 kHz (traces averaged over 26 trials and then averaged over the indicated spine numbers).
Figure 1—figure supplement 1
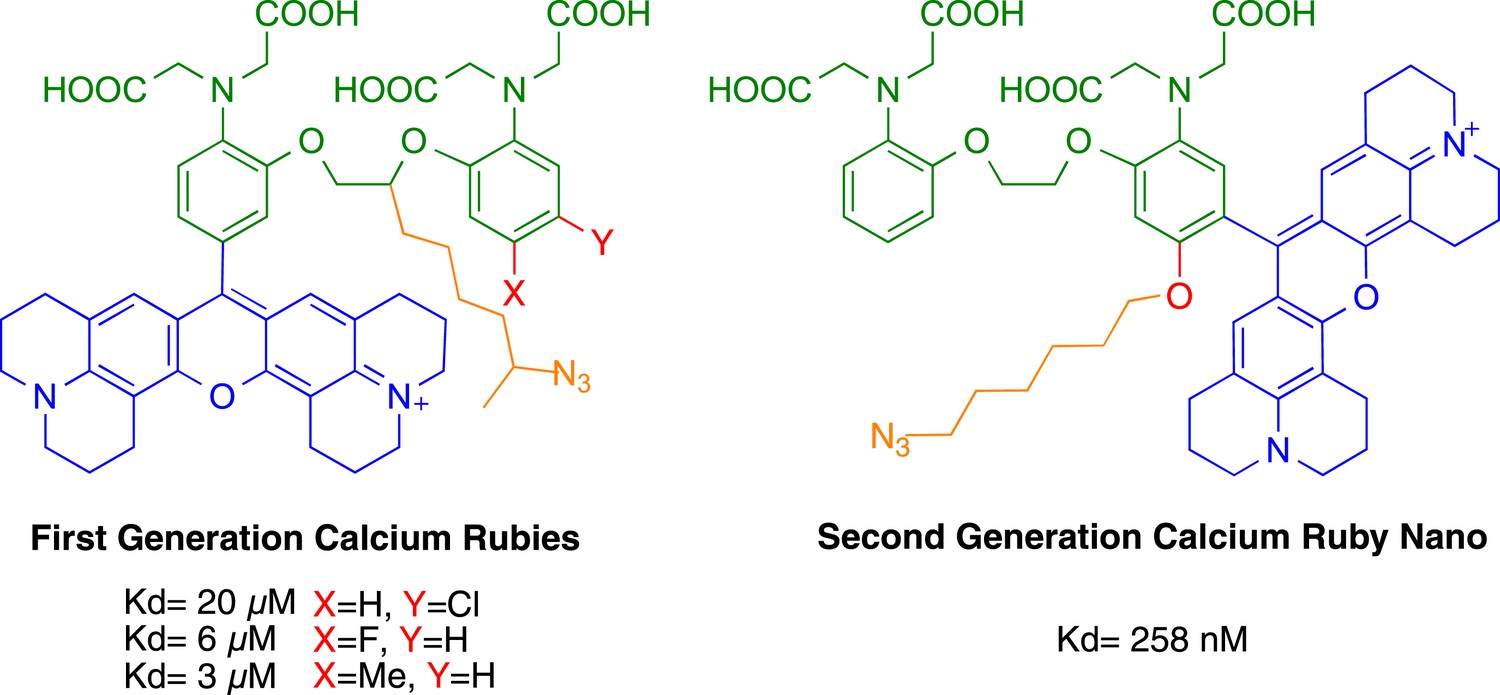
Comparison of CaRuby structures.
https://doi.org/10.7554/eLife.05808.004
Figure 1—figure supplement 2
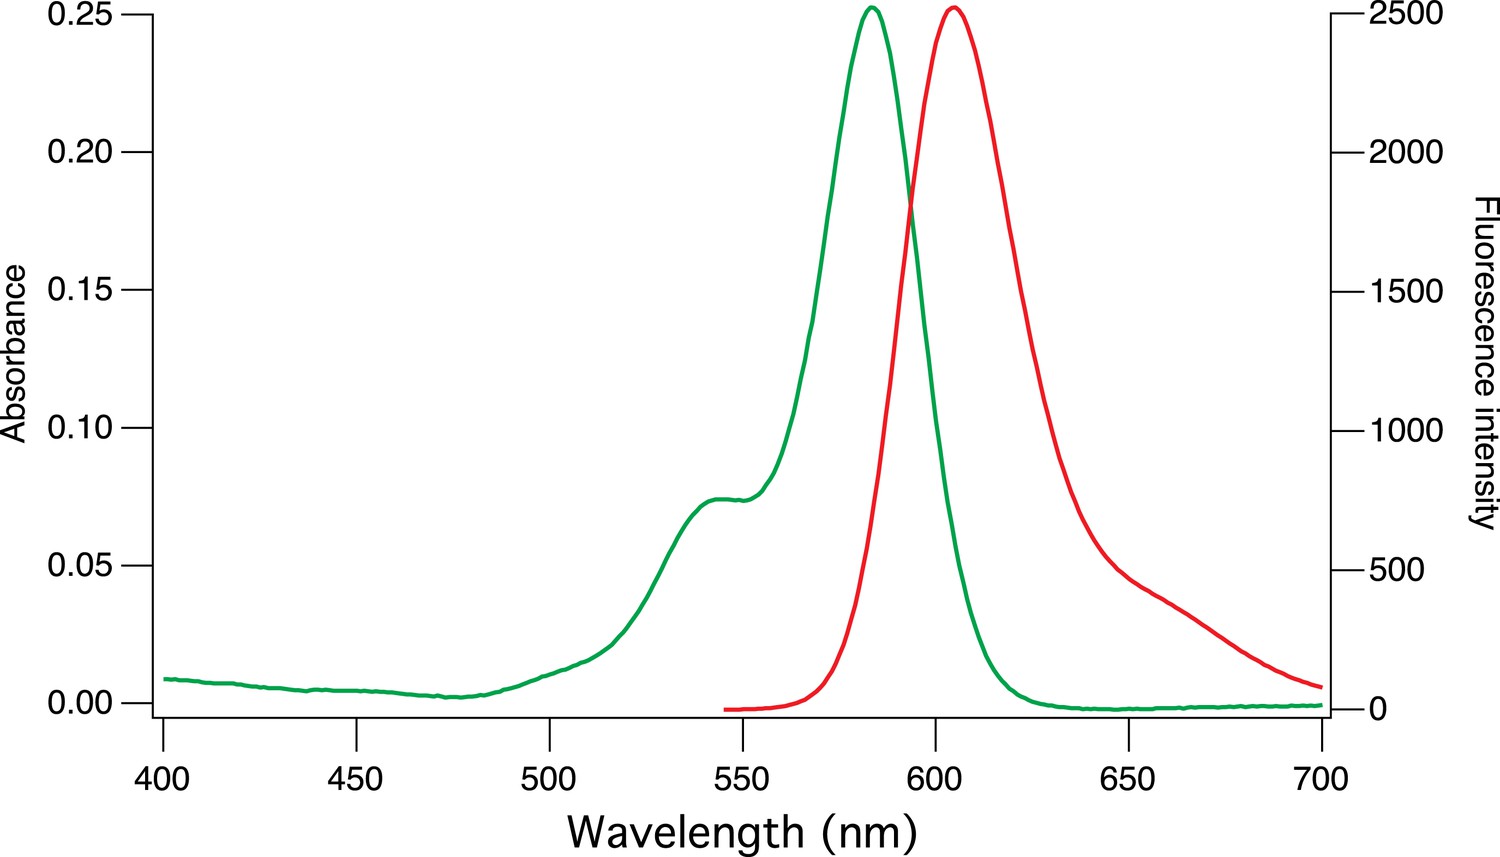
Absorption and emission spectra of CaRu-Nano.
https://doi.org/10.7554/eLife.05808.005
Figure 1—figure supplement 3
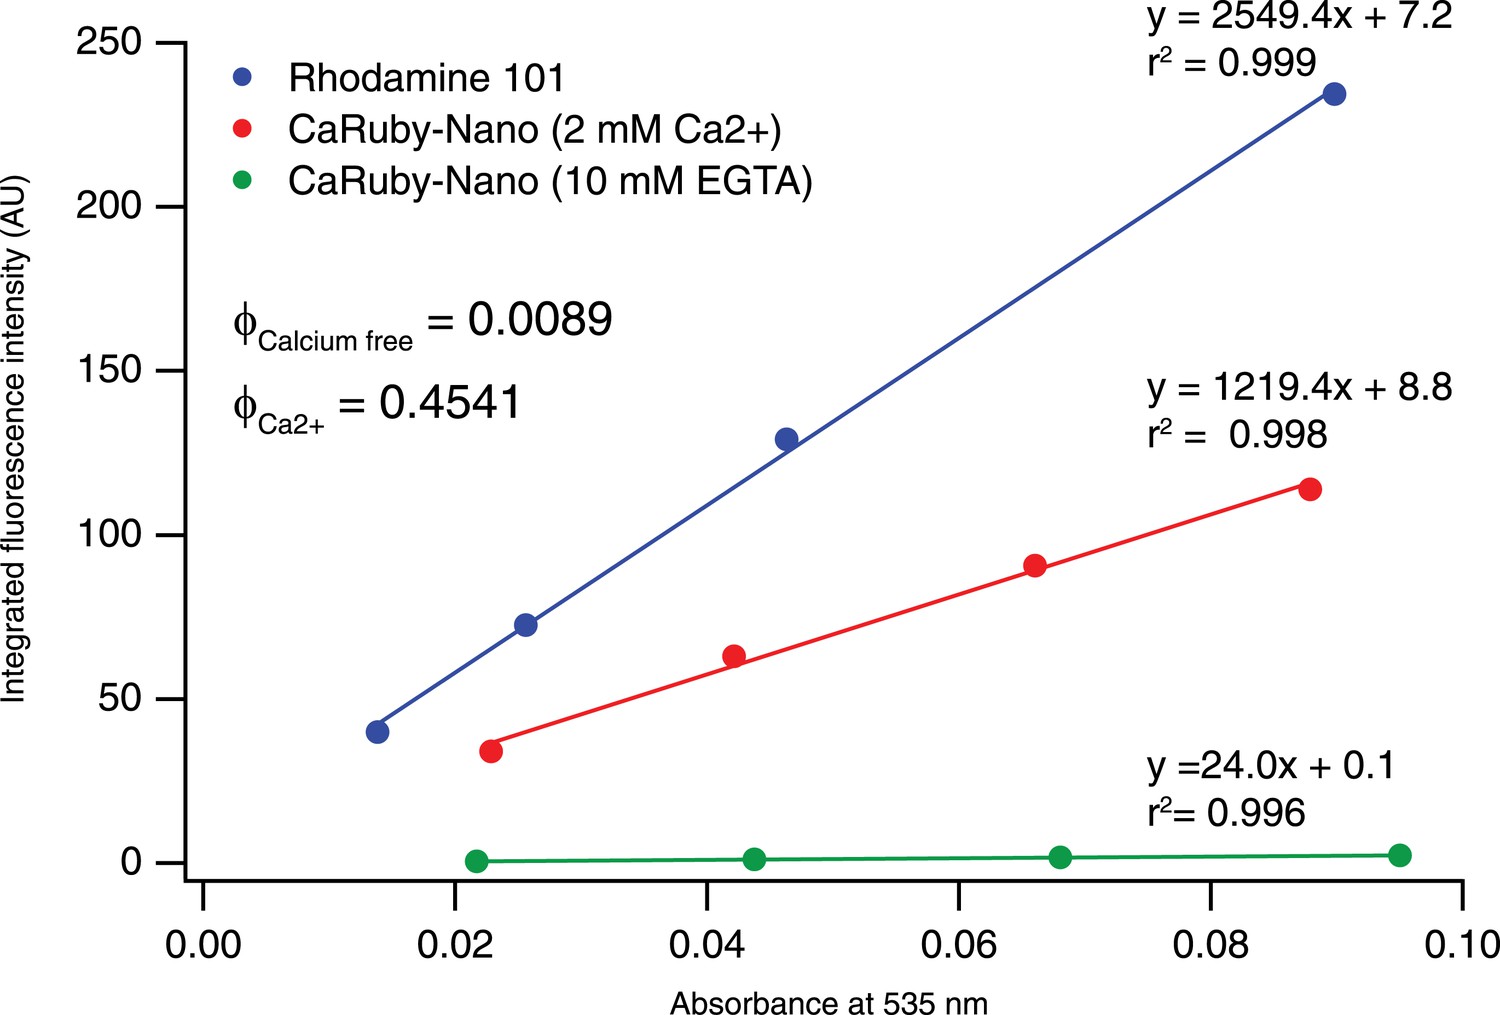
Determination of CaRuby-Nano fluorescence quantum yield.
https://doi.org/10.7554/eLife.05808.006
Figure 1—figure supplement 4

Two-photon excitation of CaRuby-Nano.
https://doi.org/10.7554/eLife.05808.007
Figure 1—figure supplement 5
Affinity of CaRuby-Nano and CaRuby-Nano 6 kD dextran.
https://doi.org/10.7554/eLife.05808.008
Figure 2
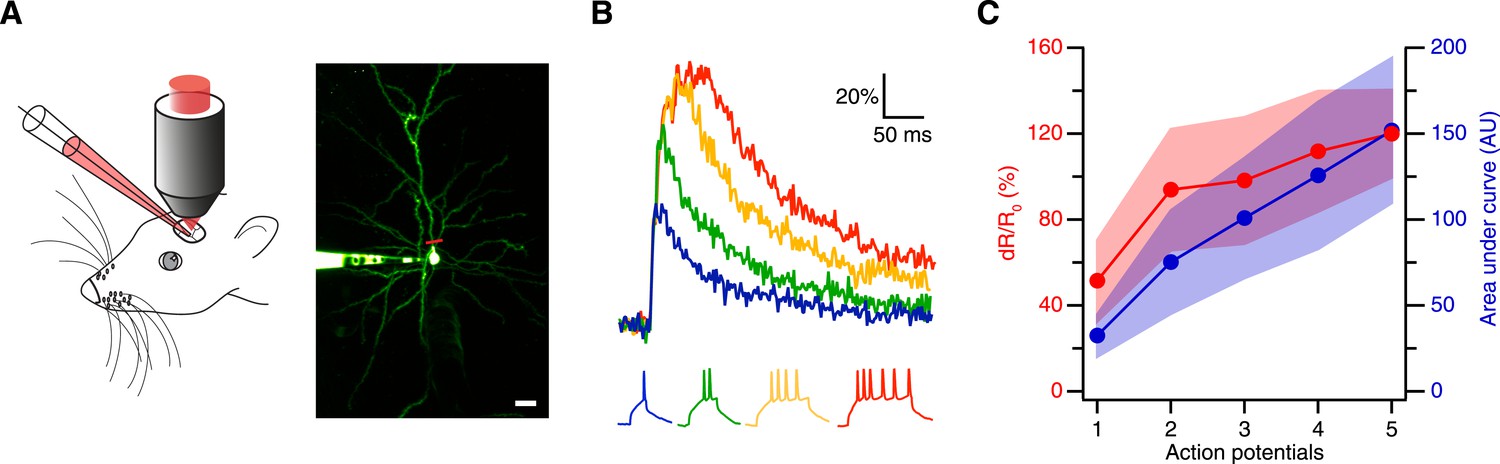
Spike evoked transients in layer 2/3 pyramidal neurons in vivo.
(A) Measurement configuration (left) and maximum intensity projection of pyramidal neuron filled with 100 µM Alexa Fluor 488 and 200 µM CaRuby-Nano dextran (right, at rest the fluorescence is dominated by the green dye). The red line indicates region imaged in line scan. Scale bar: 20 µm. (B) Single trial calcium signals evoked by increasing number of spikes. The corresponding membrane voltage traces are shown below. Fluorescence traces are aligned to spike onset and color-coded to match the number of APs. (C) The peak amplitudes (red) and the area under the curve (blue) of the fluorescence trace were plotted against the number of action potentials. While the area increases linearly, the peak amplitude saturates. The shaded regions indicate the corresponding standard deviations.
Figure 3
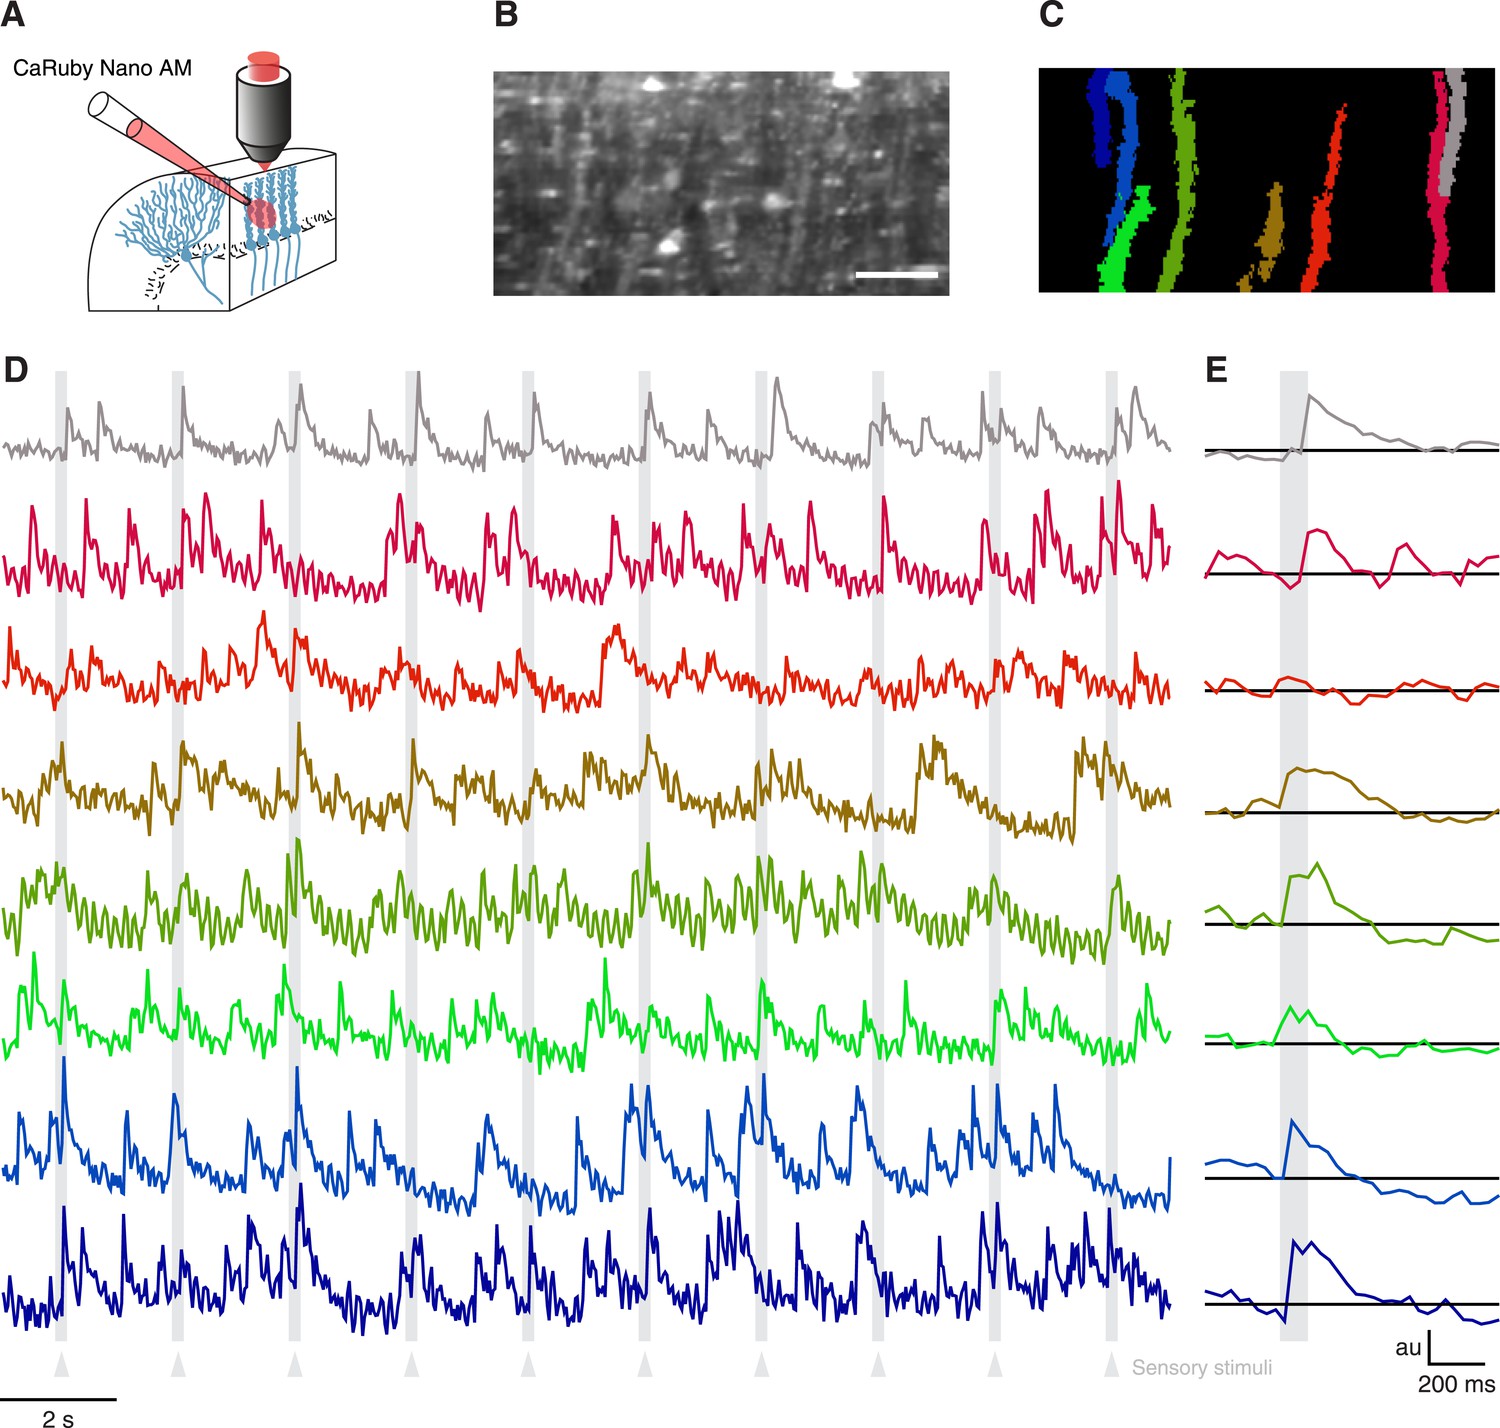
Imaging cerebellar Purkinje cells in vivo using bulk loading of CaRuby-Nano AM.
(A) Configuration of AM-ester injection and imaging. (B) Resulting staining of tissue 60 min after injection of indicator. Purkinje cells can be seen as vertical stripes with occasional brighter spots (corresponding to dendrites; scale bar = 20 µm). (C) Active Purkinje cell dendrites identified using a spatial PCA/ICA algorithm (Ozden et al., 2009). (D) Fluorescence traces from the identified dendrites, using the same color code as in (C). The timing of the sensory stimulus (foot shock) is indicated by the underlying grey bars. (E) Stimulus triggered averages of 20 stimulus presentations. Note that all cells except for the third (orange) show a stimulus-locked response.
Figure 4
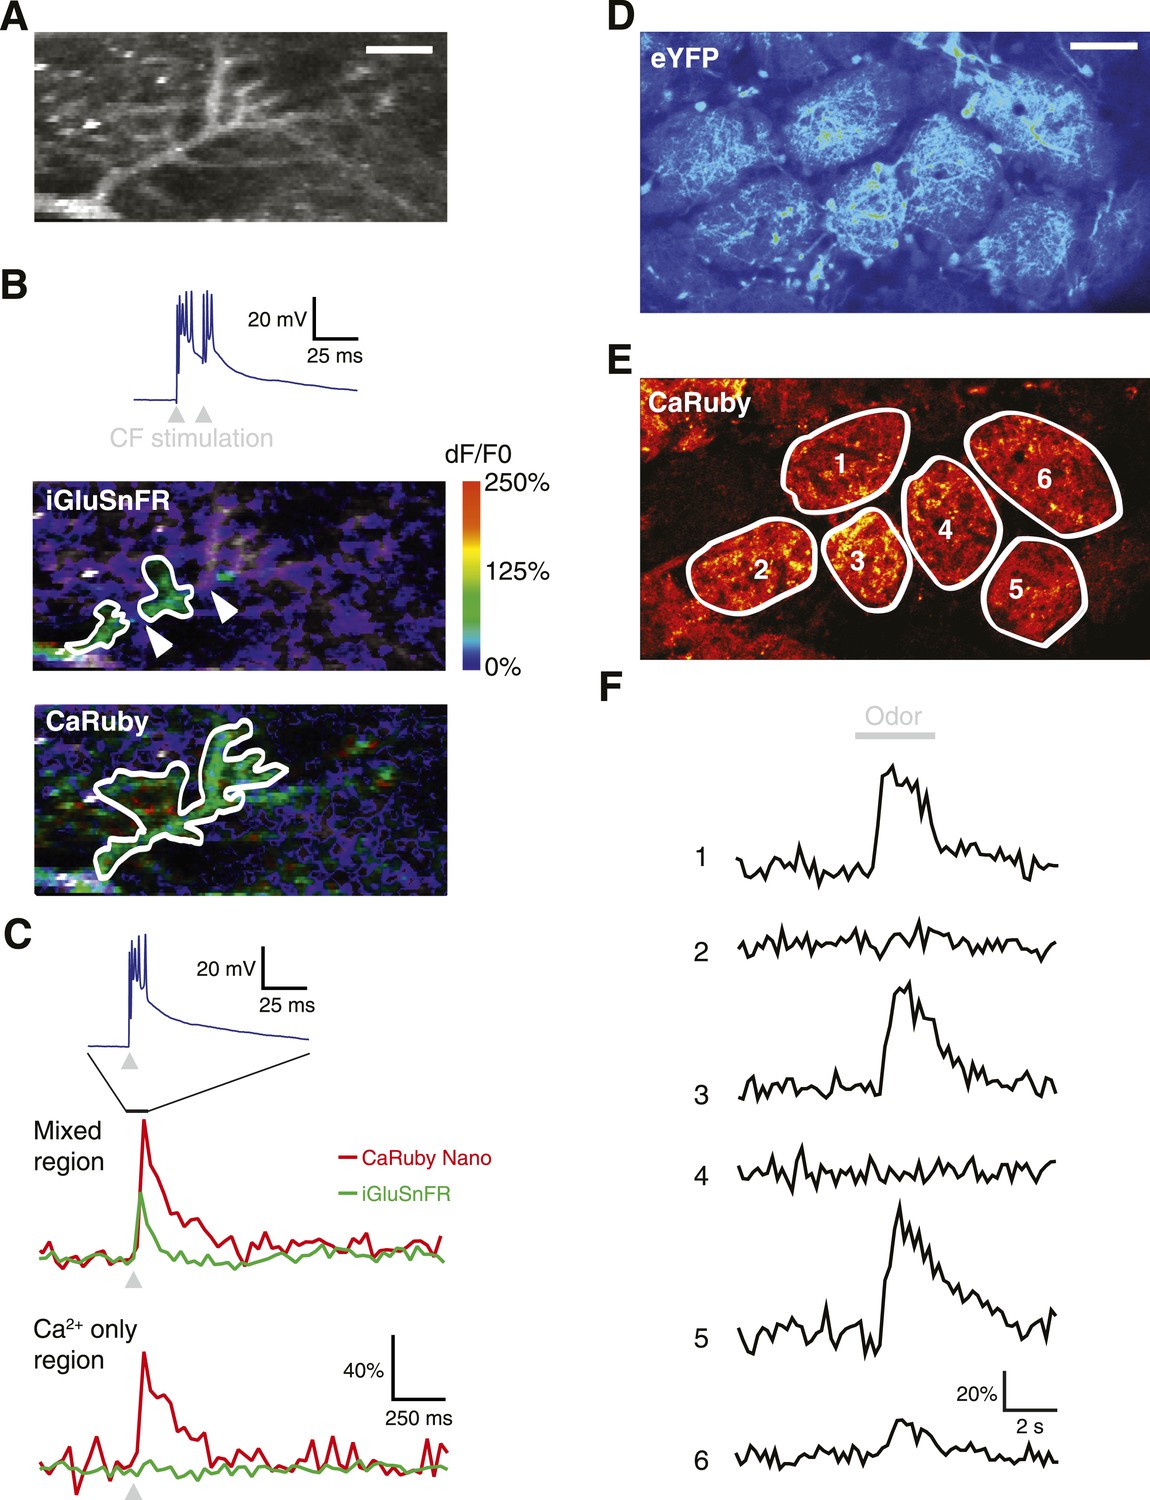
Dual color functional imaging in vitro and in vivo.
(A–C) Combined imaging of [glutamate] and [Ca2+] in vitro (A) A Purkinje cell expressing iGluSnFR was filled with 200 µM CaRuby-Nano dextran. The image shows the basal fluorescence of CaRuby-Nano (scale bar = 5 µm). (B) Double pulse stimulation of the climbing fiber triggers spatially distinct patterns of glutamate release and Ca2+ influx (maximum dF/F0 images; the inset at the top shows the two evoked complex spikes). Note the breaks between regions showing iGluSnFR activation (indicated by white arrows) (C) Fluorescence traces for CaRuby-Nano (red) and iGluSnFR (green) following single pulse climbing fiber stimulation (top inset). Traces were extracted from the corresponding regions outlined in white in (B). Note the absence of a fluorescent transient for iGluSnFR in the ‘Ca2+ only’ region. (D–F) Odor-evoked calcium responses in olfactory bulb glomeruli in vivo. (D) Juxtaglomerular neurons and mitral cell dendritic tufts expressing YFP demarcate glomeruli in a Kv3.1-eYFP mouse (Metzger et al, 2002). (E) Olfactory sensory neuron glutamatergic terminals, labeled with CaRuby-Nano dextran, clearly filled the inner boundaries of most glomeruli. (F) A 3 s application of 30% isoamyl acetate reliably triggered presynaptic calcium responses in several glomeruli.
Figure 5
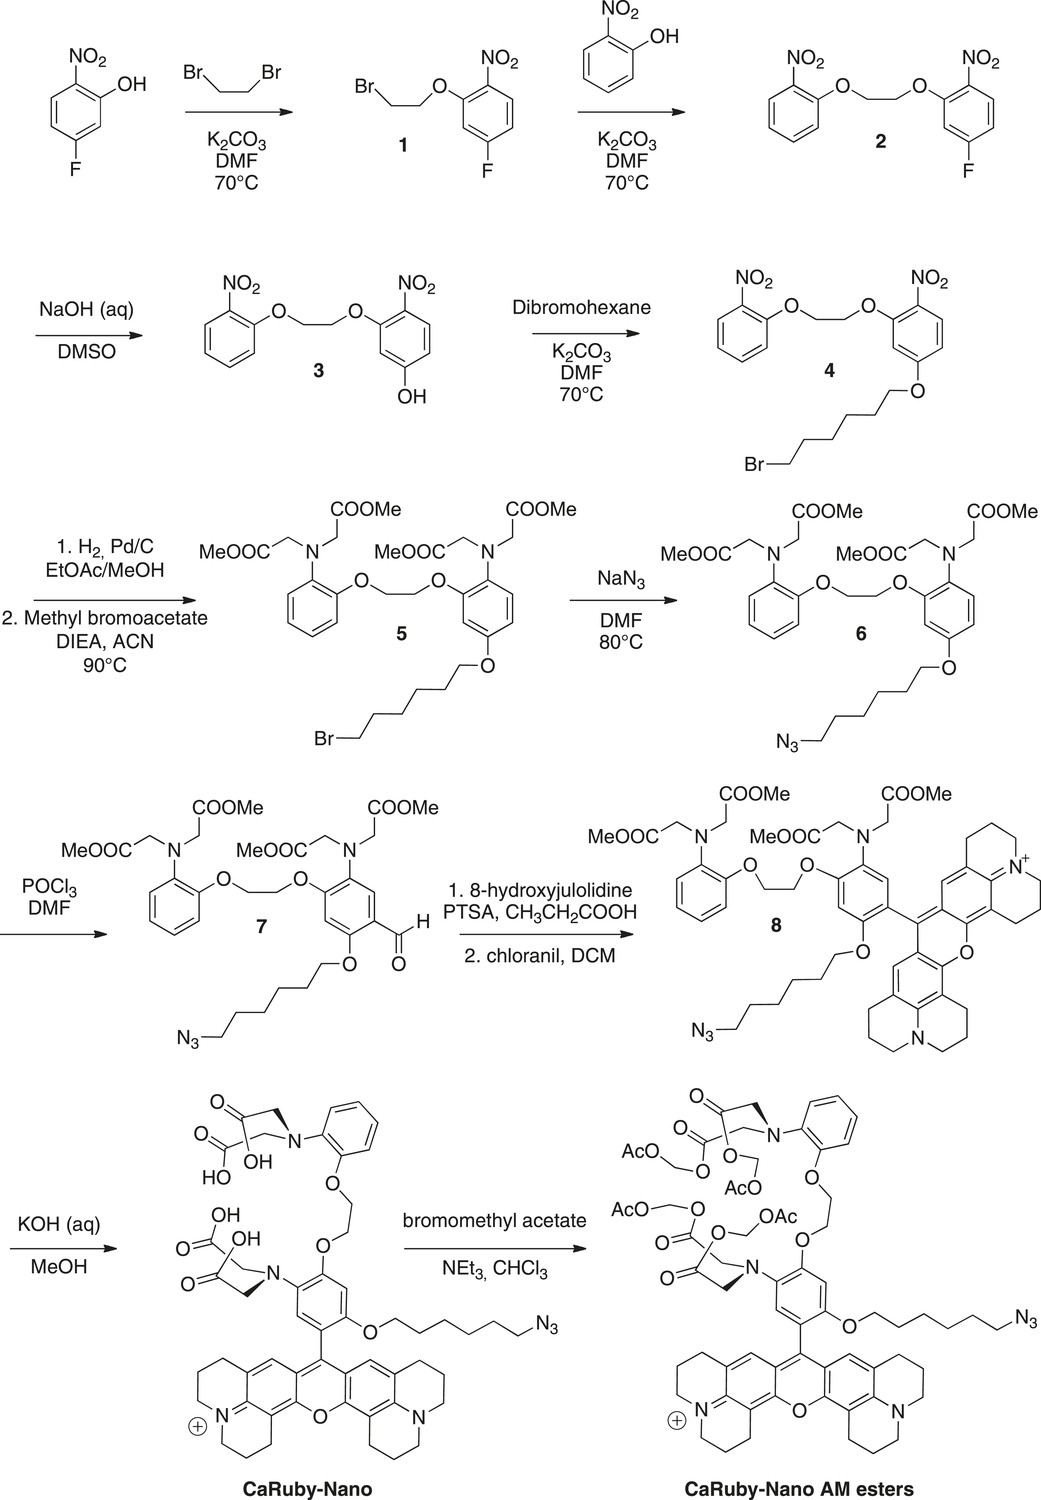
Synthesis of CaRuby-Nano and CaRuby-Nano AM ester.
https://doi.org/10.7554/eLife.05808.012
Appendix 1 Figure 1
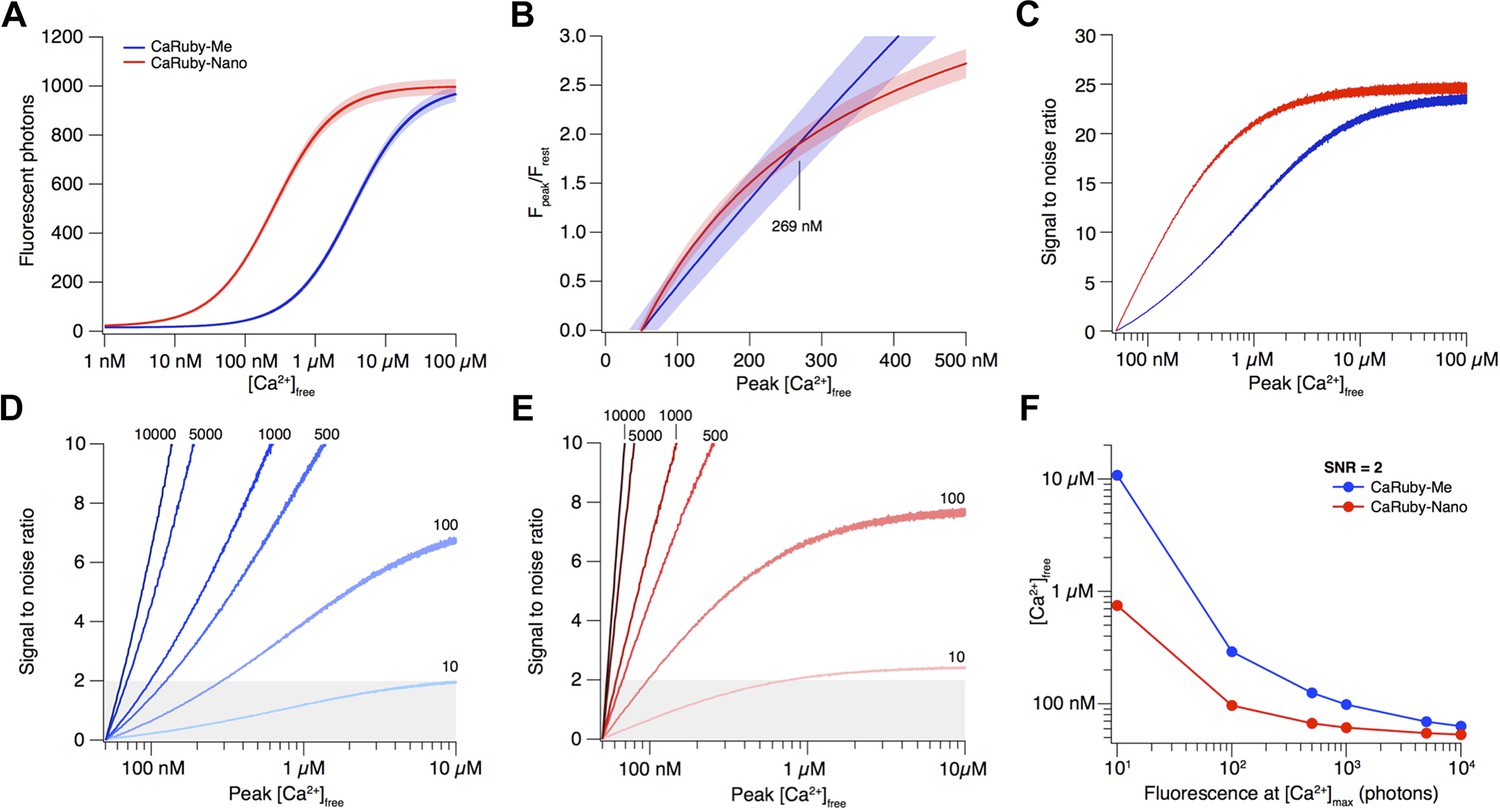
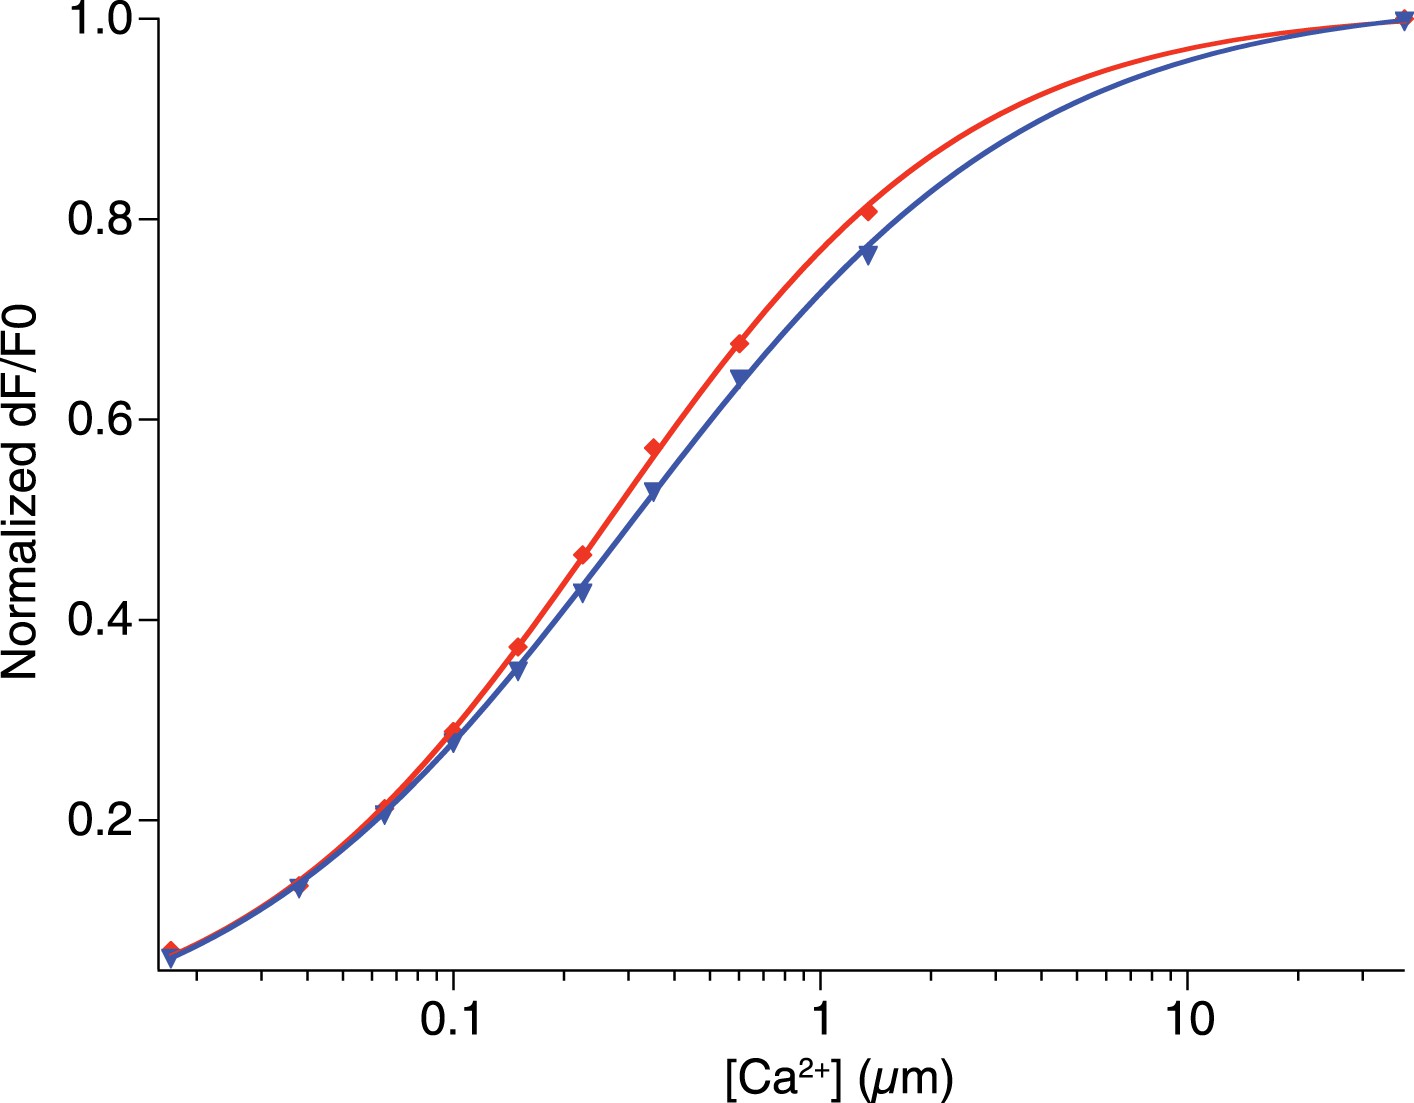
Signal amplitude and SNR depend on indicator KD.
(A) [Ca2+]-dependent fluorescence for CaRuby-Me (blue) and CaRuby-Nano (red). The theoretical noise levels (1 SD) are indicated by the translucent areas. (B) [Ca2+]-dependent dF/F0 for both indicators (same colors as in a) with the uncertainties indicated by the areas surrounding the curves. (C) [Ca2+]-dependent SNR (same color code as in A). Note that the noise on the curves is a consequence of the Monte-Carlo simulations. (D) SNR curves for CaRuby-Me at different maximum fluorescence levels (maximal photon numbers indicated next to the corresponding curves). The grey area marks the area with SNR < 2. (E) SNR curves for CaRuby-Nano at the same brightness levels as in d. (F) [Ca2+]peak required to reach SNR = 2 for different maximal brightness levels.
Additional files
-
Supplementary file 1
Spectra (NMR and mass).
- https://doi.org/10.7554/eLife.05808.013
-
Supplementary file 2
HMBC data.
- https://doi.org/10.7554/eLife.05808.014
Download links
A two-part list of links to download the article, or parts of the article, in various formats.
Downloads (link to download the article as PDF)
Open citations (links to open the citations from this article in various online reference manager services)
Cite this article (links to download the citations from this article in formats compatible with various reference manager tools)
CaRuby-Nano: a novel high affinity calcium probe for dual color imaging
eLife 4:e05808.
https://doi.org/10.7554/eLife.05808


