The mammalian lectin galectin-8 induces RANKL expression, osteoclastogenesis, and bone mass reduction in mice
- Weizmann Institute of Science, Israel
- The Hebrew University of Jerusalem, Israel
Figures
Figure 1
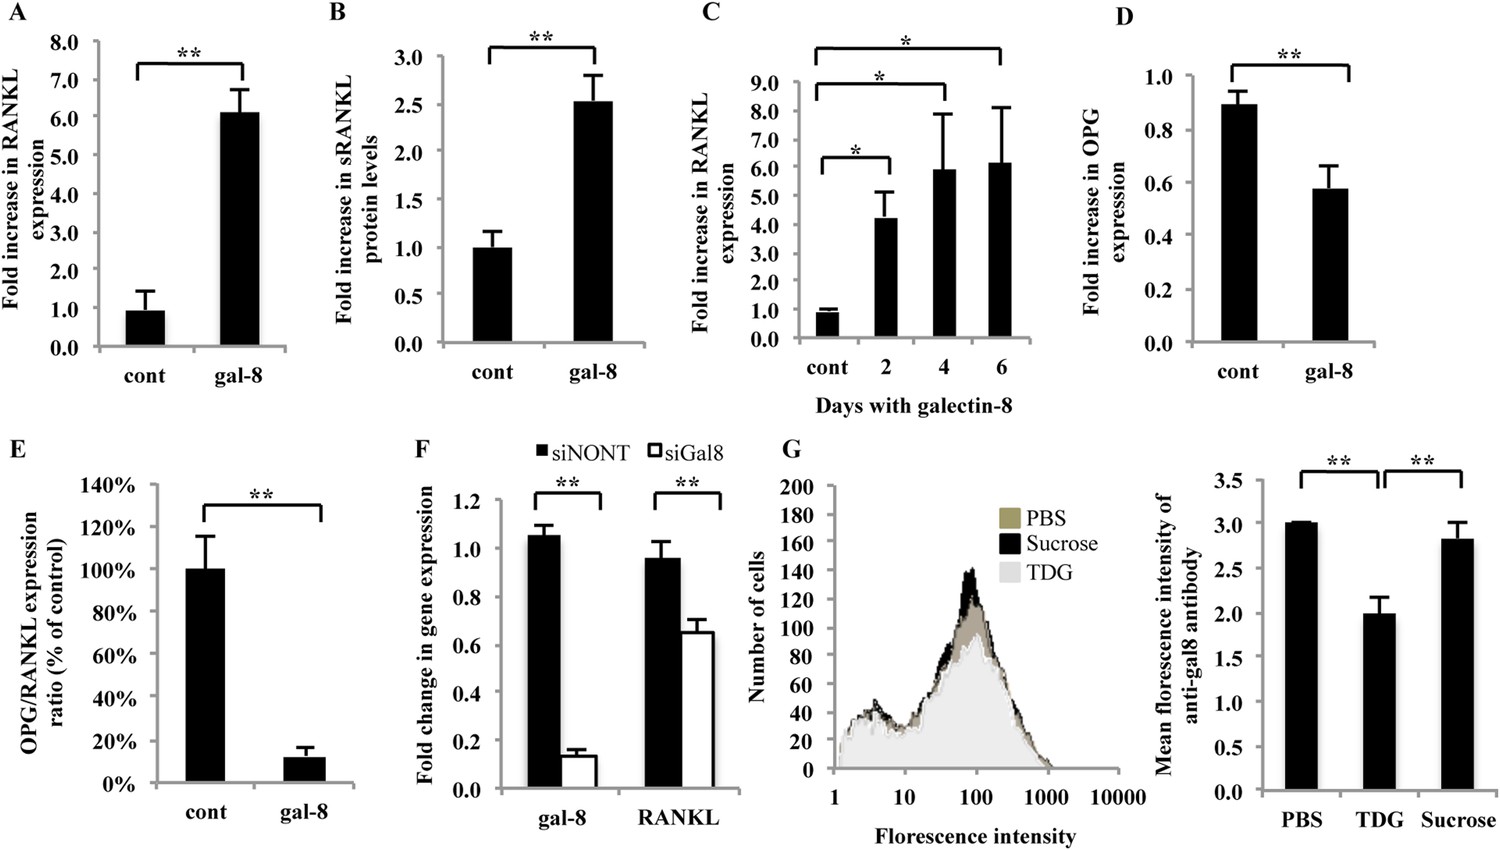
Effects of galectin-8 on RANKL and OPG expression in osteoblasts.
Osteoblasts derived from calvaria of newborn mice were treated with 50 nM of galectin-8 for 4 hr (A, D); 24 hr (B); or for the indicated times (C). After treatments, RNA was extracted and qRT-PCR was conducted in order to quantify changes in expression of RANKL (A, C) or osteoprotegerin (OPG) (D). Actin served as a control for normalization purposes. The levels of soluble RANKL in the medium were quantified by ELISA (B). (E) OPG/RANKL expression ratio was calculated from the results of A and D. (F) Osteoblasts from the calvaria of newborn mice were grown in 12-well plates (5 × 10⁴ cells per well). After 24 hr, cells were transfected with siRNA for galectin-8. Non-targeting siRNA (siNONT) served as the control. 96 hr thereafter, cells were harvested, RNA was extracted, and qRT-PCR was conducted to quantify changes in mRNA levels of galectin-8 and RANKL. The content of actin mRNA served as a control for normalization purposes. (G) Bone marrow cells were extracted and analyzed by flow cytometry for the surface expression of galectin-8. Cells were treated with TDG or sucrose (10 mM in PBS) or just PBS before fixation. Results shown are of a representative histogram of cell number vs florescence intensity of the secondary antibody (left) and quantitation of the averages florescence intensity of the secondary antibody in two experiments carried out in duplicates (right). Results are mean values ± SEM of five (F) or six independent experiments (A, D, E) or of two independent experiments carried out in duplicates (C, G) or triplicates (B) *p < 0.05, **p < 0.01.
Figure 2
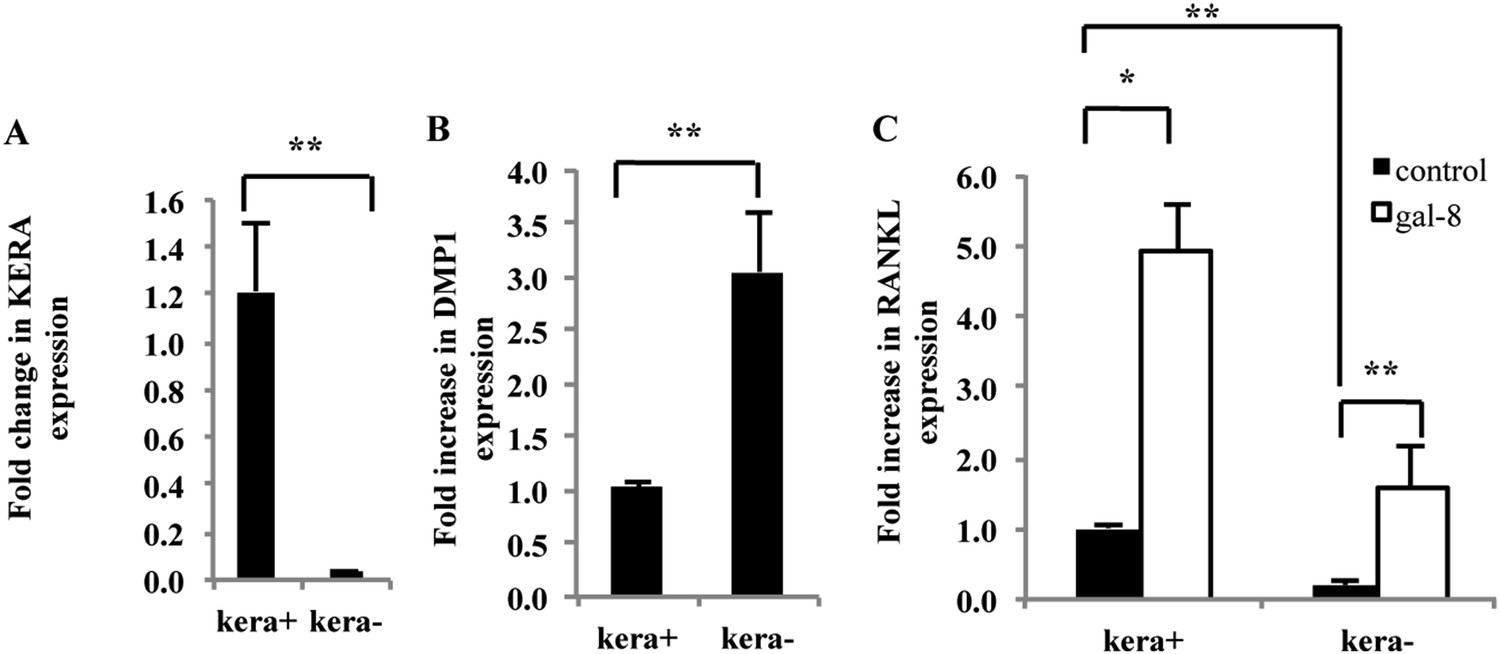
Effects of galectin-8 on osteoblast fractions isolated from calvaria of newborn mice.
Osteoblasts were extracted from calvaria of newborn mice by five sequential incubations with collagenase-dispase solution. Osteoblasts derived from the different incubations were seeded for 24 hr. KERA (A) and DMP1 (B) expression, using qRT-PCR, were examined in fractions −2 and −5 that showed the highest and the lowest amount of KERA (designated kera+ and kera−), respectively. (C) Galectin-8 (50 nM) was added to osteoblasts from these cultures for 24 hr; RANKL expression was determined by qRT-PCR. Actin served as a control for normalization purposes. Results are mean values ± SEM of n = 8 (A), n = 6 (B), n = 7 (C). *p < 0.05, **p < 0.01.
Figure 3
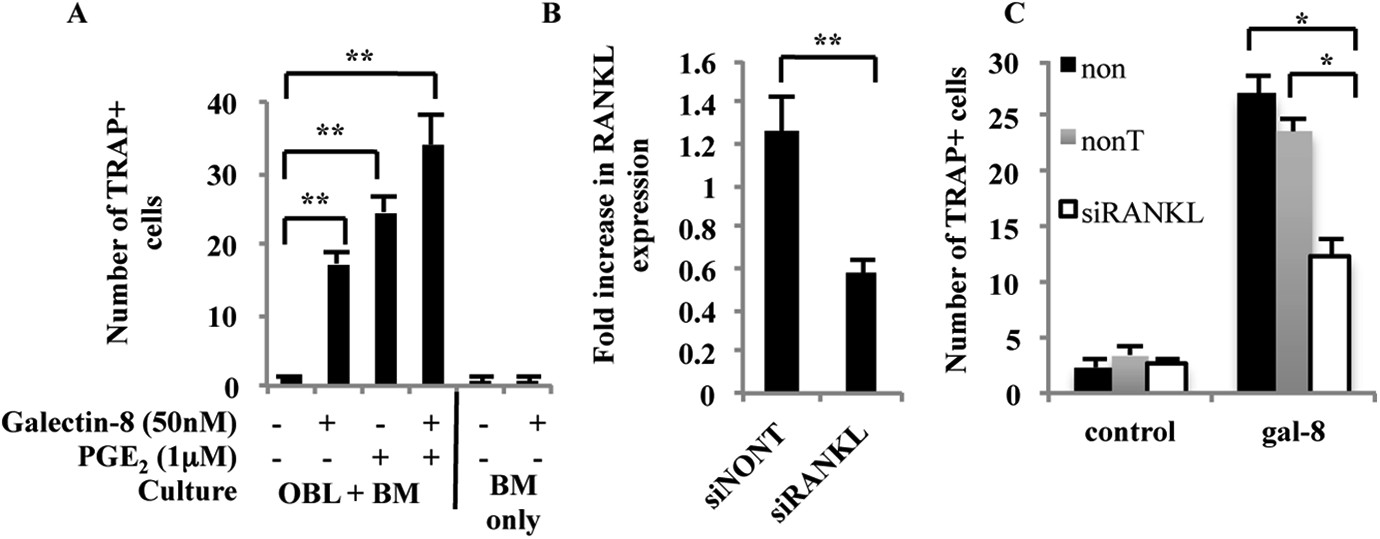
Effects of galectin-8 on osteoclast differentiation.
(A) Osteoblasts (OBL) derived from the calvaria of newborn mice were seeded in 24-well plates (4 × 10⁴ cells/well). After reaching 60–70% confluence, murine bone marrow cells (BM) extracted from the femur and tibia of 6-week-old mice were added to the culture (2 × 10⁶ cells/well), together with galectin-8 (50 nM), PGE2 (1 μM), or both. Galectin-8 and PGE2 were further added on every other day for 10 days. TRAP assay was performed, and active osteoclasts (multinucleated TRAP+ cells) were counted. Results are mean values ± SEM of three independent experiments carried out in duplicates. (B) Osteoblasts were seeded in 12-well plates (5 × 10⁴ cells per well). After 24 hr, cells were transfected with siRNA to RANKL. Non-targeting siRNA served as a control. 72 hr thereafter cells were harvested, RNA was extracted, and qRT-PCR was performed in order to quantify changes in mRNA levels of RANKL. The content of actin mRNA served as a control for normalization purposes. (C) Osteoblasts were seeded as in A. After reaching 60–70% confluence, cells were transfected with the indicated siRNAs for 72 hr. Thereafter, murine bone marrow cells extracted from the femur and tibia bones of 6-week-old mice were added to the culture (2 × 10⁶ cells/well). Galectin-8 (50 nM) was added on the first, fourth, and sixth days after addition of bone marrow. Active osteoclasts were counted as in A. Results are mean values ± SEM of three (A, B) and two (C) independent experiments each carried out in duplicates (*p < 0.05, **p < 0.01).
Figure 4
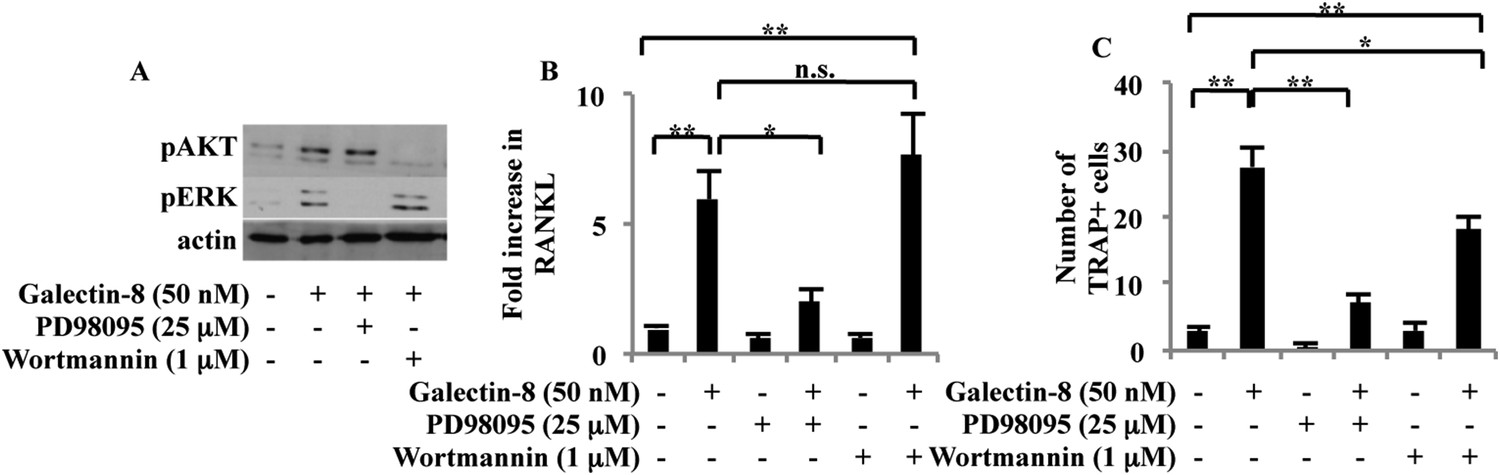
Signaling pathways activated by galectin-8.
(A) Osteoblasts derived from calvaria of newborn mice were treated with 25 μM PD98095 or 1 μM wortmannin for 1 hr before adding galectin-8 (50 nM). After 4 hr, total proteins were extracted and analyzed by Western blotting using antibodies specific for the phosphorylated forms of ERK and Akt. Shown is a representative of three experiments. (B) Osteoblasts were treated with PD98095 (25 μM) or wortmannin (1 μM) for 1 hr before being treated with 50 nM galectin-8. After 24 hr, cells were removed from plates, RNA was extracted, and qRT-PCR was performed in order to quantify changes in RANKL transcription. Actin served as a control for normalization purposes. Results shown are mean values ± SEM of three independent experiments, each done in duplicates. (C) Osteoblasts were seeded in 24-well plates (4 × 10⁴ cells/well). After reaching 60–70% confluence, murine bone marrow cells extracted from the femur and tibia of 6-week-old mice were added to the culture (2 × 10⁶ cells/well). Galectin-8 (50 nM), PD98095 (25 μM), and wortmannin (1 μM) were added every other day for 10 days. Multinucleated TRAP+ cells were scored as differentiated osteoclasts. Results shown in (C) are mean values ± SEM of two independent experiments each carried out in duplicate. (*p < 0.05, **p < 0.01).
Figure 5
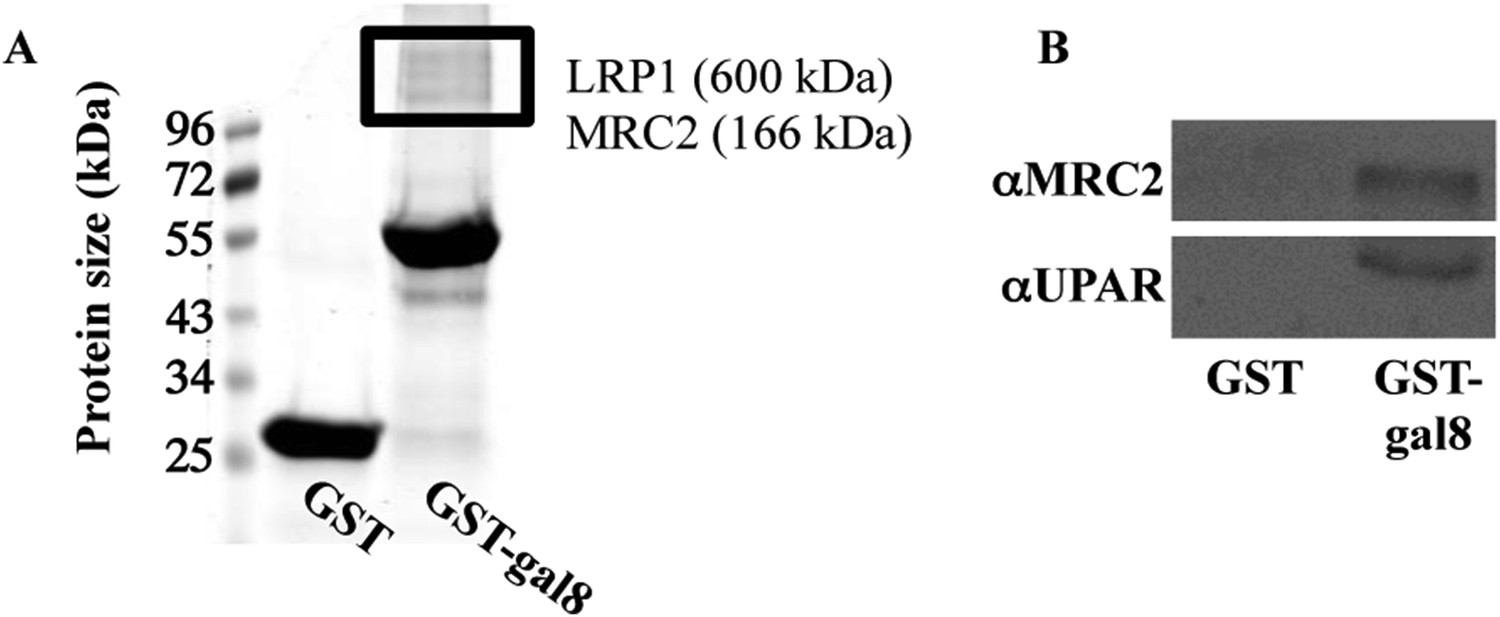
Binding of proteins extracted from osteoblasts to GST-galectin-8.
(A, B) Calvariae were isolated from newborn rats (A) or mice (B); homogenized, and proteins were extracted and incubated for 16 hr at 4°C with GST- or GST-gal-8-loaded beads. Next, the beads were washed in PBS+1% Triton X-100. Elution was performed with 0.5M lactose, and the eluted proteins were resolved by SDS-PAGE and were stained with GelCode (A). Relevant bands (marked with a rectangle) were excised, trypsinized, and subjected to analysis by mass spectrometry. Alternatively, the eluted proteins were resolved by SDS-PAGE and were transferred to nitrocellulose membrane for Western blotting with the indicated antibodies (B). Blots shown are representatives of four independent experiments with similar results.
Figure 6
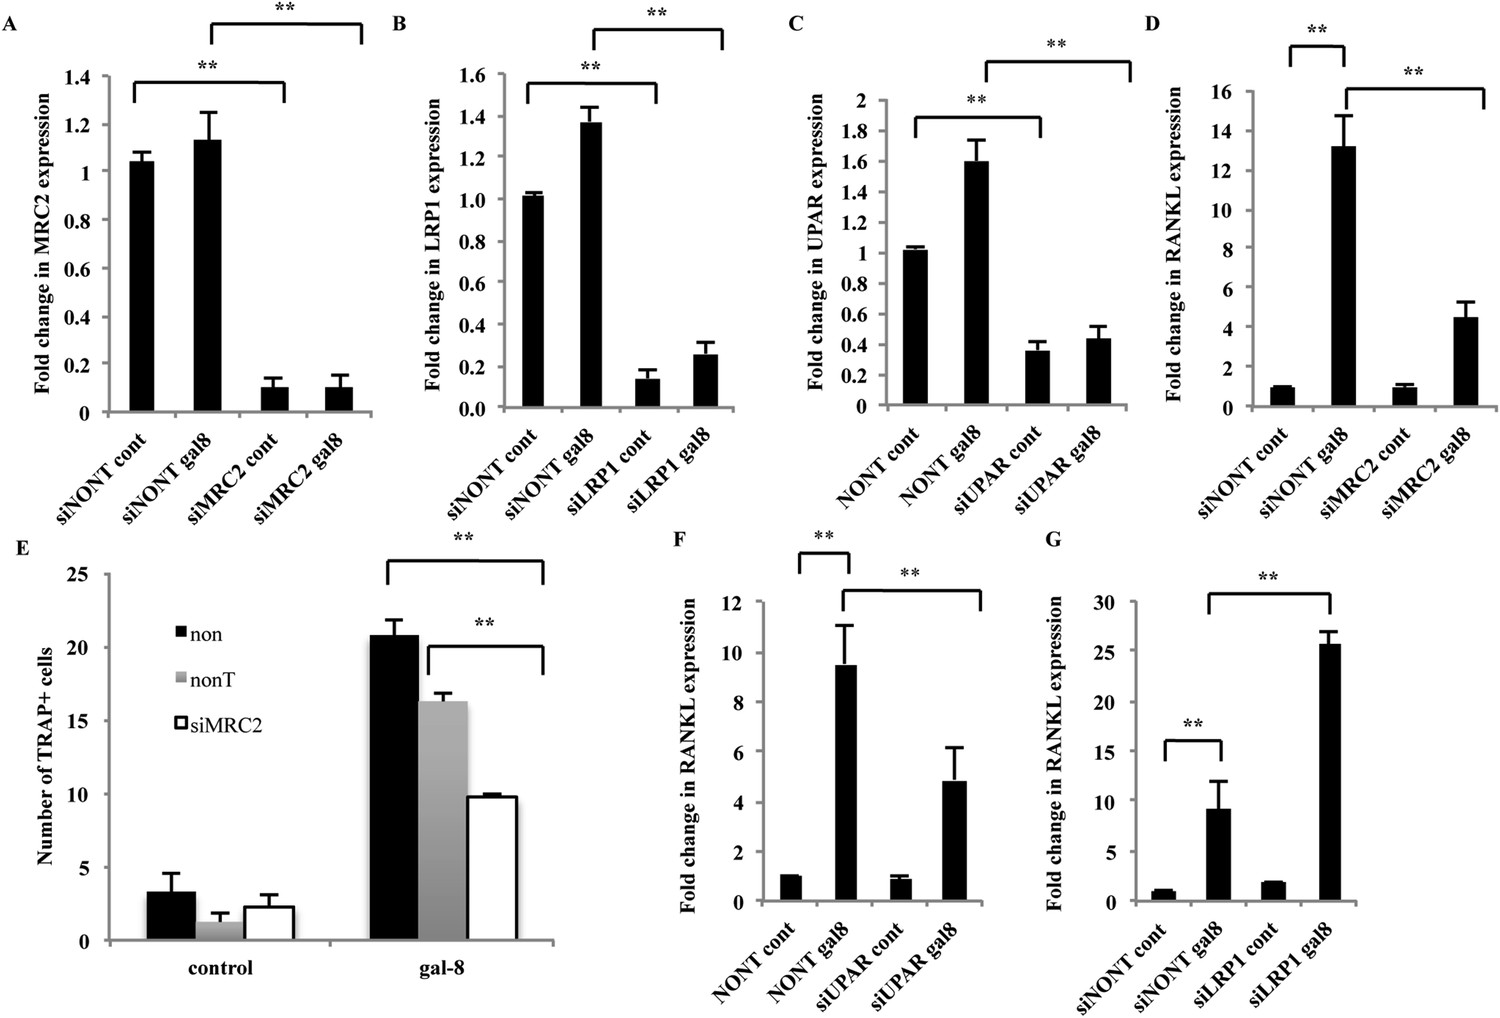
Effects of silencing of MRC2, LRP1, and uPAR on the mode of action of galectin-8.
(A–D, F, G) Osteoblasts from calvaria of newborn mice were grown in 12-well plates (5 × 10⁴ cells per well). After 24 hr, cells were transfected with the indicated siRNAs. Non-targeting siRNA served as control. 48–72 hr thereafter, galectin-8 (50 nM) was added for another 24 hr. Cells were then harvested, RNA was extracted, and qRT-PCR was conducted to quantify changes in mRNA levels of MRC2 (A), LRP1 (B), uPAR (C), and RANKL (D, F, G). The content of actin mRNA served as a control for normalization purposes. Results shown are mean values ± SEM of (n = 5 [A–C, F, G]; n = 3 [D]) **p < 0.01 vs control. (E) Osteoblasts were seeded in 24-well plates (4 × 10⁴ cells/well). After reaching 60–70% confluence, cells were transfected with the indicated siRNAs. After 72 hr, murine bone marrow cells extracted from the femur and tibia of 6-week-old mice were added to the culture (2 × 10⁶ cells/well). Galectin-8 (50 nM) was added on the first, fourth, and sixth days after addition of the bone marrow. TRAP assay was performed, and multinucleated TRAP+ cells were counted. Results are mean values ± SEM of triplicate measurements repeated in two independent experiments **p < 0.01 vs control.
Figure 7
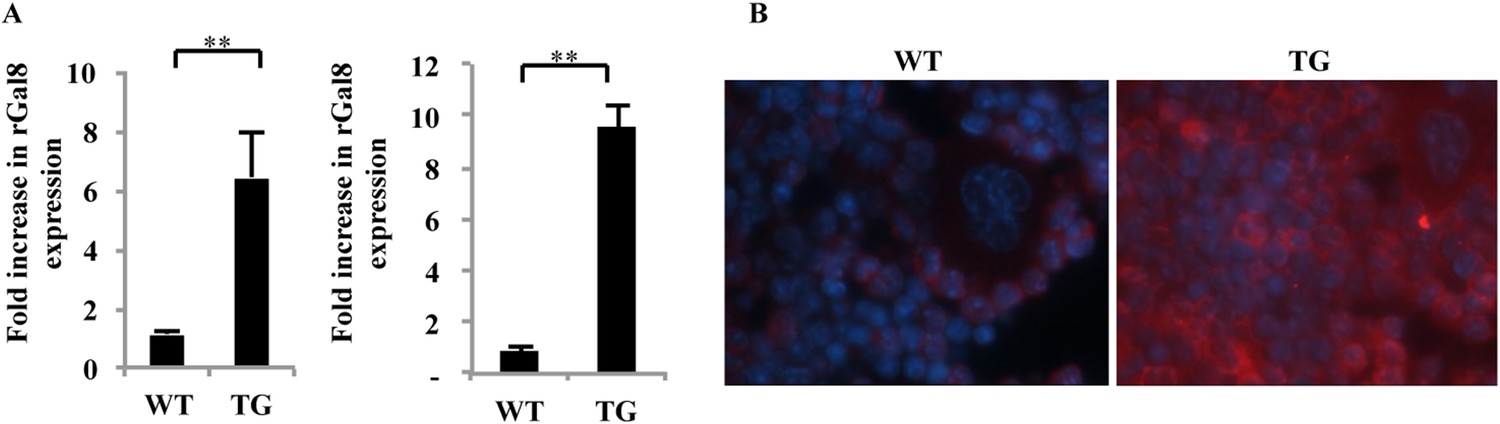
Expression of galectin-8 in femur and tibia of gal-8 Tg mice.
(A) RNA was extracted from osteoblasts derived either from calvaria of newborn mice (n = 7) (left) or from the femur and tibia of 14-week-old (n = 5) (right) wild-type (WT) and gal-8 Tg mice. qRT-PCR was conducted using primers for galectin-8 or actin (control). Result shown are mean ± SEM (**p < 0.01). (B) Tibia was removed from 12-week-old WT (left) and gal-8 Tg mice (right). Bones were decalcified and fixed in paraffin blocks. Sections were cut and stained with anti-galectin-8 antibody (red) and DAPI (blue).
Figure 8

MicroCT scans of tibia proximal regions.
In vivo and in vitro μCT scans were performed on 14-week-old WT and Tg mice, or on tibial bones removed from 16-week-old WT and Tg mice, respectively. Representative pictures show the proximal region of the tibia (for in vivo CT) or a region of interest within the trabecular bone of the tibia metaphysis (for in vitro CT). The position of Trabeculae is indicated by arrows.
Figure 9
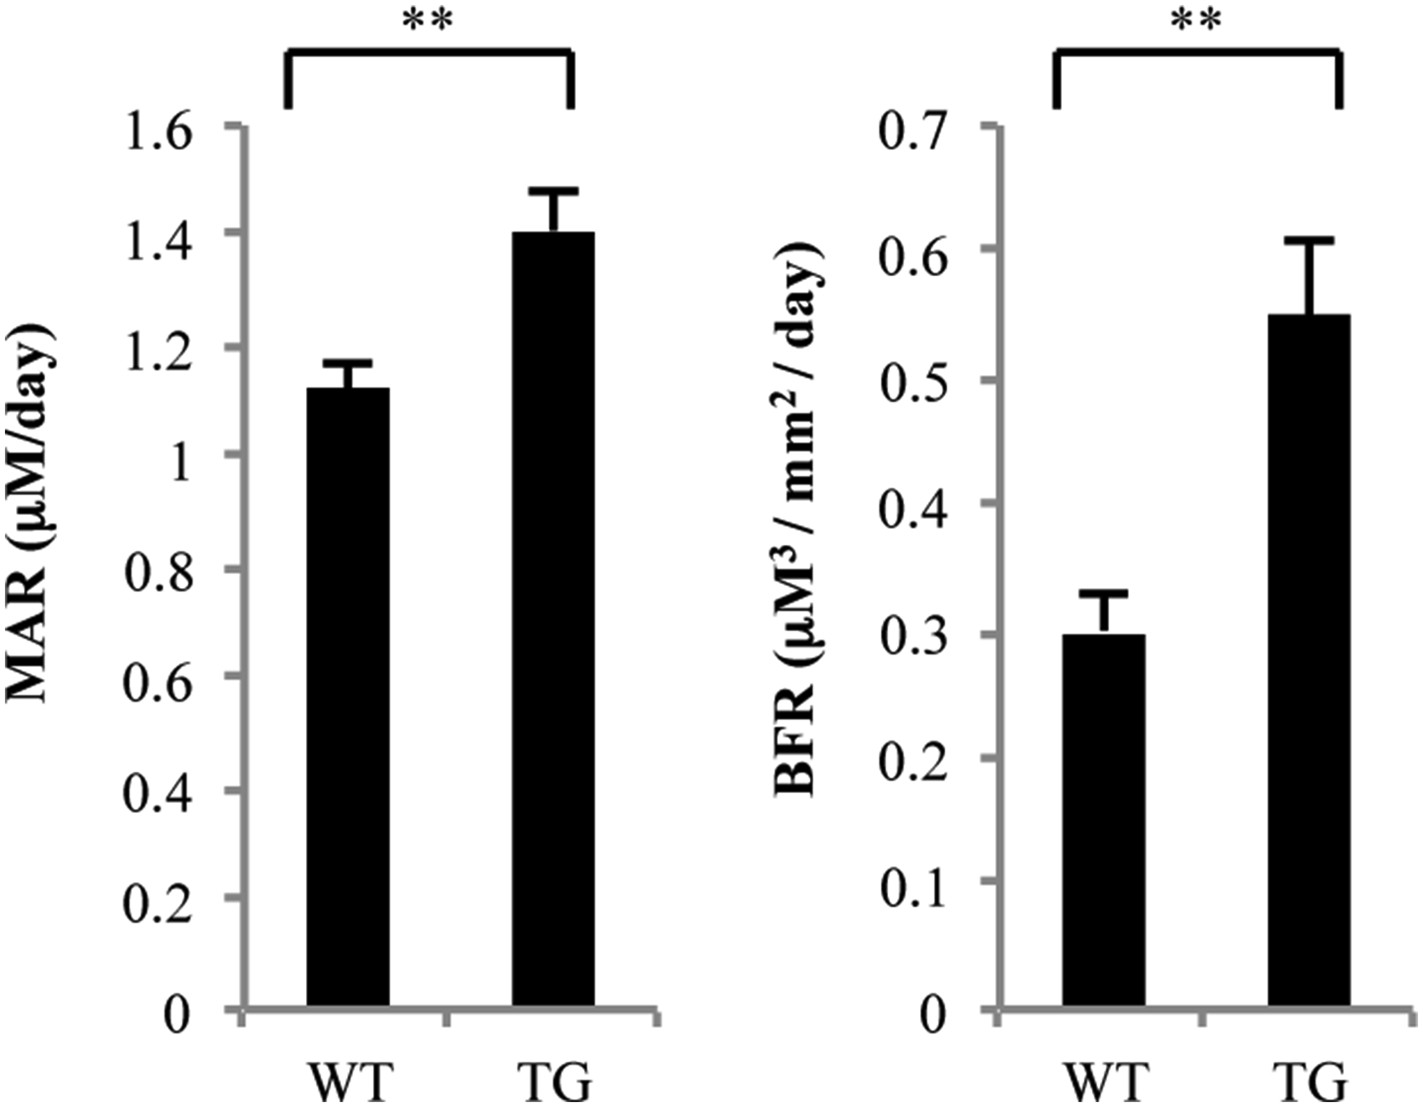
Histomorphometric analysis of femurs from WT and gal-8 Tg mice.
16-week-old WT (n = 5) and Tg (n = 9) mice were injected with calcein. MAR (mineral apposition rate, left) and BFR (bone formation rate, right) were measured and calculated based on sections of the femur bone taken from these mice. Results shown are mean values ± SEM (**p < 0.01 vs WT mice).
Figure 10
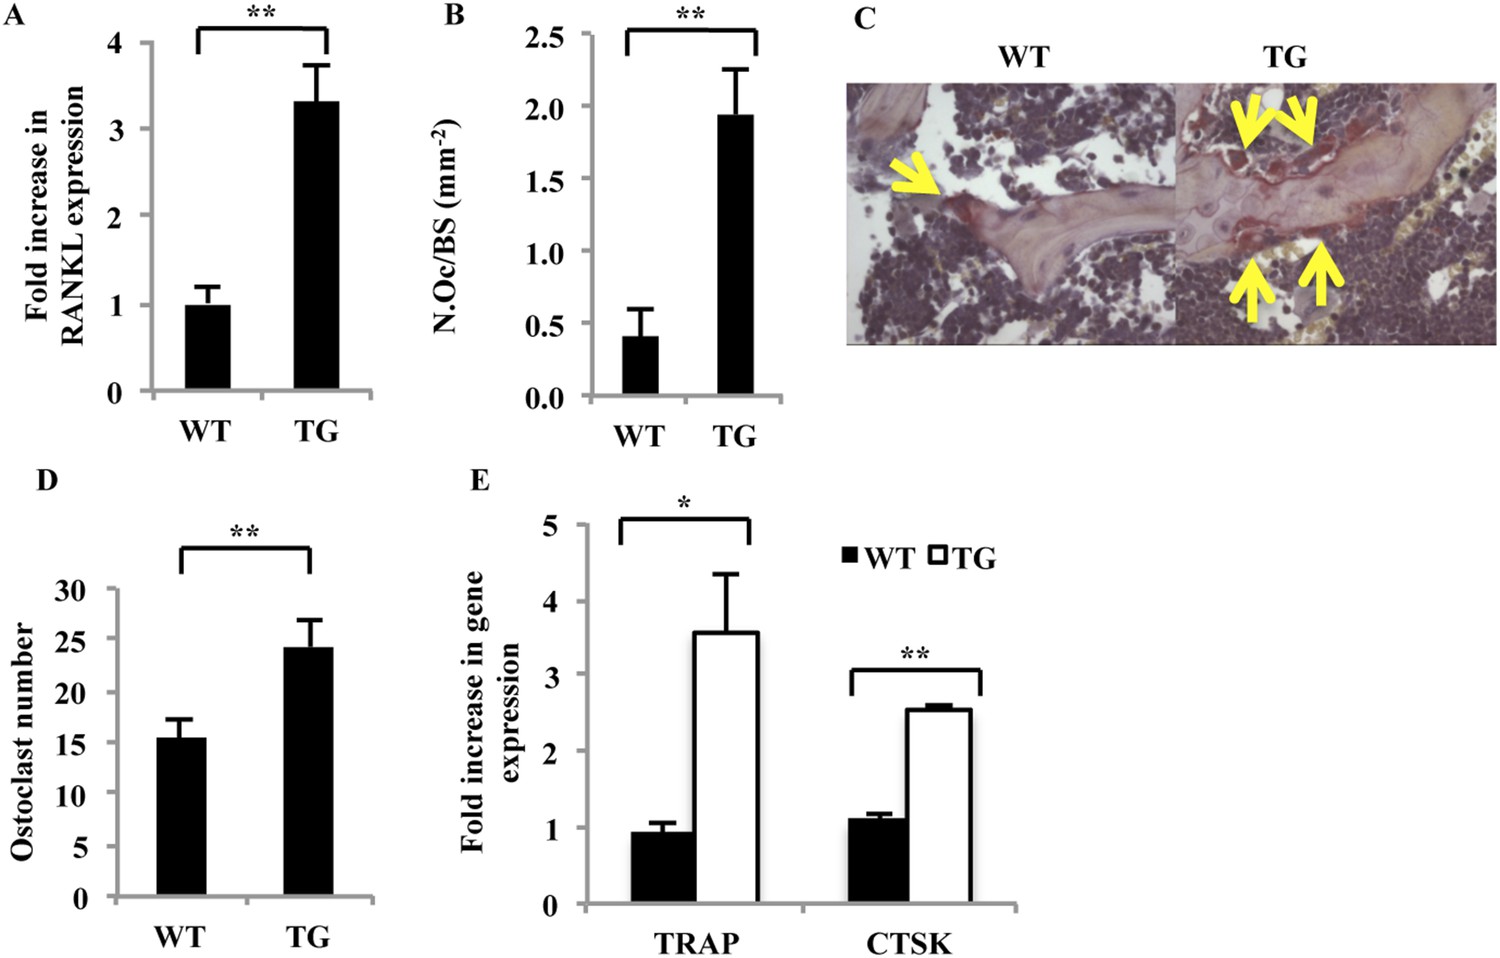
Characterization of osteoblasts and osteoclasts derived from WT and gal-8 Tg mice.
(A) RNA was extracted from the femur and tibia of 14–16-week-old WT and Tg mice. qRT-PCR was conducted in order to quantify changes in expression of RANKL. Actin served as a control for normalization purposes. Results are mean values ± SEM of five mice per group. (B) Femurs were removed from 16-week-old WT and gal-8 Tg mice. Bones were fixed, and TRAP staining was performed. Quantification of the ratios of osteoclast number to bone surface was calculated from sections of WT (n = 5) and Tg (n = 9) mice. Results are mean values ± SEM (**p < 0.01). Representative sections are shown in (C) Arrows indicate the position of osteoclasts. (D, E) Bone marrow cells were extracted from the femur and tibia bone of 14-week-old WT and Tg mice and were seeded in 24-well plates (2 × 10⁶ cells/well) for 24 hr. The number of multinucleated TRAP+ cells was determined (D), and qRT-PCR of the indicated genes was performed (E). Results are mean values ± SEM of n = 6 and n = 4 mice/group in (D) and (E), respectively (*p < 0.05, **p < 0.01 vs WT cells).
Tables
Table 1
Analysis and stereological parameters of tibia proximal region in WT and gal-8 Tg mice
| In vivo CT | In vitro CT | |||
|---|---|---|---|---|
| WT (n = 7) | Tg (n = 7) | WT (n = 5) | Tg (n = 5) | |
| BV/TV | 0.40 ± 0.02 | 0.25 ± 0.03** | 0.12 ± 0.01 | 0.04 ± 0.01** |
| Tb.N (1/mm) | 3.19 ± 0.02 | 1.86 ± 0.25** | 3.86 ± 0.51 | 1.68 ± 0.34** |
| Tb.Sp (mm) | 0.19 ± 0.01 | 0.48 ± 0.08** | 0.24 ± 0.03 | 0.68 ± 0.18* |
| BMD (%) | 100% ± 15% | 52% ± 5%** | 100% ± 8% | 68% ± 6%** |
-
14-week-old WT and Tg mice (n = 7 each group) were scanned using a small animal in vivo μCT scanner. Tibial bones were removed from 16-week-old WT and Tg mice (n = 5 each group) and scanned using an in vitro CT scanner. Analysis was performed on the proximal region of the tibia. The parameters calculated are Tb.N (trabecular number), Tb.Sp (trabecular separation), BV/TV (bone volume/tissue volume), and BMD (bone mineral density). Results shown are mean values ± SEM. BMD is given as relative to the average BMD of WT mice (**p < 0.01 vs WT mice).
Table 2
qRT-PCR primer sequences (5′–3′)
| Gene | Forward primer | Reverse primer |
|---|---|---|
| RANKL | ATCGGGAAGCGTACCTACAG | GTGCTCCCTCCTTTCATCAG |
| TRAP | CAGCAGCCAAGGAGGACTAC | ACATAGCCCACACCGTTCTC |
| CTSK | CAGCTTCCCCAAGATGTGAT | AGCACCAACGAGAGGAGAAA |
| MRC2 | GCCATACGGCTTTGCCCTAC | GGCCCTGGATTCGGAAACAC |
| uPAR | TGTGCTGGGAAACCGGAGTT | GAGGTGGGTCGGGAAGGAGT |
| LRP1 | TCAGACGAGCCTCCAGACTCT | ACAGATGAAGGCAGGGTTGGT |
| Gal-8 (mouse) | TGAACACCAATGCCCGAAGC | GCGTGGGTTCAAGTGCAGAG |
| Gal-8 (rat) | TGTATGCCCACAGGATCAAC | ATCCGAGCTGAATCTGAACC |
Download links
A two-part list of links to download the article, or parts of the article, in various formats.
Downloads (link to download the article as PDF)
Open citations (links to open the citations from this article in various online reference manager services)
Cite this article (links to download the citations from this article in formats compatible with various reference manager tools)
The mammalian lectin galectin-8 induces RANKL expression, osteoclastogenesis, and bone mass reduction in mice
eLife 4:e05914.
https://doi.org/10.7554/eLife.05914


