The Rab6-regulated KIF1C kinesin motor domain contributes to Golgi organization
- Stanford University School of Medicine, United States
Figures
Figure 1
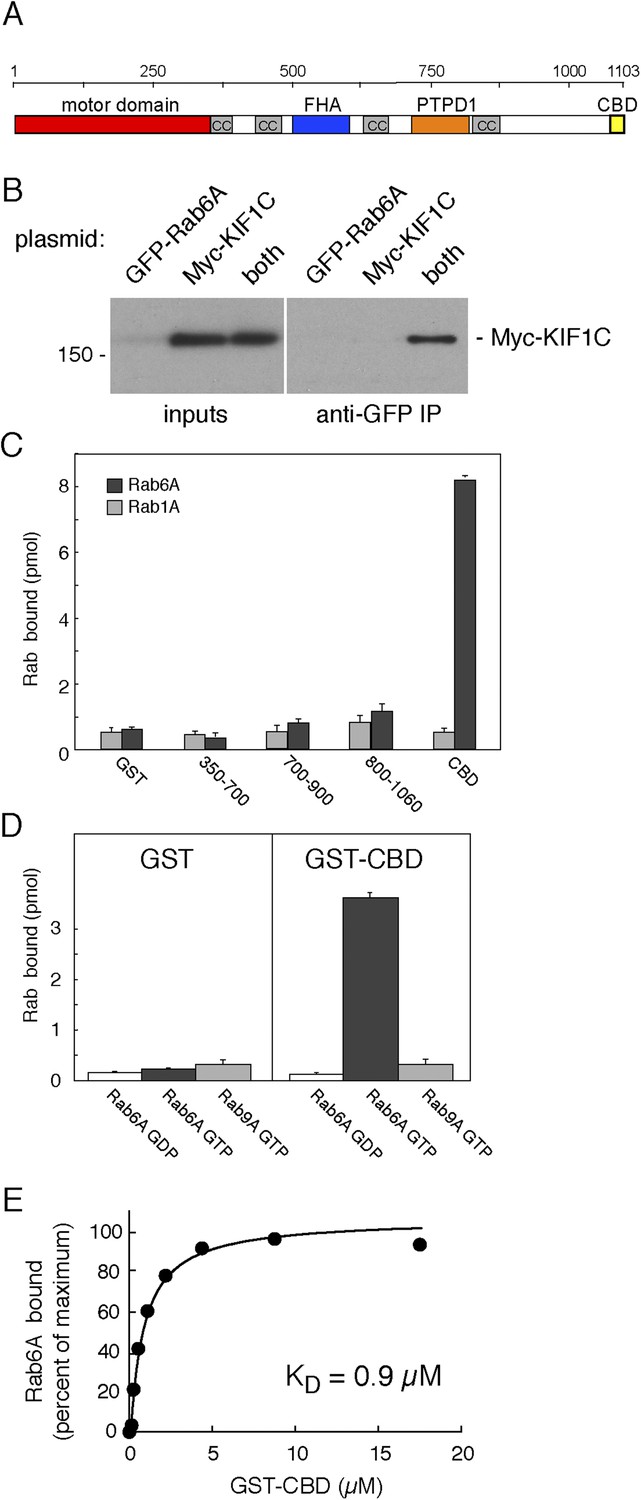
KIF1C binds Rab6A GTPase.
(A) KIF1C schematic showing the N-terminal motor (red), predicted coiled-coil (cc, gray), Forkhead homology (FHA, blue), protein tyrosine phosphatase D1 binding (PTPD1, orange), and C-terminal Rab binding (CBD, yellow) domains (AA 1060-1103). (B) KIF1C co-immunoprecipitation by Rab6A. HEK293 cells were transfected with GFP-Rab6A, myc-KIF1C, or both. Lysates were immunoprecipitated with llama GFP-binding protein and immunoblotted with anti-myc antibody. Left panel, total soluble cell lysates, 5%; right panel, bound fraction, 33%. (C) Domain specificity of Rab6A binding. His-Rab6A-35S-GTPγS (black bars) or His-Rab1A-35S-GTPγS (gray bars) (1 μM) binding to GST-KIF1C constructs (15 μM) pulled-down with glutathione Sepharose and quantified by liquid scintillation counting (error bars = SD). (D) Nucleotide specificity of Rab6A binding. Binding of His-Rab6A or His-Rab9A (500 nM) preloaded with 35S-GTPγS or 3H-GDP to GST or GST-KIF1C CBD (15 μM) was assayed as in C (error bars = SD). (E) His-Rab6A Q72L binds to GST-KIF1C CBD in a concentration-dependent manner. GTPγS-loaded His-Rab6A Q72L (0.58 μM) binding to GST-KIF1C CBD (immobilized on glutathione Sepharose) as determined by quantitative fluorescent antibody immunoblot, presented as a fraction of maximal binding (2.2% of total). Data were fit using GraphPad Prism software.
Figure 2
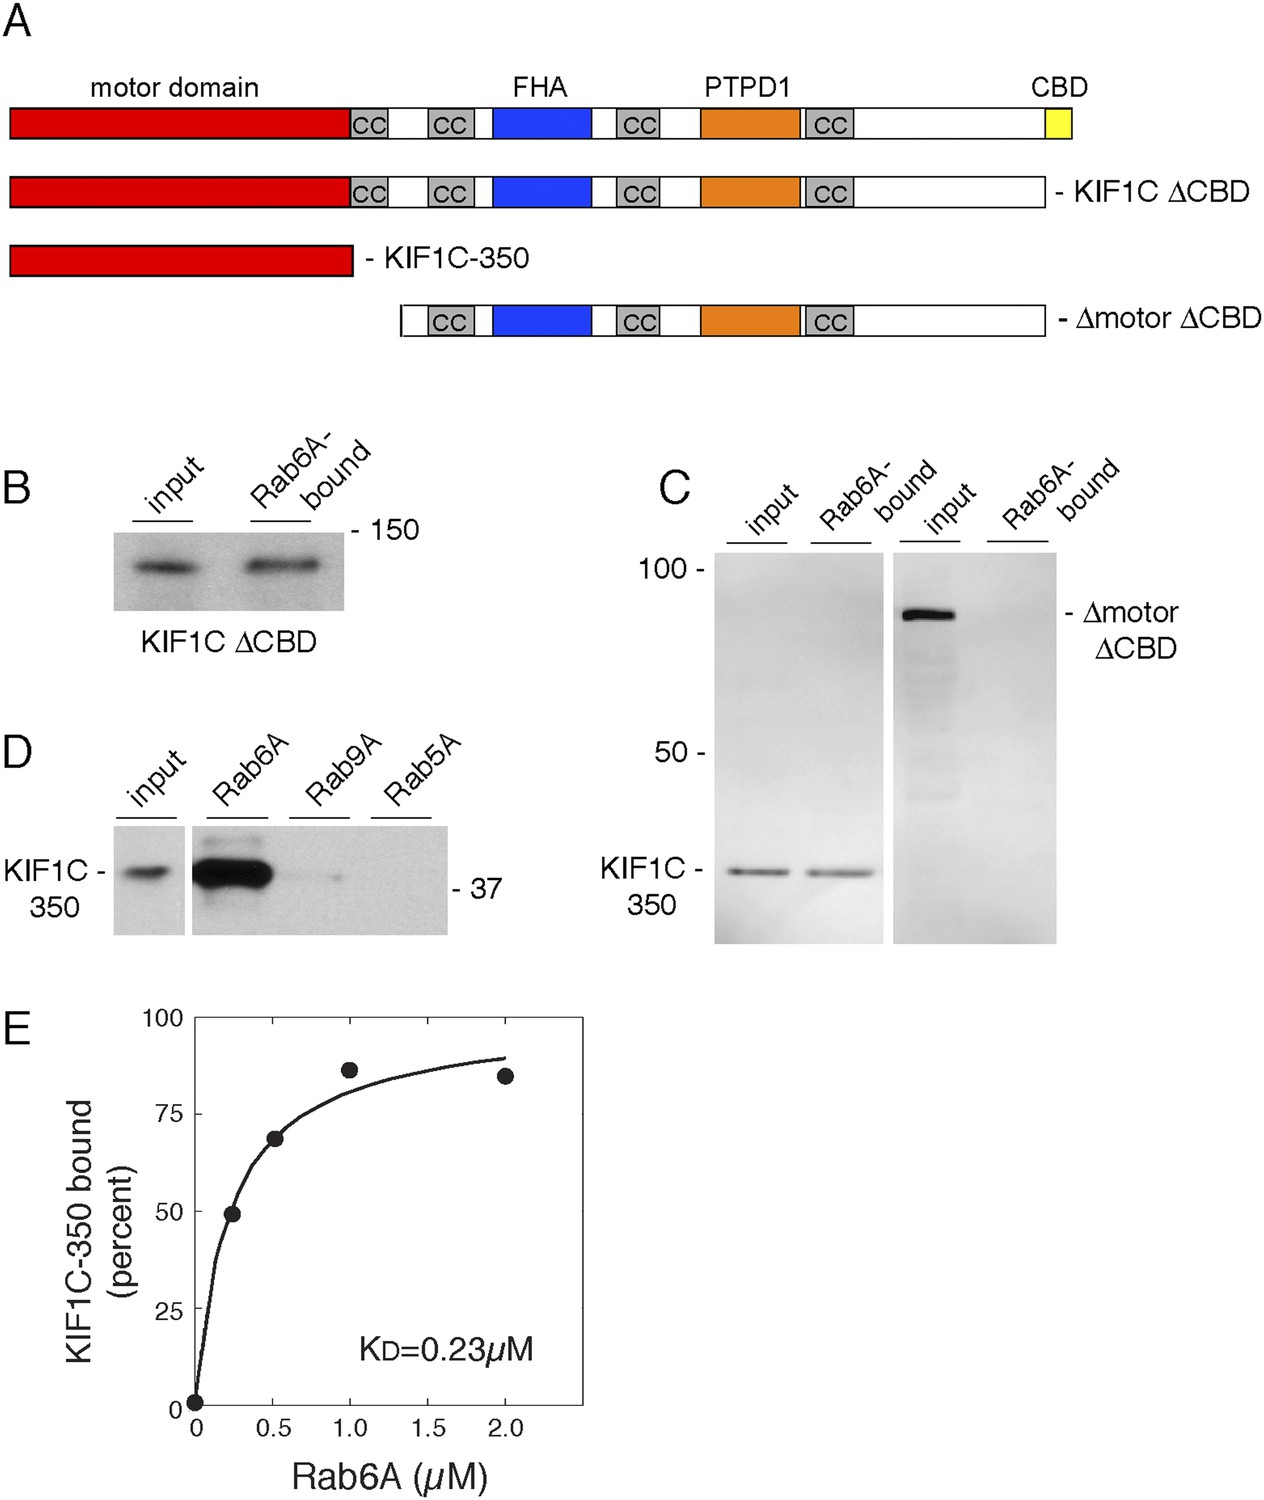
Rab6A binds KIF1C at two locations.
(A) KIF1C schematic showing CBD truncation (ΔCBD, AA 1-1060), N-terminal motor domain (1–350), and a construct lacking both motor domain and CBD (ΔmotorΔCBD, AA 450-1060). (B) Binding of in vitro translated myc-KIF1CΔCBD to GTPγS-loaded GST-Rab6A Q72L (5 μM) and pulled down using glutathione Sepharose. Left, input (1%) compared to bound fraction (50%), right. (C) Binding of in vitro translated myc-KIF1C constructs to GTPγS-loaded GST-Rab6A Q72L (0.2 μM). Input (7%), left, compared to bound (50%), right. (D) Rab specificity of motor domain binding. GTPγS-preloaded GST-Rab6A Q72L, Rab9A, and Rab5A Q79L (5 μM) incubated with in vitro translated myc-KIF1C motor domain. Input, 1%, on left compared to bound fraction (48%) on right. (E) myc-KIF1C-350 binds to GST-Rab6A Q72L in a concentration-dependent manner. In vitro translated myc-KIF1C motor domain binding to GTPγS-loaded GST-Rab6A, presented as a fraction of maximal binding detected (25% of total). Data were fit using KaleidaGraph software. In vitro translation optimally yields a reaction concentration of 11.25 nM product.
Figure 3
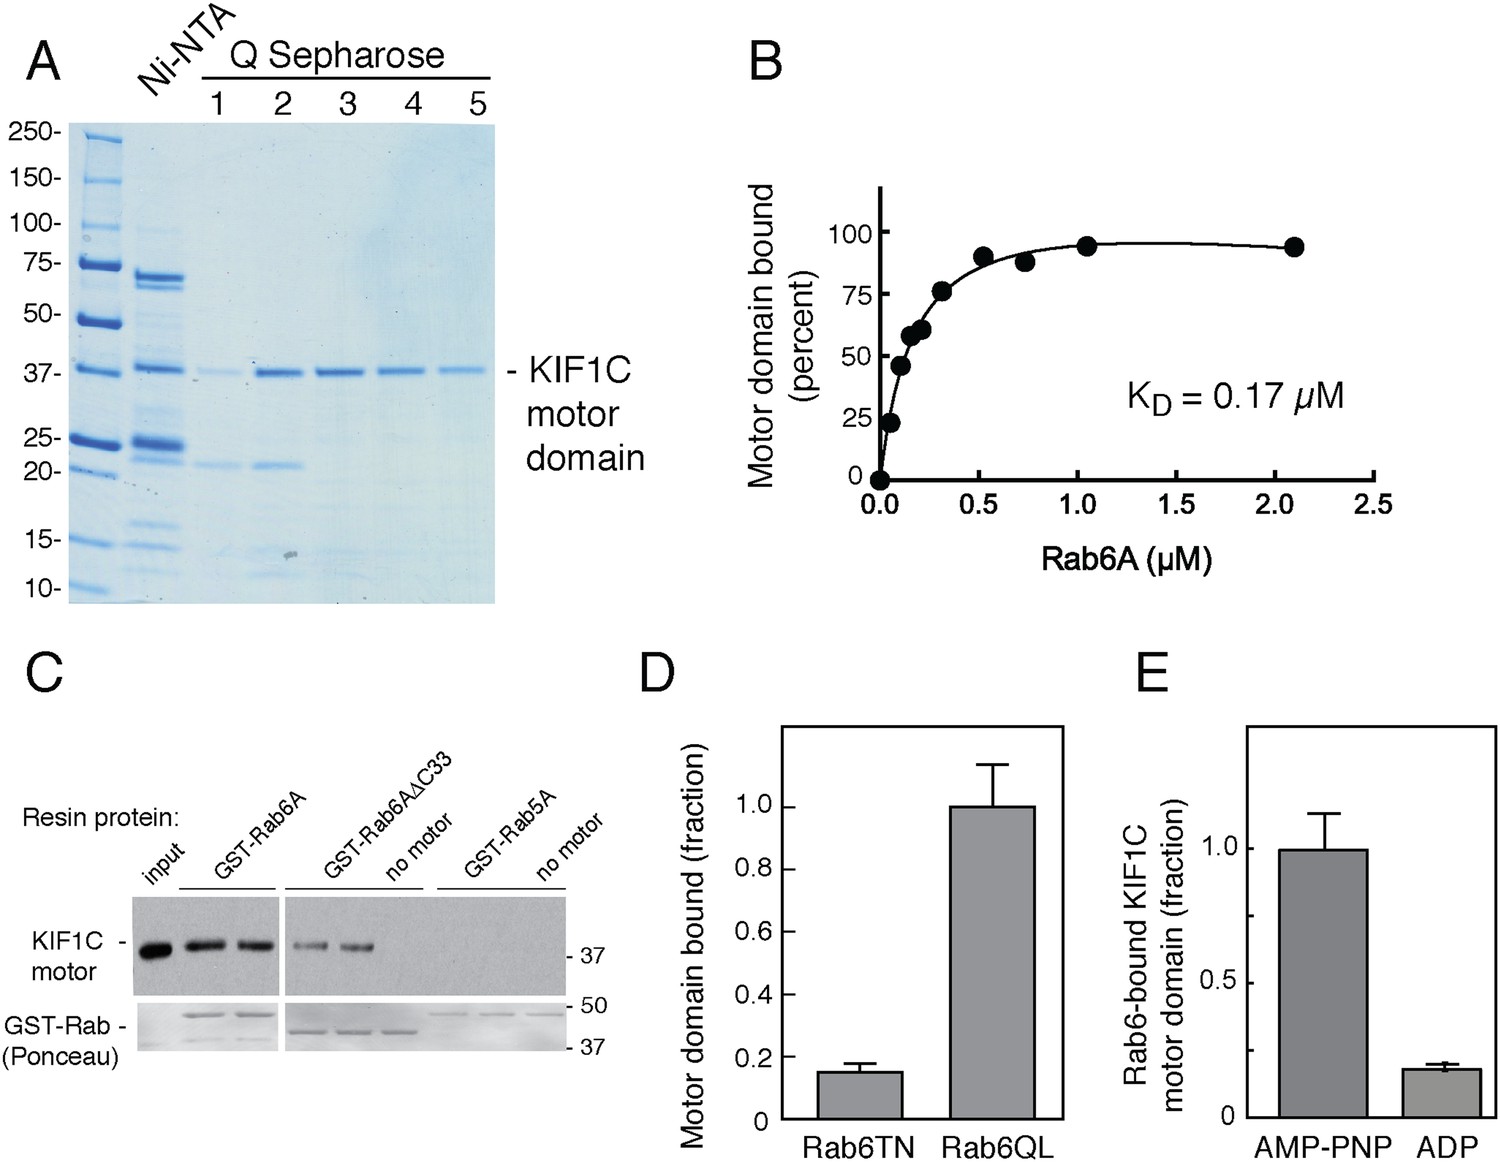
Rab6A binds directly to the KIF1C motor domain.
(A) Coomassie-stained SDS-PAGE of bacterially expressed, KIF1C-355-His motor domain purification using Ni-NTA followed by Q Sepharose FF. Lane 1,flowthrough; lane 2, wash; lane 3–5, NaCl gradient elution. Protein from lanes 3 and 4 were used in subsequent experiments. (B) KIF1C-355-His binds to GST-Rab6A Q72L in a concentration-dependent manner. Purified KIF1C-355-His motor domain (Figure 3A, lane 4; 78.8 nM) binding to GTPγS-loaded GST-Rab6A Q72L (immobilized on glutathione Sepharose) as determined by quantitative fluorescent antibody immunoblot, presented as a fraction of maximal binding detected (61% of total). Data were fit using GraphPad Prism. (C) Immunoblot determination of binding of purified KIF1C-355-His (0.56 µM) to GTPγS-loaded GST-tagged QL mutant Rabs (0.2 μM) after collection on glutathione Sepharose. Input, 20% of sample; bound fraction, 37.3% of sample. Bottom panels show Ponceau S-staining to detect glutathione resin-bound and eluted Rabs. (D) Binding specificity of GST-Rab6A mutants T27N, GDP-preferring, and Q72L, GTP-hydrolysis deficient (0.25 μM) to purified KIF1C-355-His (45 nM) quantified as in B, as a percentage of maximal binding (69.1% of total). (E) Nucleotide binding specificity of GST-Rab6A Q72L (2.5 μM) to purified KIF1C-355-His (160 nM) in the presence of AMP-PNP or ADP as quantified by fluorescent antibody immunoblot as a percentage of maximal binding (37% of total). Error bars represent SD. Mobility of marker proteins is shown in KD.
Figure 4 with 2 supplements
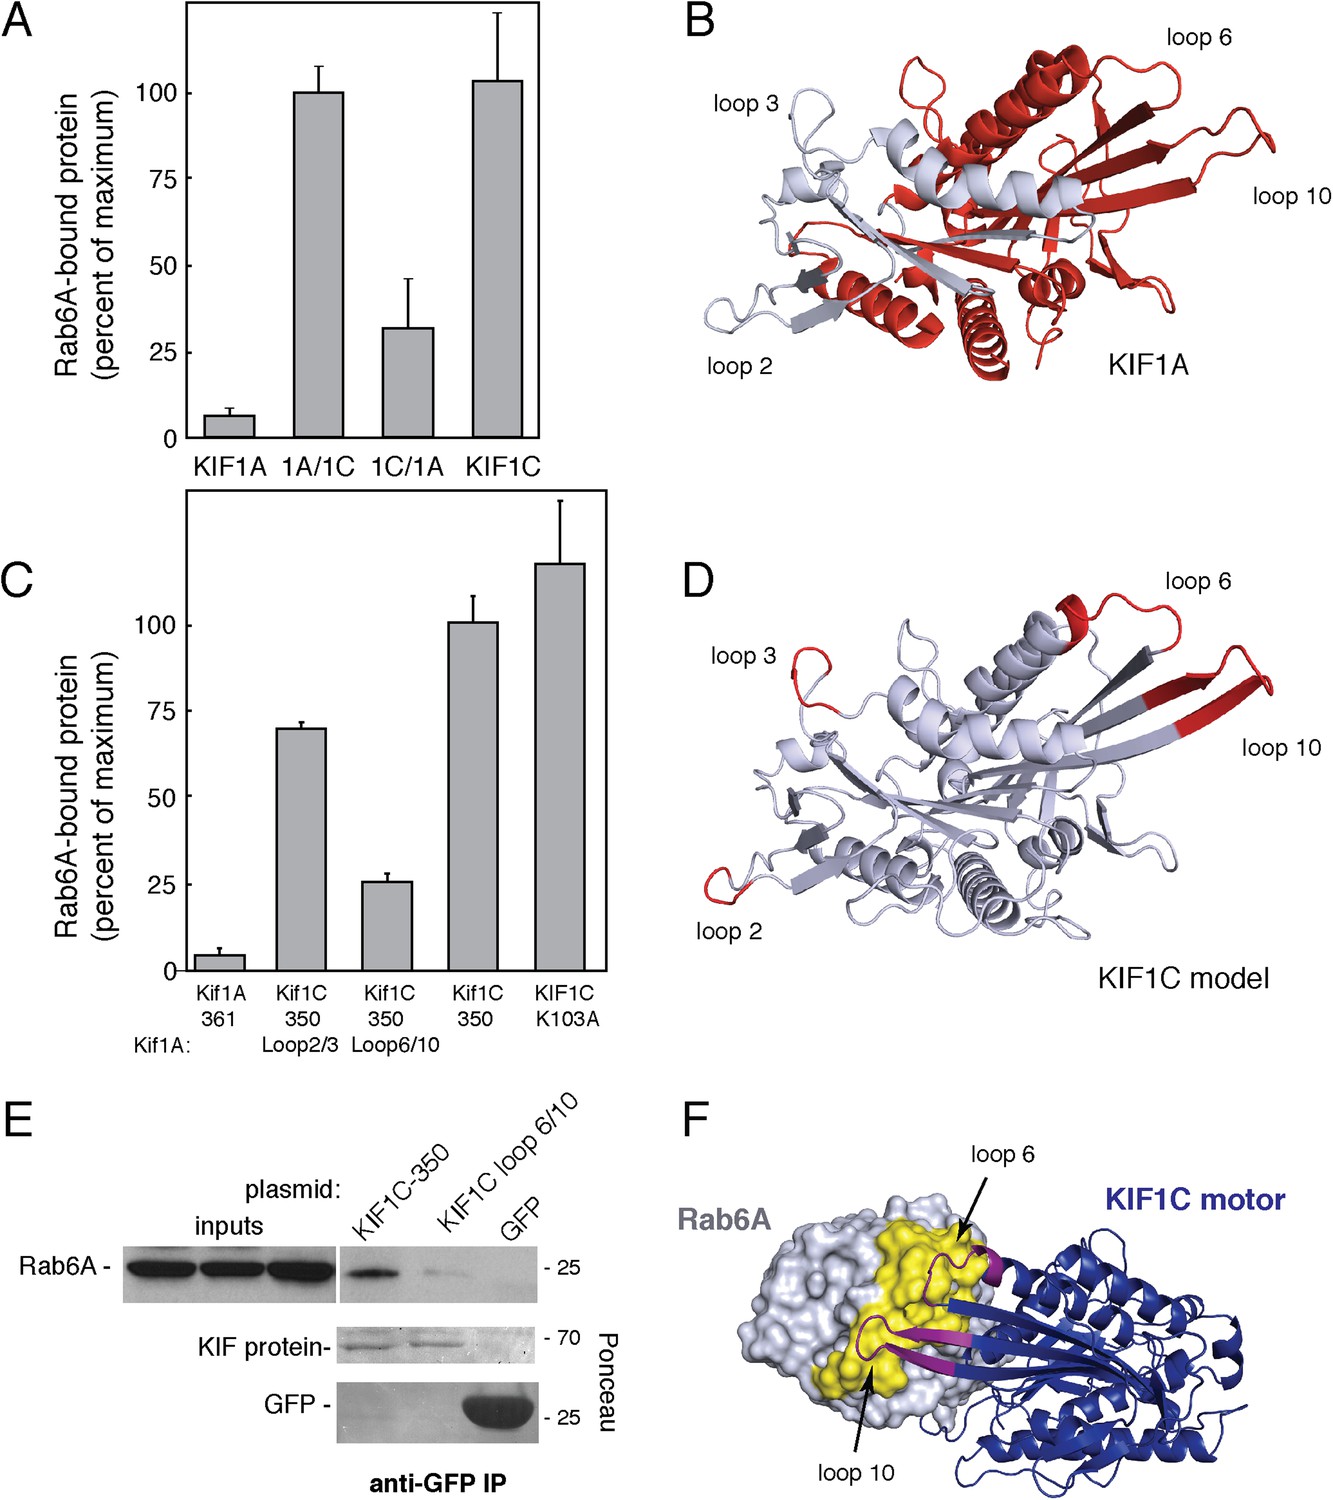
KIF1C loops 6 and 10 are necessary for Rab6A binding.
(A) Binding of in vitro translated myc-KIF1A (1–361), myc-KIF1A/1C, myc-KIF1C/1A, and myc-KIF1C-350 motor domain chimera constructs to GTPγS-loaded GST-Rab6A Q72L (0.2 μM) presented as a percentage of maximal KIF1C bound (24.7% of input). (B) Crystal structure of KIF1A showing the regions swapped between KIF1A and KIF1C. The C-terminal portion is colored red. (C) Binding of in vitro translated myc-KIF1A (1–361), myc-KIF1C-350 Loop 2/3 swap, myc-KIF1C-350 Loop 6/10 swap, myc-KIF1C-350, and myc-KIF1C-350 K103A constructs to GTPγS-loaded GST-Rab6A Q72L (0.2 μM) presented as a percent of myc-KIF1C-350 bound (35.3% of input). (D) Predicted crystal structure of KIF1C with Loop 2/3 (at left), 6/10 (at right) labeled in red. The KIF1C sequence was overlaid onto the KIF1A crystal structure (PDB 2ZFI) using PHYRE2. (E) Binding of endogenous Rab6A to transiently expressed CFP-KIF1C-350, CFP-KIF1C-350 Loop 6/10 swap, and GFP immunoprecipitated with llama GFP-binding protein, as determined by anti-Rab6A immunoblot. Total endogenous Rab6A (2%) at left compared to bound (33%) at right. Below, bound CFP-KIF1C and GFP as measured by Ponceau S staining. (F) Molecular docking of Rab6A onto the predicted structure of KIF1C. The predicted structure (blue) was docked to the crystal structure of Rab6A (PDB 2Y8E, gray) using ClusPro2. The model for the largest cluster containing 144 members is shown. The switch regions of Rab6 are labeled in yellow and loop 6 and 10 of KIF1C are labeled in purple. Error bars represent SD.
Figure 4—figure supplement 1
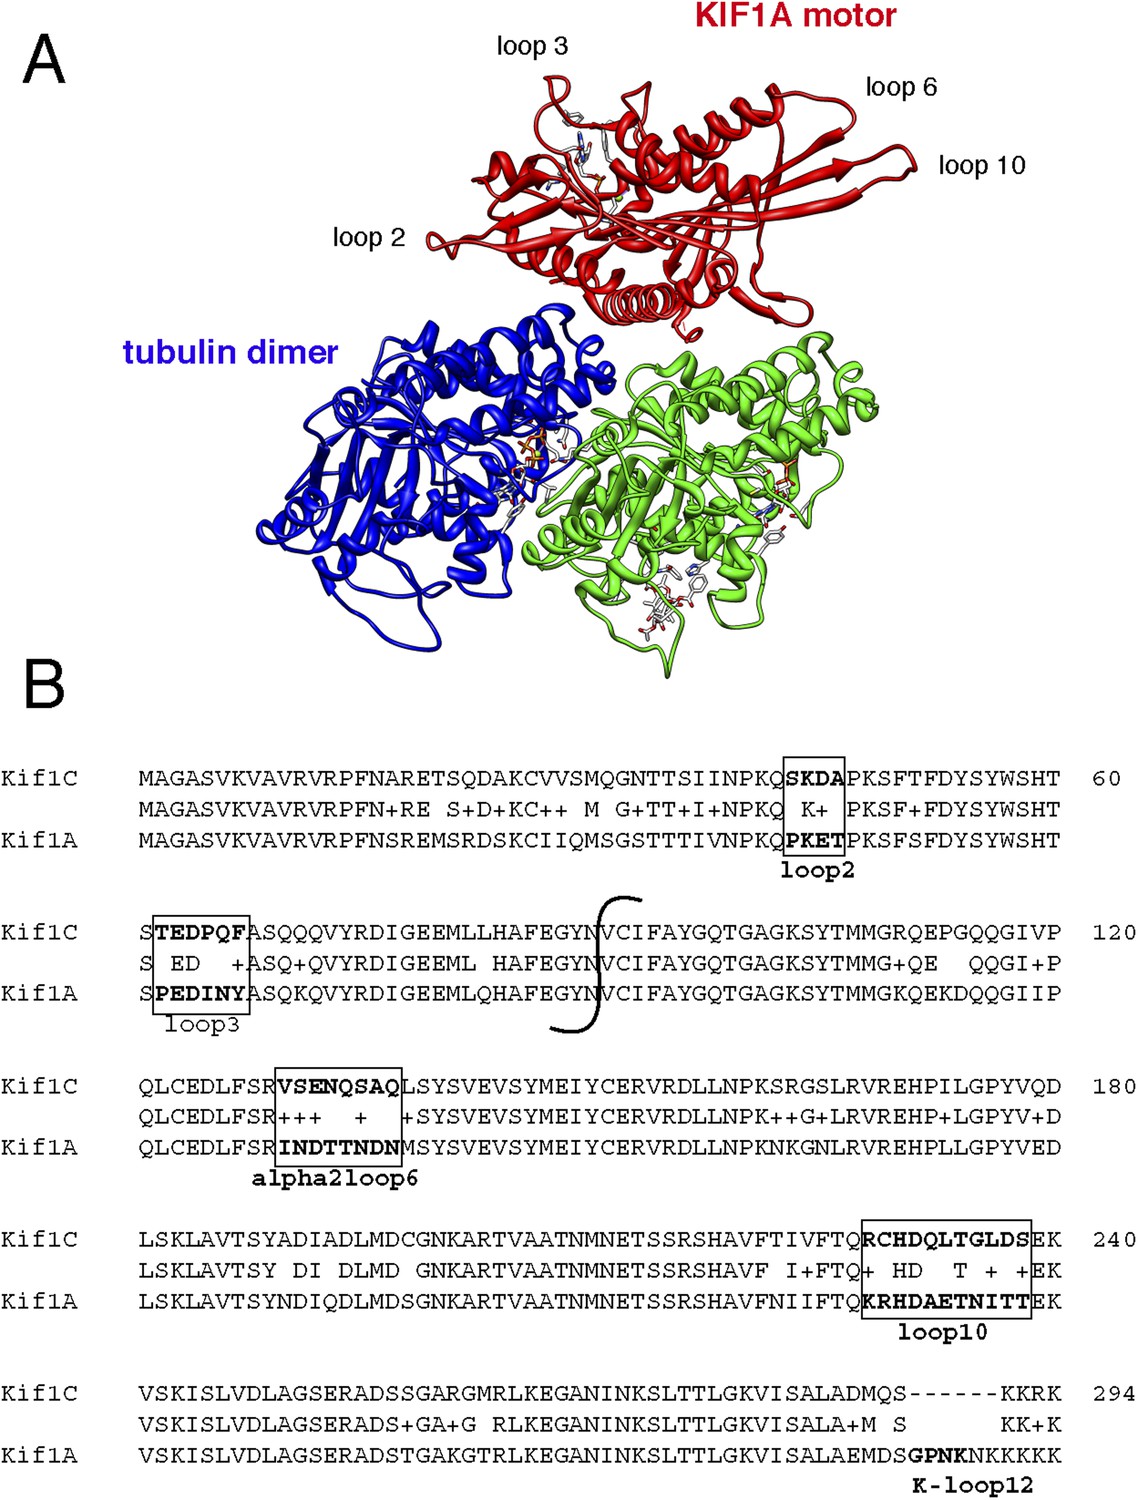
The motor domains of KIF1A and KIF1C share 81% identity.
(A) Structure of KIF1A motor domain bound to tubulin dimer (PDB 2HXH). Loops 2, 3, 6, and 10 are highlighted. (B) Alignment of human KIF1C (top) and KIF1A (bottom) with boxes around regions corresponding to the loop mutants generated and indicated in A. The indicated break demarcates the region swapped between KIF1A and KIF1C to generate chimeric proteins.
Figure 4—figure supplement 2
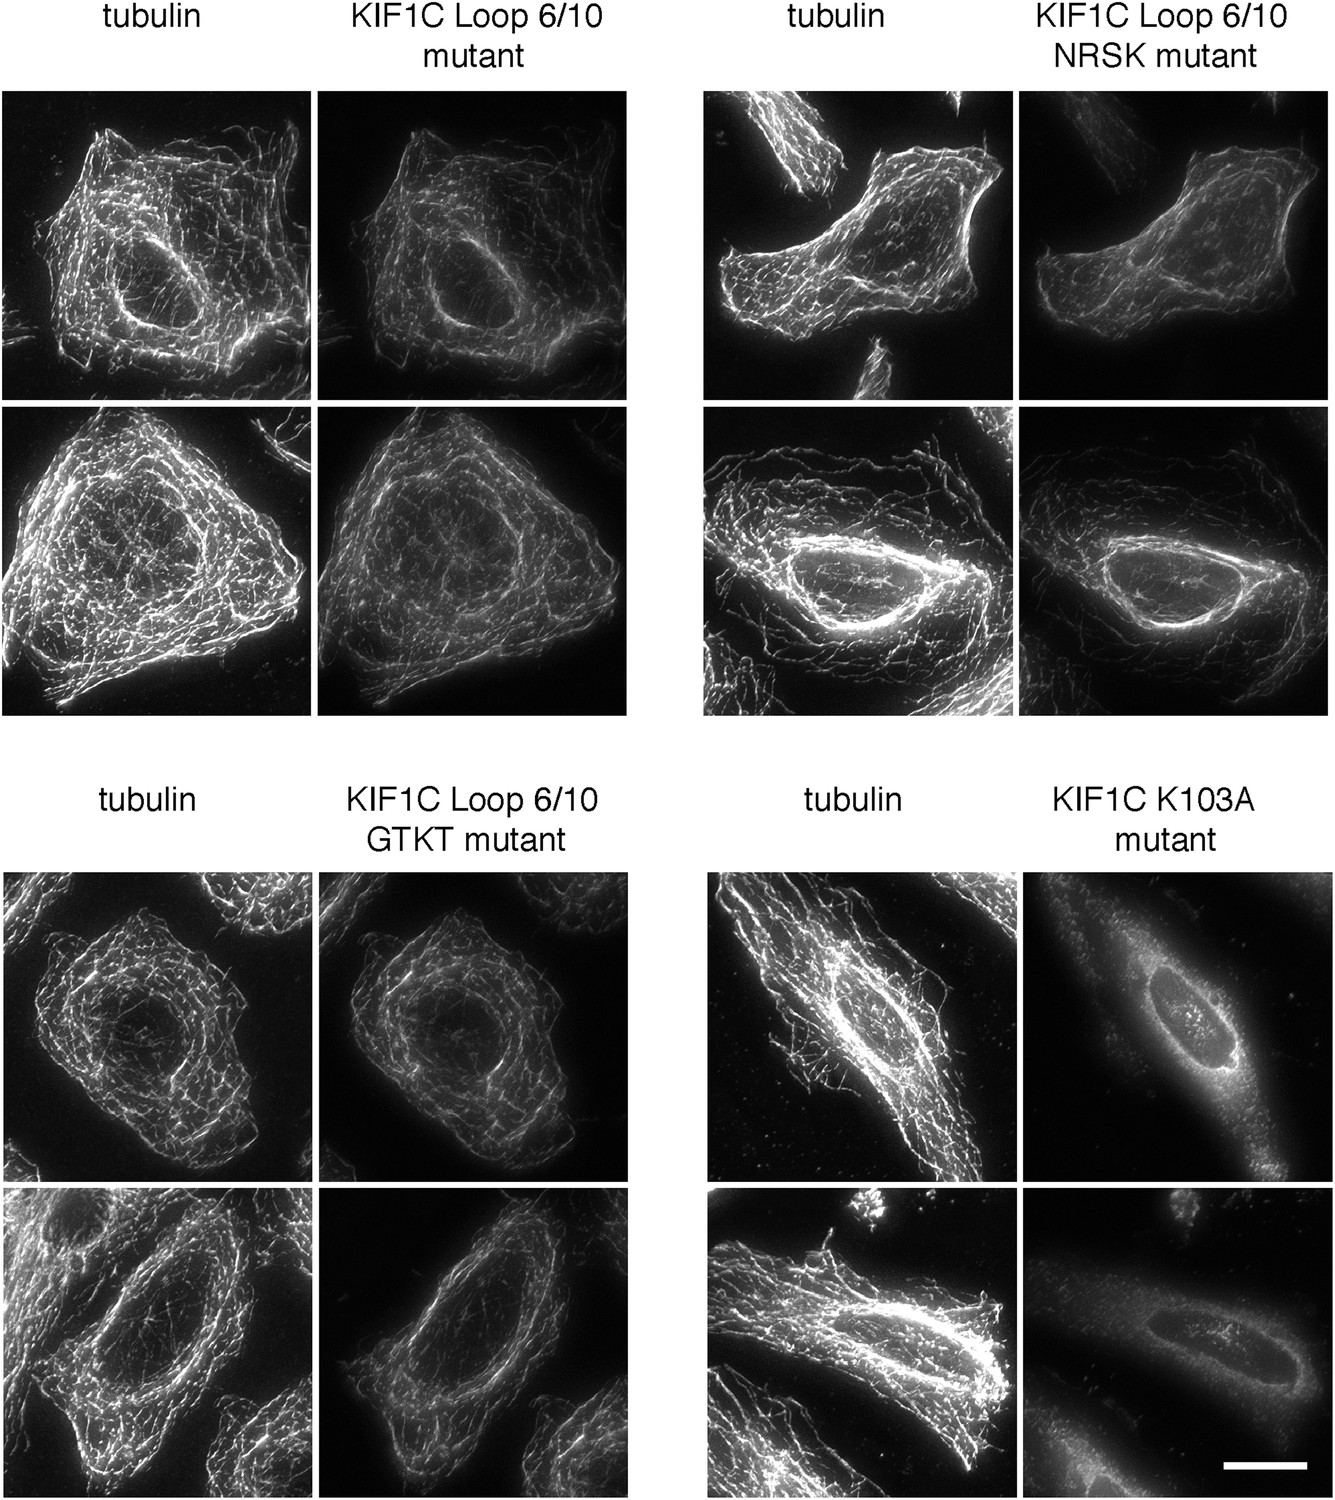
Mutations in the KIF1C K-loop do not affect KIF1C loop 6/10 mutant motor domain microtubule localization.
HeLa cells transfected with the indicated CFP-KIF1C 350 construct were precipitated in MeOH and imaged by immunofluorescence microscopy. Two cells each are shown. The NRSK mutant changes 291KKRK to 291NRSK. The GTKT mutant changes 288MQSKKRKSD to 288GTKT, which mimics the absence of the K-loop and makes the mutant more similar to conventional kinesin, KIF5C (Okada and Hirokawa, 2000). Tubulin staining is on the left. Scale bar is 20 µm.
Figure 5 with 1 supplement
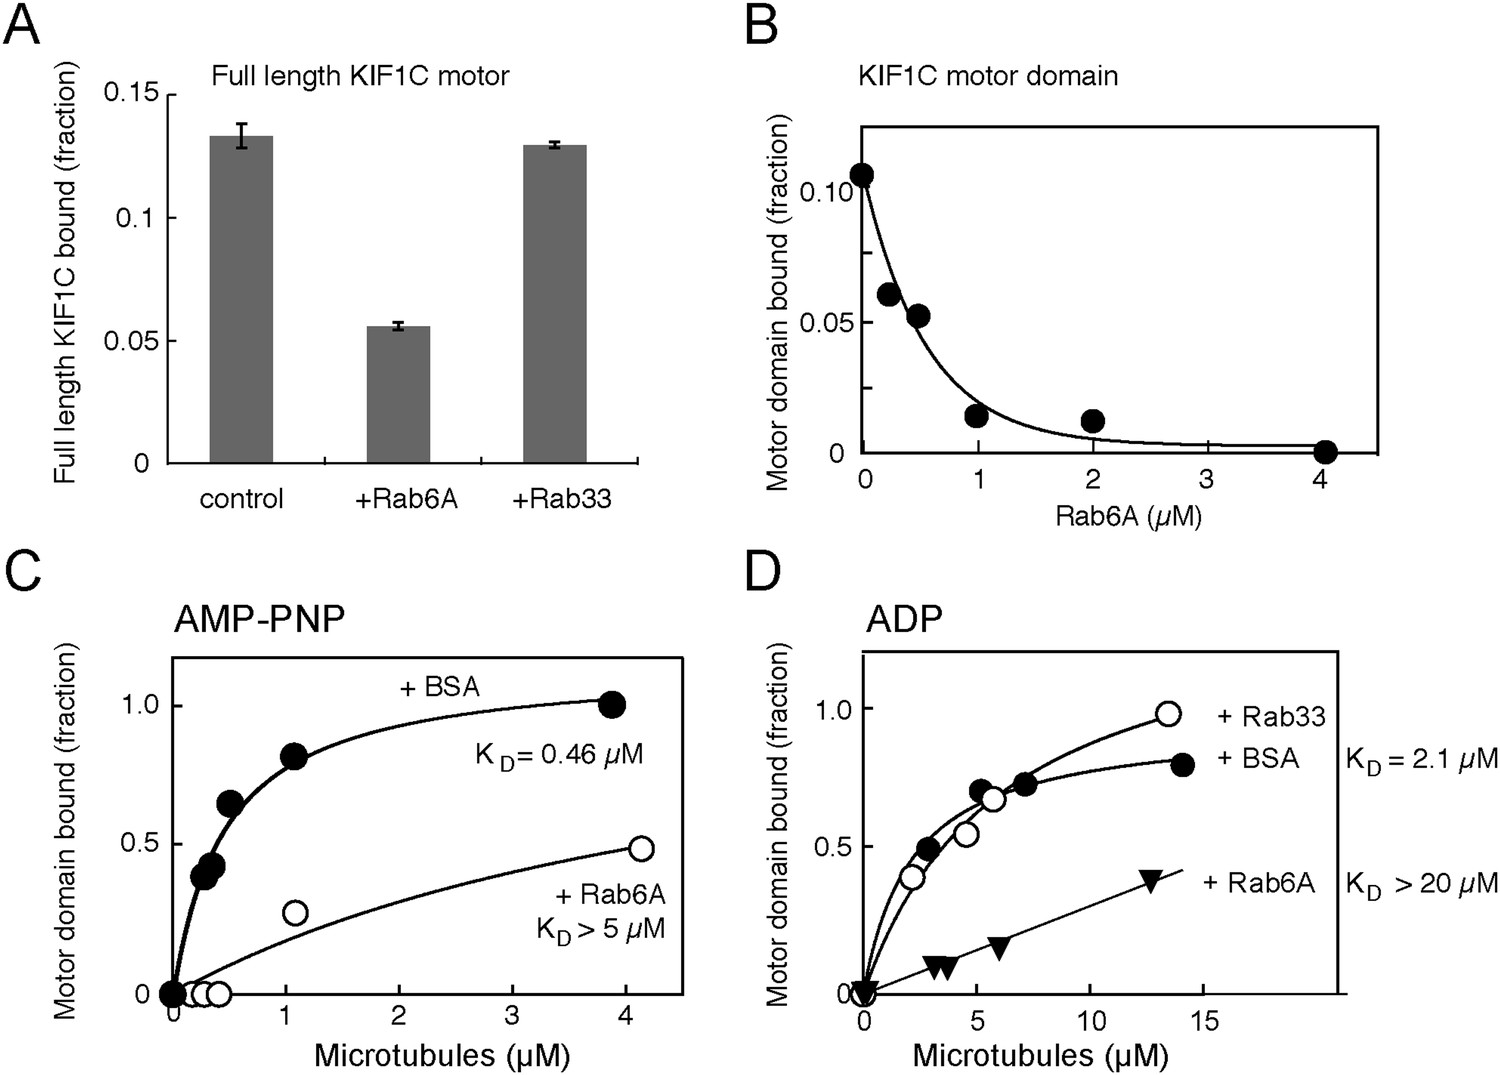
Rab6A inhibits KIF1C microtubule co-sedimentation.
(A) Binding of full-length KIF1C to microtubules in the presence of Rab6A. In vitro synthesized 35S-myc-KIF1C was desalted, incubated with GTPγS-preloaded His-tagged Rabs (4.2 μM), and then with 0.8 µg/µl Paclitaxel stabilized pre-polymerized microtubules in 2.5 mM ADP and 0.5 mM GTPγS. Reactions were centrifuged through a 10% sucrose cushion and pellets were analyzed by scintillation counting. The fraction of full-length KIF1C cosedimenting with microtubules in the presence of the indicated Rabs is shown (error bars = SE [n ≥ 2]). (B) Rab6 affects KIF1C motor domain microtubule co-sedimentation in a concentration-dependent manner. KIF1C-355-His (160 nM) was incubated with increasing concentrations of His-Rab6A Q72L, and then with 2.1 µM Paclitaxel stabilized pre-polymerized microtubules in 2.6 mM ADP and 0.35 mM GTPγS. Reactions were centrifuged through a 35% sucrose cushion. Pellets were analyzed by fluorescent antibody immunoblot. (C) Rab6A affects the strong microtubule binding state of KIF1C. Purified KIF1C-355-His (80 nM) was incubated with His-Rab6A Q72L (4.86 µM) or BSA (7.6 µM), and then with increasing concentrations of microtubules in 2.6 mM AMP-PNP and 0.35 mM GTPγS. Samples were processed and analyzed as in B. (D) Rab6A affects the weak microtubule binding state of KIF1C. Purified KIF1C-355-His (160 nM) was incubated with His-Rab6A Q72L, His-Rab33, or BSA (3.42 µM), and then with increasing concentrations of microtubules in 2.6 mM ADP and 0.35 mM GTPγS. Data were fit using GraphPad Prism software. The fraction of motor sedimented is normalized to the amount of microtubules pelleted, determined by Coomassie blue staining.
Figure 5—figure supplement 1
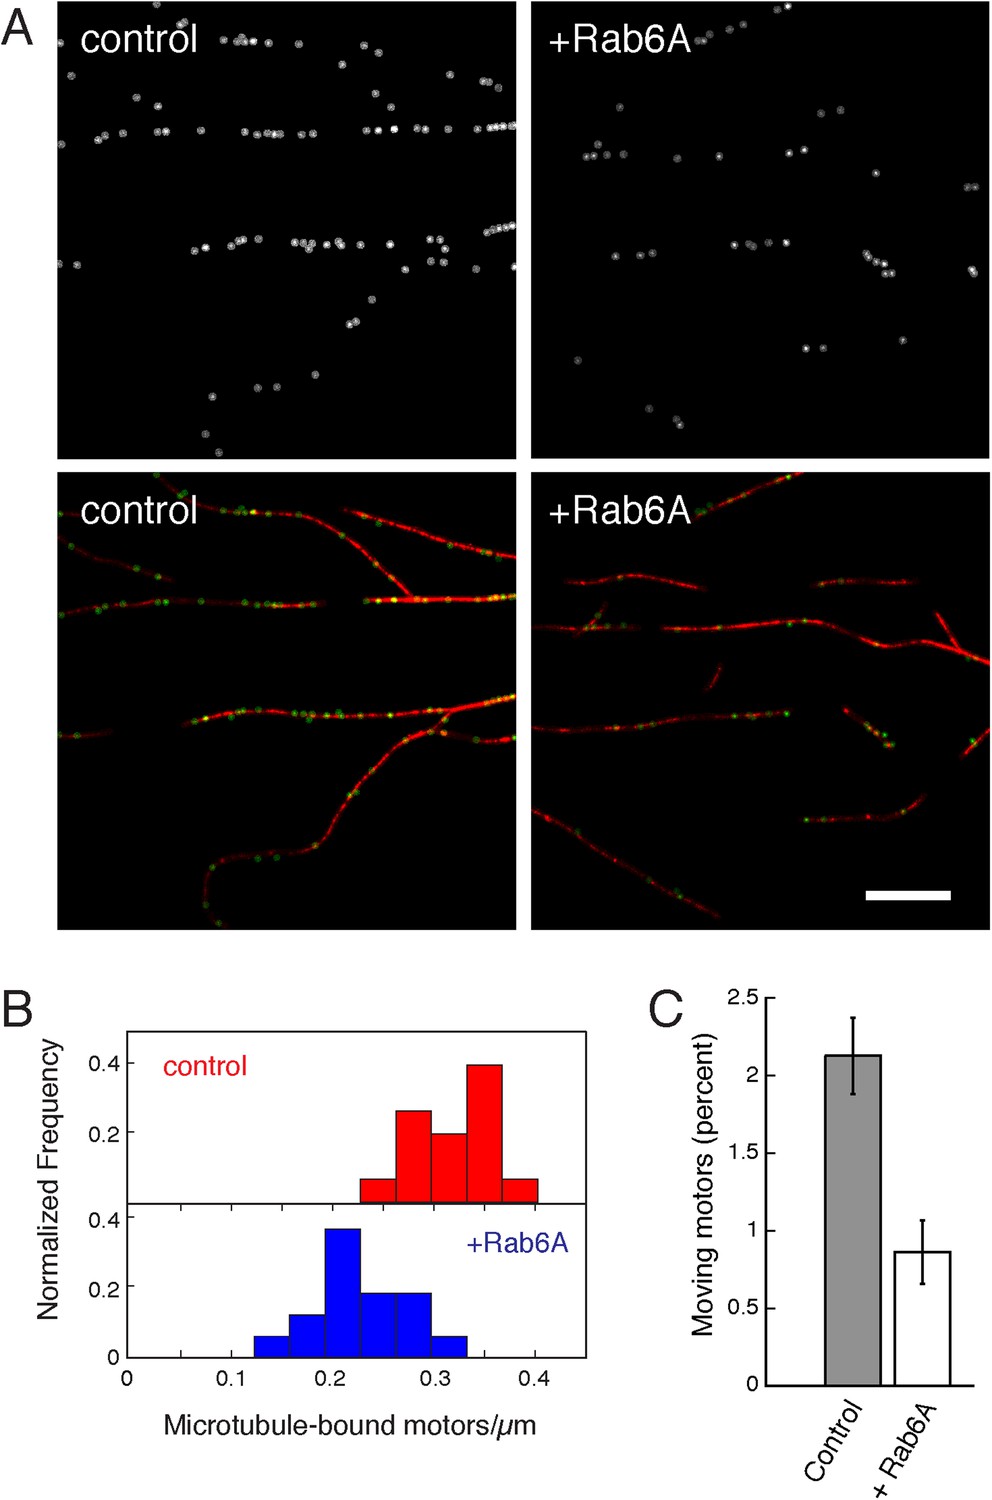
Rab6A inhibits KIF1C binding and motility.
KIF1C (9 nM), labeled with rabbit anti-KIF1C and Dylight 649 anti-rabbit Fab, was incubated with Rhodamine labelled-microtubules (7.5 µg/ml) adhered to coverslips with anti-β tubulin ± Rab6A (15 µM) and imaged by TIRF microscopy (on average 14 microtubules/75 s/region, 15 regions per condition quantified). (A) Images from a single frame ± Rab6A. Top panels show microtubule-localized KIF1C molecules ± His-Rab6A; bottom shows KIF1C (green) on microtubules (red). Scale, 10 μm. (B) Rab6A decreases the number of motors on microtubules normalized by microtubule length (p < 0.0001). (C) Rab6A decreases the percentage of moving motors (p < 0.0001, bars = SE). Experiments were done in series so that incubation and imaging times were controlled. Rab6A did not affect KIF1C processivity or speed.
Figure 6
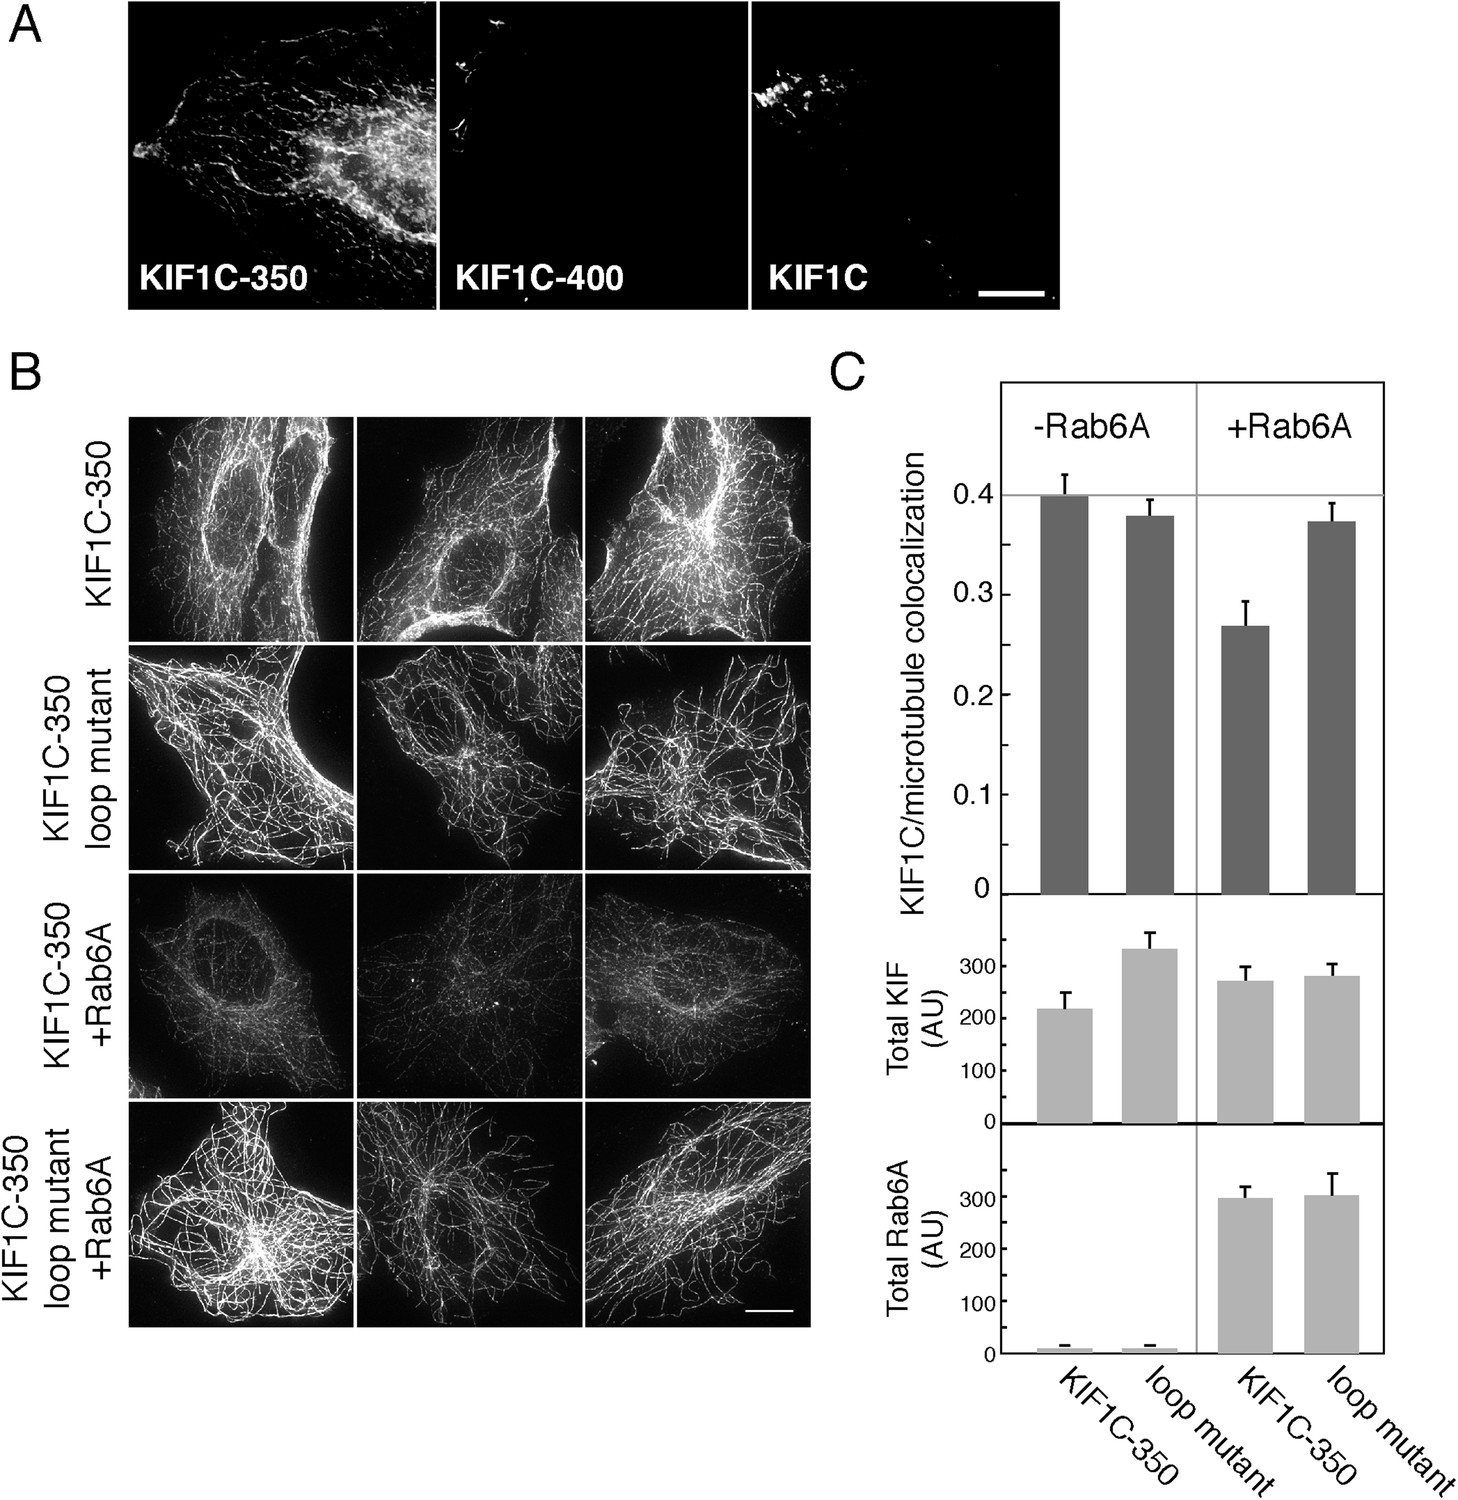
Rab6A inhibits KIF1C microtubule colocalization in cells.
(A) Localization of KIF1C in MeOH-fixed HeLa cells transiently transfected with CFP-KIF1C-350, CFP-KIF1C-400, or full-length CFP-KIF1C. Scale bar, 10 µm. (B) Localization of CFP-KIF1C-350 or CFP-KIF1C-350 Loop 6/10 mutant ± Rab6A in MeOH-fixed Vero cells. Three examples are shown for each condition. Scale bar, 10 µm. Image levels were adjusted identically. (C) Mean KIF1C-microtubule co-localization measured by Pearson's correlation over KIF1C segmented objects from cells such as those shown in B (error bars = SE, >80 cells/condition). CFP-KIF1C-350 + Rab6A was statistically different from the other populations (p < 0.001). Below, average total fluorescence intensity of CFP-KIF1C and mCherry-Rab6A from similarly treated cells fixed in paraformaldehyde and quantified (error bars = SE, >100 cells/condition). Differences in total KIF intensity were not statistically significant between any of the populations (p > 0.05). Total Rab6A intensity was not statistically significant between the non-treated populations or between the treated populations (p > 0.05).
Figure 7 with 1 supplement

Loss of KIF1C affects Rab6A vesicle motility.
Vero cells transfected with control- (30 cells) or KIF1C- (29 cells) siRNA followed by pEGFP-Rab6A (∼300 vesicles imaged per cell). U-track 2.1.0 was used to segment, track, and characterize vesicles. Motion analysis was used to segment tracks into confined (>750 per condition) and linear populations (>70 per condition). (A) Traces of confined tracks in representative KIF1C- and control-siRNA cells. One frame from pEGFP-Rab6A videos (cells outlined in white) was overlaid with the identified confined tracks (blue). The confinement area for the random motion of each track is outlined (white circles). Scale, 10 µm. (B) Life history plots of linearly moving tracks from cells transfected with the indicated siRNAs. Five tracks were taken randomly for each population. (C) Quantitation of the confinement area as shown in A, error bars = SE (p < 0.05). (D) Quantitation of the speed of linear tracks as shown in B. The speed of each track was computed as the mean of the track's displacement divided by time between frames; error bars = SE (p < 0.0001). (E) Mean number of direction changes per second in linear tracks. Principle component analysis was used to find the main components of each track. Direction changes were tabulated each time a track shifted from positive to negative along the main component excluding periods of pausing (speeds less than 0.1 µ/s), error bars = SE (p < 0.0001).
Figure 7—figure supplement 1
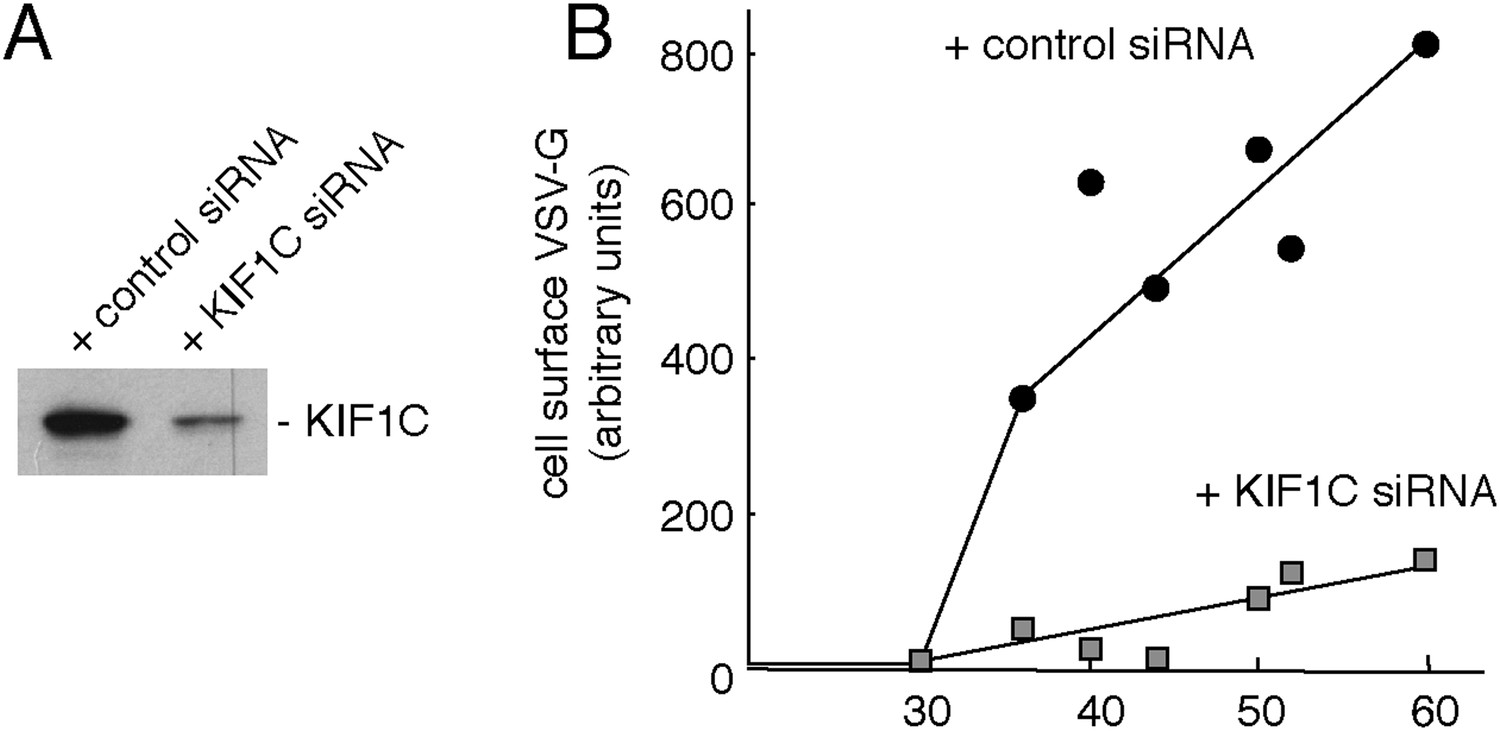
Depletion of KIF1C impairs Golgi-to-cell surface transport.
(A) Immunoblot from siRNA-treated HeLa cells. (B) Surface VSV-G protein normalized to total VSV-G of the sample in KIF1C- (gray square) or control- (black circle) siRNA-treated HeLa cells, n = 3.
Figure 8 with 2 supplements
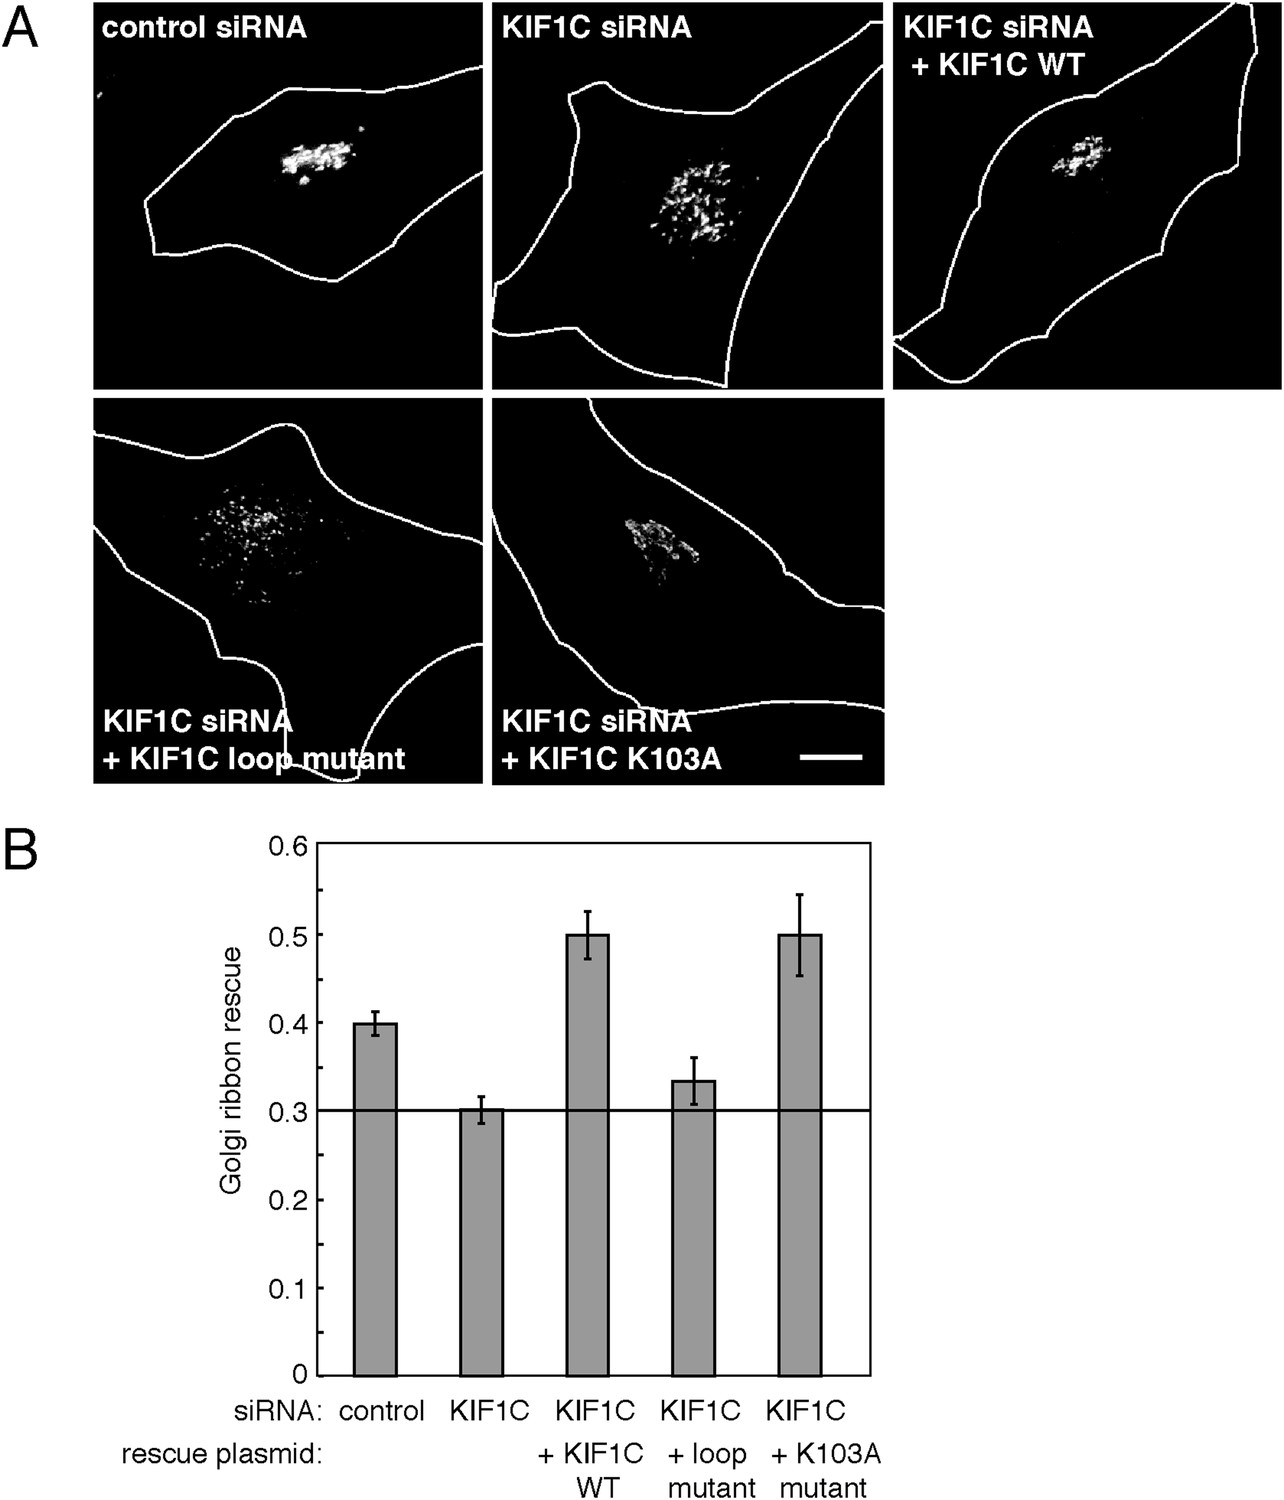
KIF1C's N-terminal Rab6A binding site is required for the maintenance of Golgi morphology.
(A) Golgi morphology (p115) of HeLa cells transfected with control siRNA or KIF1C siRNA and the indicated rescue plasmid. Scale bar, 10 µm. (B) Golgi ribbon rescue, defined as the mean fraction of Golgi staining present as large objects (>4.11 µm²), normalized by KIF1C intensity, quantified from cells such as those shown in A (bars = SE, >90 cells/condition). KIF1C wild-type rescue cells were statistically different from KIF1C depleted and loop mutant rescue cells but not those rescued with KIF1C K103A (p < 0.001).
Figure 8—figure supplement 1
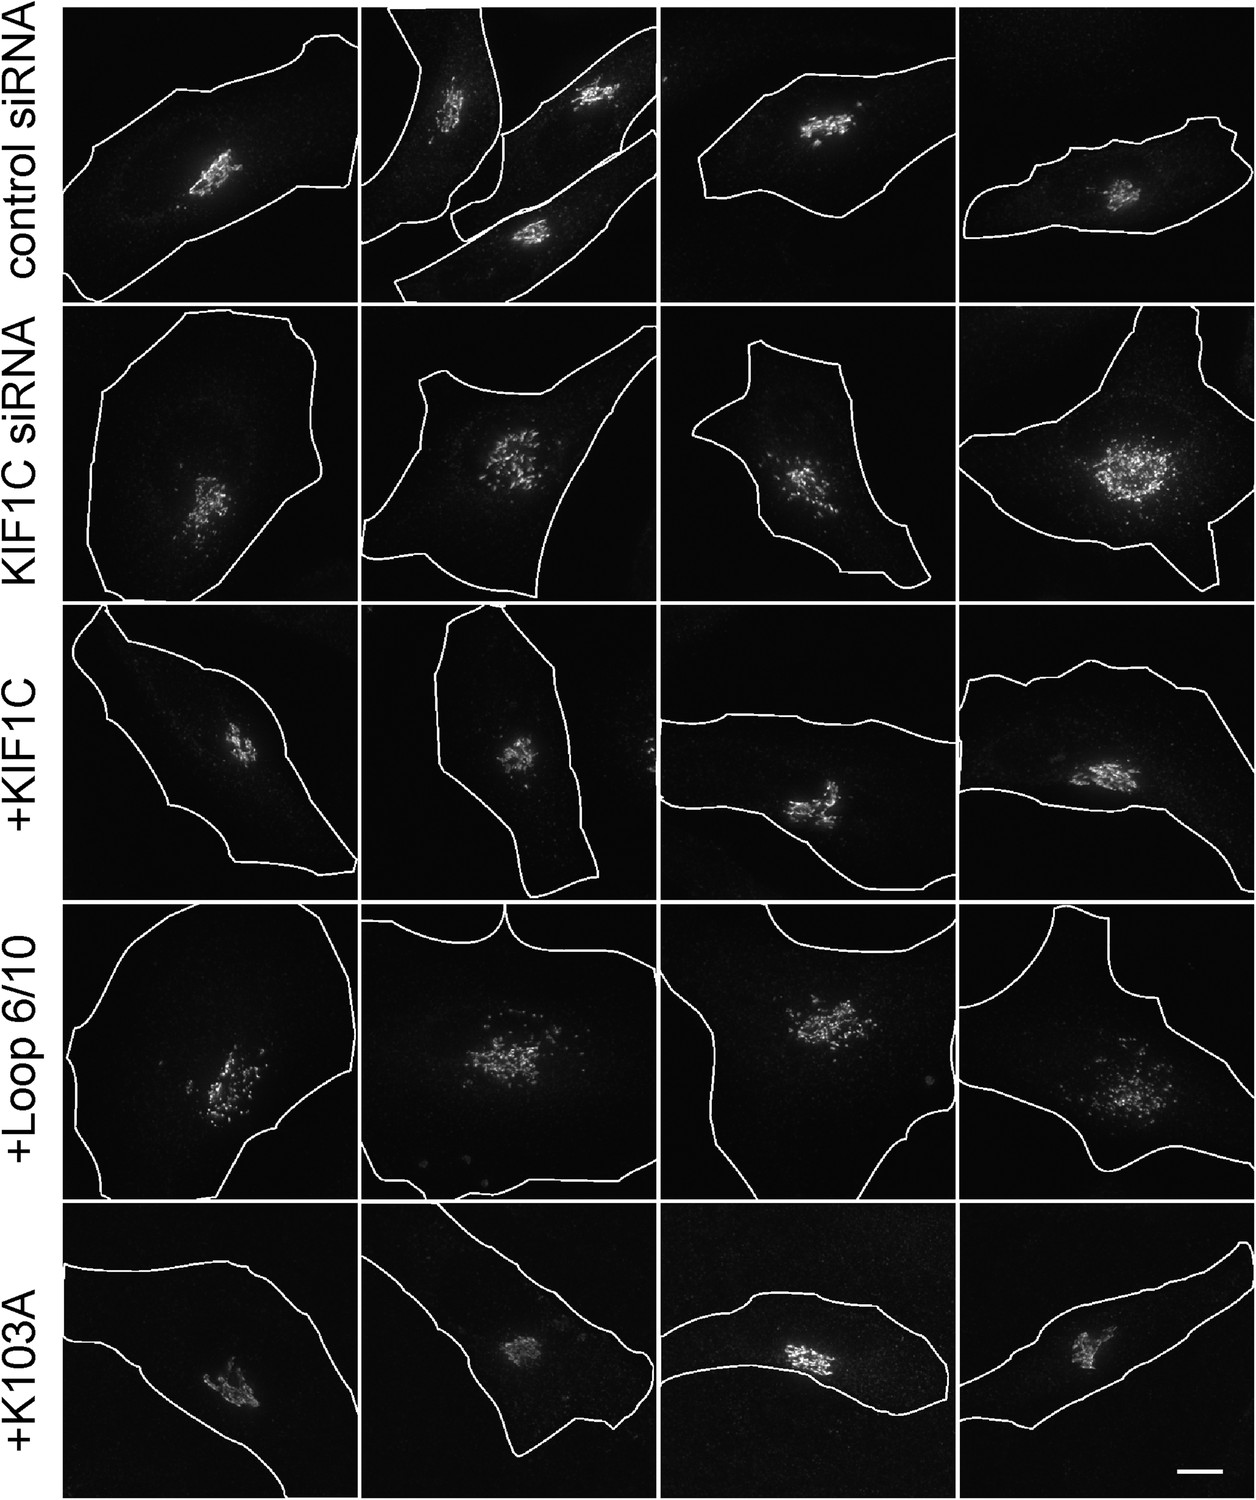
siRNA rescue shows that KIF1C's N-terminal Rab6A binding site is required for the maintenance of Golgi morphology.
Golgi morphology (p115) of HeLa cells transfected with control siRNA or KIF1C siRNA and the indicated rescue plasmid. Scale bar, 10 µm. One cell of each type is also shown in Figure 8.
Figure 8—figure supplement 2
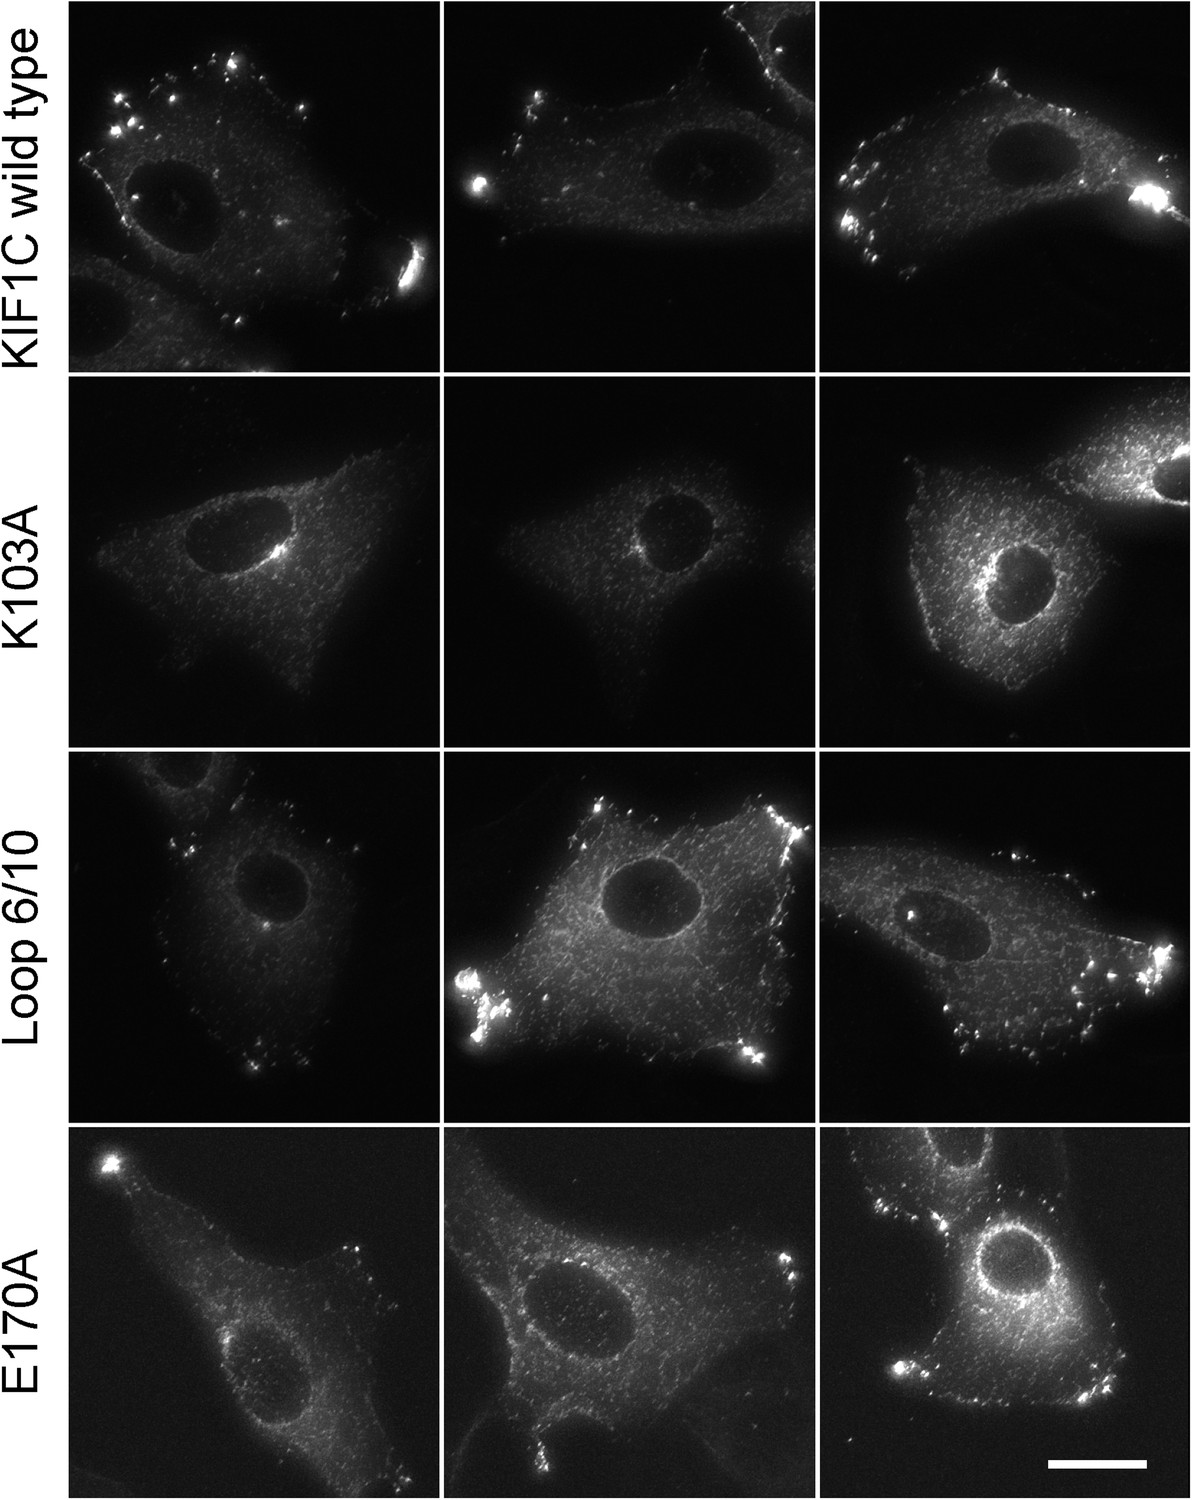
Full-length KIF1C mutant protein localization.
Vero cells transfected with the indicated CFP-tagged full-length KIF1C construct were MeOH fixed and imaged by fluorescence microscopy. Scale bar is 20 µm.
Figure 9 with 1 supplement
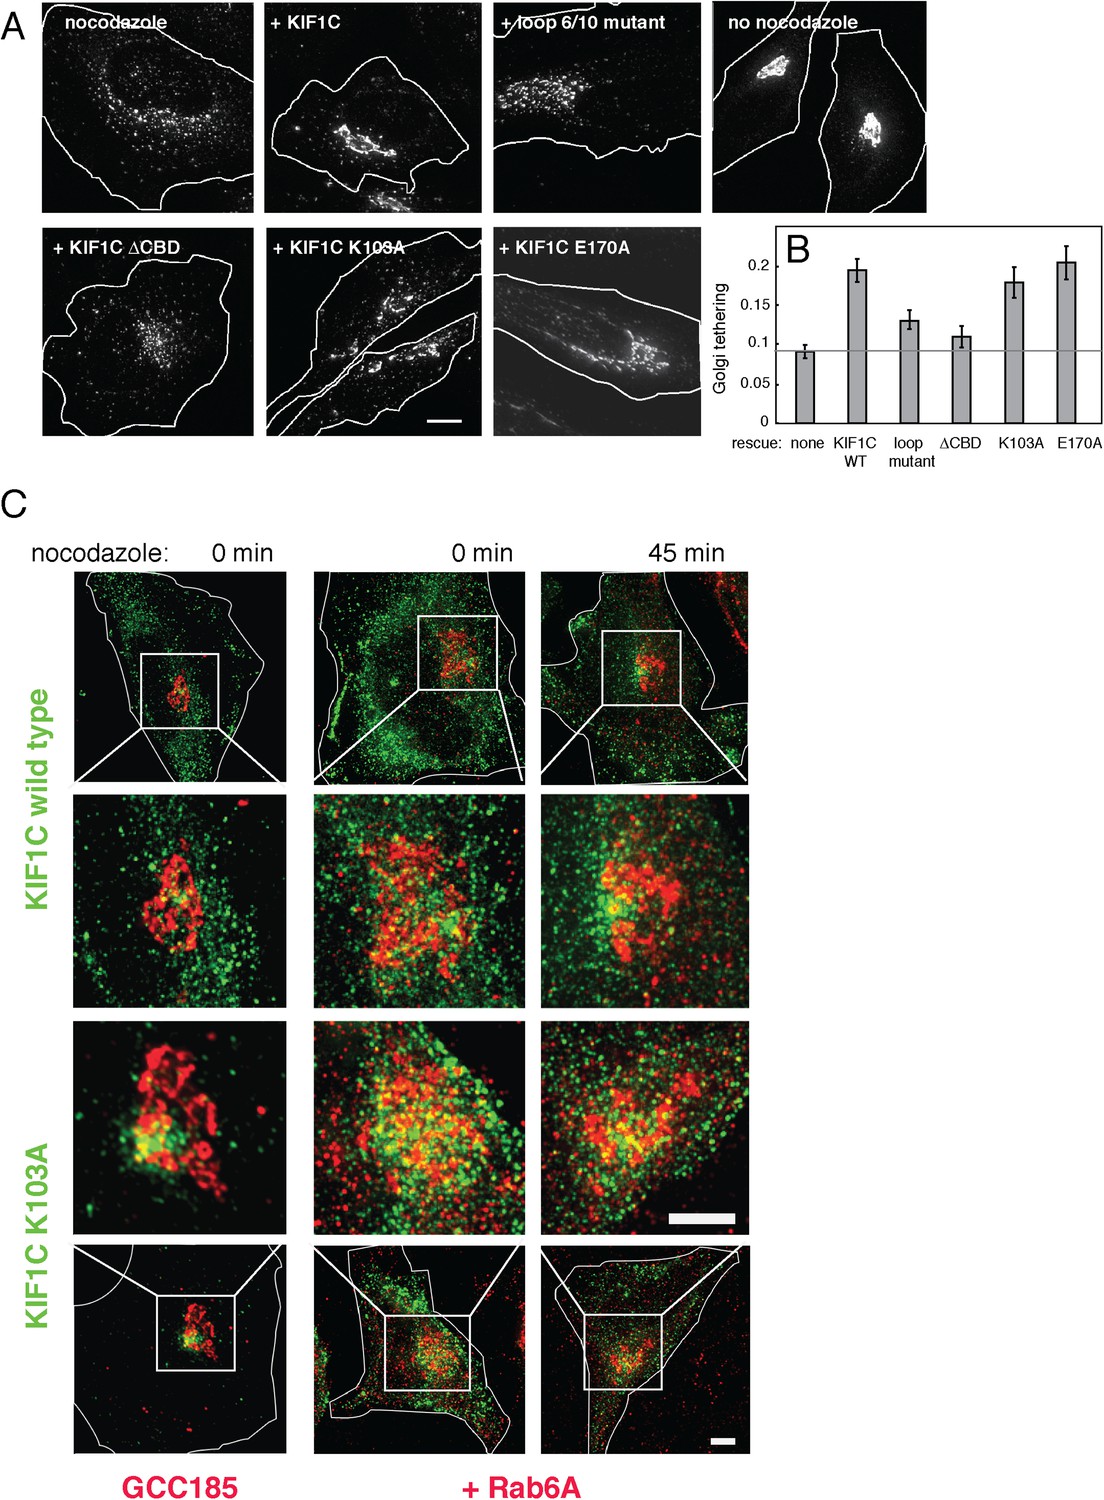
KIF1C over-expression stabilizes the Golgi in nocodazole treated cells.
(A) Golgi morphology of HeLa cells incubated with or without nocodazole in the presence of the indicated over-expressed KIF1C construct. Scale bar, 10 µm. (B) Golgi structure maintenance, defined as the mean fraction of Golgi staining present in large objects (>2.74 µm²), normalized by KIF1C intensity, in nocodazole-treated cells (bars = SE, >85 cells/condition). KIF1C wild type over-expressing cells were statistically different from KIF1C loop mutant and ΔCBD cells but not KIF1C K103A expressing cells (p < 0.01). (C) Perinuclear KIF1C forms contacts with the Golgi. CFP-KIF1C-transfected cells in the presence (left column) or absence (right columns) of co-transfected mCherry-Rab6A were incubated with nocodazole for the indicated times and treated with liquid nitrogen prior to fixation to release cytosolic proteins. KIF1C localization (wild type or K103A as indicated, green) was monitored in relation to the trans Golgi marker, GCC185 or to the co-expressed mCherry-Rab6A (red). Magnified areas are indicated with a box and shown in the middle two rows. Scale bars, 5 µm.
Figure 9—figure supplement 1
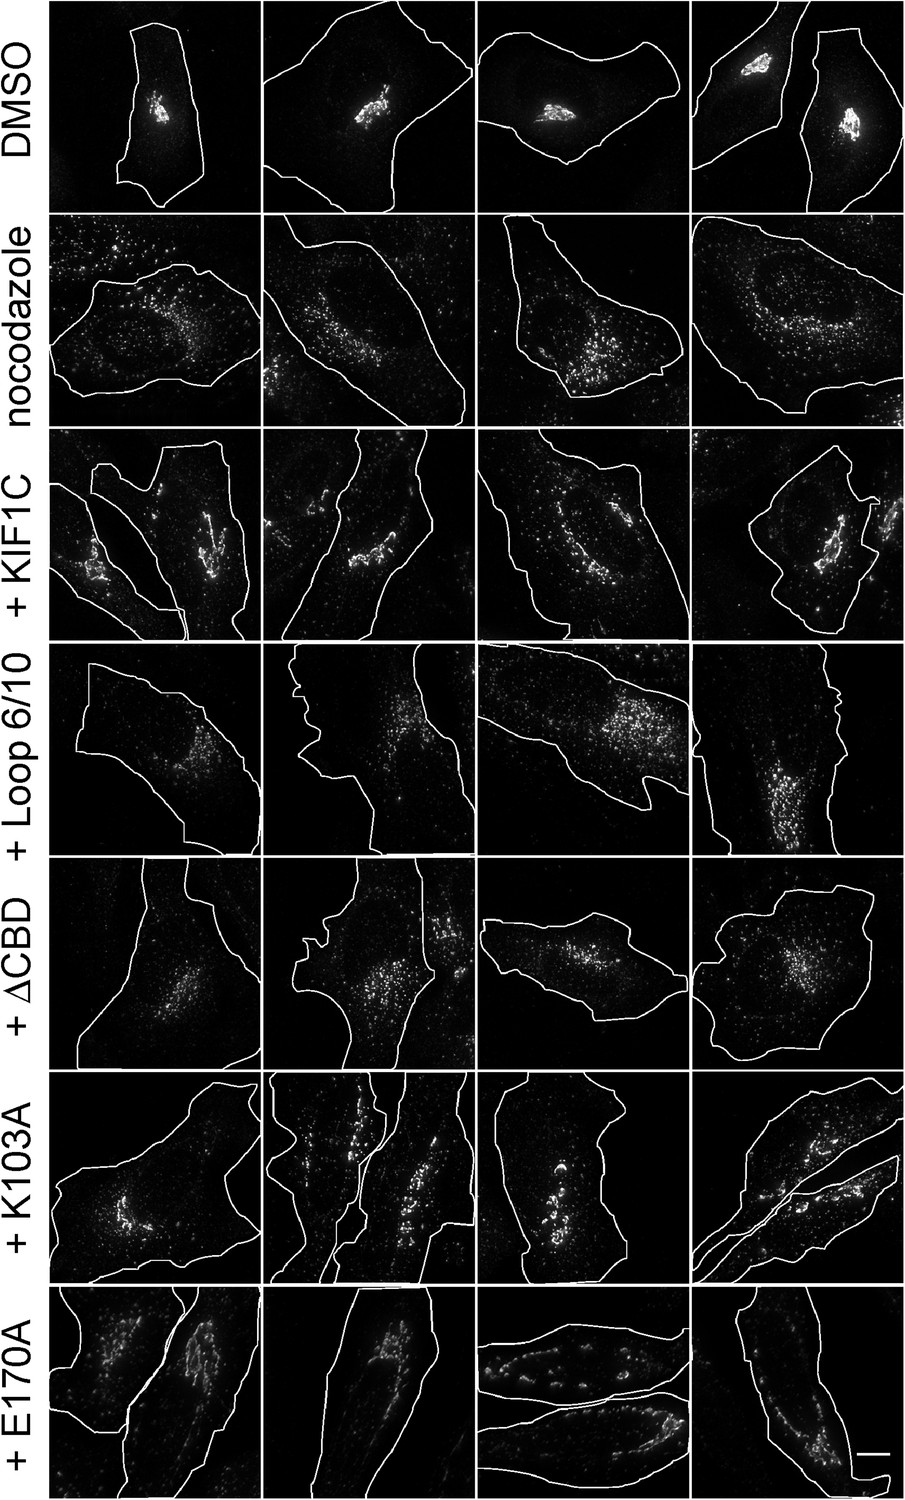
KIF1C over-expression stabilizes the Golgi in nocodazole-treated cells.
Golgi morphology of HeLa cells incubated with or without nocodazole in the presence of the indicated over-expressed KIF1C construct. Scale bar, 10 µm. One cell of each type is also shown in Figure 9.
Author response image 1

Videos
Video 1
Time-lapse imaging of KIF1C (green) motility on microtubules (blue) in vitro in the absence (right) or presence (left) of Rab6.
More KIF1C motors can be seen under control conditions. More motors are moving. The time lapse covers 300 frames (12.3 s) and is sped up slightly (video is 10 s). Scale bar, 5 μm. (QuickTime; 11.6 MB).
Video 2
Live cell imaging of pEGFP-Rab6 transfected Vero cells after KIF1C- (left) or control- (right) siRNA treatment.
The large bright mass near the center is the Golgi and vesicles are seen as smaller punctate structures. The time lapse covers 71 frames (142 s) and is sped up 14 fold. Scale bar, 10 μm. (QuickTime; 5.7 MB).
Download links
A two-part list of links to download the article, or parts of the article, in various formats.
Downloads (link to download the article as PDF)
Open citations (links to open the citations from this article in various online reference manager services)
Cite this article (links to download the citations from this article in formats compatible with various reference manager tools)
The Rab6-regulated KIF1C kinesin motor domain contributes to Golgi organization
eLife 4:e06029.
https://doi.org/10.7554/eLife.06029


