Hippocampal place cells construct reward related sequences through unexplored space
- University College London, United Kingdom
Figures
Figure 1 with 4 supplements
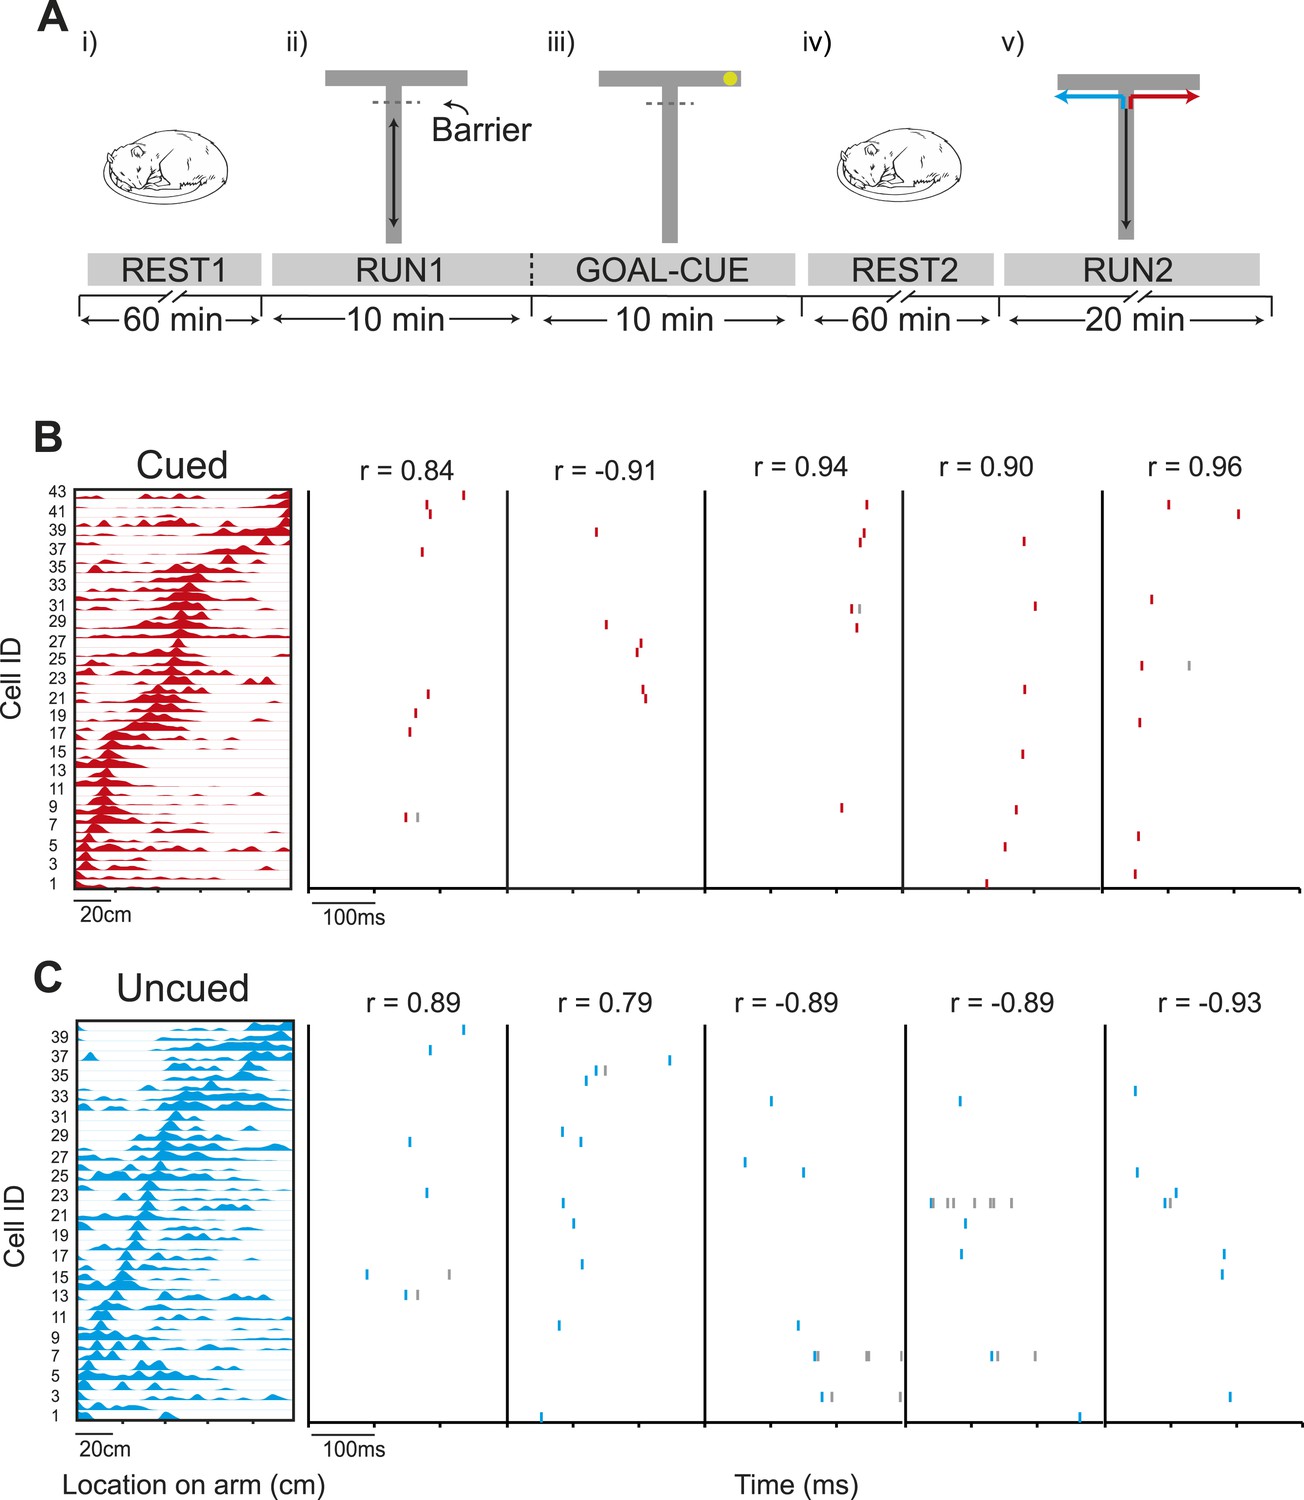
Preferential preplay of a behaviourally relevant, unvisited environment.
(A) Experimental protocol. (i) Prior to running on the track, the animals rested for at least an hour (REST1). (ii) Following REST1, animals ran 20 laps on the stem (RUN1). Access to the arms was blocked by a barrier at the end of the stem which the animals could see through but not pass. (iii) Following RUN1, the experimenter baited one arm so to provoke the animals' interest in that arm (GOAL-CUE). (iv) Following goal-cueing, the animal rested for at least another hour (REST2). (v) Following REST2, the barrier was removed and the animals traversed the extent of the track, in alternate L-shaped laps (RUN2). (B) Left: an example template for a run to the cued arm. x-axis shows location on the track and y-axis cell IDs. Right: Example raster plots of preplay events—the title shows the correlation between the preplay event and the template sequence. C same as B but for the uncued template.
Figure 1—figure supplement 1
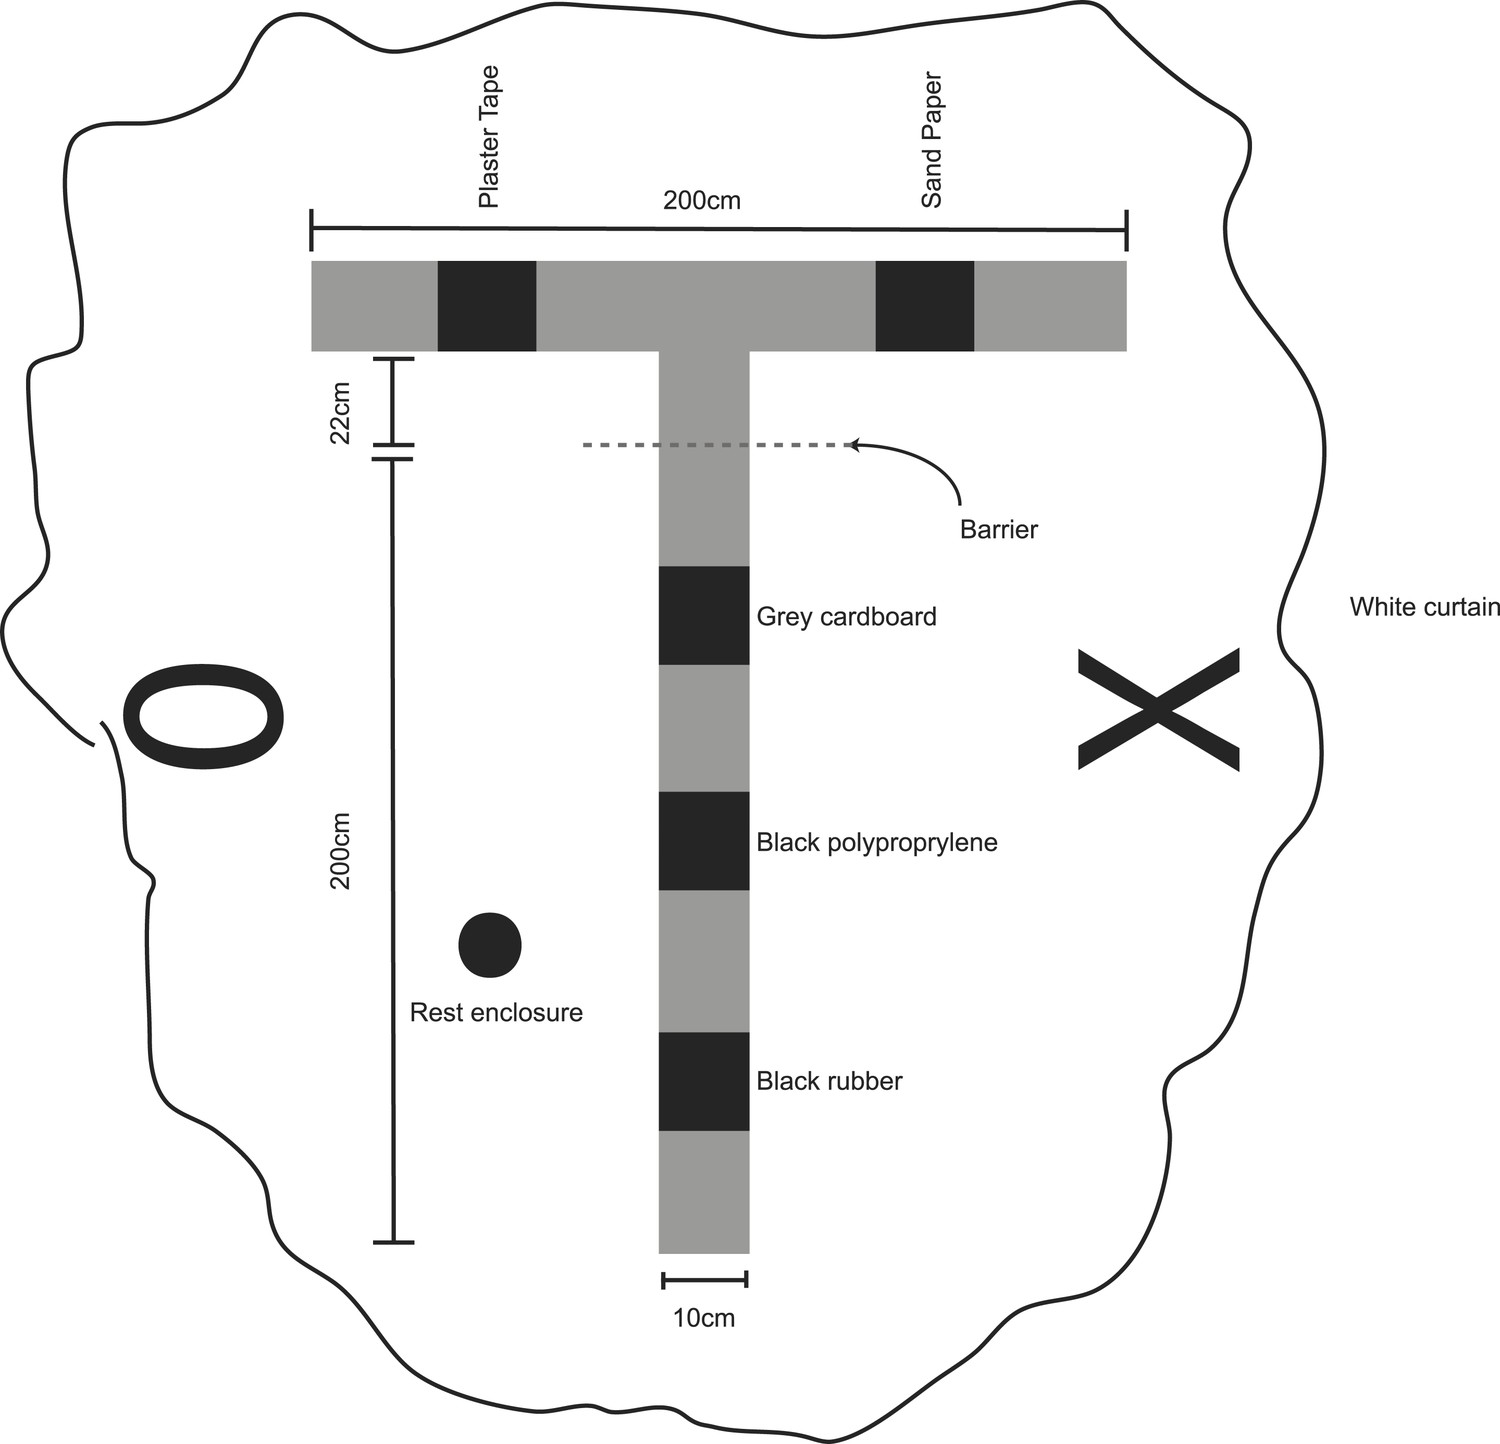
Schematic of experimental apparatus black rectangles on track represent texture cues, dotted line transparent barrier, circle rest enclosure (18 cm wide), wiggly border demarcates the white curtains surrounding the environment, with distal landmarks fixed to the curtain (‘X’ and ‘0’).
Note, the rest enclosure was only present during rest periods.
Figure 1—figure supplement 2
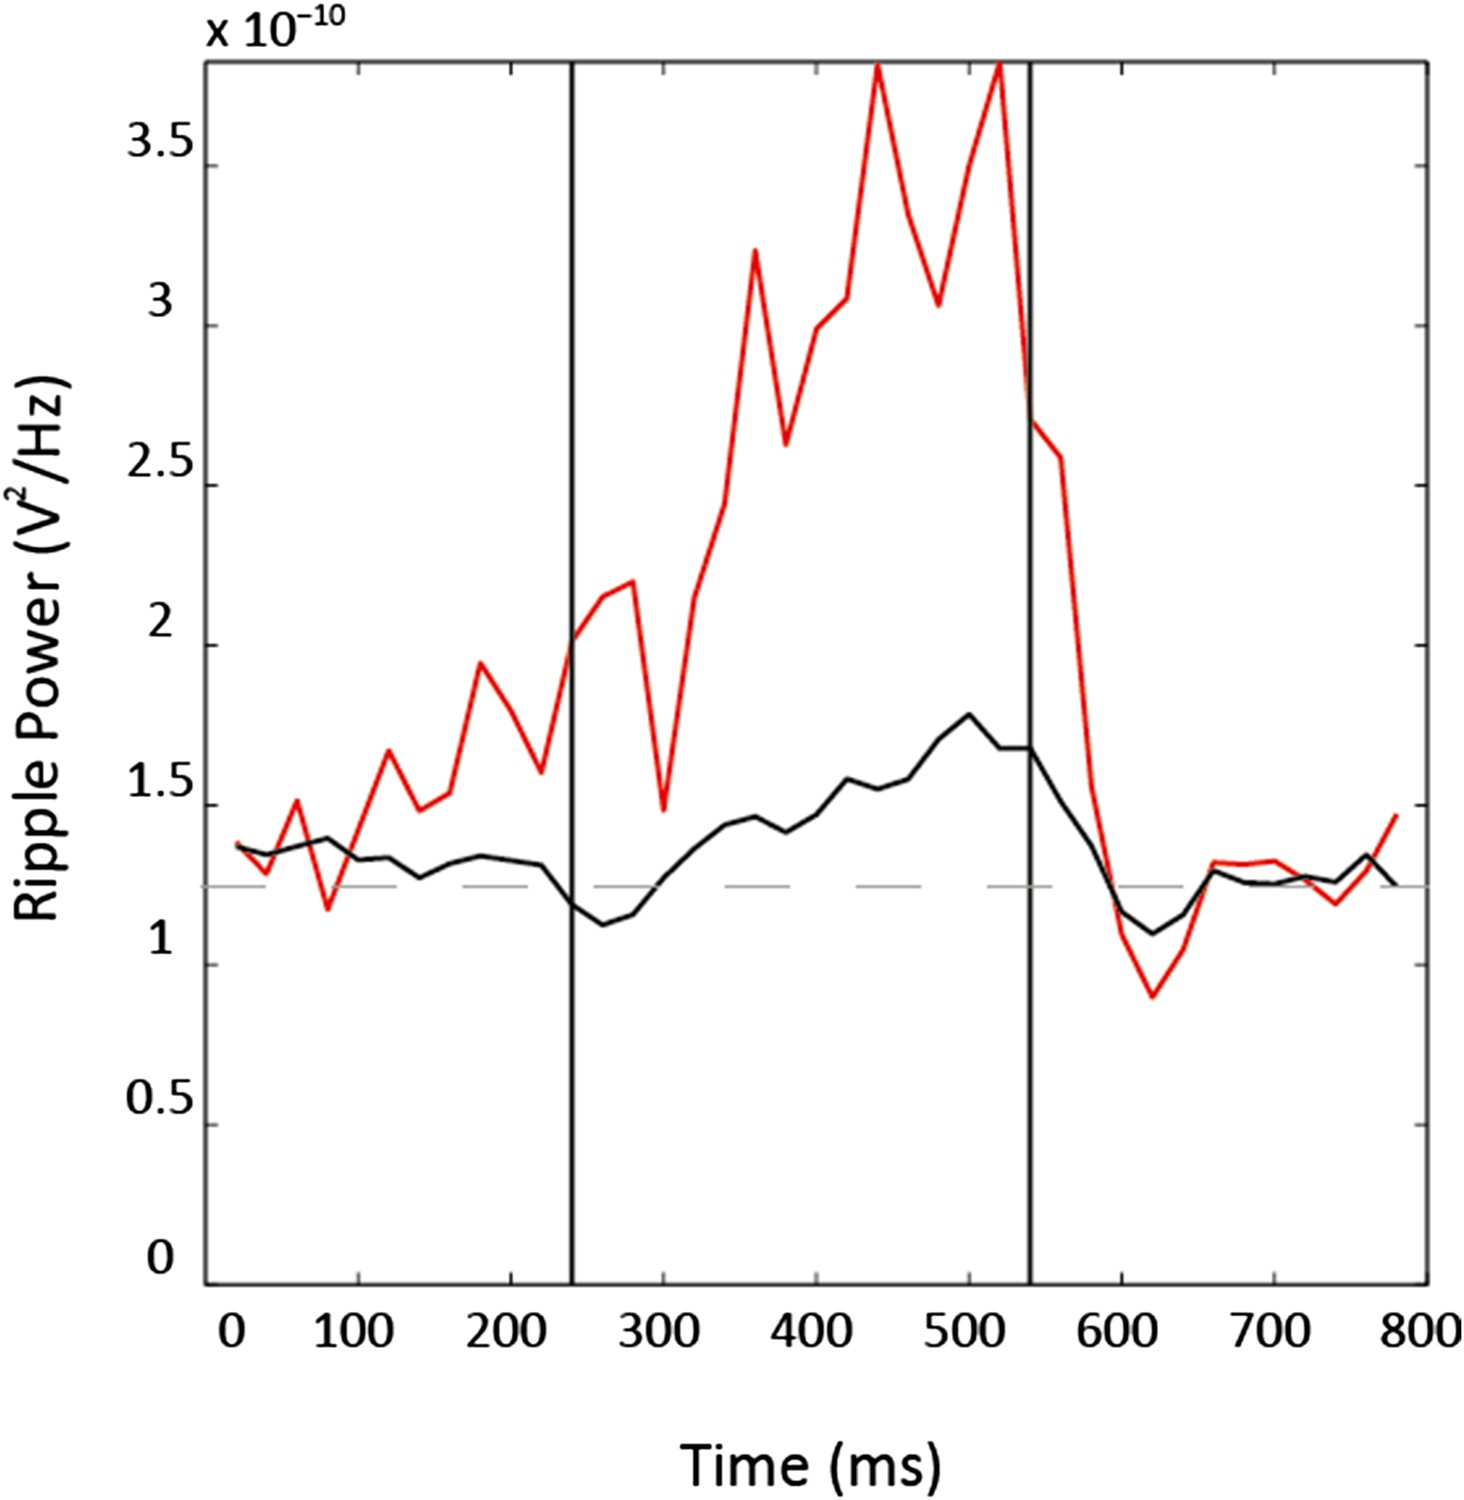
Ripple power is elevated during preplay events power in the ripple spectrum (80–250 Hz) is higher during preplay events (red) than during both non-significant spiking events (black, p < 0.001) and non-event periods (dashed line, p < 0.001).
Vertical lines represent start and end of spiking events.
Figure 1—figure supplement 3
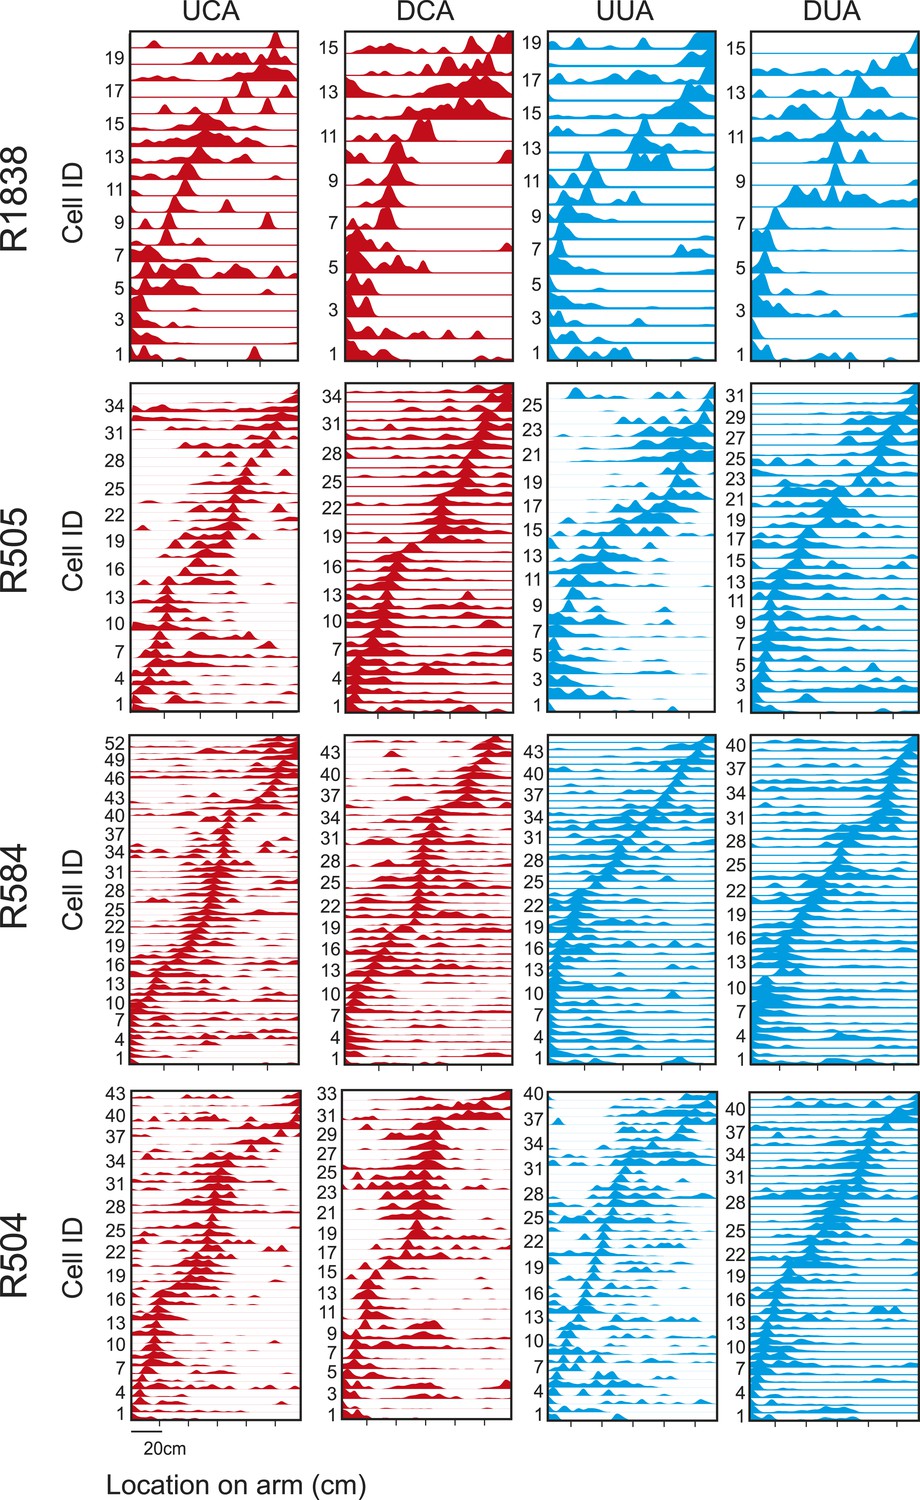
Place cell templates place cell sequences for each template.
Cells are ordered according to the location of their place field. x-axis shows location on arm (cm)—left side closer to the stem, and y-axis cell IDs. UCA = Up Cued Arm, DCA = Down Cued Arm, UUA = Up Uncued Arm, DUA = Down Uncued Arm.
Figure 1—figure supplement 4

Spiking events for cued arm in REST2 centre: bootstrapped cumulative distribution of (absolute) correlations between spiking events and the cued template in REST2 (red = data, black = shuffle).
Lighter areas of the curve show 1 standard deviation of the mean. Raster plots: spiking events of varying correlations with the future cued arm template. The title of each quadrant shows the correlation range for raster plots in that quadrant. Labels above the top row in each quadrant show which animal the spiking events belong to. Red rasters = first spike emitted from a cell in an event, grey rasters = consecutive spikes emitted from a cell.
Figure 2 with 2 supplements
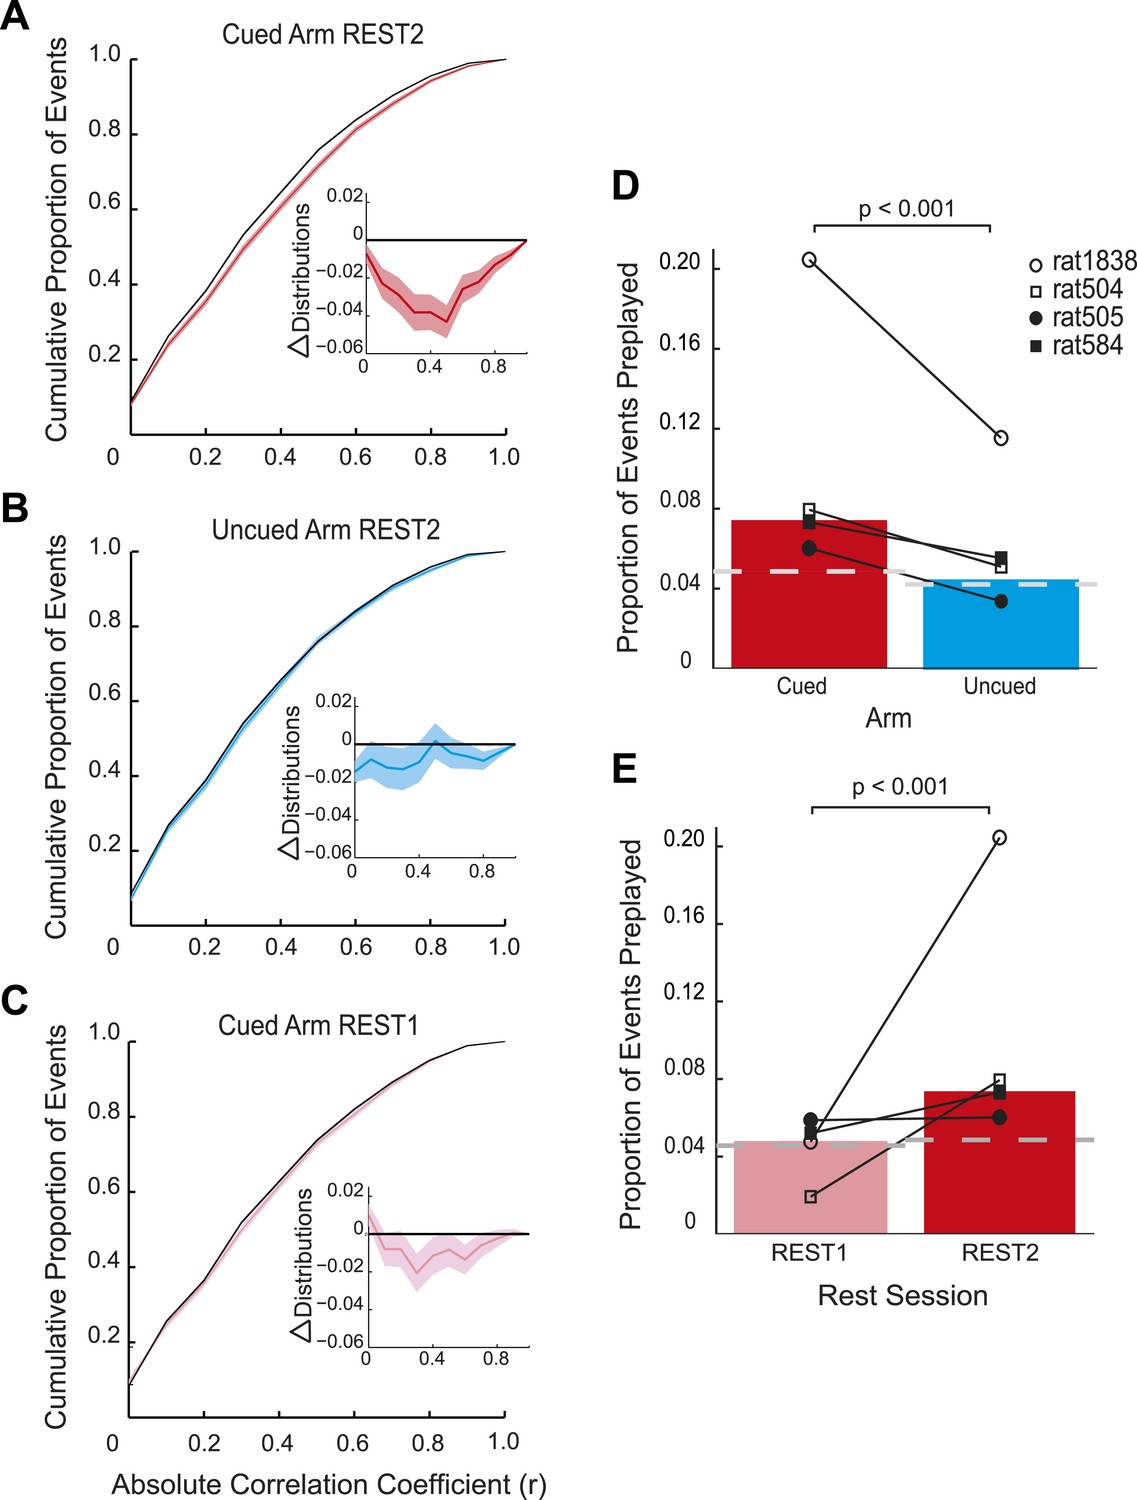
Preplay is a function of goal-cueing.
(A) Bootstrapped cumulative distribution of (absolute) correlations between spiking events and the cued template in REST2 (red = data, black = shuffle). Lighter areas of the curve show 1 standard deviation of the mean. Inset: difference between the data and shuffle distributions. If there are more high correlations in the data compared to the shuffle then the data distribution will deviate below the shuffle distribution. (B–C) same as A but for the uncued template in REST2 and the cued template in REST1, respectively. (D) Proportion of spiking events categorised as preplay events in REST2 for the cued and uncued arms. Bars show mean for all animals, and the black lines show the result for each animal. The grey dashed line shows the proportion of preplay events expected by chance. (E) Same as D but comparing proportion of preplay events for the cued template in REST1 and REST2.
Figure 2—figure supplement 1
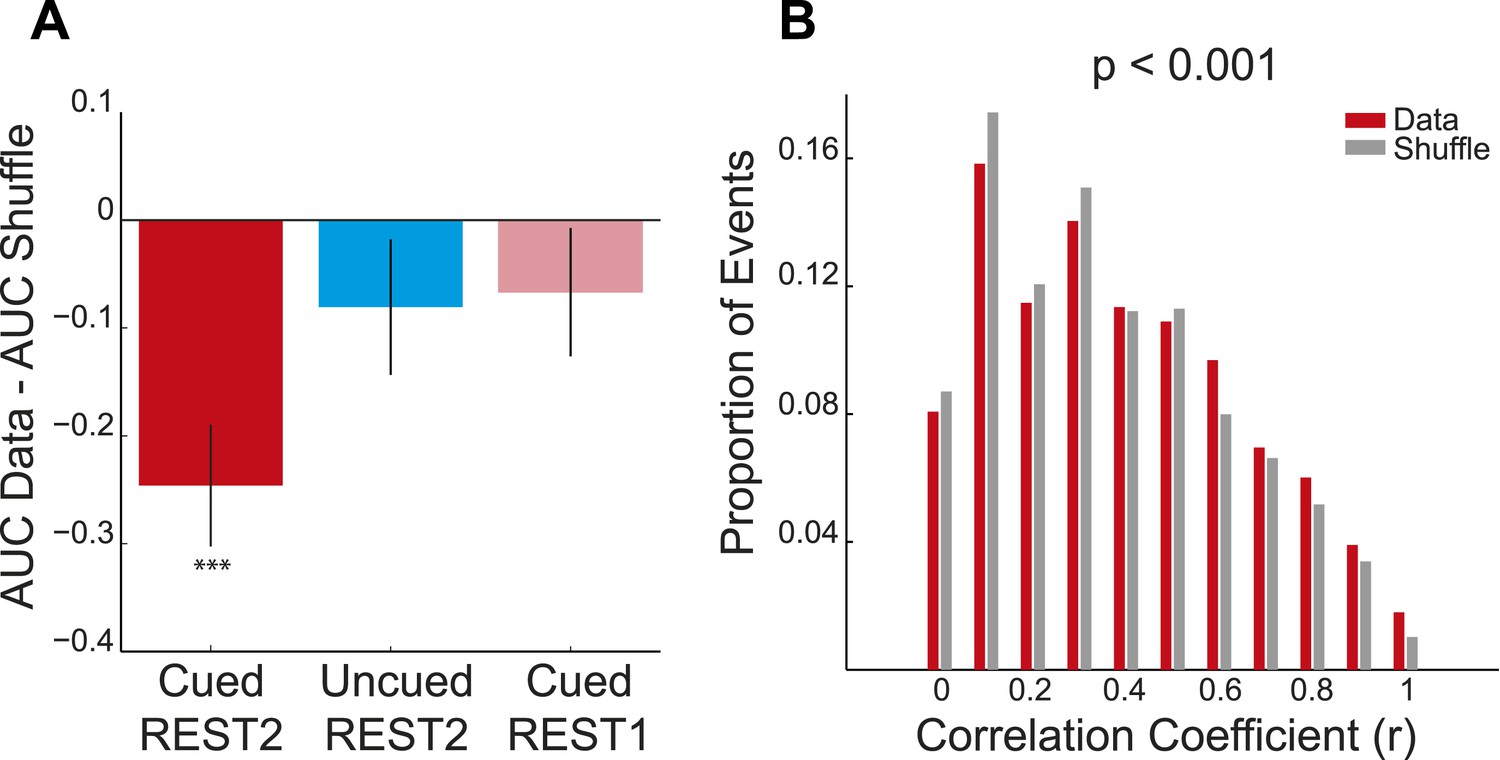
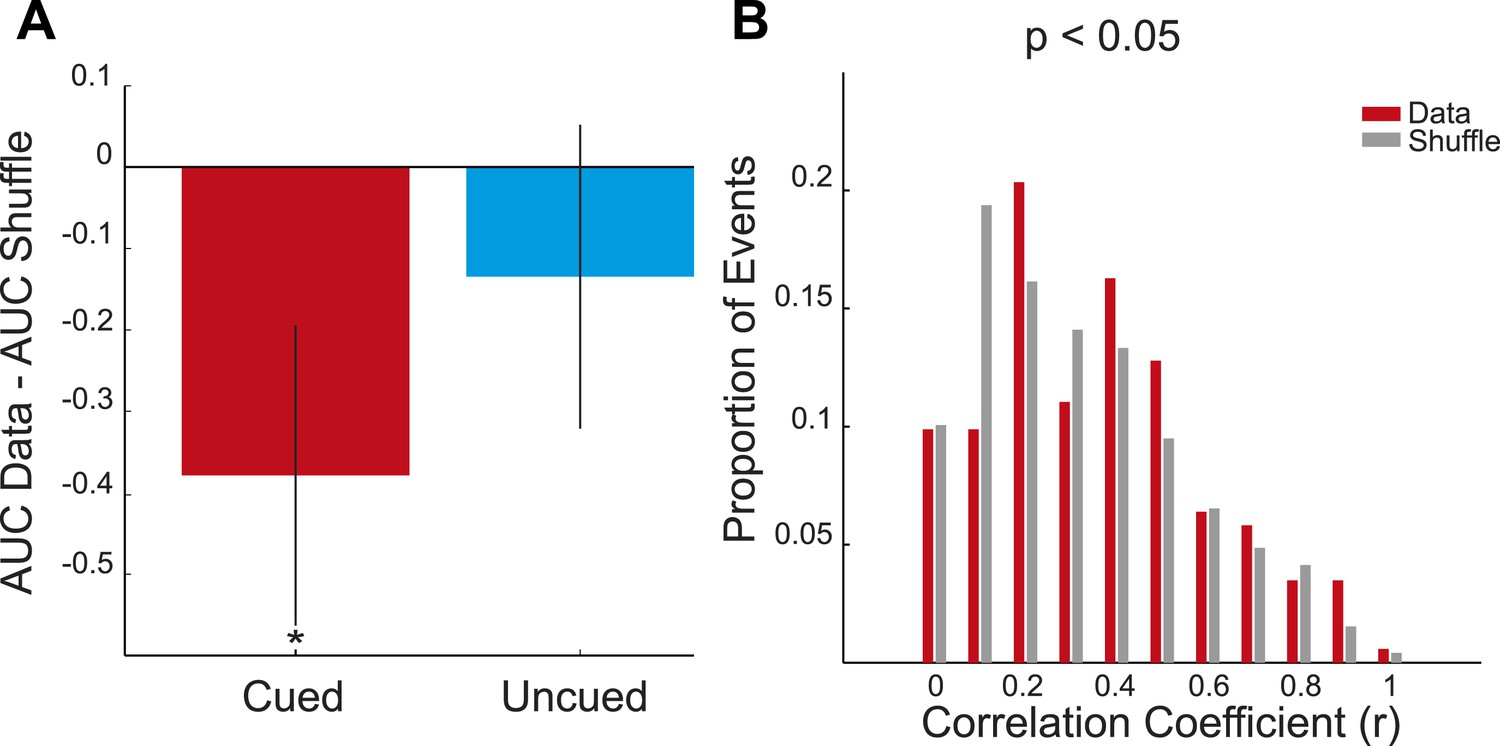
Preplay of cued arm in REST2—distribution-based analysis A mean difference between the bootstrapped cumulative distributions of absolute correlations for the data and the bootstrapped shuffle for the cued and uncued arms in REST2 and the cued arm in REST1.
If a place cell template is preplayed then the AUC of the data distribution should be smaller than that of the shuffled distribution (i.e., negative difference score). To assess significance we computed 95% confidence intervals for the difference scores (obtained by subtracting the AUC of the bootstrapped data from the AUC of the bootstrapped shuffle). If the confidence interval did not contain 0 we deemed the data distribution to be significantly different from the shuffle distribution. The distribution for the cued arm in REST2 was found to be significantly different from the shuffle (p < 0.001), yet that of the uncued arm in REST2 and the cued arm in REST1 were not (uncued REST2: p = 0.22, cued REST1: p = 0.14). Black lines on bars show one standard deviation, *** = p < 0.001. (B) Frequency distribution of absolute correlation coefficients between spiking events and future cued arm templates. Red bars represent data and the grey bars the shuffle distribution. p-value above histogram is based on a two-sample Kolmogorov–Smirnov test comparing the data distribution to the shuffle distribution.
Figure 2—figure supplement 2
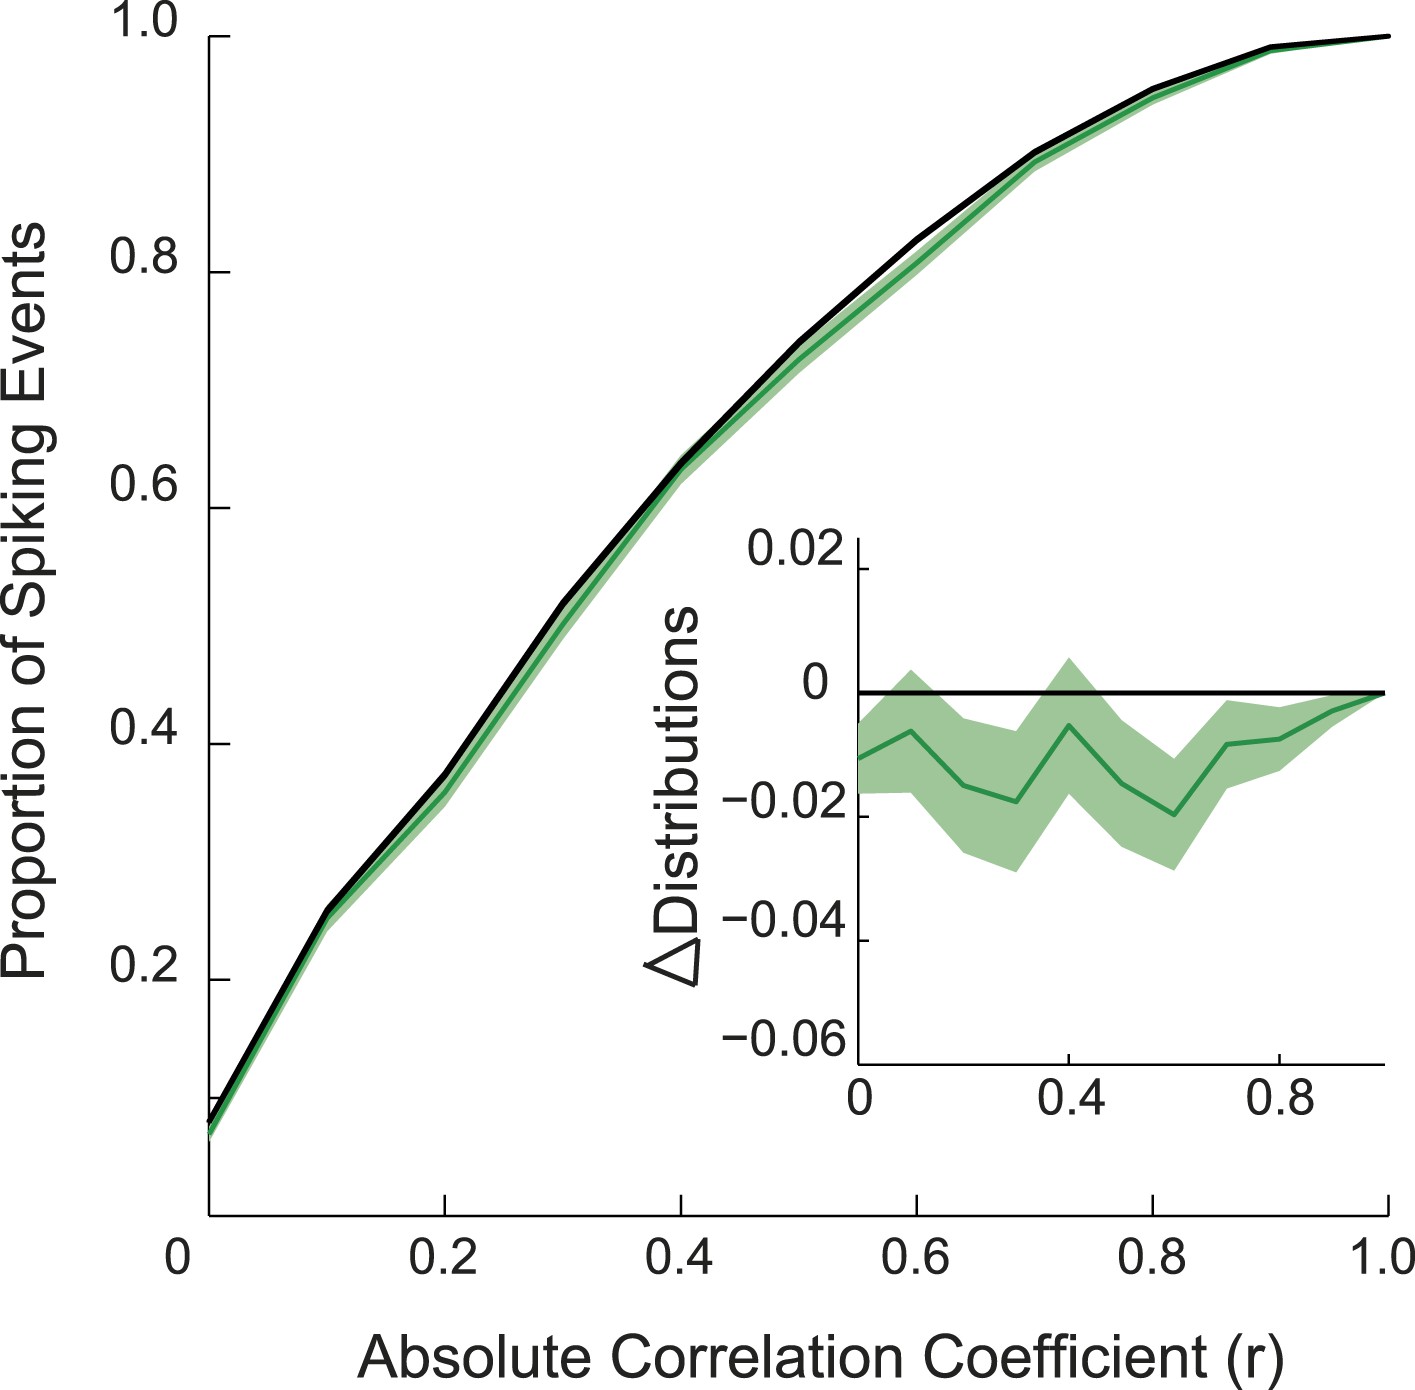
Preplay of stem during REST1 bootstrapped cumulative distribution of absolute correlations for spiking events of the stem, recorded during REST1.
Green line shows the data and the black line the bootstrapped distribution obtained after shuffling events 100 times. Light green regions show 1 standard deviation of the distribution. Inset: difference between the two distributions. If the stem was preplayed during REST1 then one would expect the data distribution to deviate below the shuffle distribution (p = 0.053, area under the curve (AUC) test).
Figure 3 with 4 supplements
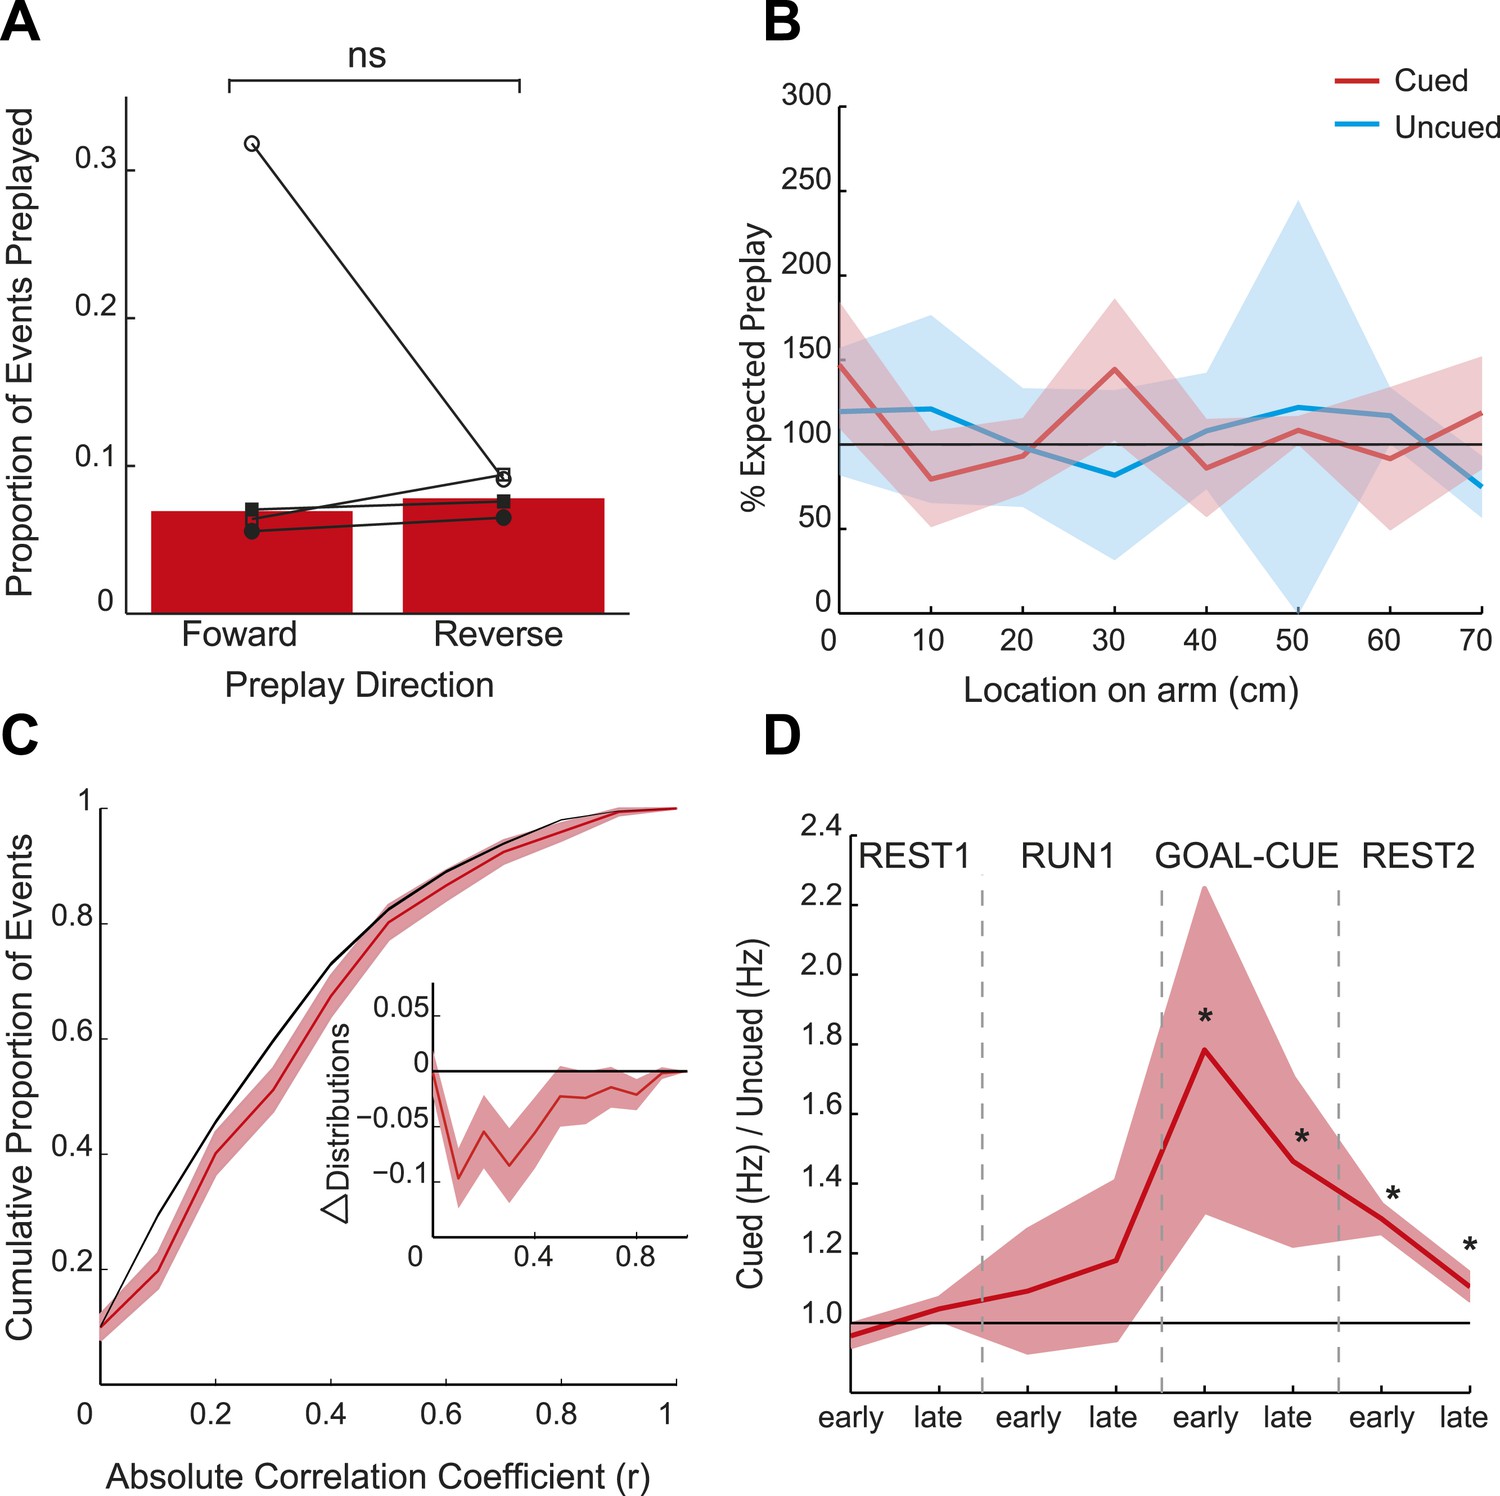
Spatial and temporal dynamics of preplay.
(A) The proportion of preplay events when negative (‘reverse’) and positive (‘forward’) spiking event correlations are analysed separately. Bars show means for all data and black lines the results for each animal. (B) Frequency of preplay events vs location on the cued (red) and uncued (blue) arms normalised by the density of place field centres—100% indicates the expected number of preplay events under an even distribution across each arm. No bias towards particular sections of the arms was evident (cued p = 0.22, uncued p = 0.15, based on a two-sample Kolmogorov–Smirnov test). Lighter areas show standard error of the mean (SEM) and the black line the expected distribution. (C) Bootstrapped cumulative distribution of (absolute) correlations between spiking events and the cued template during GOAL-CUE (red = data, black = shuffle). Lighter areas of the curve show 1 standard deviation of the mean. Inset: difference between the data and shuffle distributions. (D) Ratio of activity levels between cued and uncued arm cells (cued/uncued) during events for the first and second half of each experimental period. Red line shows mean ratio, derived from bootstrapped data, obtained for each period, and the shaded areas 1sd of the bootstrapped data. The black horizontal line indicates equal rates for the two arms. * = significantly different from 1 based on 95% confidence intervals.
Figure 3—figure supplement 1
Preplay of cued arm during GOAL-CUE—distribution-based analysis A mean difference between the cumulative distributions of absolute correlations for the bootstrapped data and shuffle for the cued and uncued arms during GOAL-CUE.
If a place cell template is preplayed then AUC of the data distribution should be smaller than that of the shuffled distribution (i.e., negative difference score). To assess significance we computed 95% confidence intervals for the difference scores. If the confidence interval did not contain 0 we deemed the data distribution to be significantly different from the shuffle distribution. The distribution for the cued arm was found to be significantly different from the shuffle (p = 0.02), yet that of the uncued arm was not (uncued p = 0.24). Black lines on bars show one standard deviation, * < 0.05. (B) Frequency distribution of absolute correlation coefficients between spiking events and future cued arm templates. Red bars represent data and the grey bars the shuffle distribution. p-value above histogram is based on a two-sample Kolmogorov–Smirnov test comparing the data distribution to the shuffle distribution.
Figure 3—figure supplement 2
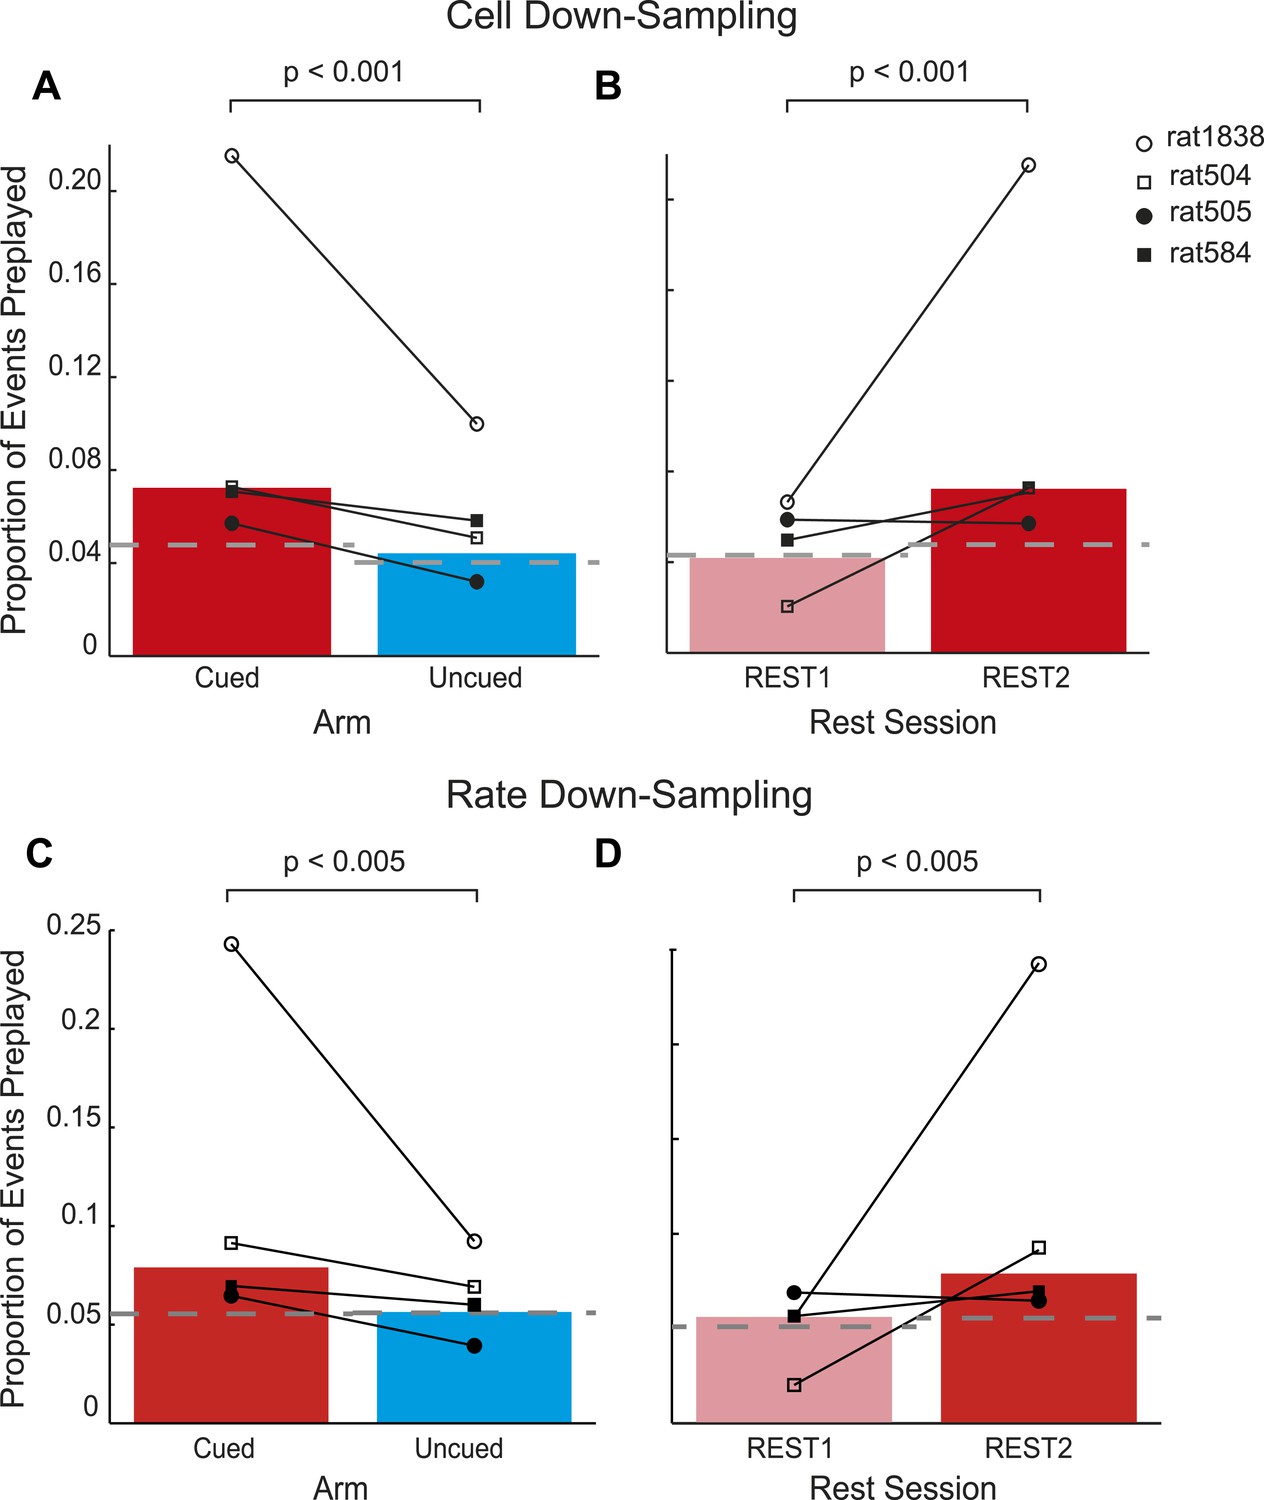
Preferential preplay of the cued arm is not confounded by the number and activity of cells on the cued arm.
(A) Proportion of preplay events for the cued and uncued arm in REST2 following down-sampling to equate the number of cells on the two arms. Bars show means, black lines the results for individual animals and the dashed grey lines the proportion of preplay events expected by chance. (B) same as a but comparing the proportion of preplay events for the cued arm in REST1 and REST2. C–D same as A–B but following down-sampling to equate firing rates during rest.
Figure 3—figure supplement 3
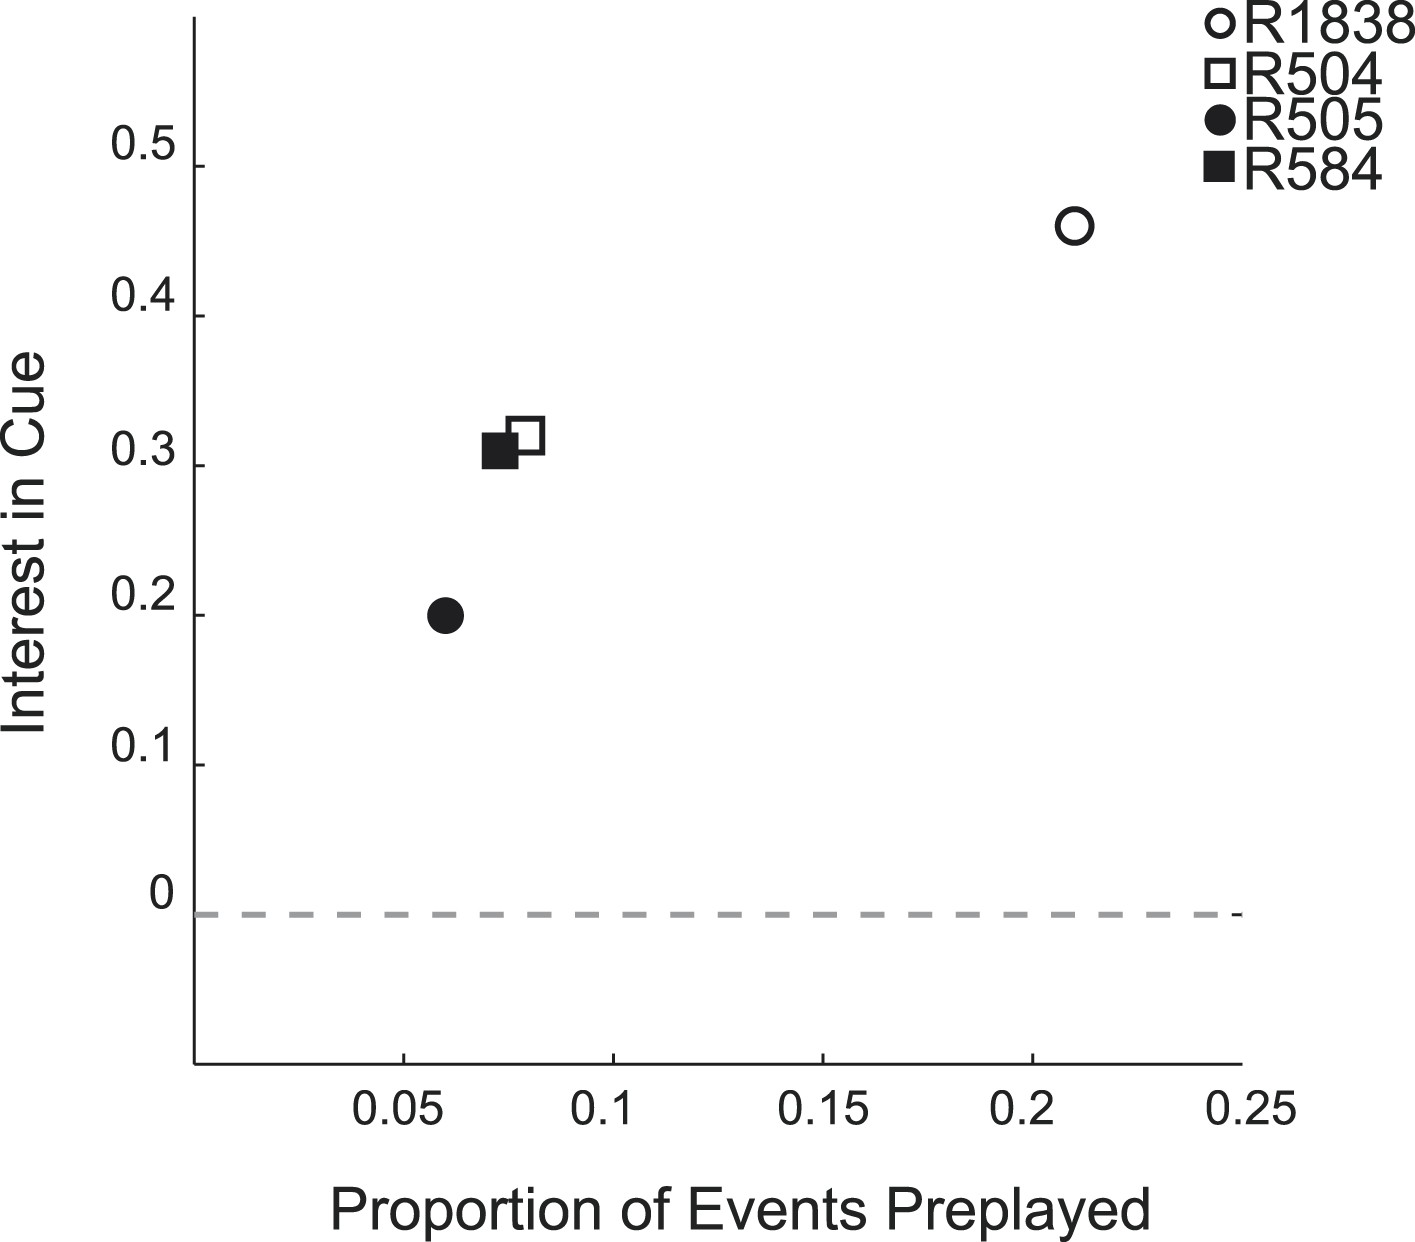
Animals' interest in cued arm during GOAL-CUE is associated with subsequent preplay for each animal.
The proportion of preplay events for the cued arm recorded during REST2 is shown plotted against that animal's interest in the cued arm assessed by body position during GOAL-CUE. −0 indicates animal showed equal interest in the cued and uncued arm, values above 0 indicate more interest in the cued arm. Animals exhibiting a greater interest in the cued arm subsequently appear to experience a greater proportion of preplay for that same arm (Spearman's rank order correlation r = 1, p = 0.0833, note correlation is based on only 4 data points).
Figure 3—figure supplement 4
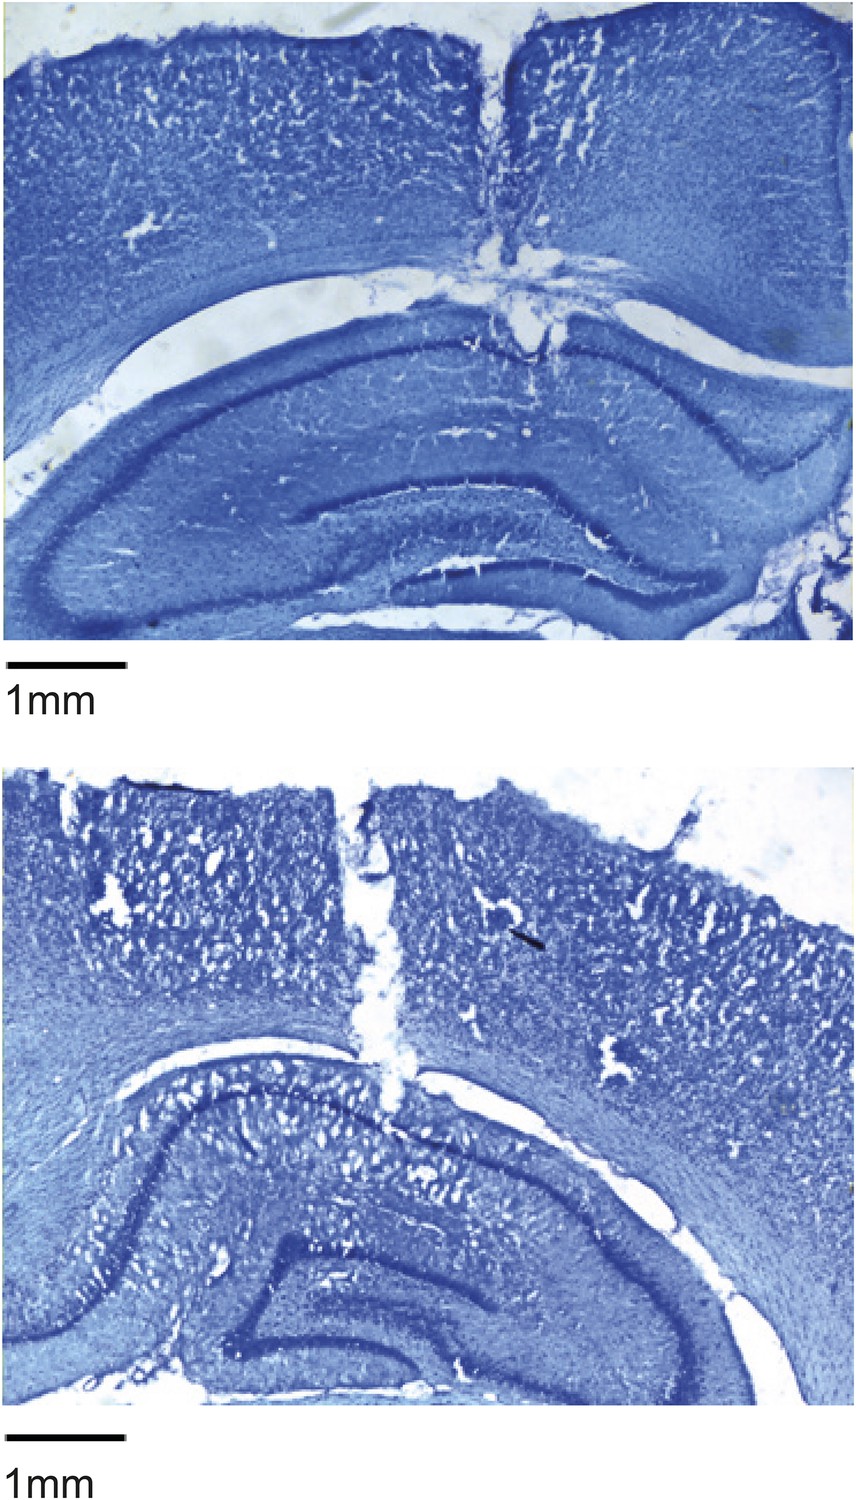
Tetrode tracts example histology showing the location of tetrode recording from area CA1 in rat R504.
Staining: cresyl violet.
Figure 4

Bayesian reconstruction confirms preferential cued arm preplay.
(A–B) Confusion matrices based on RUN2 data showing decoding accuracy for the cued (A) and uncued arms (B). Columns show the mean posterior probability distribution across the arm ordered by the true position of the rat (2 cm bins, data for R504). Decoding errors appear as power away from the identity diagonal—here both arms yield accurate estimates of the animal's position at all points on the track. (C–D) Representative preplay events for the cued (C) and uncued (D) arms showing, (left) the straight line trajectory that best fits the decoded event (x-axis indicates time bin (5 ms) within the event, y-axis position on arm, title indicates probability of obtaining a better trajectory by chance) and, (right) the null distribution of trajectory fits obtained by shuffling the cell identities for each event (x-axis, quality of trajectory fit, y-axis, proportion of shuffled events). (E) Proportion of spiking events categorised as preplay events for the cued and uncued arms in REST2. Bars show mean for all data with SEM. (F) Same as E but comparing preplay in REST1 and REST2 for the cued arm.
Tables
Table 1
Experimental parameters
| R1838 | R505 | R584 | R504 | All rats (mean) | |
|---|---|---|---|---|---|
| Cue bias (dwell time) | |||||
| RUN1 | 0.33 | 0.32 | −0.05 | −0.20 | 0.10 |
| GOAL-CUE | 0.46 | 0.20 | 0.31 | 0.32 | 0.33 |
| Cue bias (looking time) | |||||
| RUN1 | −0.09 | −0.02 | 0.01 | −0.36 | −0.11 |
| GOAL-CUE | 0.06 | 0.31 | 0.09 | 0.05 | 0.13 |
| RUN2 arm bias | |||||
| RUN2 | 1.0 | 0.84 | 1.0 | 1.0 | 0.96 |
| Session duration (min) | |||||
| SLEEP1 | 60 | 88 | 75 | 74 | 74 |
| RUN1 | 13 | 10 | 13 | 9 | 11 |
| GOAL-CUE | 10 | 17 | 12 | 11 | 13 |
| SLEEP2 | 60 | 67 | 71 | 60 | 65 |
| RUN2 | 34 | 19 | 35 | 31 | 30 |
| Template length (number of cells) | |||||
| Up cued arm | 20 | 36 | 53 | 43 | 38 |
| Down cued arm | 15 | 35 | 45 | 33 | 32 |
| Up uncued arm | 19 | 26 | 45 | 40 | 33 |
| Down uncued arm | 15 | 32 | 41 | 43 | 33 |
Table 2
REST period results
| Animal | Arm | # spiking events | # preplay events | % preplay | % chance | p-value |
|---|---|---|---|---|---|---|
| REST2 | ||||||
| R1838 | Cued | 44 | 9 | 20.45 | 6.86 | 6.56 × 10⁻⁴ |
| Uncued | 26 | 3 | 11.54 | 6.77 | 0.10 | |
| R505 | Cued | 631 | 38 | 6.02 | 4.57 | 0.037 |
| Uncued | 860 | 29 | 3.37 | 3.82 | 0.72 | |
| R584 | Cued | 437 | 32 | 7.32 | 4.73 | 6.20 × 10⁻³ |
| Uncued | 398 | 22 | 5.53 | 4.74 | 0.19 | |
| R504 | Cued | 516 | 41 | 7.95 | 5.15 | 0.0027 |
| Uncued | 373 | 19 | 5.09 | 4.40 | 0.21 | |
| All rats | Cued | 1628 | 120 | 7.37 | 4.86 | 4.12 × 10⁻⁶ |
| Uncued | 1657 | 73 | 4.41 | 4.22 | 0.33 | |
| REST1 | ||||||
| R1838 | Cued | 63 | 3 | 4.76 | 7.05 | 0.66 |
| Uncued | 35 | 2 | 5.71 | 7.37 | 0.48 | |
| R505 | Cued | 664 | 39 | 5.87 | 4.34 | 0.025 |
| Uncued | 1215 | 38 | 3.13 | 3.45 | 0.70 | |
| R584 | Cued | 269 | 14 | 5.20 | 4.67 | 0.28 |
| Uncued | 247 | 21 | 8.50 | 4.72 | 0.0035 | |
| R504 | Cued | 311 | 6 | 1.93 | 4.44 | 0.99 |
| Uncued | 173 | 11 | 6.36 | 4.21 | 0.063 | |
| All rats | Cued | 1307 | 62 | 4.74 | 4.56 | 0.34 |
| Uncued | 1670 | 72 | 4.31 | 3.80 | 0.12 | |
-
Summary results from REST1 and REST2 for the cued and uncued arms for individual animals. # Spiking events = total number of spiking events recorded. # preplay events = number of significant spiking events. % preplay = Proportion of the spiking events that qualified as preplay events (i.e., that were significant), expressed as a percentage. % chance = proportion of spiking events from the shuffled data that qualified as preplay events, expressed as a percentage. p-value = probability, derived from a binomial test, of obtaining the observed number of preplay events for each template given the chance level calculated from the shuffled data.
Table 3
REST1 stem results
| Animal | # spiking events | # preplay events | % preplay | % chance | p-value |
|---|---|---|---|---|---|
| R1838 | 68 | 3 | 4.41 | 6.01 | 0.59 |
| R505 | 980 | 35 | 3.57 | 4.03 | 0.74 |
| R584 | 329 | 17 | 5.17 | 4.53 | 0.24 |
| R504 | 396 | 18 | 4.55 | 3.50 | 0.11 |
| All rats | 1773 | 73 | 4.12 | 4.08 | 0.44 |
-
Summary results from REST1 analysing preplay of the stem. # Spiking events = total number of spiking events recorded. # Preplay events = number of significant spiking events. % preplay = Proportion of the spiking events that qualified as preplay events (i.e., that were significant), expressed as a percentage. % chance = proportion of spiking events from the shuffled data that qualified as preplay events, expressed as a percentage. p-value = probability, derived from a binomial test, of obtaining the observed number of preplay events for each template given the chance level calculated from the shuffled data.
Table 4
GOAL-CUE results
| Animal | Arm | # spiking events | # preplay events | % preplay | % chance | p-value |
|---|---|---|---|---|---|---|
| R1838 | Cued | 5 | 0 | 0 | 7 | 0.30 |
| Uncued | 5 | 0 | 0 | 7 | 0.30 | |
| R505 | Cued | 45 | 3 | 6.67 | 4.02 | 0.11 |
| Uncued | 48 | 1 | 2.08 | 3.57 | 0.52 | |
| R584 | Cued | 111 | 8 | 7.21 | 4.81 | 0.087 |
| Uncued | 112 | 5 | 4.46 | 4.82 | 0.46 | |
| R504 | Cued | 11 | 0 | 0 | 4.36 | 0.39 |
| Uncued | 7 | 1 | 14.29 | 5.00 | 0.044 | |
| All rats | Cued | 172 | 11 | 6.40 | 4.64 | 0.11 |
| Uncued | 170 | 7 | 4.12 | 4.49 | 0.50 |
-
Summary results from GOAL-CUE analysis # Spiking events = total number of spiking events recorded. # Preplay events = number of significant spiking events. % preplay = Proportion of the spiking events that qualified as preplay events (i.e., that were significant), expressed as a percentage. % chance = proportion of spiking events from the shuffled data that qualified as preplay events, expressed as a percentage. p-value = probability, derived from a binomial test, of obtaining the observed number of preplay events for each template given the chance level calculated from the shuffled data.
Download links
A two-part list of links to download the article, or parts of the article, in various formats.
Downloads (link to download the article as PDF)
Open citations (links to open the citations from this article in various online reference manager services)
Cite this article (links to download the citations from this article in formats compatible with various reference manager tools)
Hippocampal place cells construct reward related sequences through unexplored space
eLife 4:e06063.
https://doi.org/10.7554/eLife.06063


