Bovine F1Fo ATP synthase monomers bend the lipid bilayer in 2D membrane crystals
- Osaka University, Japan
- Max Planck Institute of Biophysics, Germany
- University of Hyogo, Japan
- Nagoya University, Japan
- Japan Science and Technology Agency, Japan
Figures
Figure 1 with 3 supplements
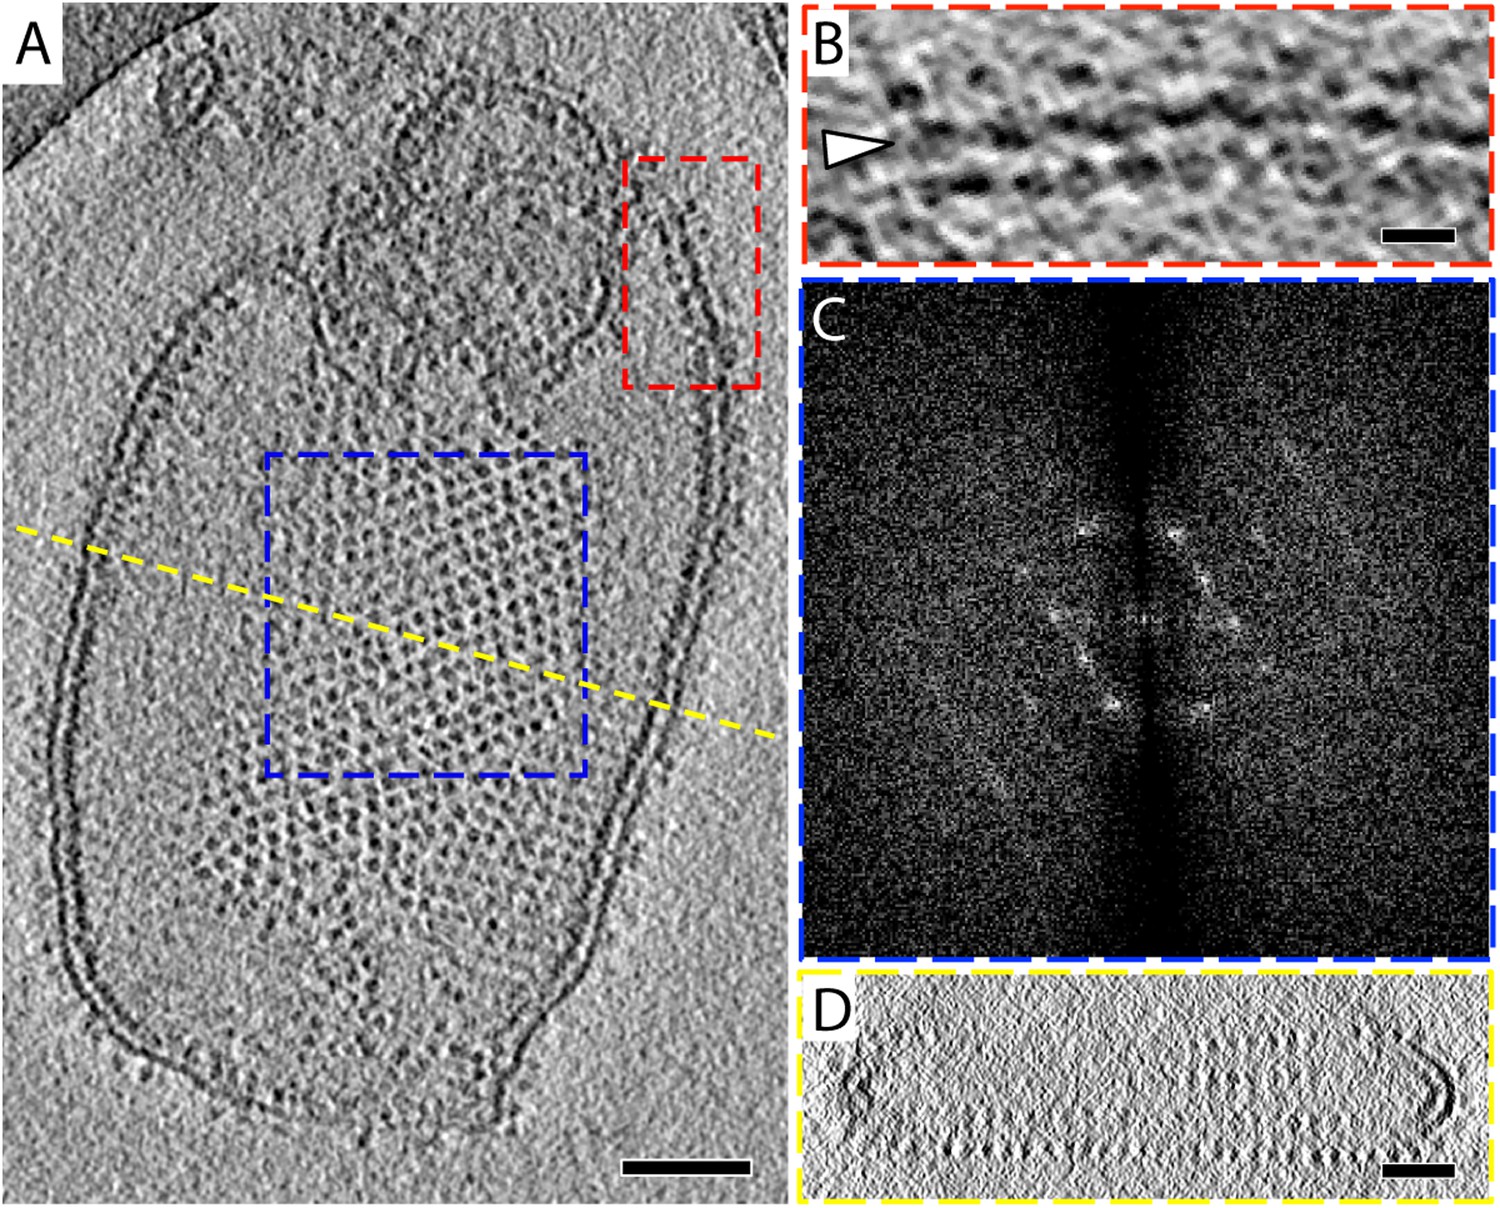
2D crystals of F1Fo ATP synthase in vitreous ice.
(A) Tomographic slice of a vesicle reconstituted with F1Fo ATP synthase. The ATP synthases appear as 10 nm spherical densities located 15 nm above the membrane. (B) Enlarged view of red boxed area in A showing the zigzag membrane structure (arrowhead). (See also Figure 2.) (C) Fourier transform of the blue-boxed area in (A). (D) Cross-section along the yellow dashed line in (A). Scale bar: (A) 100 nm, (B) 20 nm, (D) 50 nm.
Figure 1—figure supplement 1

Crystalline vesicles of F1Fo ATP synthase in negative stain.
(A) Overview of an EM grid square with numerous rectangular crystalline vesicles (red arrowheads). Scale bar 3 μm. (B) Rectangular crystalline vesicle at higher magnification with boxed area enlarged. F1 heads (white arrowheads). Scale bar 200 nm.
Figure 1—figure supplement 2
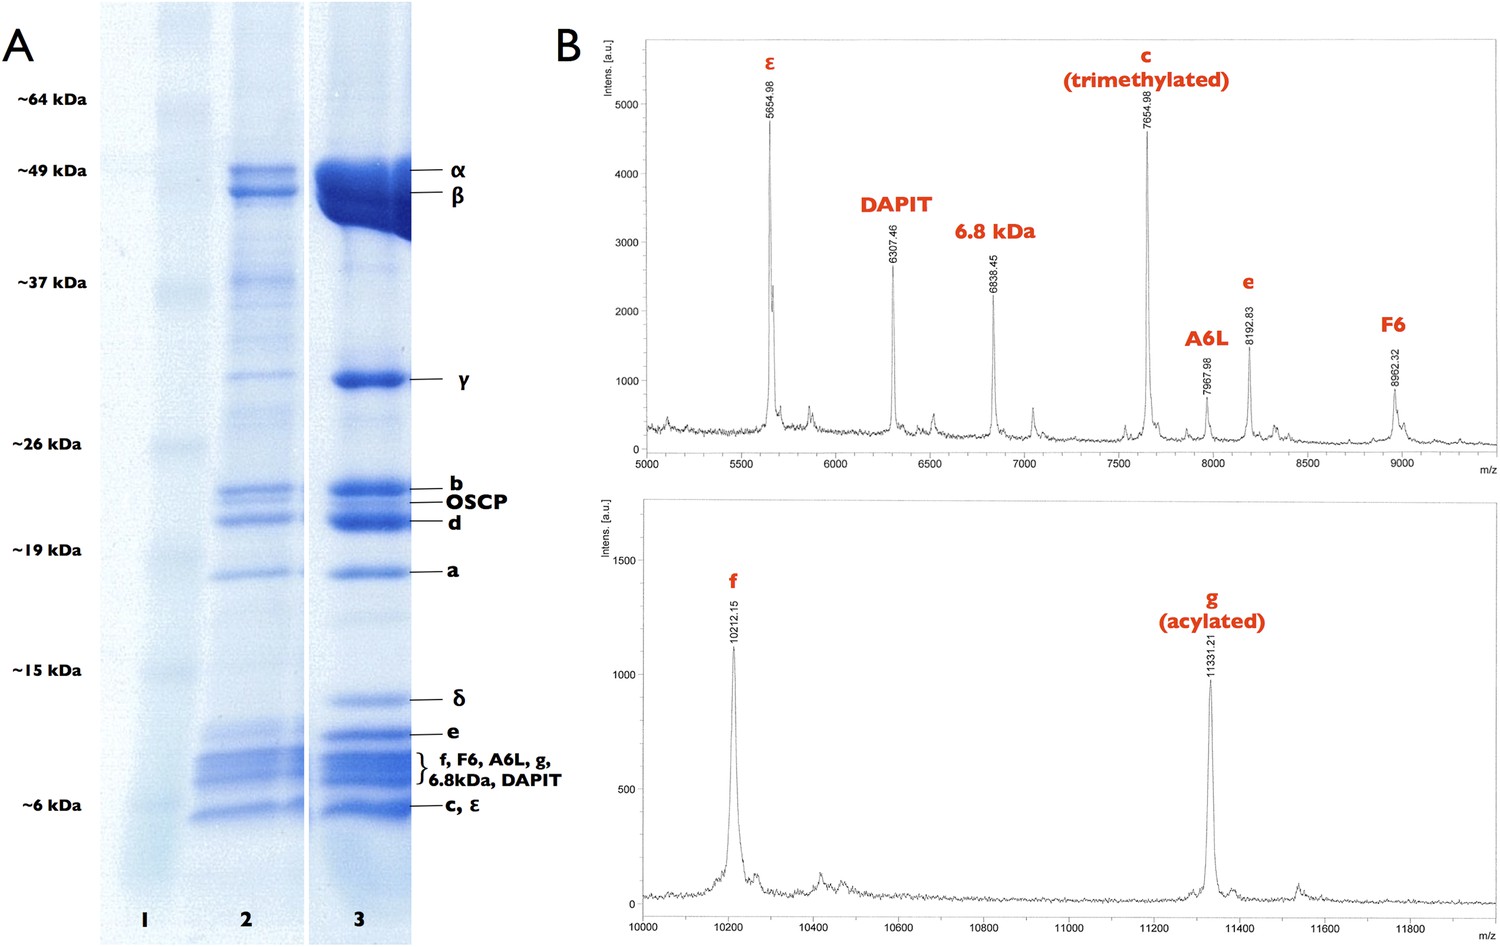
Subunit composition of F1Fo ATP synthase isolated from 2D crystals.
(A) SDS-polyacrylamide gradient gel (10–20%) showing the subunit composition of purified F1Fo ATP synthases before (lane 2) and after (lane 3) 2D crystallisation. Lane 1, molecular marker (BenchMark). (B) Mass spectrometry profile of small subunits (5000–12,000 Da) of the F1Fo ATP synthase isolated from 2D crystals. All F1Fo ATP synthase subunits are present in the 2D crystals.
Figure 1—figure supplement 3
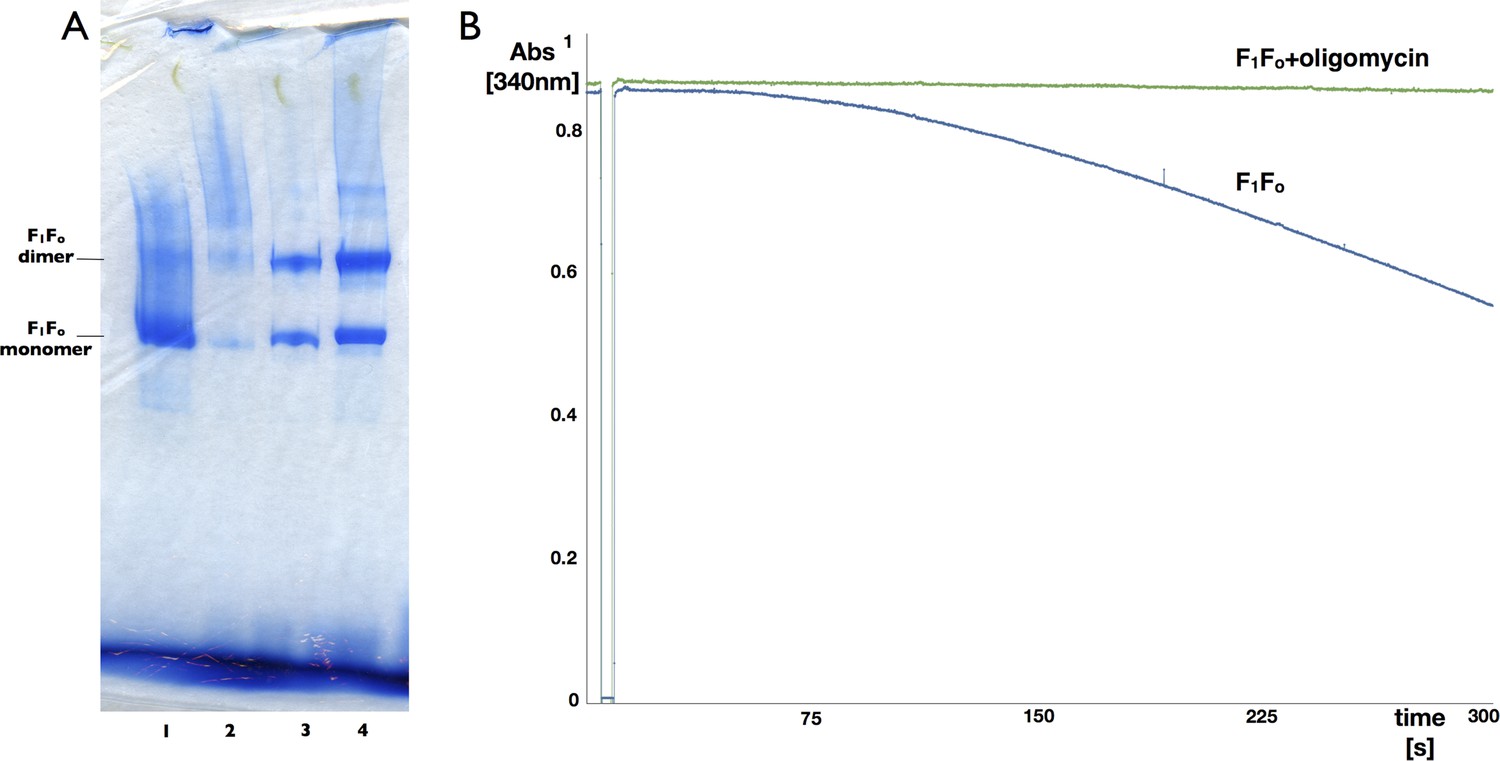
Blue-native polyacrylamide gel and activity assay of F1Fo ATP synthase isolated from 2D crystals.
(A) BN polyacrylamide gradient gel (4–12%) of purified F1Fo ATP synthase solubilized in decylmaltoside (lane 1 and 2, 15 μg and 2 μg respectively) and of digitonin-resolubilised 2D crystals (lane 3 and 4, 30 μg and 90 μg respectively). Bands of lower molecular weight subcomplexes, that is, Fo or c8, are weak or absent. The dimer band in lane 1 and 2 presumably stems from mitochondrial F1Fo ATP synthase dimers preserved by mild purification conditions. The dimer band visible in lane 3 and 4 most likely represents non-physiological F1Fo ATP synthase dimers that form in the 2D crystals. (B) Typical ATPase activity and oligomycin-sensitivity of digitonin-resolubilised F1Fo ATP synthase isolated from 2D crystals. The hydrolysis of ATP by the F1Fo ATP synthase was monitored using an enzyme couple assay by detecting NADH oxidation at 340 nm at 20°C in the absence (blue) or presence (green) of oligomycin. Oligomycin inhibits ATP hydrolysis through F1 by stopping rotation of the Fo motor, that is, oligomycin sensitivity gives a measure of the amount of coupled, intact F1Fo ATP synthase complexes in the preparation, in this case >95%.
Figure 2
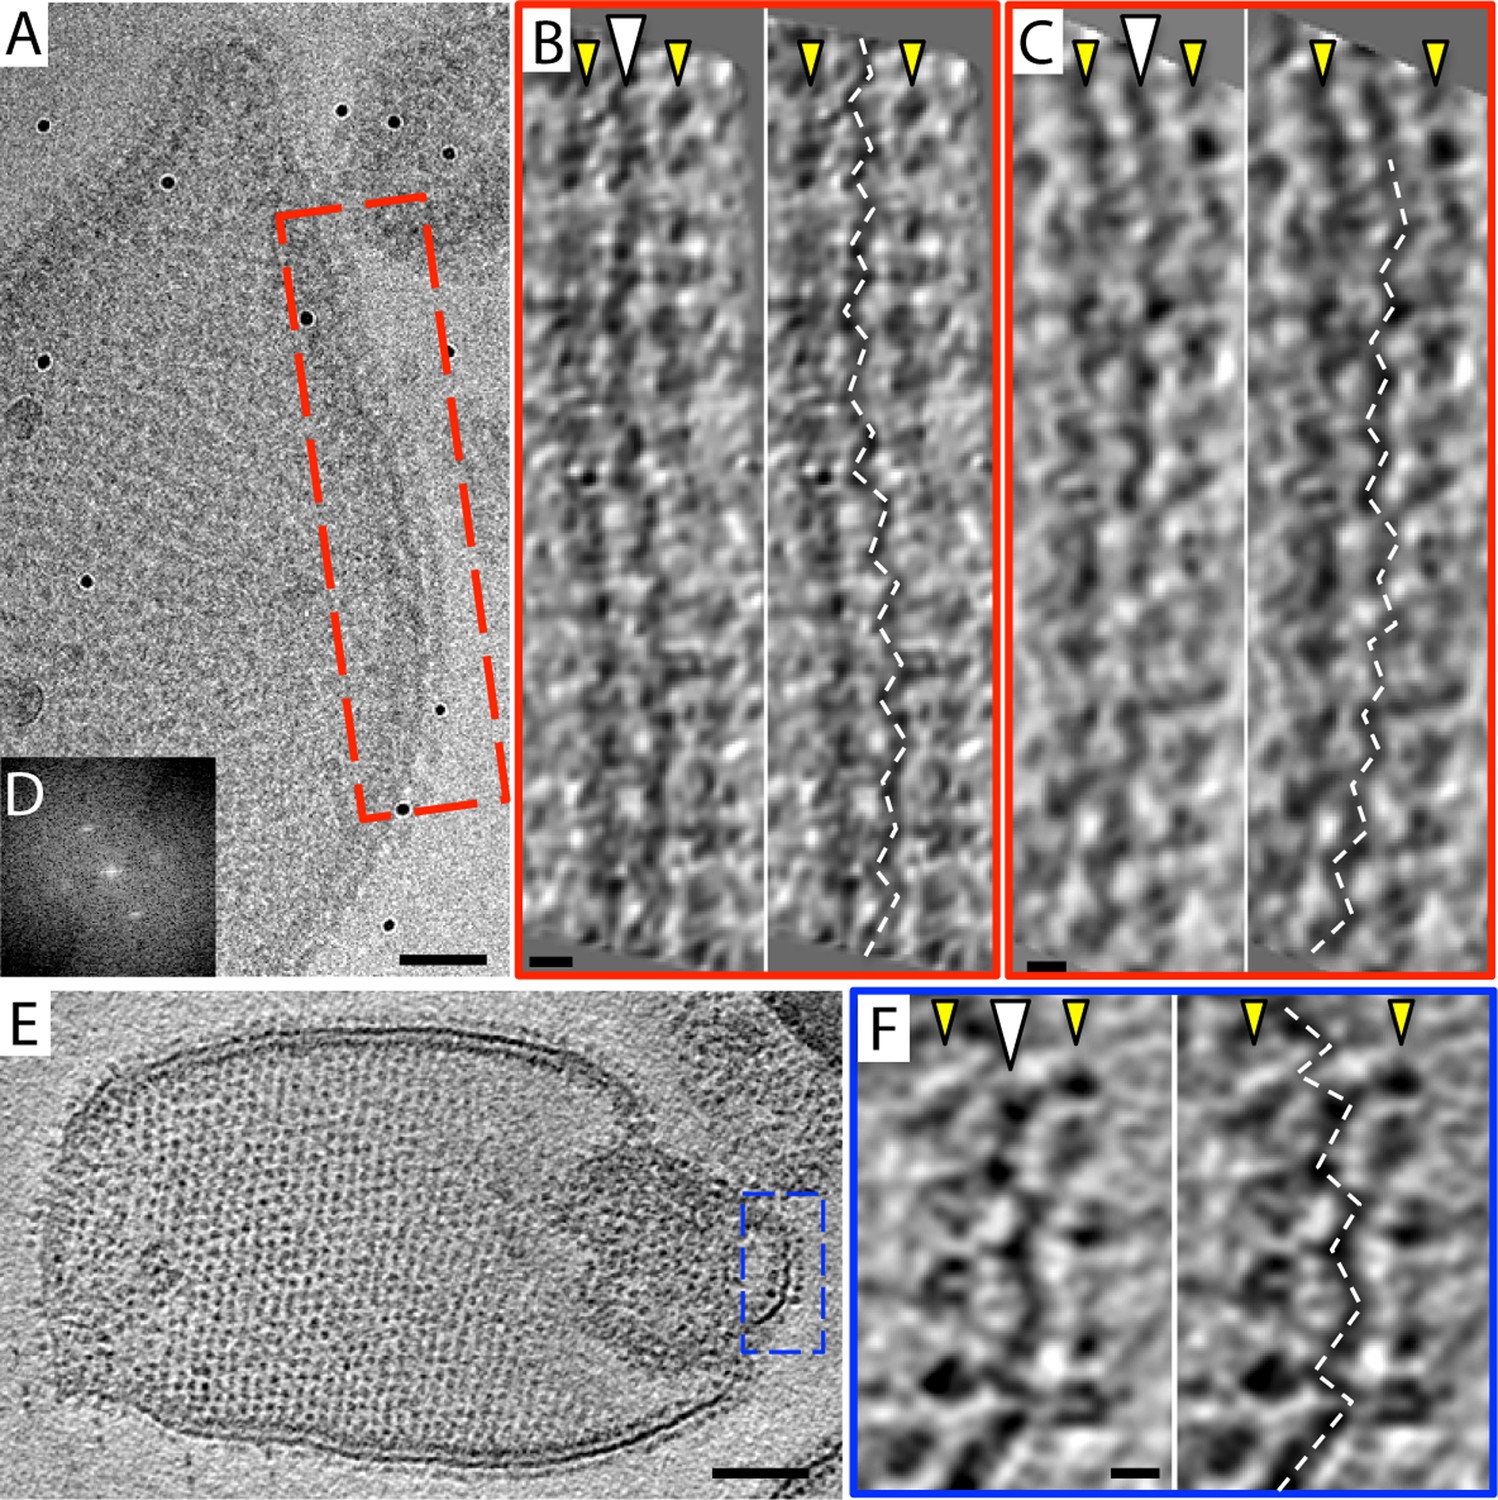
Zigzag membrane structure.
(A) Projection image of a vesicle reconstituted with F1Fo ATP synthase. (B) and (C) tomographic slices of boxed area in (A) at different z-heights. (D) Fourier transform of an oblique tomographic slice through boxed area in (A) showing weak diffraction. (E) Tomographic slice of rectangular crystalline vesicle. (F) Close-up of boxed area in (E). White arrowhead, indicates membrane plane, yellow arrowhead, line of F1 head groups. Scale bar: (A) 50 nm, (B, C, and F) 10 nm, (E) 100 nm.
Figure 3 with 2 supplements
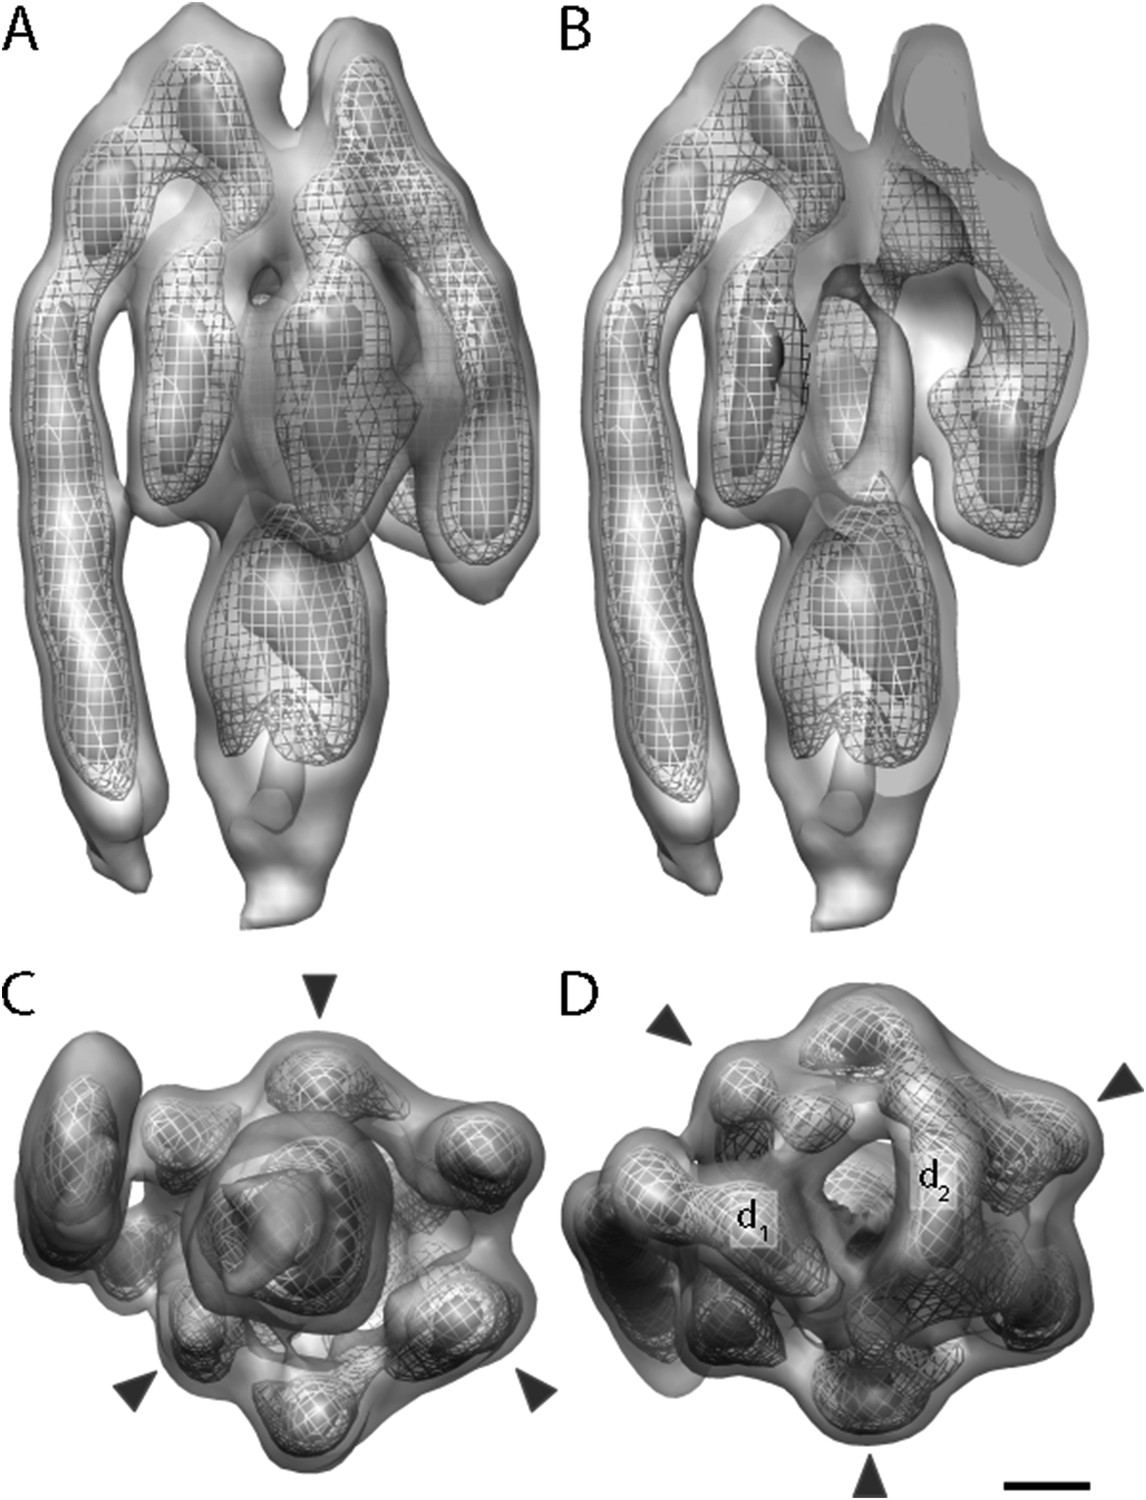
Sub-tomogram average of bovine heart mitochondrial F1Fo ATP synthase calculated from 2D crystals.
(A) Surface view, (B) longitudinal section showing central stalk, (C) bottom view and (D) top view. Arrowheads: positions of the β subunits. d1 and d2: densities connecting peripheral stalk to F1 subcomplex. Threshold levels: light grey, 1 σ; mesh, 3 σ; dark grey, 5 σ. Scale bar: 20 Å.
Figure 3—figure supplement 1
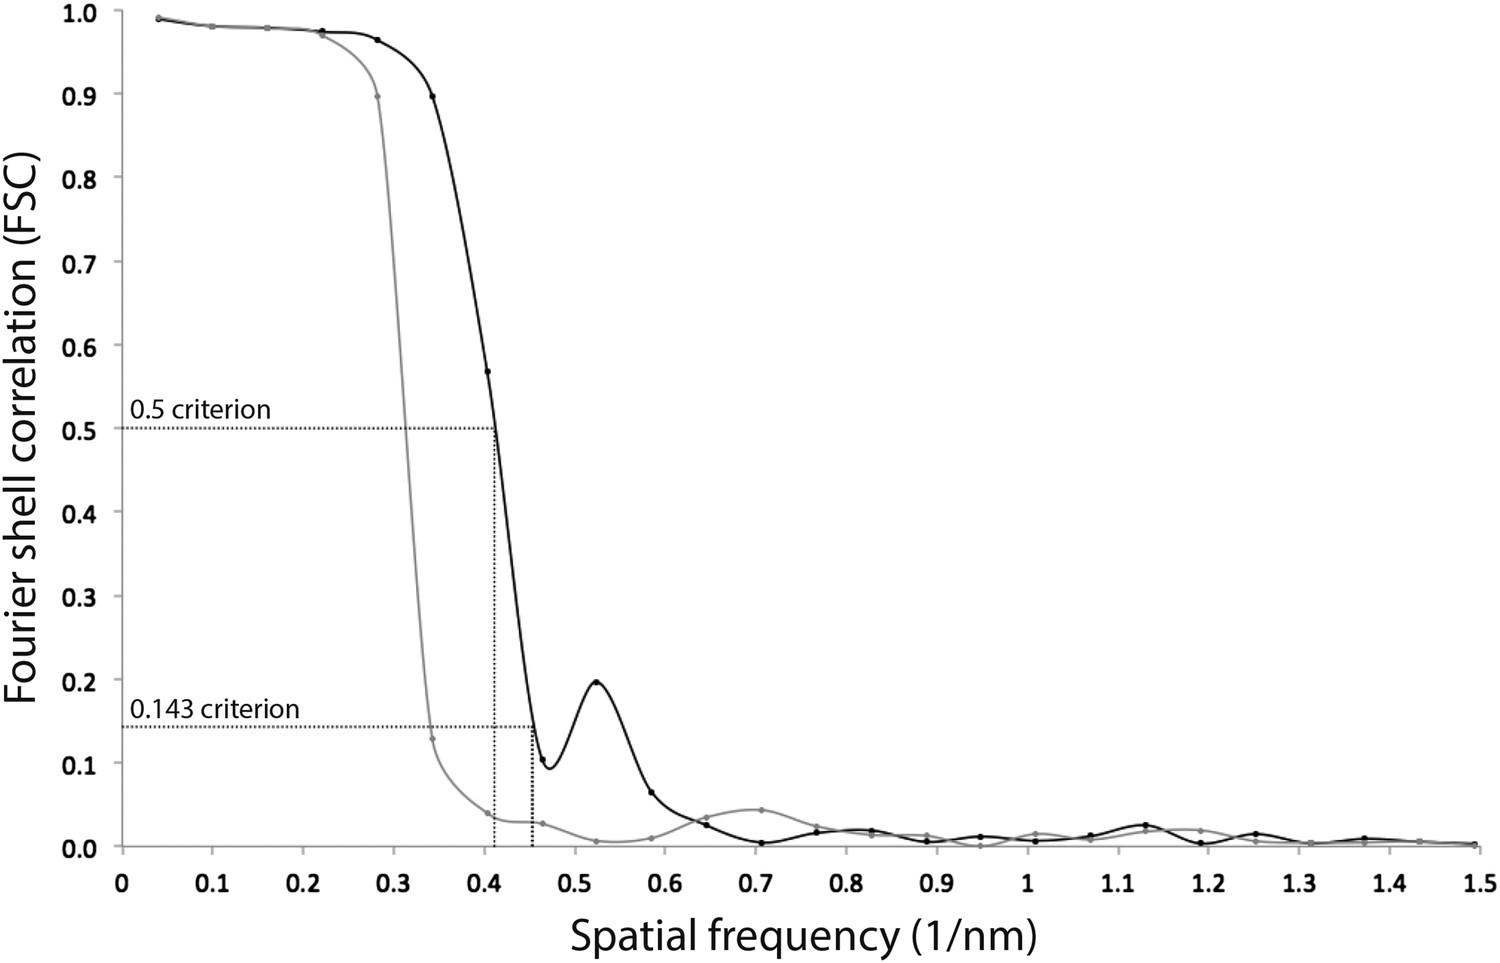
Resolution estimate of the ATP synthase monomer sub-tomogram average.
Fourier shell correlation (FSC) curves were calculated by comparing averages generated from two independently processed data sets (‘Gold standard’; Scheres and Chen, 2012, black line). To check for overfitting, phases beyond 40 Å were randomized (Chen et al., 2013) and the final alignment iteration repeated (grey line). According to the FSC 0.5 criterion (crosshairs), the ATP synthase monomer average has a resolution of 2.4 nm. Points on the FSC curves mark spatial frequency shells used in the FSC calculation.
Figure 3—figure supplement 2
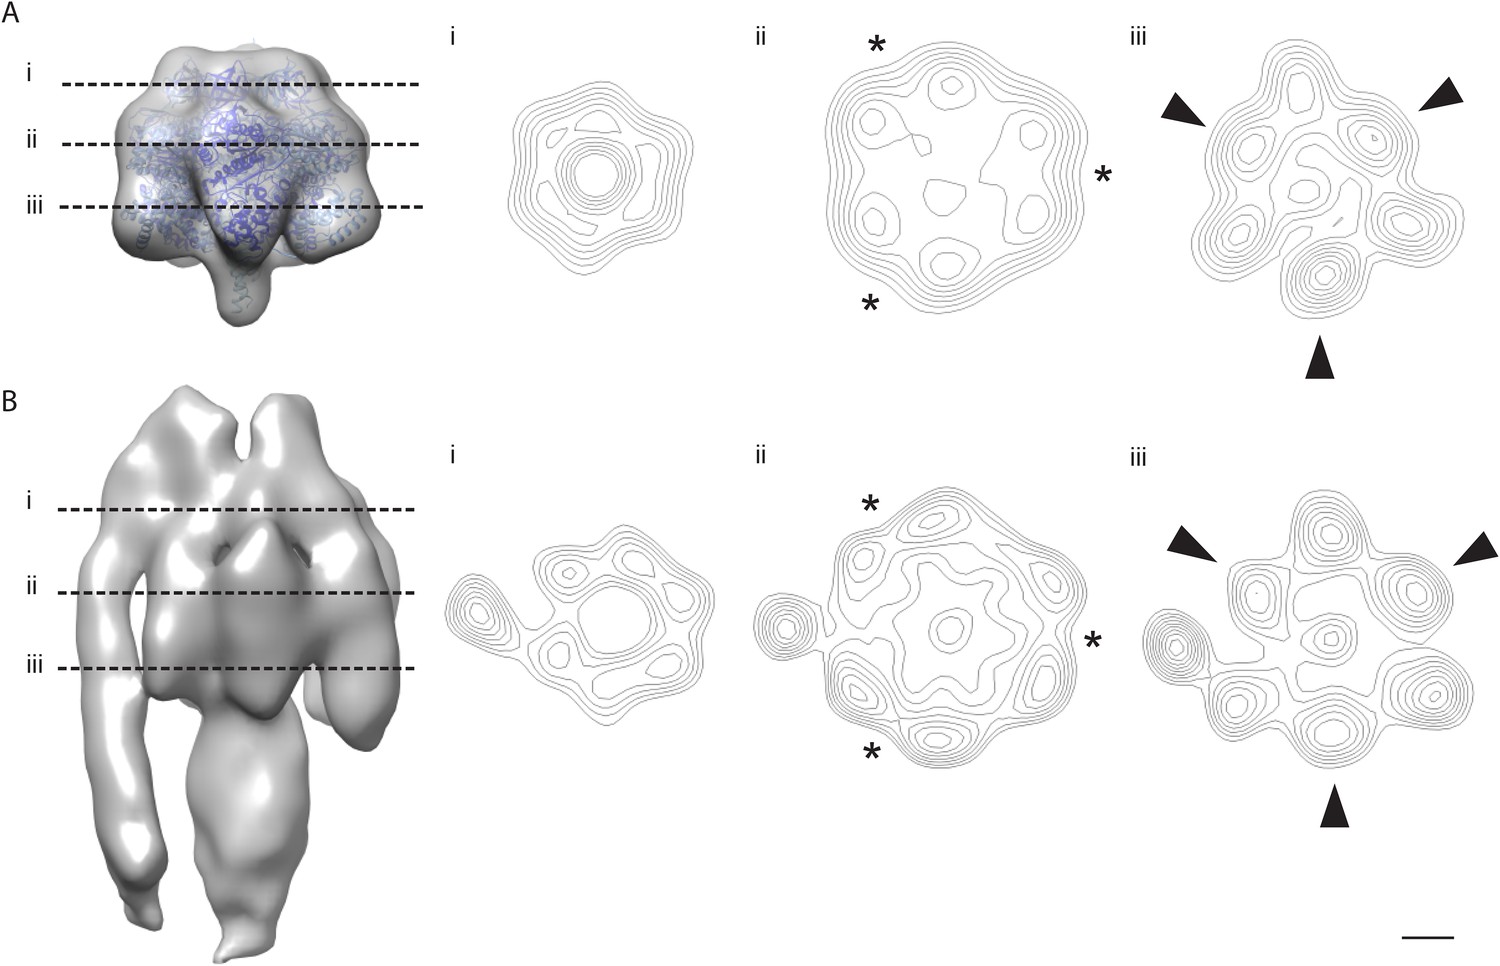
The α/β hexamer.
(A) X-ray map of catalytic domain (PDB code: 1BMF, Abrahams et al., 1994) Fourier-filtered to 25 Å. (B) Subtomogram average calculated from 2D crystals. Dashed lines, cross-section levels in i–iii. Arrowheads, beta subunits *, catalytic interface between α and β subunits. Contour levels drawn at intervals of 0.5 sigma above mean. Scale bar, 20 Å.
Figure 4 with 1 supplement
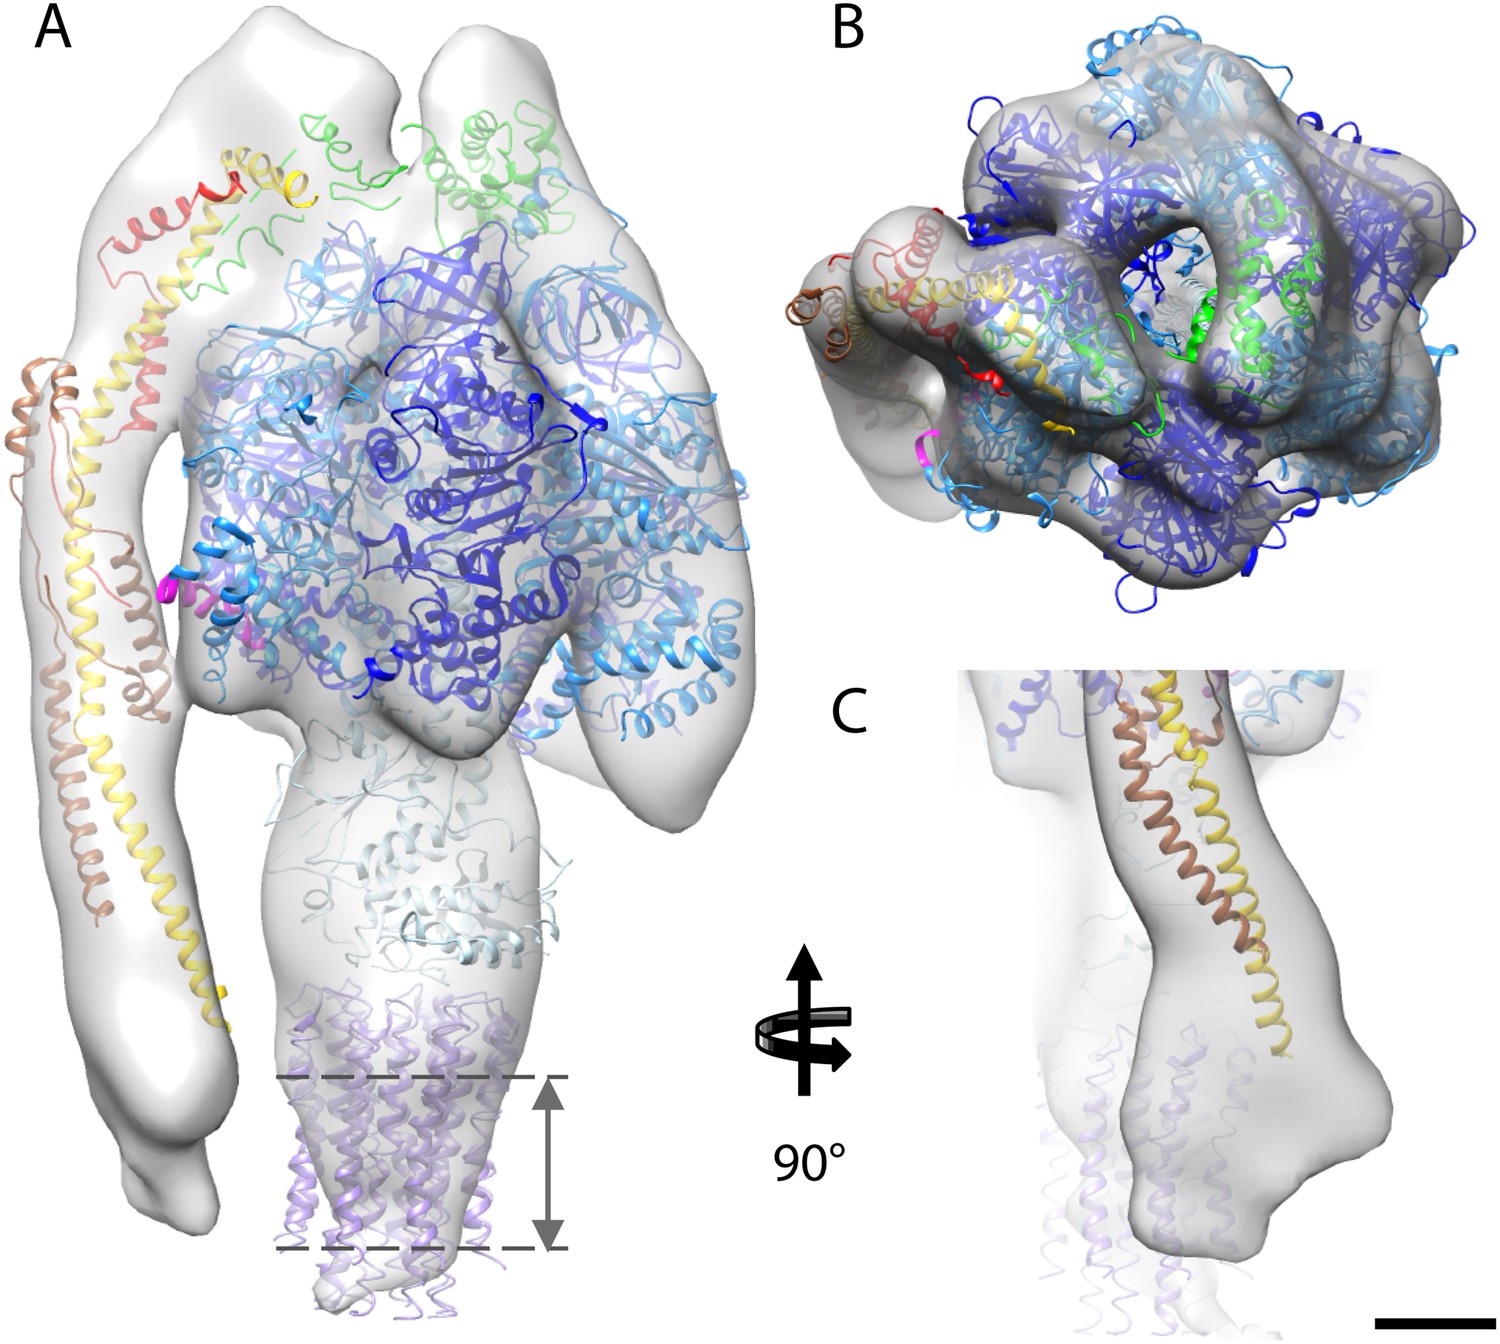
Fitted atomic model of the bovine F1Fo ATP synthase.
(A–C) Sub-tomogram average with fitted atomic models (A) side view, (B) top view, and (C) the peripheral stalk. Blue, catalytic domain; grey, central stalk; green, oligomycin sensitivity conferral protein (OSCP) from PDB:2WSS (Rees et al., 2009). Purple, c-ring (PDB:2XND) (Watt et al., 2010); Yellow-red, peripheral stalk fragment (PDB: 2CLY) (Dickson et al., 2006) with additional residues from PDB:2WSS (Rees et al., 2009). Pink, α-subunit helix thought to interact with the peripheral stalk. Dashed lines, position of membrane. Scale bar, 20 Å.
Figure 4—figure supplement 1
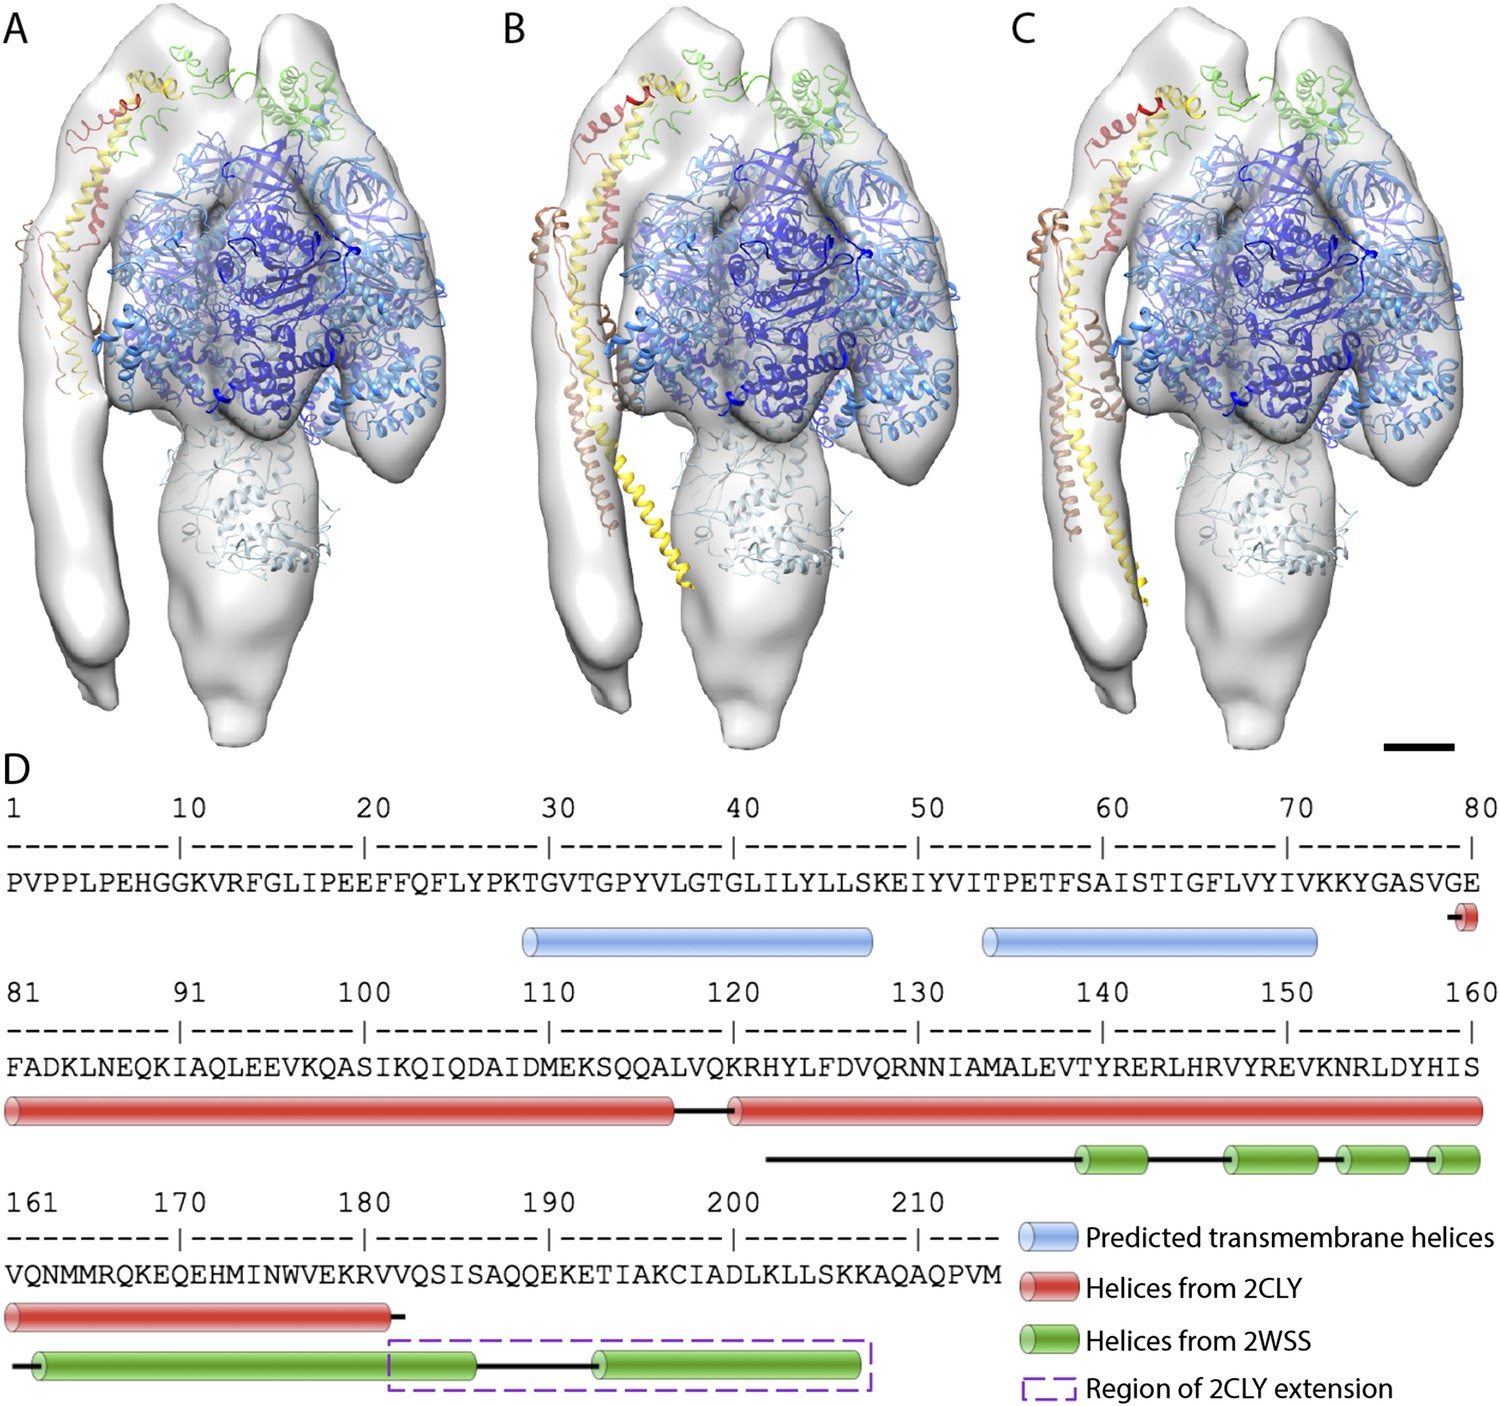
Possible atomic models fitted to sub-tomogram average.
(A) Sub-tomogram average fitted with the F1/peripheral stalk complex (PDB entry: 2WSS). (B) as in (A) but peripheral stalk extended with the atomic model of the peripheral stalk fragment (PDB:2CLY). (C) as in (B) but the extended peripheral stalk sub-complex plus C-terminal domain of the OSCP subunit fitted to the average as a rigid-body subsequent to the fitting of the F1-subcomplex plus N-terminal domain of the OSCP subunit from 2WSS. (D) Sequence of the peripheral stalk subunit b from bovine heart showing the position of the predicted trans-membrane helices (blue) and the known helices (red and green) determined by x-ray crystallography. The dashed purple box indicates the residues from PDB:2WSS by which the PDB:2CLY structure was extended for rigid-body fitting in (C). Atomic model subunit colors: blue, α; dark blue, β; light blue, γ,δ,ε; yellow, b; red, F6; brown, d; green OSCP. Scale bar: 20 Å.
Figure 5 with 1 supplement
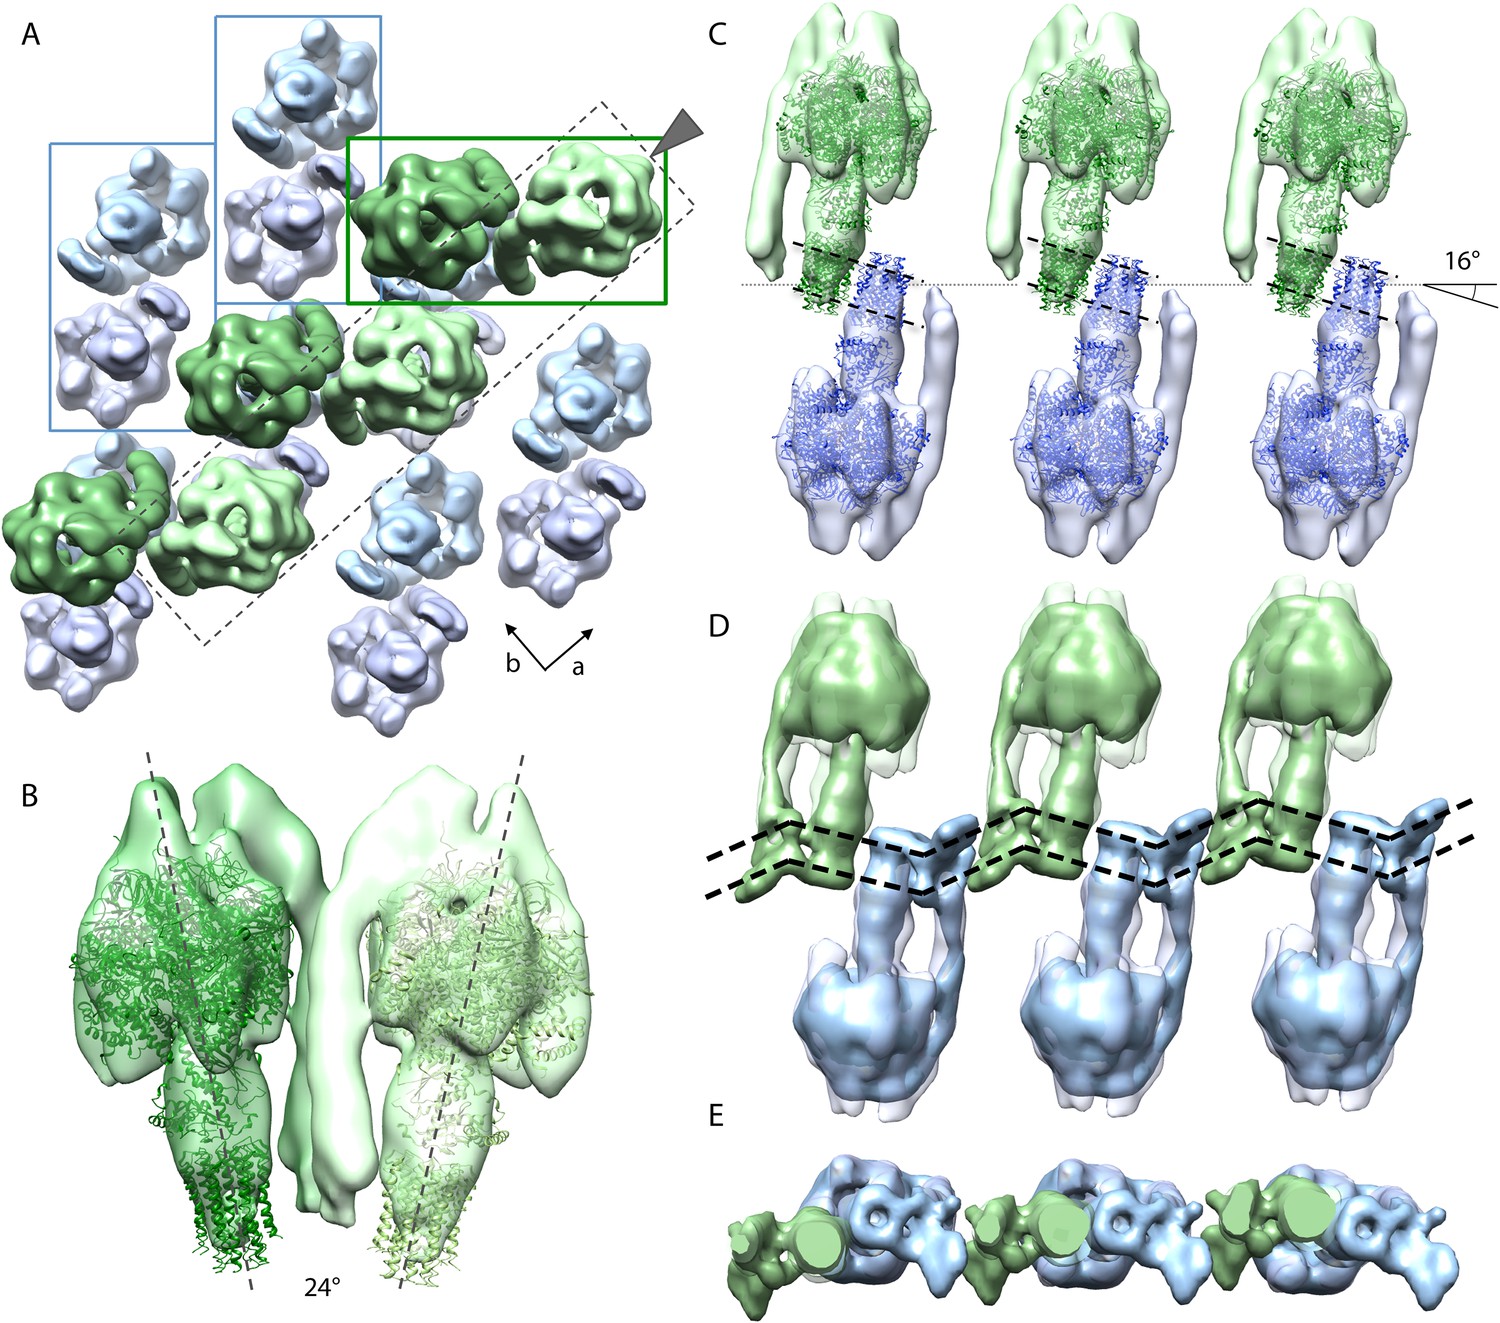
Packing of bovine F1Fo ATP synthase in the 2D crystal.
(A) Top view of the 2D crystal lattice of bovine F1Fo ATP synthase. Rectangles indicate the position of ATP synthase pairs. Arrows indicate cell axes. (B) Side view of one pair. (C) Cross-section of the crystal lattice indicated by the dashed box and arrowhead in (A). F1Fo ATP synthases of opposite orientation in the membrane are connected via close interaction of their rotor-rings. The rotor-ring pairs are oriented 16° relative to the crystal plane (single grey dashed line). (D) Cross-section as in (C) but with the single-particle EM map (Baker et al., 2012) fitted into the subtomogram averages. The arrangement of the monomeric complexes on the 2D crystal lattice results in a locally kinked lipid bilayer (bold dashed lines). (E) Top view of the cross-section in (D) clipped to remove the catalytic domains of the upper F1Fo ATP synthase layer.
Figure 5—figure supplement 1
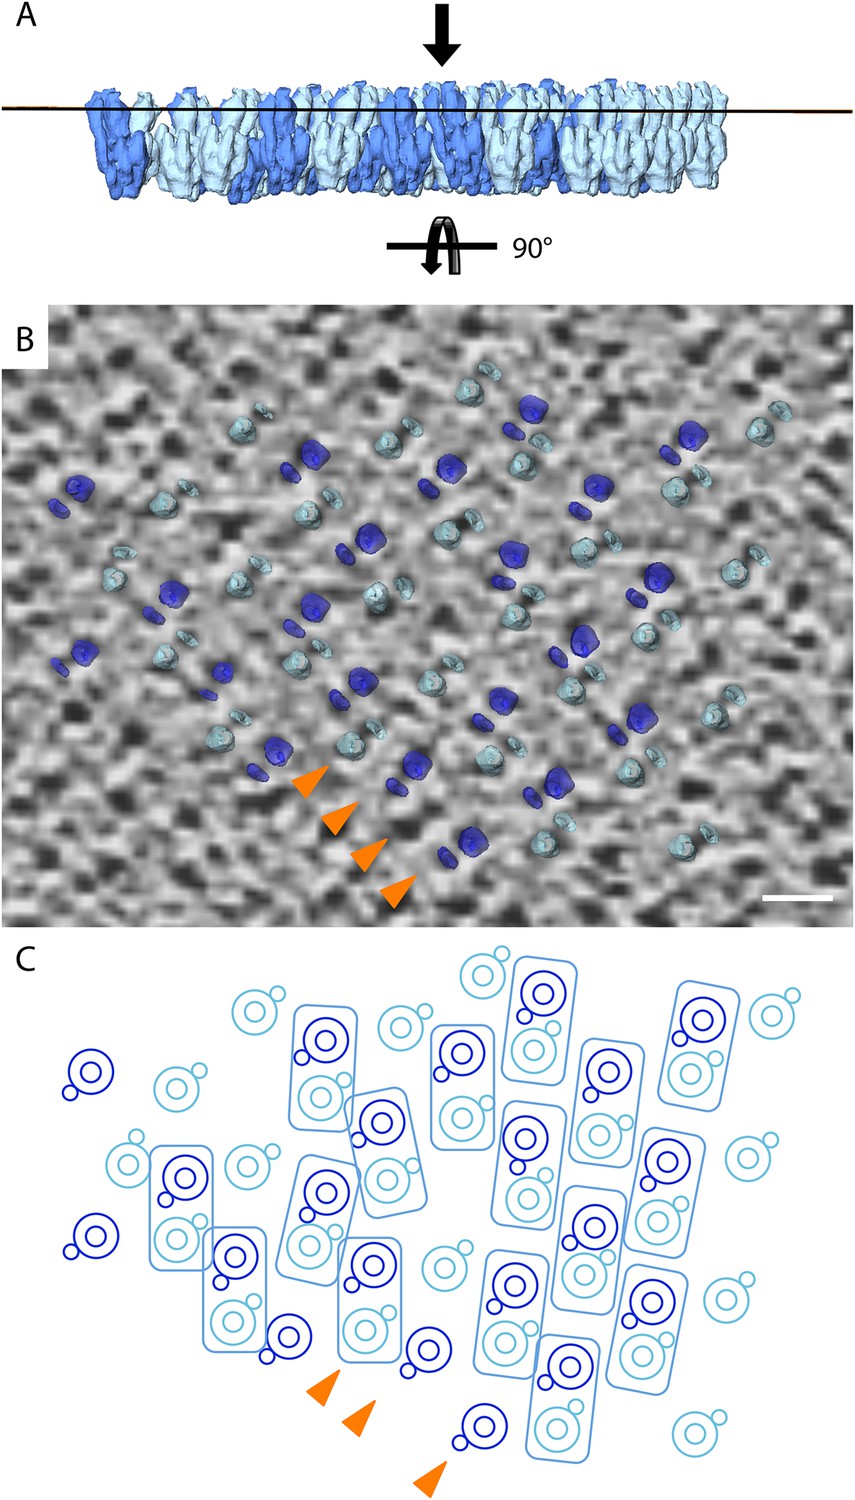
Lattice disorder.
(A) Side view of subtomogram averages repositioned into the lower face of a 2D crystal. (B) Tomographic slice through a 2D crystal as indicated by line in (A) with a selection of repositioned sub-tomogram averages (transparent). The tomographic slice is viewed from the membrane (indicated by arrow in A). The repositioned subtomogram averages coincide with large and small circular densities, which correspond to the central and peripheral stalks, respectively (orange arrowheads). Scale bar: 10 nm. (C) Graphic representation of selected repositioned sub-tomogram averages in (A) highlighting the disorder in the crystal lattice. Small circles, peripheral stalk; double circle, F1-subcomplex + c-ring; rectangles indicate F1Fo ATP synthase pairs. Arrowheads correspond to those shown in (B) and are included for orientation purposes.
Figure 6 with 2 supplements
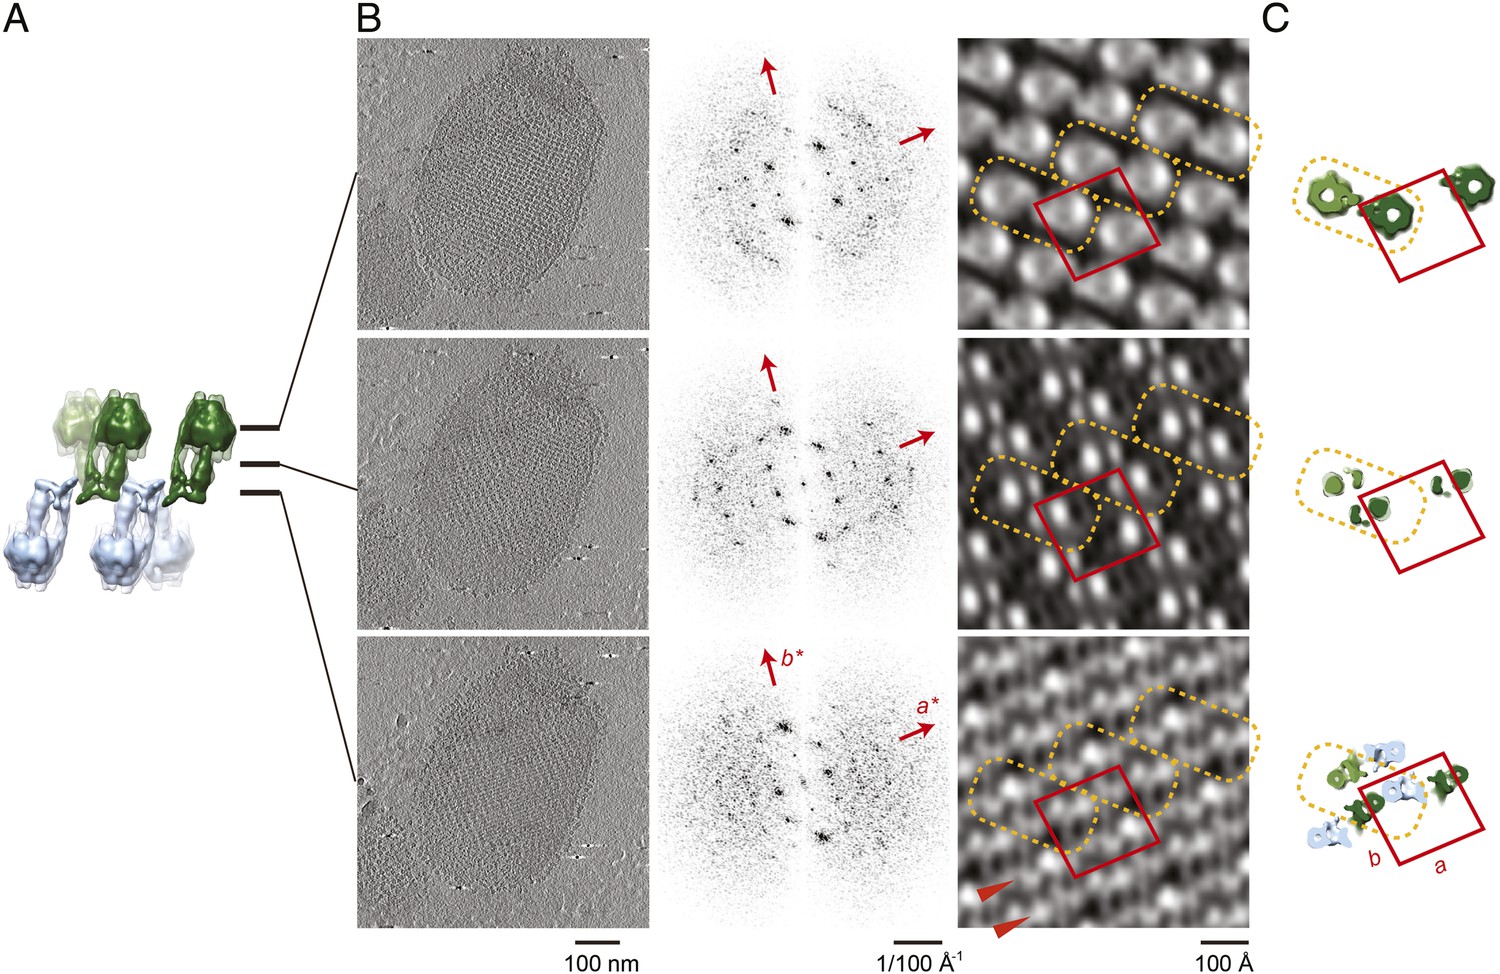
Projection maps of different z-slices in a 2D crystal of F1Fo ATP synthases.
(A) Side view of crystal packing from Figure 4. (B) Projection images (left) calculated from z-slices of the tomographic volume at z-height positions indicated by black bars in (A), their Fourier transforms (centre) and projection maps (right). (C) z-slices through the crystal packing in (A) corresponding to the position of the projection maps shown in (B). (A–C) Protein densities observed in the projection maps perfectly match the features shown in the corresponding z-slices of the crystal-packing model. Dashed orange outlines indicate a pair of F1Fo ATP synthases, red boxes indicate the unit cell of the crystal with dimensions of a = 179.1 Å, b = 171.4 Å, γ = 94.9°. Red arrowheads in the lower panel of (B) indicate lines of continuous protein density in the membrane plane.
Figure 6—figure supplement 1

Flow chart of electron crystallographic image processing of a tomographic volume.
https://doi.org/10.7554/eLife.06119.018
Figure 6—figure supplement 2
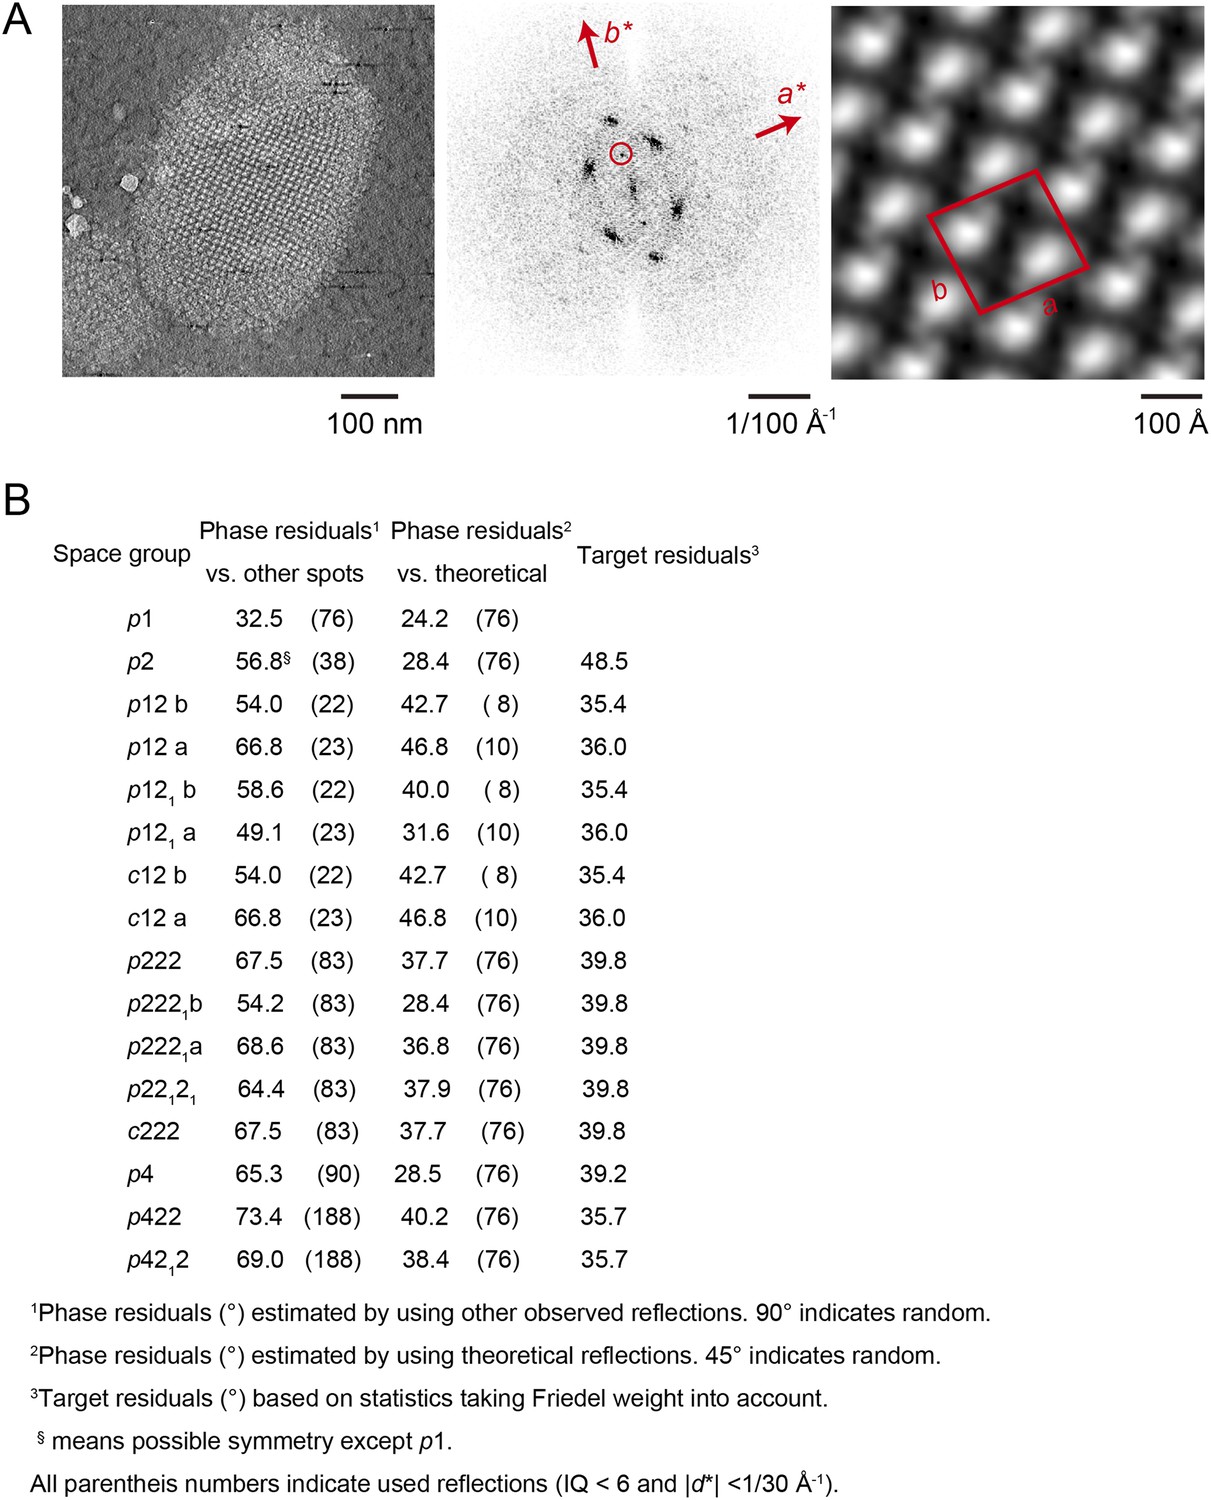
Unit cell parameters and crystal symmetry.
(A) Projection images of tomographic z-slices containing the whole single-layered 2D crystal were processed to determine unit cell parameters and crystal symmetry. Image processing was performed using the MRC image processing programmes. (A) Projection image (left); Fourier transform (center); Fourier synthesis map (right). The red circle indicates the (0, 1) reflection. (B) The programme ALLSPACE did not indicate a clear plane-group symmetry for the 2D lattice.
Figure 7
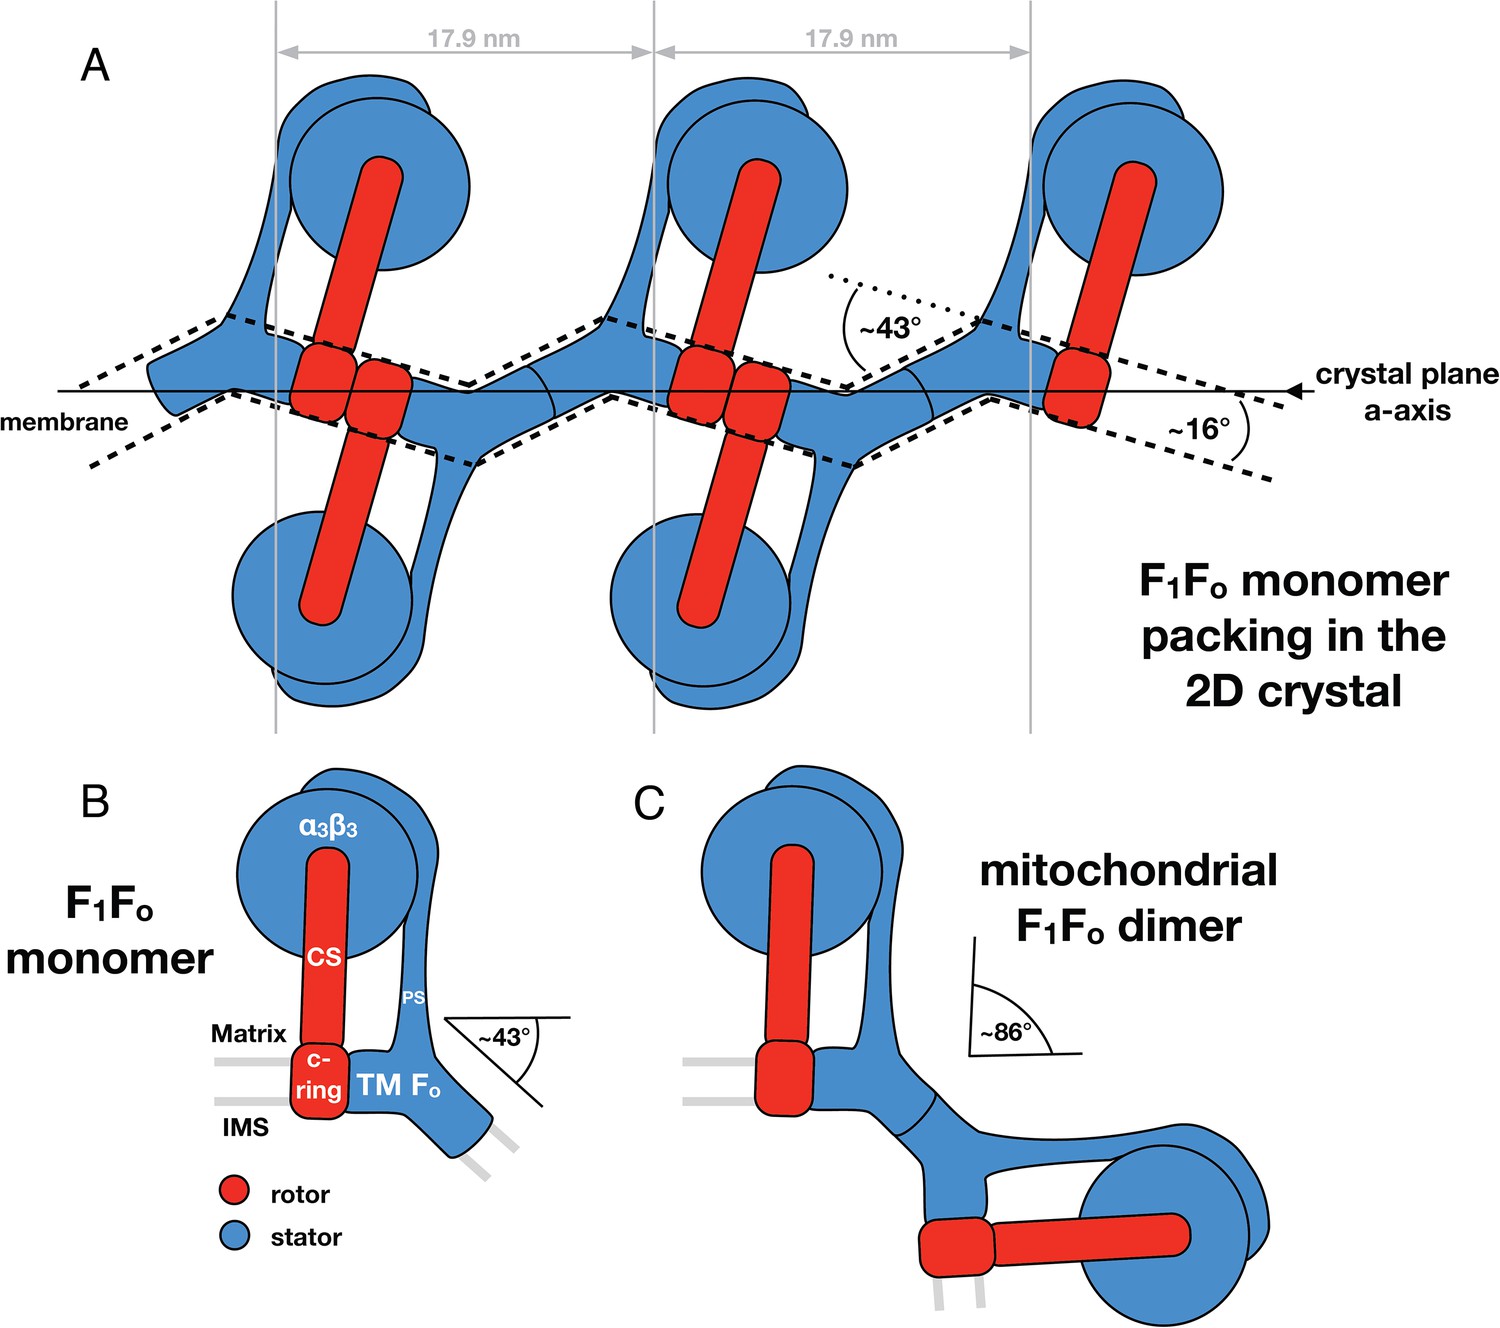
Monomeric mitochondrial F1Fo ATP synthase as the factor determining cristae membrane curvature.
(A) Schematic diagram of bovine F1Fo ATP synthase in the 2D crystal lattice, with its transmembrane Fo stator domain imposing a local 43° kink and a 16° inclination of the c-ring relative to the crystal plane. Blue, stator; red, rotor. (B) Schematic diagram of a single monomeric bovine F1Fo ATP synthase. CS: central stalk; PS: peripheral stalk; IMS: intermembrane space; TM Fo: transmembrane domain of Fo. (C) Association of two monomeric F1Fo complexes into a dimer results in an angle of 86°, as observed in ATP synthase dimers in mitochondrial cristae (Davies et al., 2012).
Videos
Video 1
Tomographic volume of a 2D crystal with re-inserted subtomogram average.
The video moves through the z-stacks of the tomogram, revealing the location of the re-inserted sub-tomogram averages of the F1Fo ATP synthase. The four layers of F1Fo ATP synthase molecules are coloured in pink, blue, orange, and green. The predicted position of the vesicle membrane is shown in blue.
Video 2
Organization of bovine F1Fo ATP synthases in 2D crystals.
The relative orientation of the F1Fo ATP synthases in a particularly well-ordered region of a 2D crystal is visualized by showing the re-inserted subtomogram averages, then by fitting the F1-c8 crystal structure and finally by fitting the single-particle map of Baker et al., 2012. F1Fo ATP synthases are orientated 16° to the crystal plane resulting in a zigzag arrangement of the lipid bilayer.
Download links
A two-part list of links to download the article, or parts of the article, in various formats.
Downloads (link to download the article as PDF)
Open citations (links to open the citations from this article in various online reference manager services)
Cite this article (links to download the citations from this article in formats compatible with various reference manager tools)
Bovine F1Fo ATP synthase monomers bend the lipid bilayer in 2D membrane crystals
eLife 4:e06119.
https://doi.org/10.7554/eLife.06119


