Drosophila sessile hemocyte clusters are true hematopoietic tissues that regulate larval blood cell differentiation
- Instituto Gulbenkian de Ciência, Portugal
- Universidade de Lisboa, Portugal
Figures
Figure 1 with 4 supplements
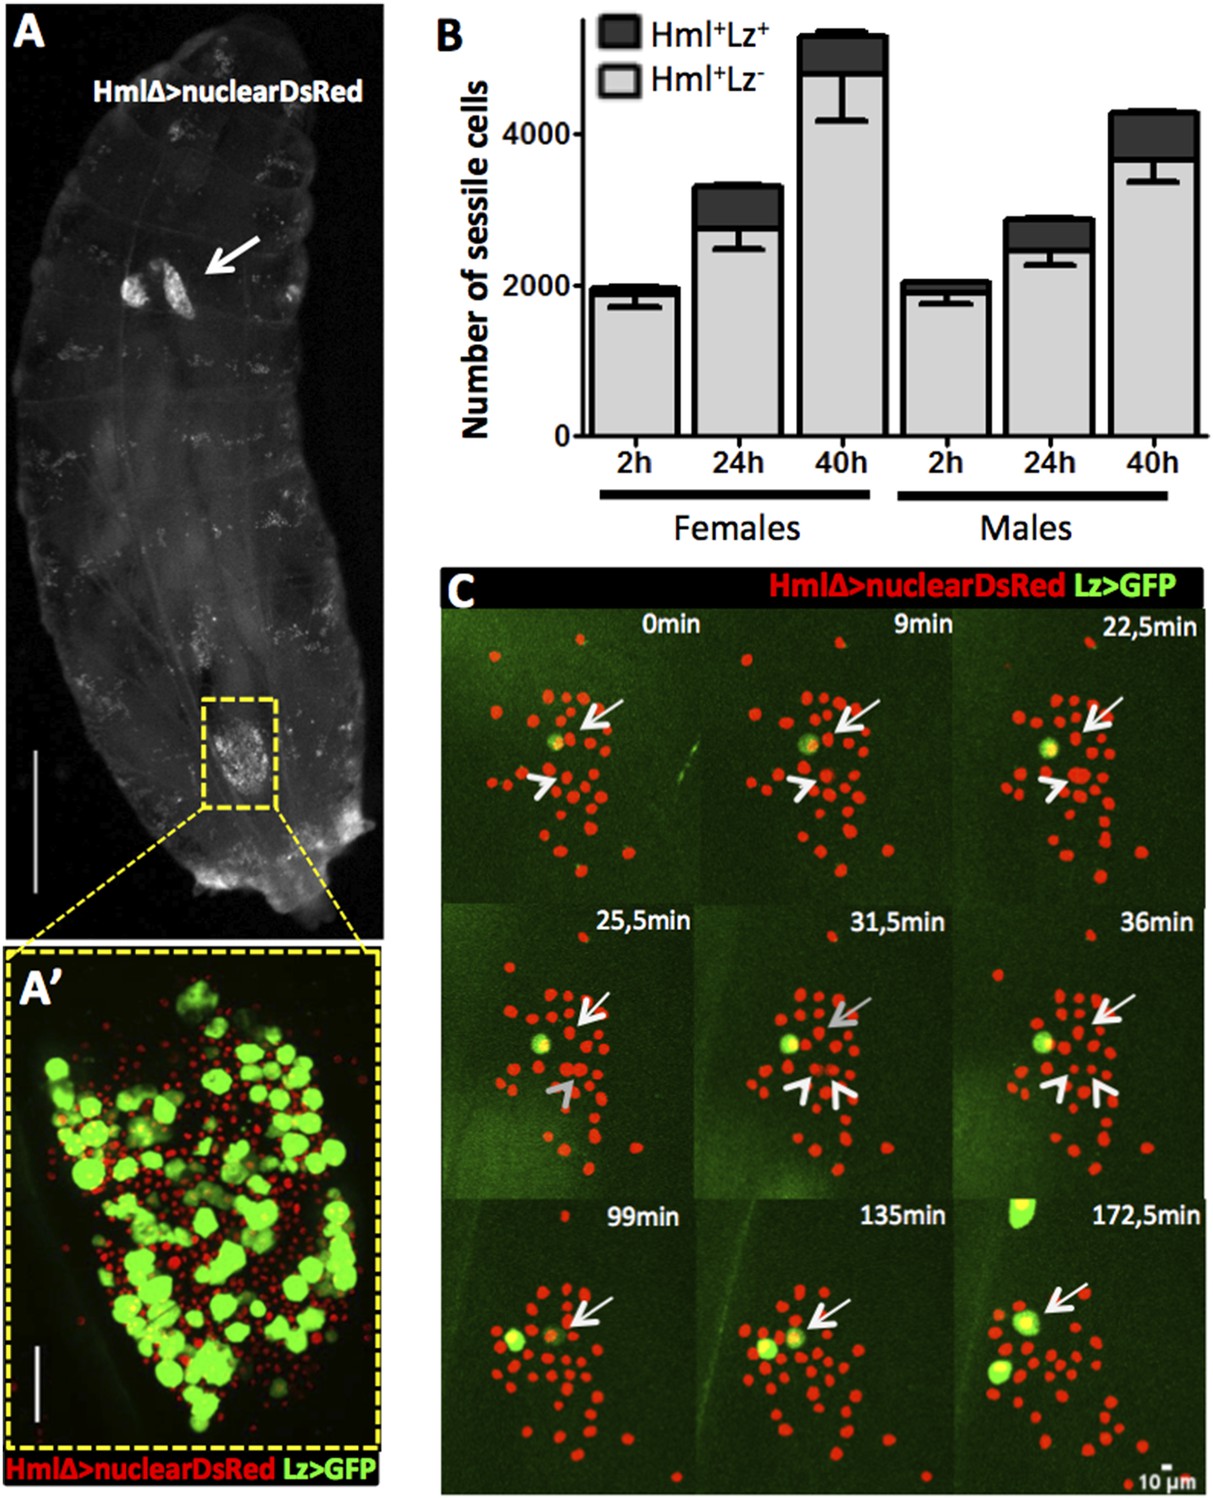
Hml+Lz+ cells increase during larval development by de novo differentiation.
(A) Dorsal view of a third instar larva with hemocyte nuclei marked using HmlΔ-nuclearDsRed. The lymph gland (arrow) and sessile hemocytes along the body axis are visible, particularly in a big cluster on the A7 segment (square). Scale bar = 1 mm. (A′) Magnification of the A7 hemocyte cluster showing that it is constituted of Hml+Lz− and Hml+Lz+ cells. Scale bar = 50 μm. (B) Throughout third instar larval development of both females and males, Hml+ sessile cells (grey bars) increase accompanied by an increment of sessile Lz+ cells (black bars), n = 10 per time point, error bars represent the SEM. (C) Still images of a 3-hr video showing hemocytes marked by HmlΔ-nuclearDsRed; Lz>EGFP/CD8GFP. It is possible to observe cell divisions in Hml+Lz− (arrow heads) and GFP induction (arrows).
Figure 1—figure supplement 1
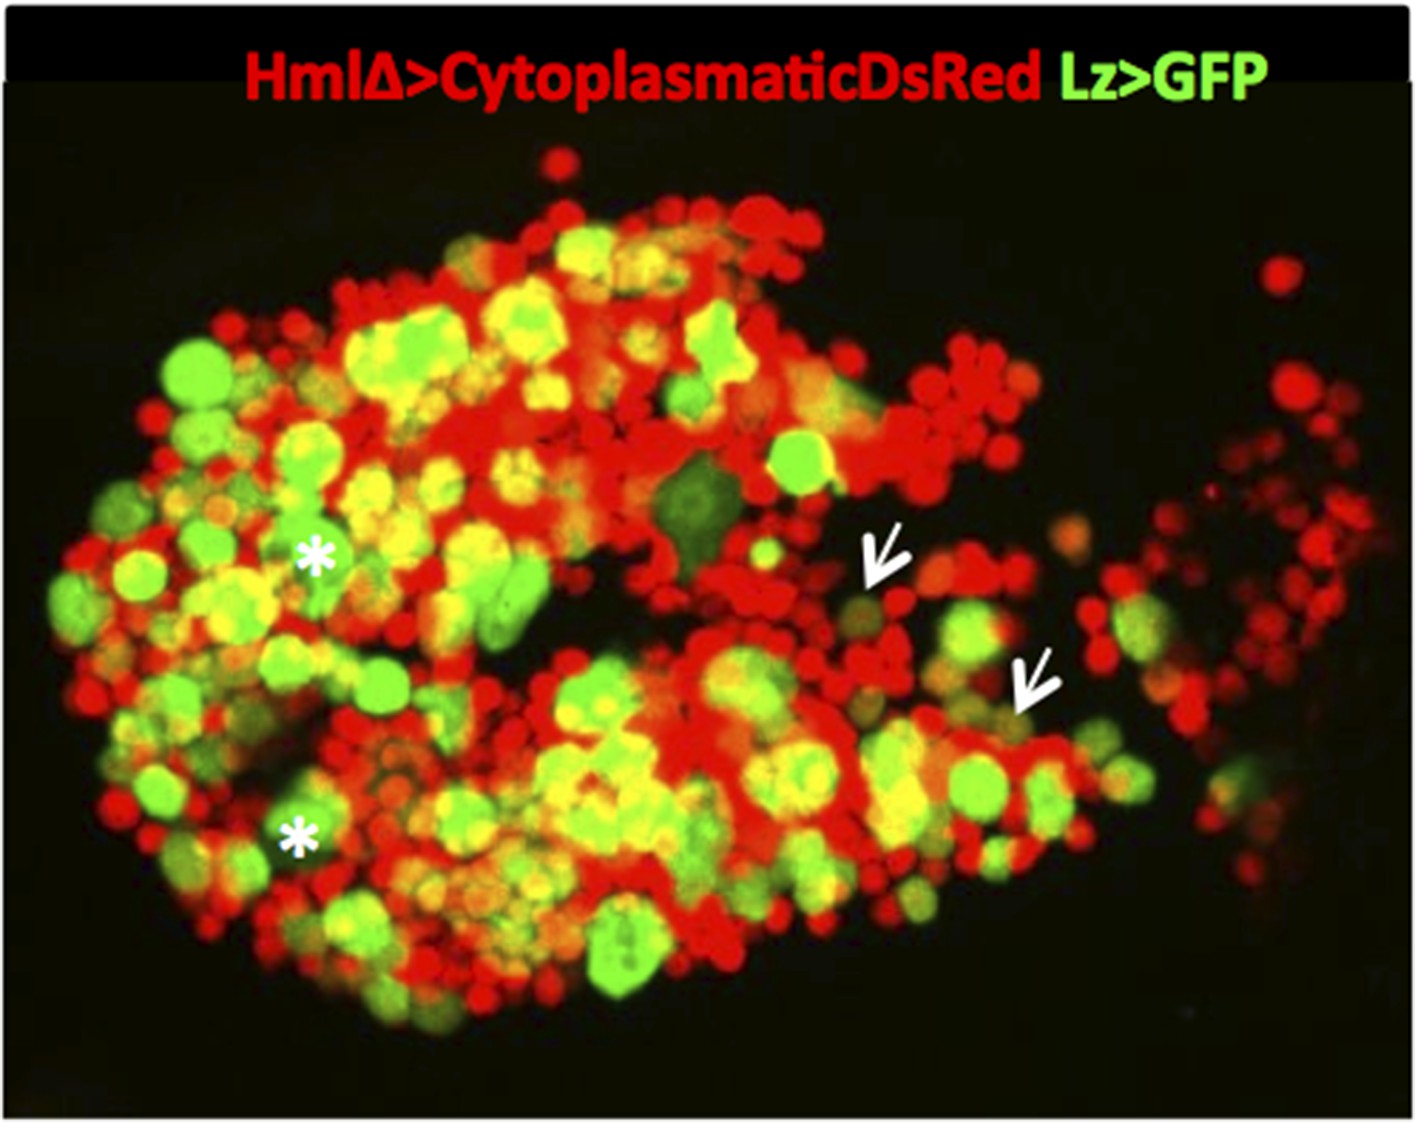
Example of a sessile hemocyte cluster (abdominal segment A7) in a HmlΔ-DsRed; Lz>mCD8GFP larva. It is possible to observe small HmlhighLzlow cells (arrows) and Hml−Lz+ cells (asterisks).
https://doi.org/10.7554/eLife.06166.004
Figure 1—figure supplement 2
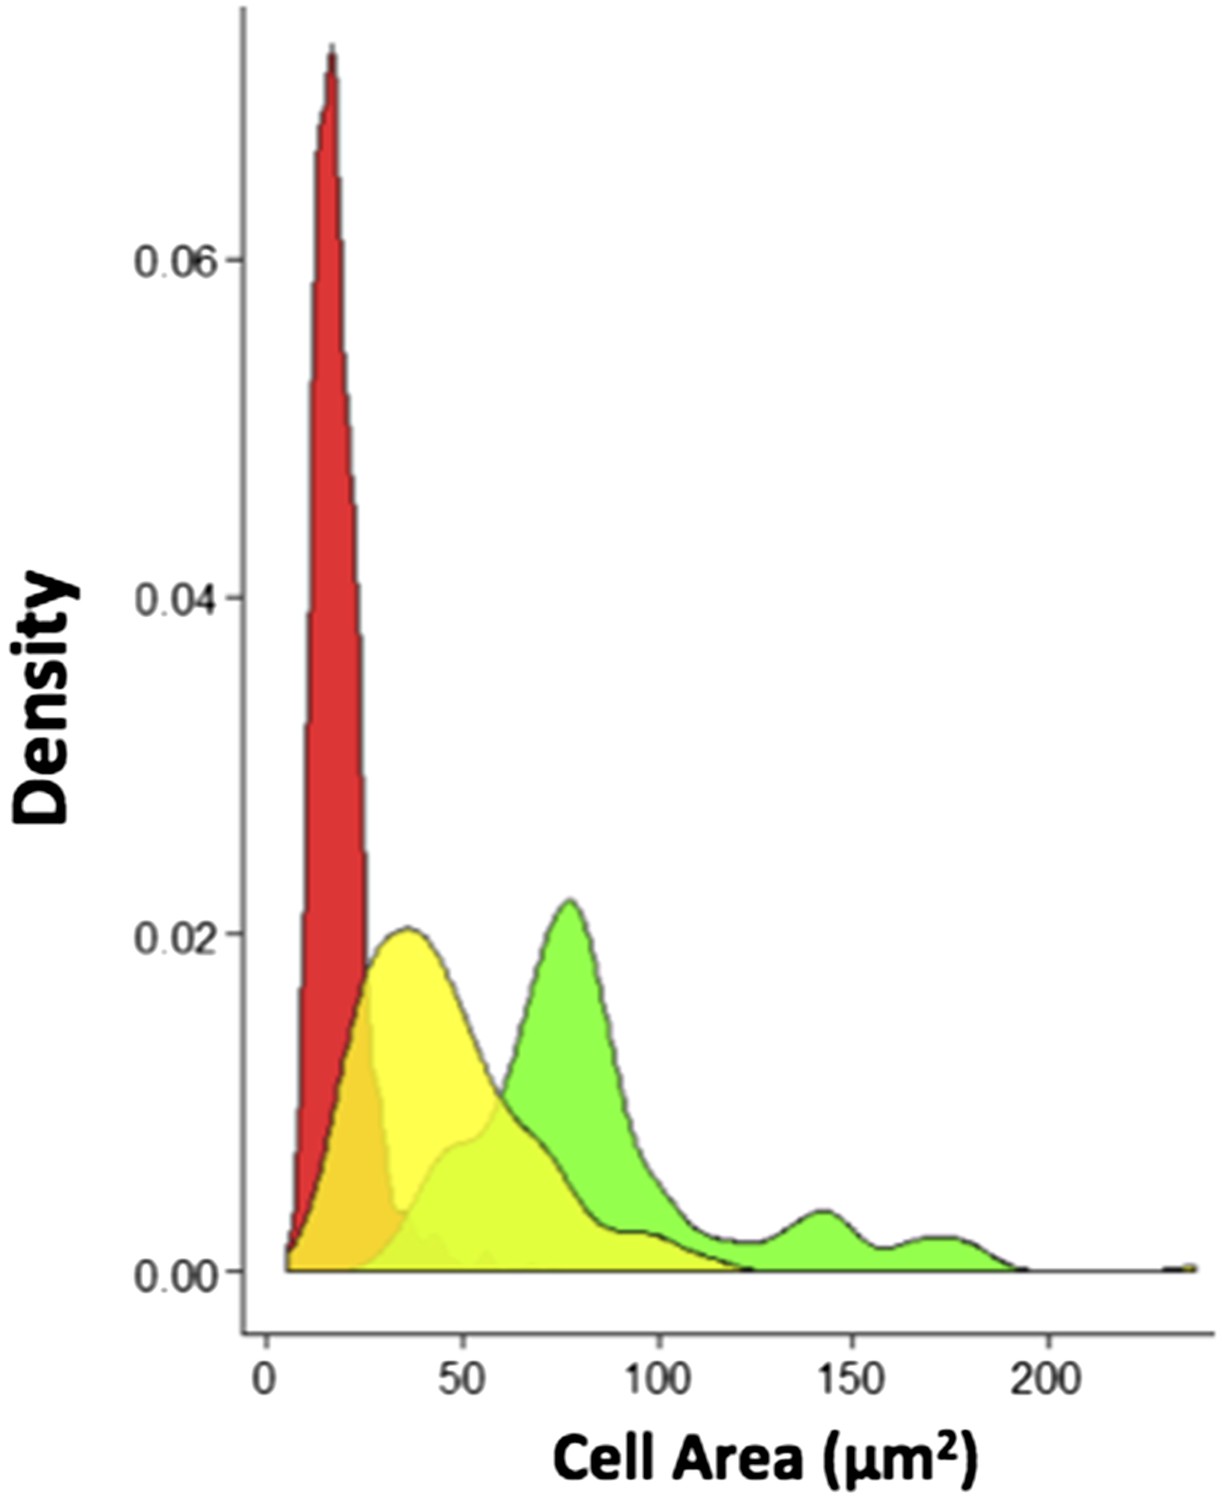
Probability density plots for the different cell type sizes found in sessile clusters of HmlΔ-DsRed; Lz>mCD8GFP larvae (n = 8 samples).
Hml+Lz− plasmatocytes (red peak) are smaller than Hml+Lz− (green peak) and Hml+Lz+ (yellow peak) crystal cells.
Figure 1—figure supplement 3

Throughout the 3-hr period covered in our videos, we can observe that GFP intensity in Lz+ cells increases, as measured by mean grey value of the cell at the beginning (0 min) and at the end (180 min) of the video.
This suggests that, during crystal cell maturation, GFP driven by Lz-GAL4 increases.
Figure 1—figure supplement 4
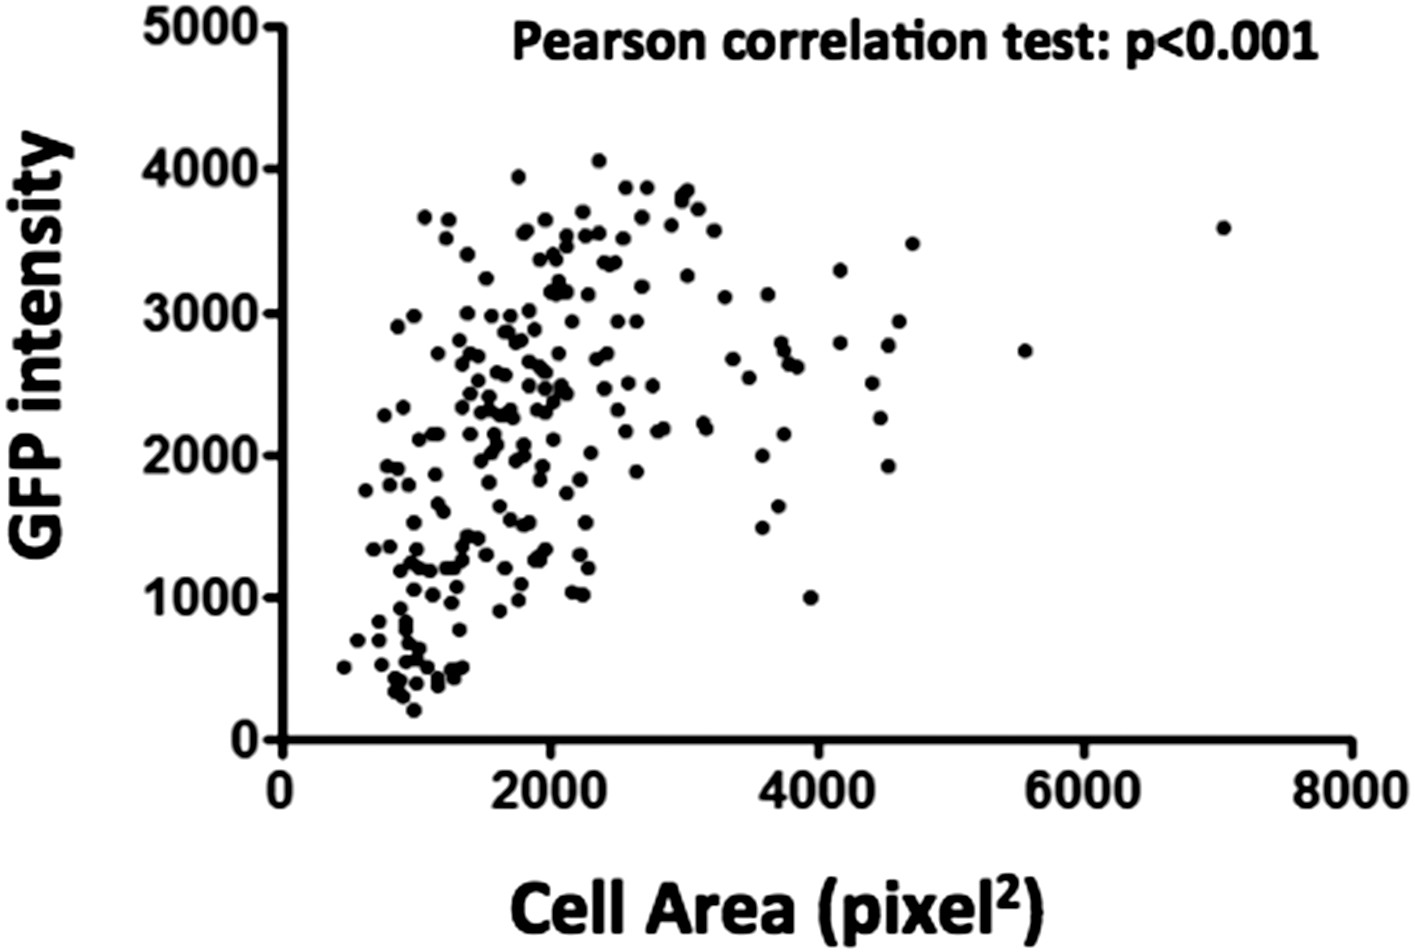
Quantification of GFP intensity and cell area of Lz+ cells in hemolymph smears of HmlΔ-DsRed; Lz>mCD8GFP larvae, shows a strong positive correlation between cell size and GFP intensity.
https://doi.org/10.7554/eLife.06166.007
Figure 2
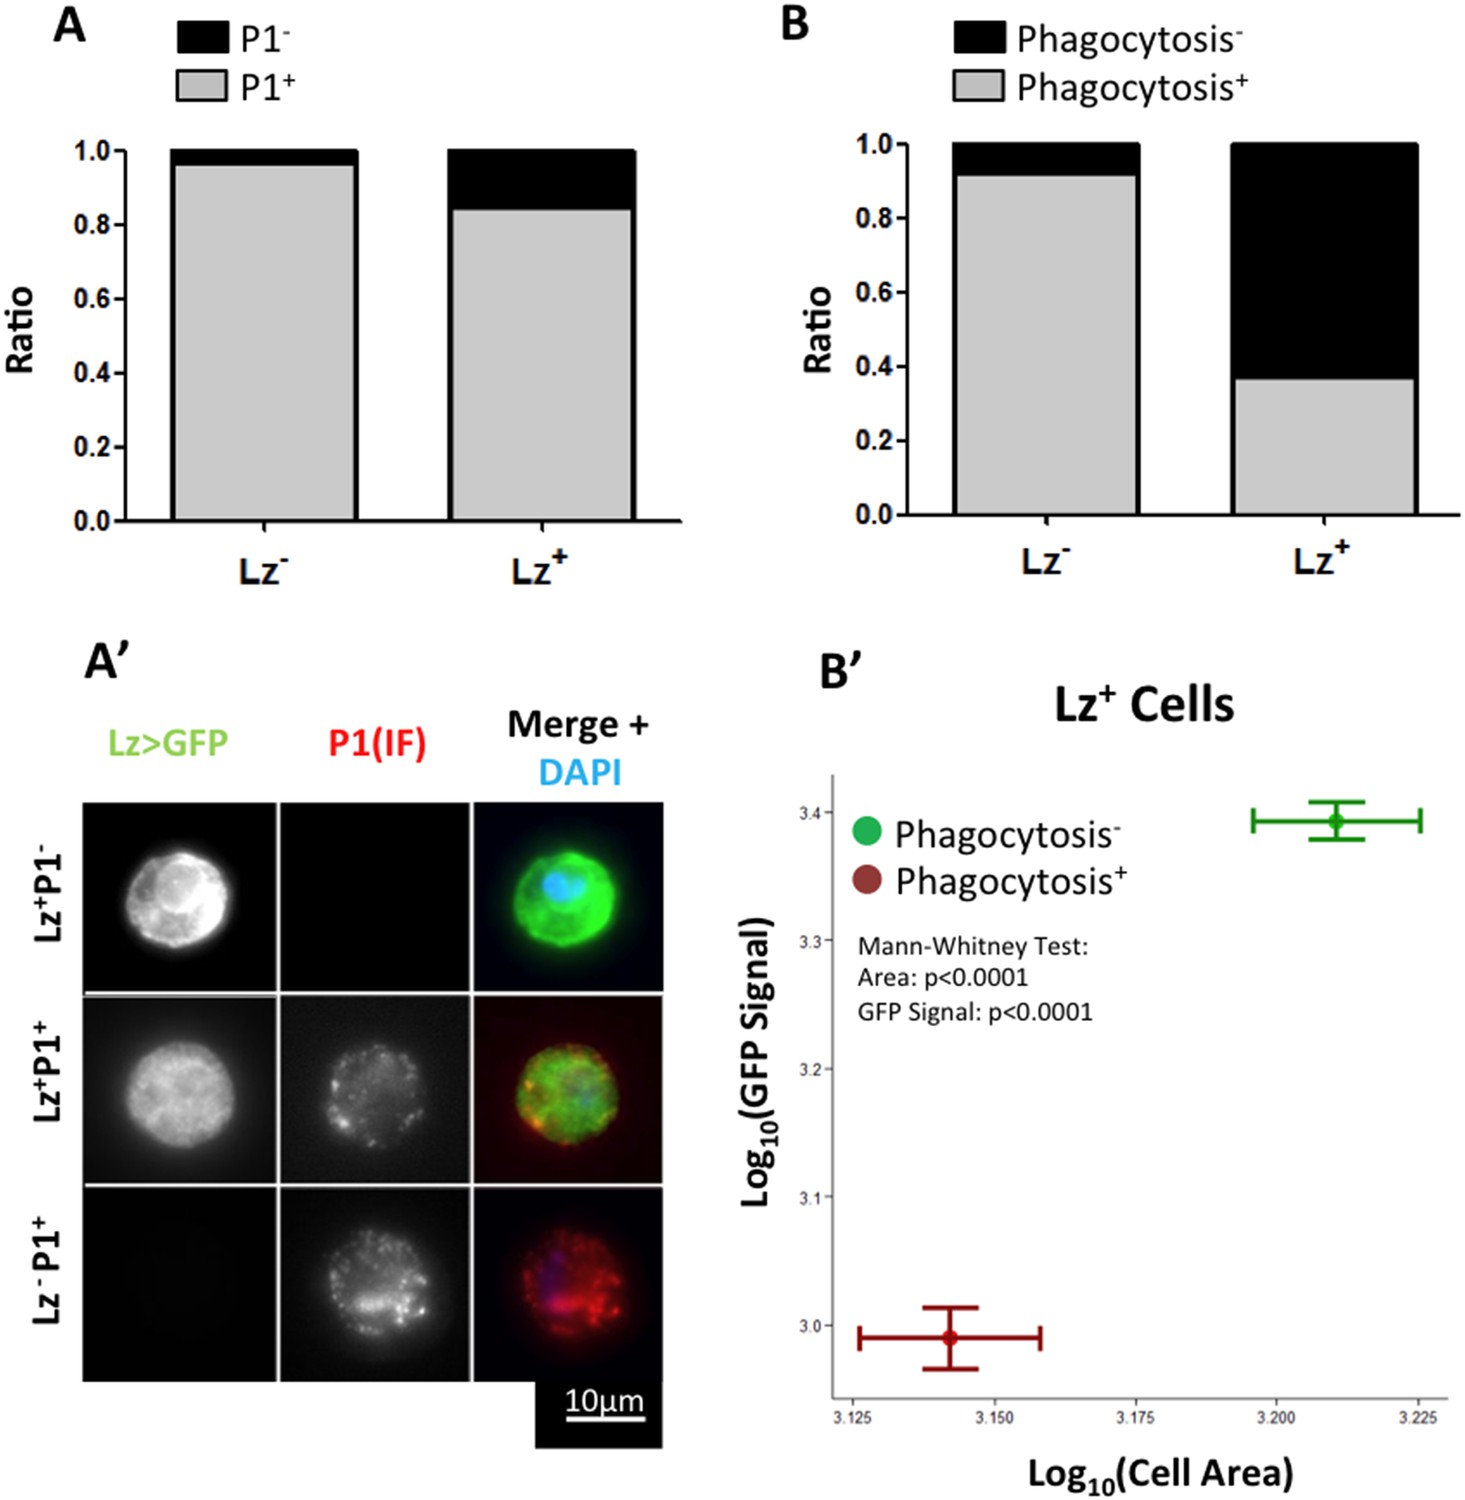
Lz+ cells derive from mature plasmatocytes.
(A) P1 immunofluorescence (IF) staining of sessile hemocytes marks the majority of Lz− and Lz+ cells. Bars represent the mean ratio of P1+ and P1− cells in these two population of cells (n = 10 samples) (A′) Examples of P1+ Lz− plasmatocyte, P1+ Lz+ crystal cell and P1−Lz+ crystal cell. (B) Part of the Lz+ cells are capable of doing phagocytosis. Bars represent the mean ratio between phagocytic and non-phagocytic cells (n = 5 samples). (B′) Phagocytic capacity in Lz+ cells correlates negatively with both cell size and GFP intensity (measured by mean grey value of the picture). Points represent the mean and error bars represent the SEM.
Figure 3 with 5 supplements
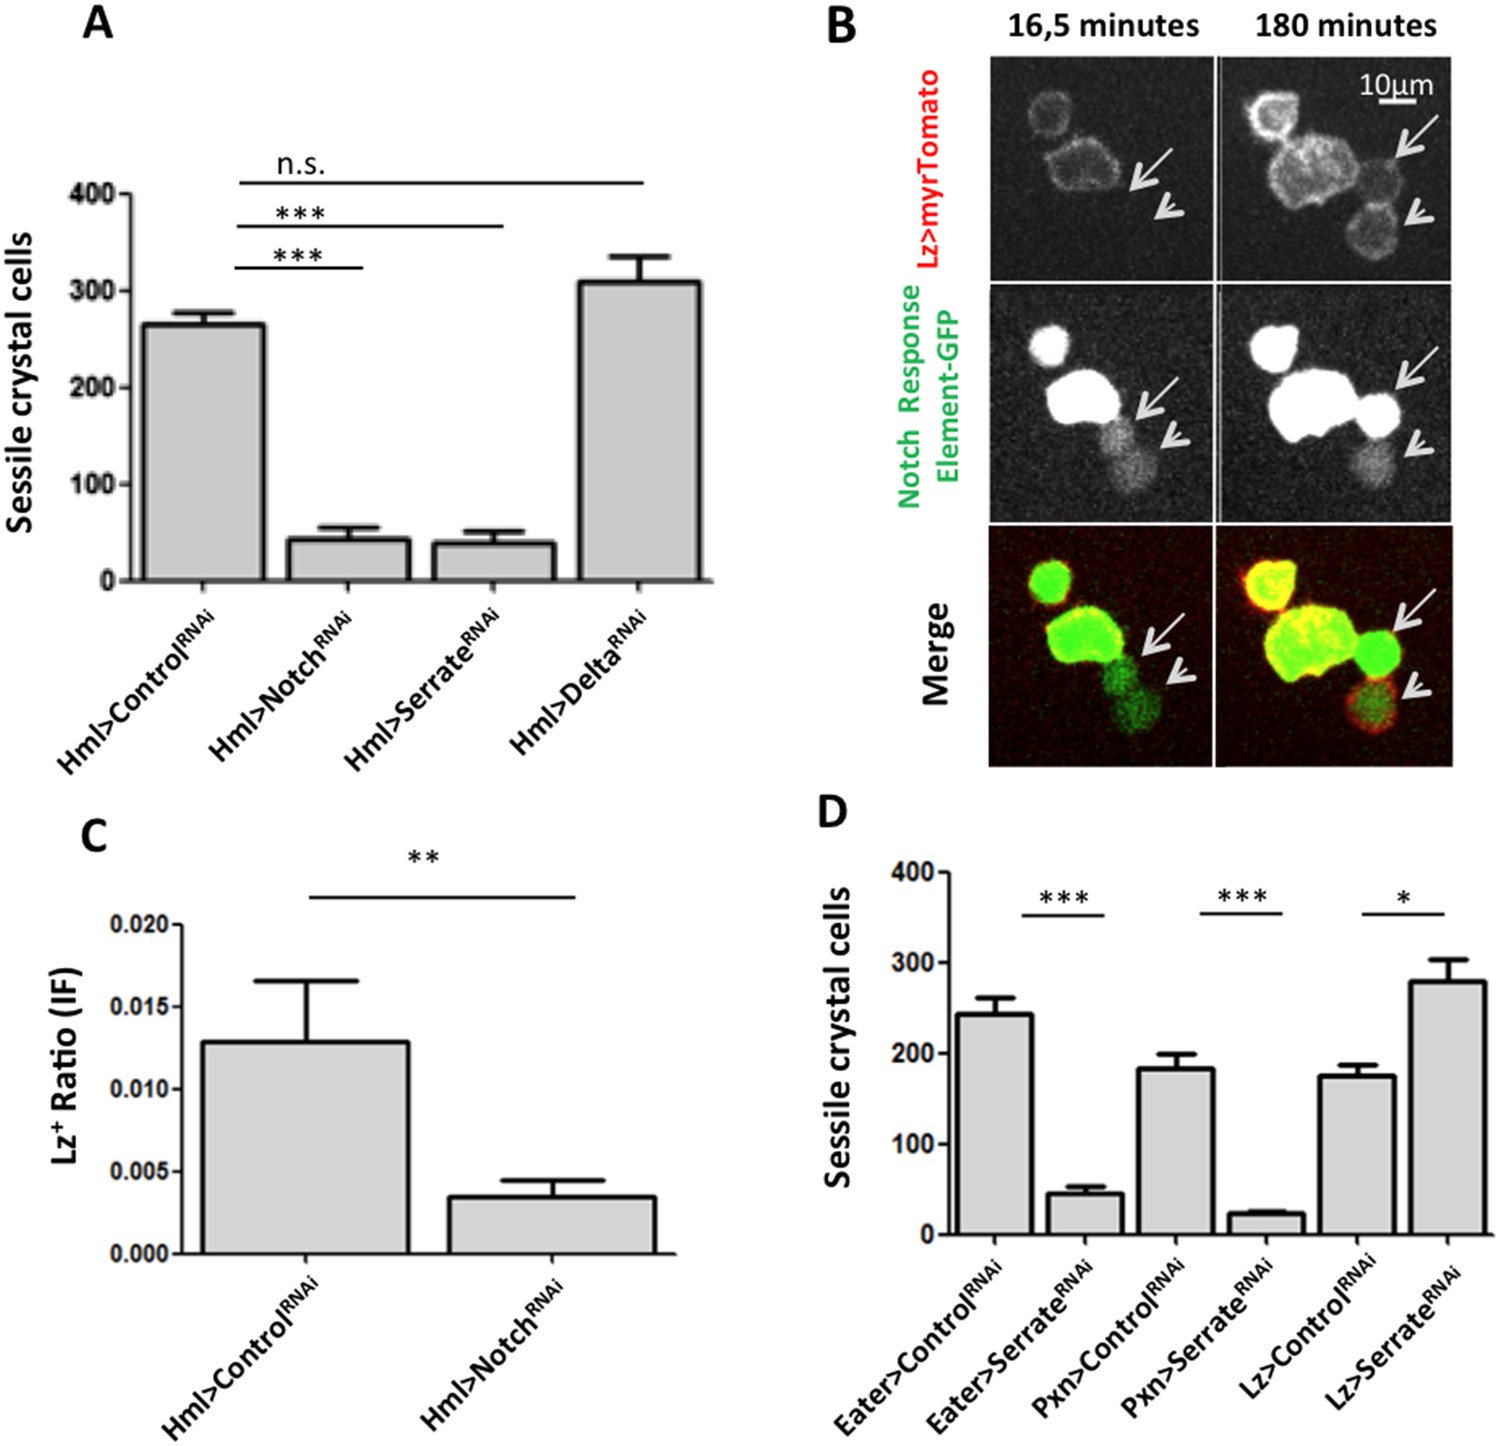
Serrate downregulation in plasmatocytes leads to a reduction in sessile crystal cell number.
(A) Notch RNAi driven in all hemocytes reduces the number of melanized sessile crystal cells observed upon heat shock treatment to the whole larva. A similar level of reduction is seen with SerrateRNAi but not with DeltaRNAi (n = 20). (B) Still images of a 3-hr video showing the induction of lozenge reporter expression in Notch activated hemocytes (arrows). (C) NotchRNAi reduces the proportion of Lz+ cells in sessile hemocytes quantified with P1 immunofluorescence (IF) staining (n = 11 samples). (D) Serrate RNAi driven only in Lz+ cells does not reduce the number of melanized sessile crystal cells seen upon heat shock treatment contrarily to two other drivers expressed in plasmatocytes, Eater-GAL4 and Pxn-GAL4 (n = 20 samples). In all graphics only female larvae are shown, error bars represent SEM, n.s. = non significant p-value, **p < 0.01, ***p < 0.001.
Figure 3—figure supplement 1
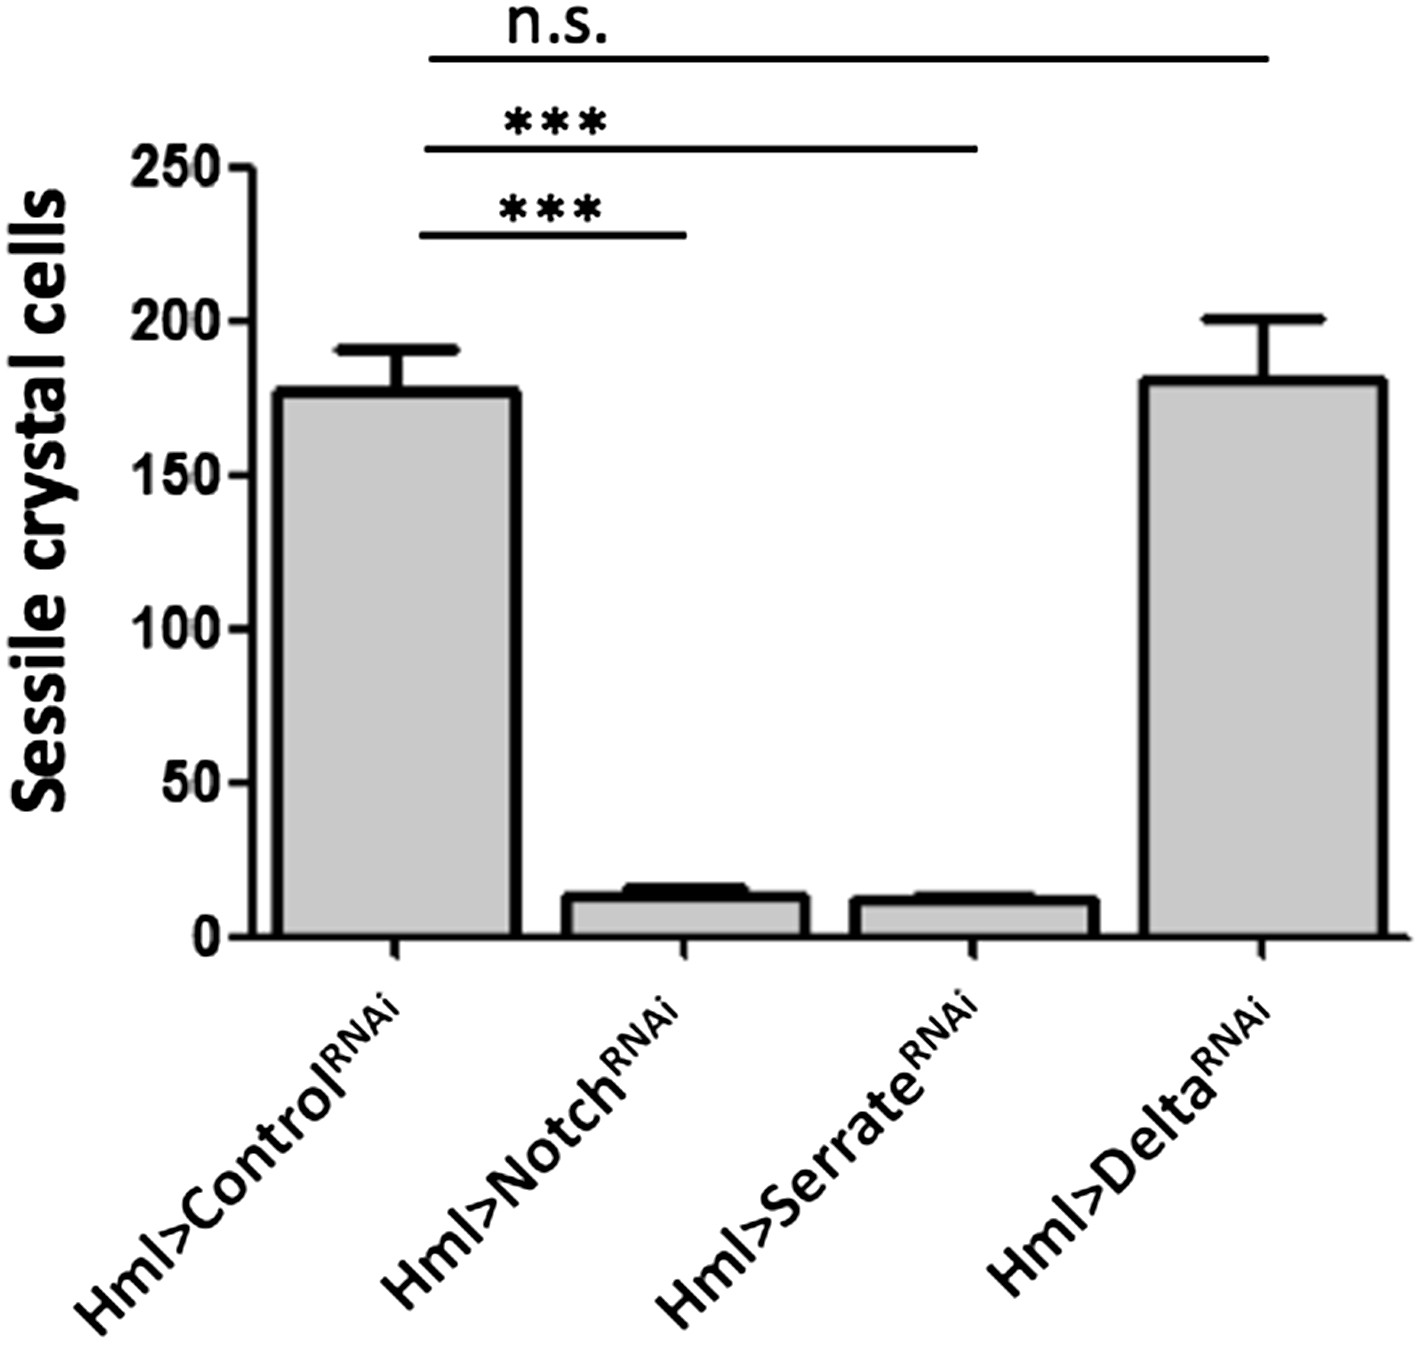
NotchRNAi and SerrateRNAi but not DeltaRNAi driven in all hemocytes reduce the number of melanized sessile crystal cells observed upon heat shock treatment to the whole larva (males are shown, n = 20).
Error bars represent the SEM. n.s. = p ≥ 0.05, *p < 0.05, **p < 0.01, ***p < 0.001.
Figure 3—figure supplement 2

The localization of hemocyte in sessile clusters is not affected by Notch pathway manipulation through RNAi induction under HmlΔ-GAL4 control.
The large sessile hemocyte cluster in the dorsal side of the abdominal segment A7 is highlighted in all larvae (dotted yellow circle).
Figure 3—figure supplement 3
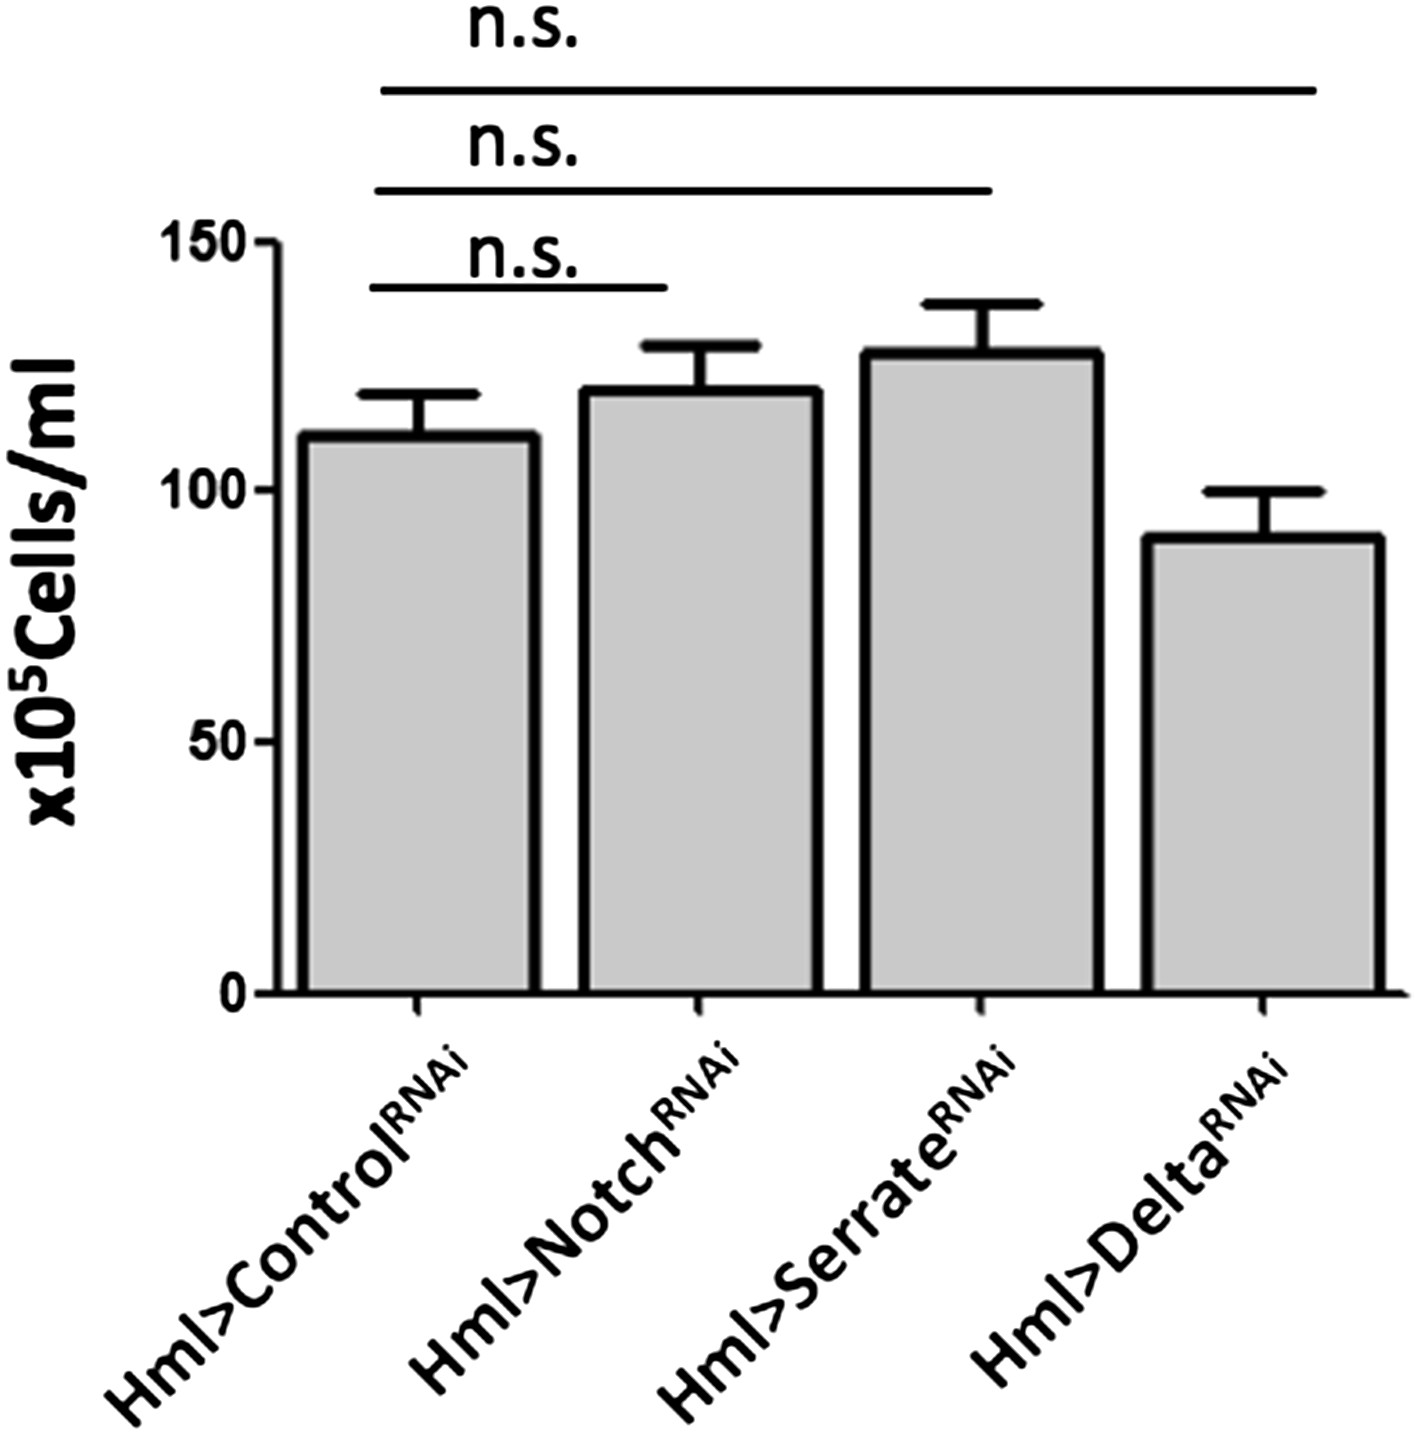
Notch pathway manipulation through RNAi induction under HmlΔ-GAL4 control, does not change hemocyte concentration in hemolymph.
Bars represent the mean value of total hemocyte concentrations (n = 20 samples), error bars represent the SEM. n.s. = p ≥ 0.05.
Figure 3—figure supplement 4

Notch knockdown through RNAi under HmlΔ-GAL4 control does not increase cell death as measured by a flow cytometry Propidium Iodide (PI) exclusion assay , error bars represent the SEM. n.s. = p ≥ 0.05.
https://doi.org/10.7554/eLife.06166.014
Figure 3—figure supplement 5
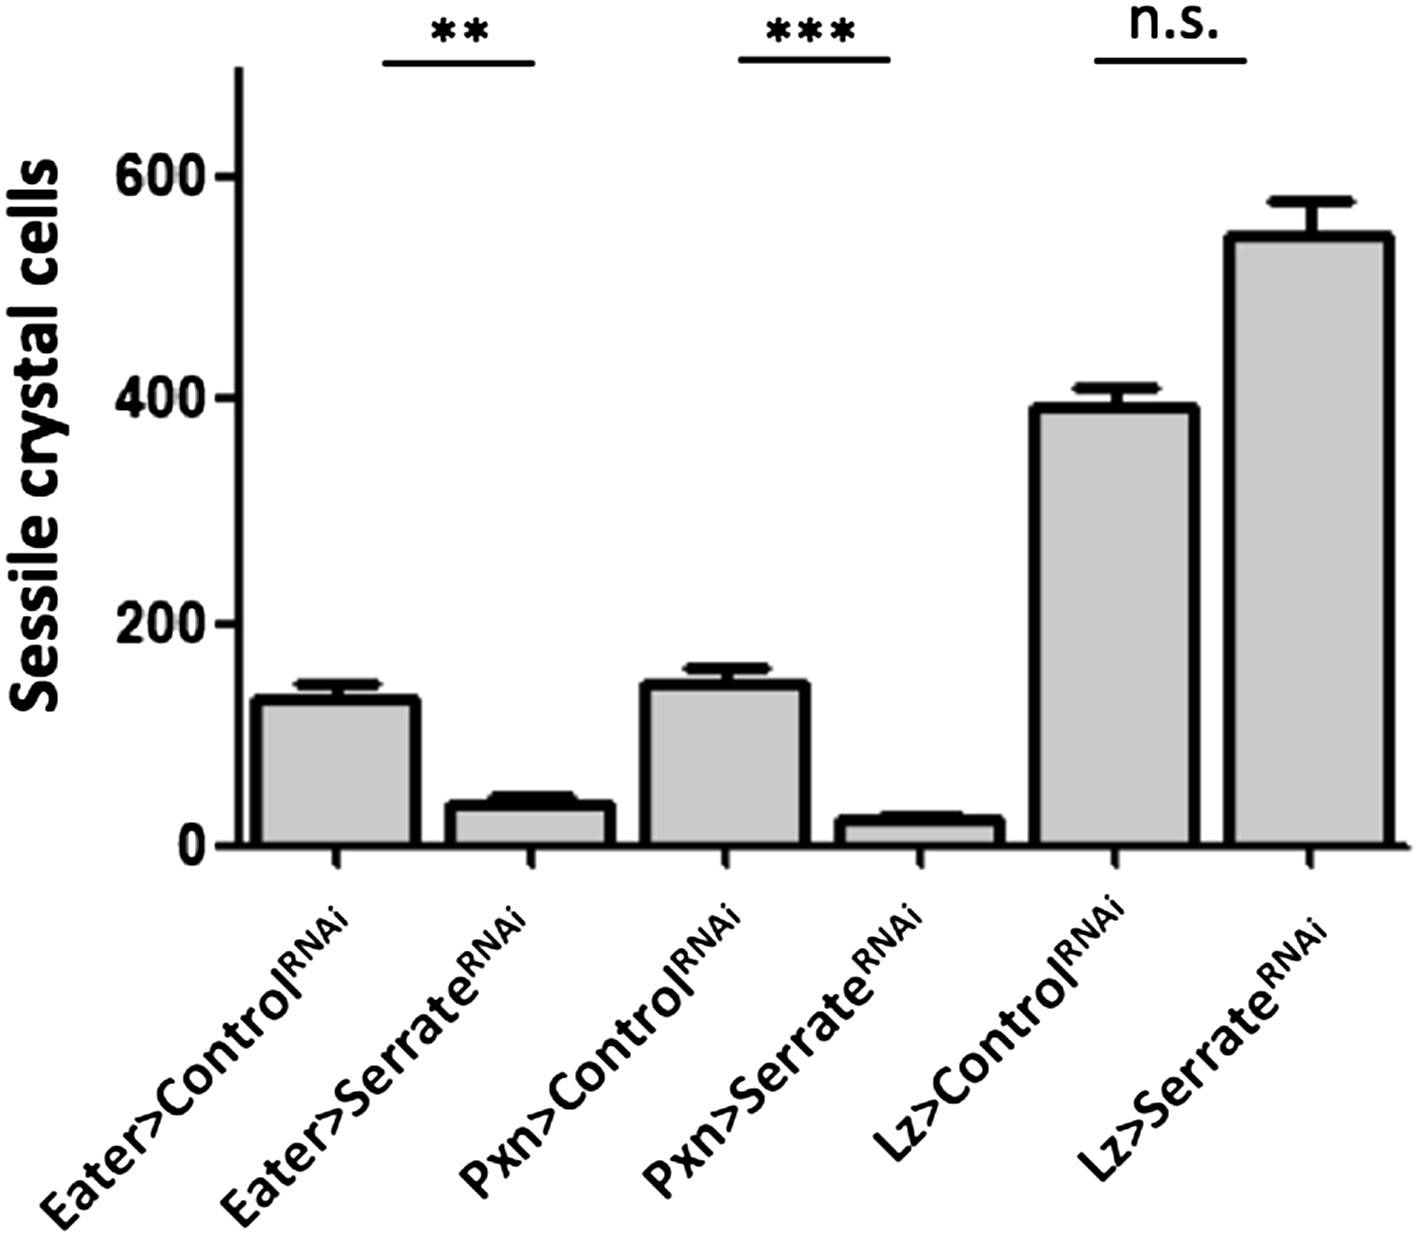
Serrate RNAi driven only in Lz+ cells does not reduce the number of melanized sessile crystal cells seen upon heat shock treatment contrarily to two other drivers expressed in plasmatocytes, Eater-GAL4 and Pxn-GAL4 (males are shown, n = 20 samples).
Error bars represent the SEM. n.s. = p ≥ 0.05, * = p < 0.05, ** = p < 0.01, *** = p < 0.001.
Figure 4 with 3 supplements
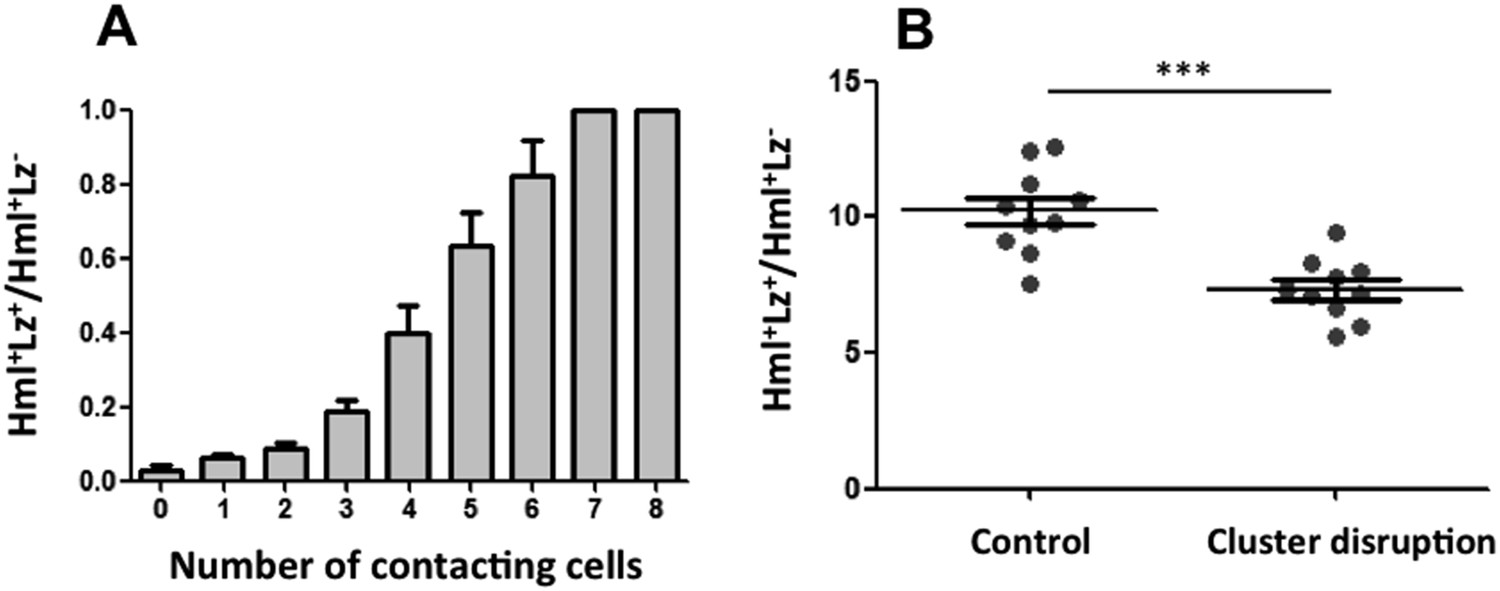
Cluster structure is necessary for crystal cell development.
(A) Sessile hemocytes in Lz>mCD8GFP HmlΔ-cytoplasmic DsRed larvae were scored for the number of contacts. Probability of a cell being Lz+ increases linearly with the number of cells it is in contact with. (n = 8) (B) In early third instar larvae, the continued disruption of clusters for a 10-hr period leads to a reduction in the proportion of Lz+ cells (circulating and sessile cells were quantified). Error bars represent SEM, ***p < 0.001.
Figure 4—figure supplement 1
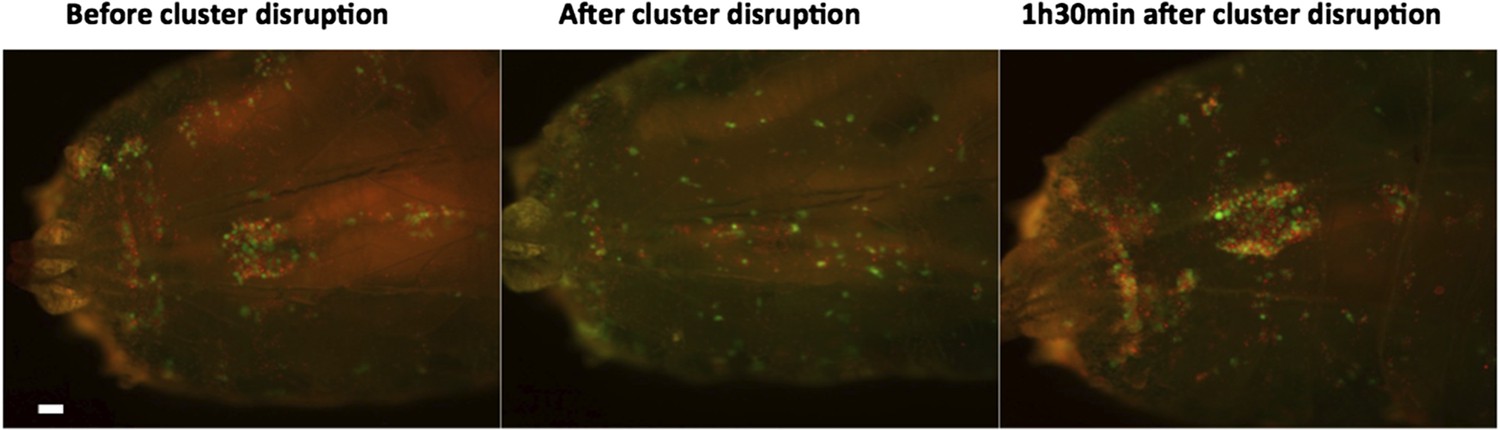
In HmlΔ-nuclearDsRed; Lz-GAL4, UAS-GFP larvae, the dorsal cluster in the A7 segment is easily observed (left panel).
After physical manipulation, the number of cells in the cluster is severely reduced (middle panel). 1 hr 30 min after manipulation clusters are re-established (right panel).
Figure 4—figure supplement 2
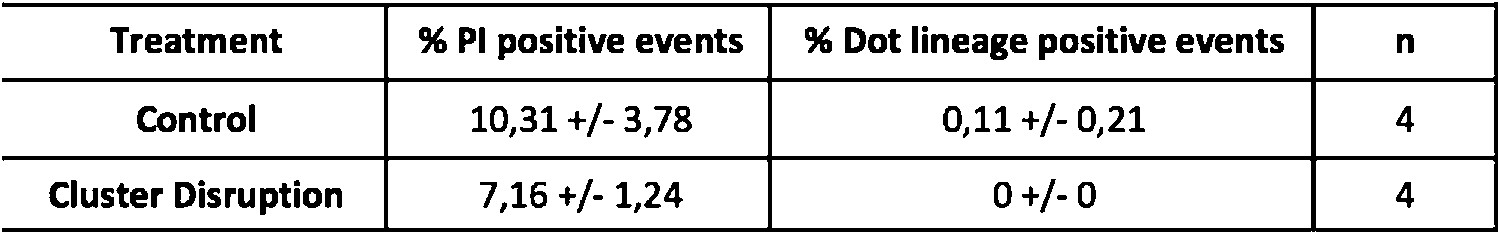
Flow cytometry analysis for cell viability and Dot-GAL4 lineage tracing in cluster disrupted larvae.
Disrupting the clusters does not increase the percentage of dying hemocytes and does not induce the release of hemocytes from the lymph gland. Numbers represent means ± SEM.
Figure 4—figure supplement 3
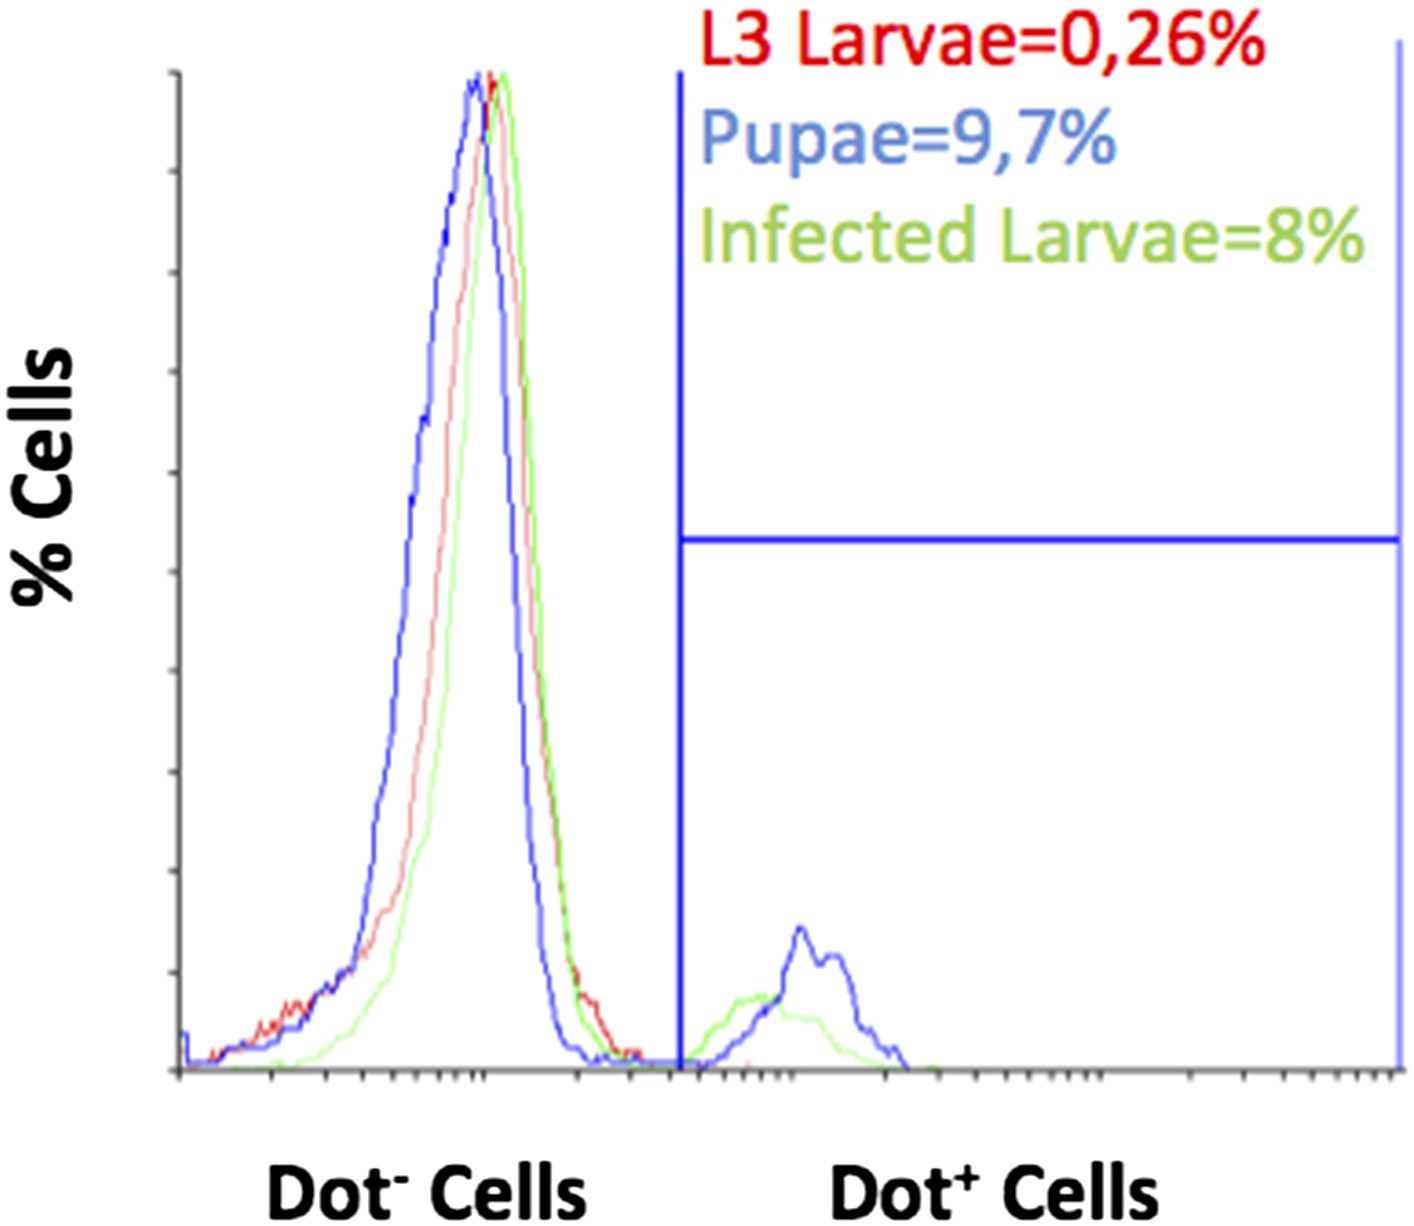
It is possible to detect lymph gland derived hemocytes by flow cytometry with Dot-GAL4 lineage-traced hemocytes in pupa (blue line) or when larvae are infected with parasitoid wasps (green line).
In contrast, lymph gland-derived hemocytes are virtually absent from L3 larvae in homeostasis (red line).
Videos
Video 1
Induction of lozenge expression in hemocyte clusters.
HmlΔ-nuclearDsRed; Lz>EGFP hemocytes in a dorsal cluster. Examples of Hml+Lz− hemocytes in division are highlighted with green circles and examples of Hml+Lz− hemocytes differentiating into Hml+Lz+ hemocytes identified by a red circle. Scale bar = 10 μm.
Download links
A two-part list of links to download the article, or parts of the article, in various formats.
Downloads (link to download the article as PDF)
Open citations (links to open the citations from this article in various online reference manager services)
Cite this article (links to download the citations from this article in formats compatible with various reference manager tools)
Drosophila sessile hemocyte clusters are true hematopoietic tissues that regulate larval blood cell differentiation
eLife 4:e06166.
https://doi.org/10.7554/eLife.06166


