Sensitization of neonatal rat lumbar motoneuron by the inflammatory pain mediator bradykinin
- Aix-Marseille Université and CNRS, France
- Aix Marseille Université and INSERM, France
- Hungarian Academy of Sciences, Hungary
- Pázmány Péter Catholic University, Hungary
- Cornell University, United States
Figures
Figure 1 with 1 supplement
Bradykinin potentiates the gain of sensory inputs into the motor system.
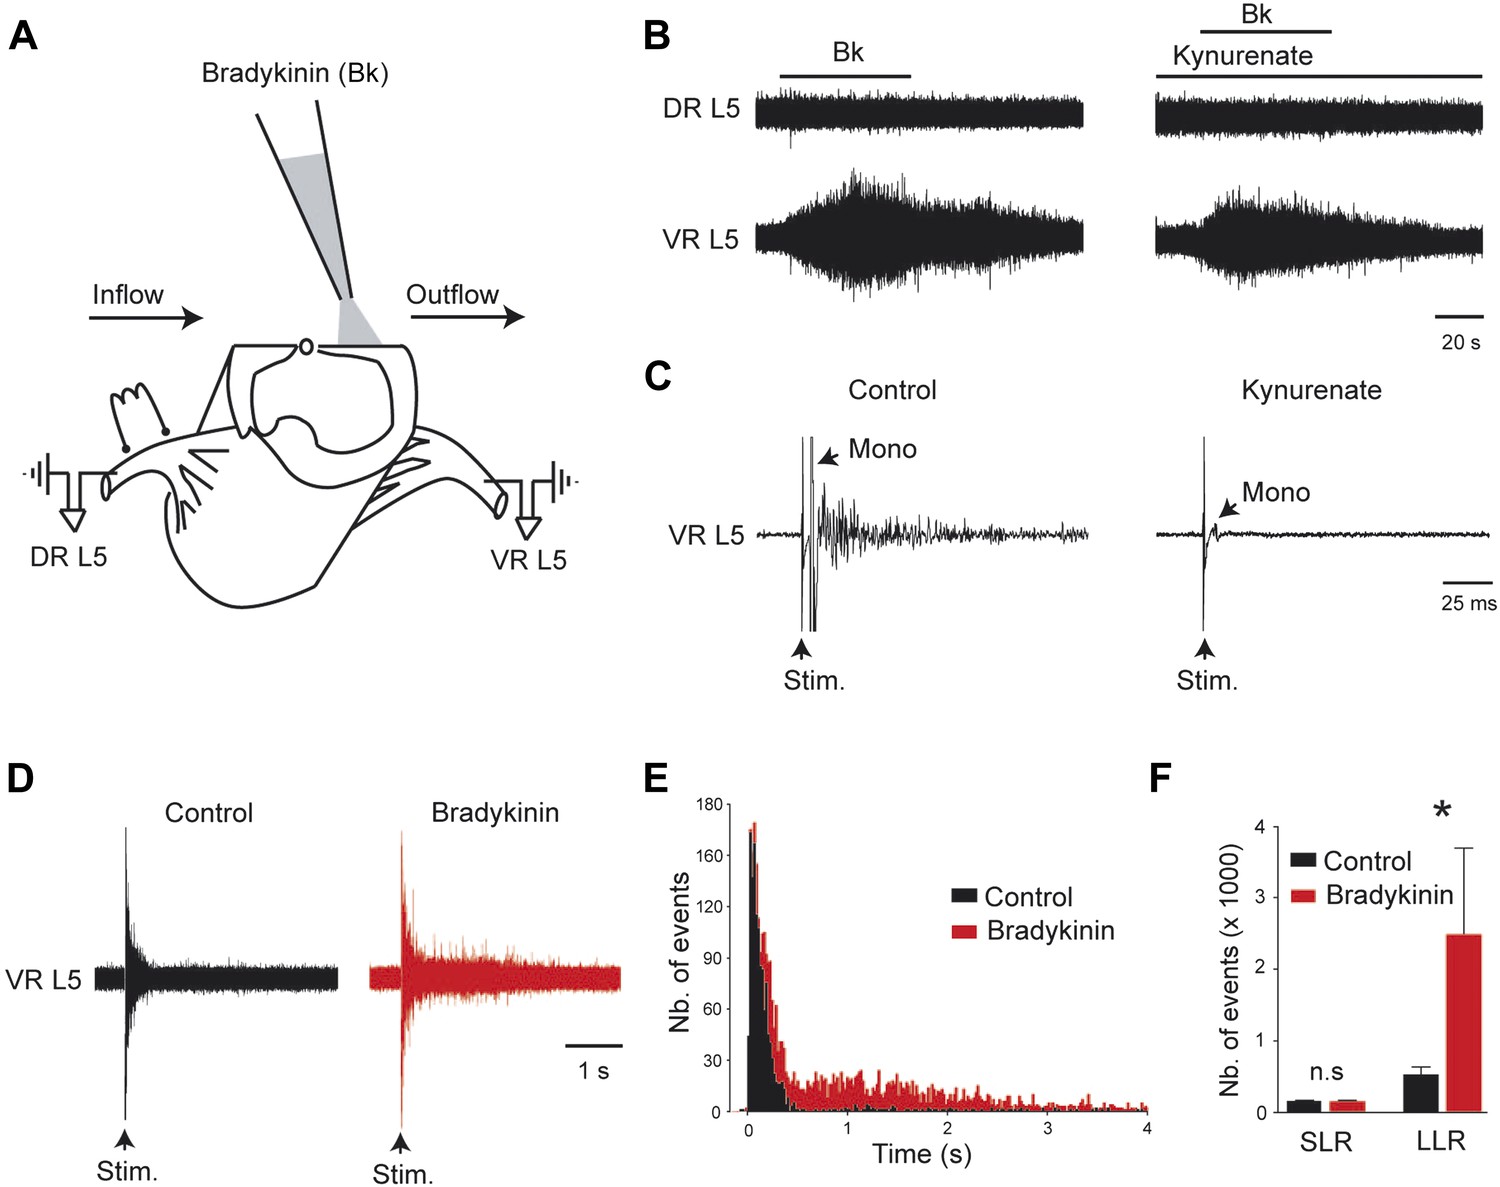
(A) Drawing of a midsagittally hemisected rat spinal cord illustrating localized Bk application to the lumbar motor column, and dorsal (DR) and ventral (VR) roots used for reflex testing. (B) Responses to ventral application of bradykinin (Bk, 4 µM pipette concentration) recorded via the lumbar L5 dorsal (DR L5) and ventral (VR L5) roots before (left) and after (right) the fast glutamatergic synaptic transmission was blocked by kynurenate (1.5 mM). (C) Ventral root response to ipsilateral dorsal root stimulation before (left) and after (right) application of kynurenate (1.5 mM). Single arrows indicate the monosynaptic reflex (mono) and the stimulus artifact (stim). (D) Five superimposed responses recorded from an L5 ventral root induced by stimulations of the ipsilateral dorsal root before (control, black trace) and after local application of low concentrations of Bk (1 µM pipette concentration, red trace). (E) Average peristimulus time histogram (PSTH, bin width: 20 ms) of L5 ventral root recordings collected before (black) and after (red) the local application of Bk (1 µM pipette concentration). (F) Group means quantification of the PSTH for the transient short latency and long-lasting reflexes computed over a window 10–40 ms and 500–4000 ms post stimulus, respectively, before (black) and after (red) local application of Bk. Error bars indicate SEM. *p < 0.05 (Wilcoxon paired test).
Figure 1—figure supplement 1

At the right, five superimposed responses recorded under spantide (2 µM) from the L5 ventral root of an hemichord preparation and induced by stimulations of the ipsilateral dorsal root before (control, black trace) and after local application of low concentrations of Bk (1 µM pipette concentration, red trace).
At the left, group means quantification of the PSTH for the transient short latency and long-lasting reflexes computed over a window 10–40 ms and 500–4000 ms post stimulus, respectively, before (black) and after (red) local application of Bk. Error bars indicate SEM. ns, not significant,*p < 0.05 (Wilcoxon paired test).
Figure 2

Bradykinin enhances repetitive firing and promotes self-sustained spiking.
(A–C) Typical responses of a motoneuron to incrementing 1-s current injections (A) with its respective frequency–current (B) and voltage–current (C) relationships before (black traces) and after (red traces) bath applying bradykinin (Bk, 8 µM). Large hyperpolarizing currents revealed the presence of an inward rectification causing a depolarizing ‘sag’ (arrowheads). Initial potential was held at −70 mV. Note that a negative current injection was employed to counter the Bk-induced depolarization so that Bk measurements were also made at −70 mV. (D) Action potentials aligned in time on their peaks before and during Bk. (E) Afterhyperpolarization following a single action potential (truncated). Initial holding potential, −60 mV. (F) Superimposed voltage traces recorded in response to a 2-s depolarizing pulse from a holding potential of −60 mV before (black trace) and after (red trace) bath applying Bk (8 µM). Bottom traces in A, E, and F are the injected current protocol.
Figure 3 with 1 supplement
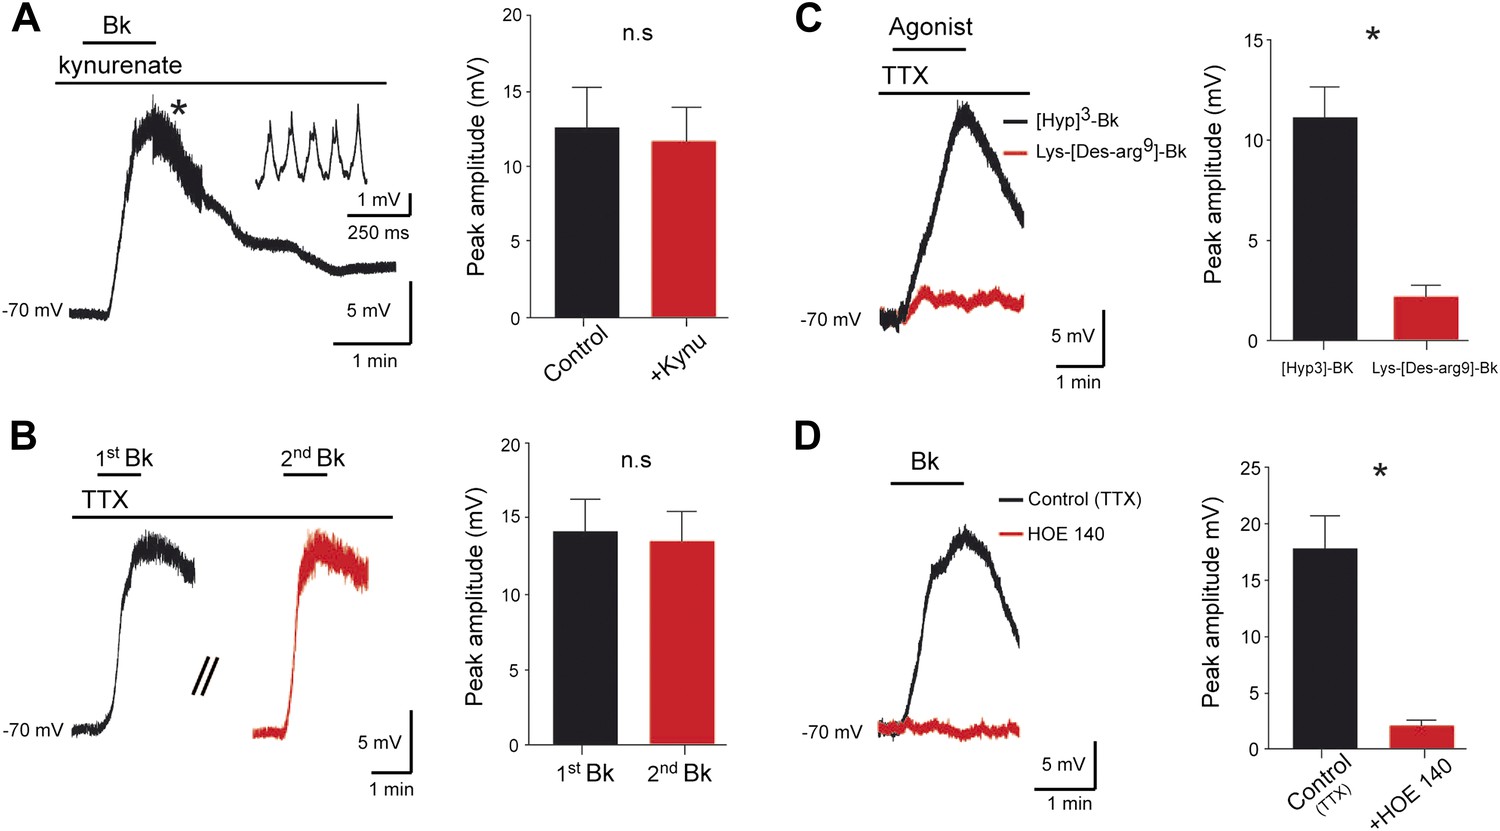
Bradykinin depolarizes lumbar motoneurons by a direct postsynaptic action of B2 receptors.
(A) Voltage trace in response to bradykinin (Bk) collected under kynurenate (1.5 mM). The asterisk indicates the point shown by the trace at right with higher temporal resolution, where spikelets occurred. (B) Sequential depolarizations recorded under TTX (1 µM) induced by two successive applications of Bk (Bk, 8 µM) with intervals of 20 min (C) Voltage traces collected under TTX during application of either Lys-[Des-Arg9]-Bk, a selective B1 receptor agonist (red trace), or [Hyp3]-Bk, a selective B2 receptor agonist (black trace). (D) Voltage traces collected under TTX in response to bradykinin (Bk), before (black) and after (red) pretreatment with the selective B2 receptor antagonist HOE-140. At the right of each panel, graphs show the mean peak amplitude of membrane depolarizations induced by Bk or by one of its agonists. Drug application periods are indicated by lines above the records. Error bars indicate SEM. ns, not significant, *p < 0.05. (A, B, D: Wilcoxon paired test; C: Mann–Whitney test).
Figure 3—figure supplement 1
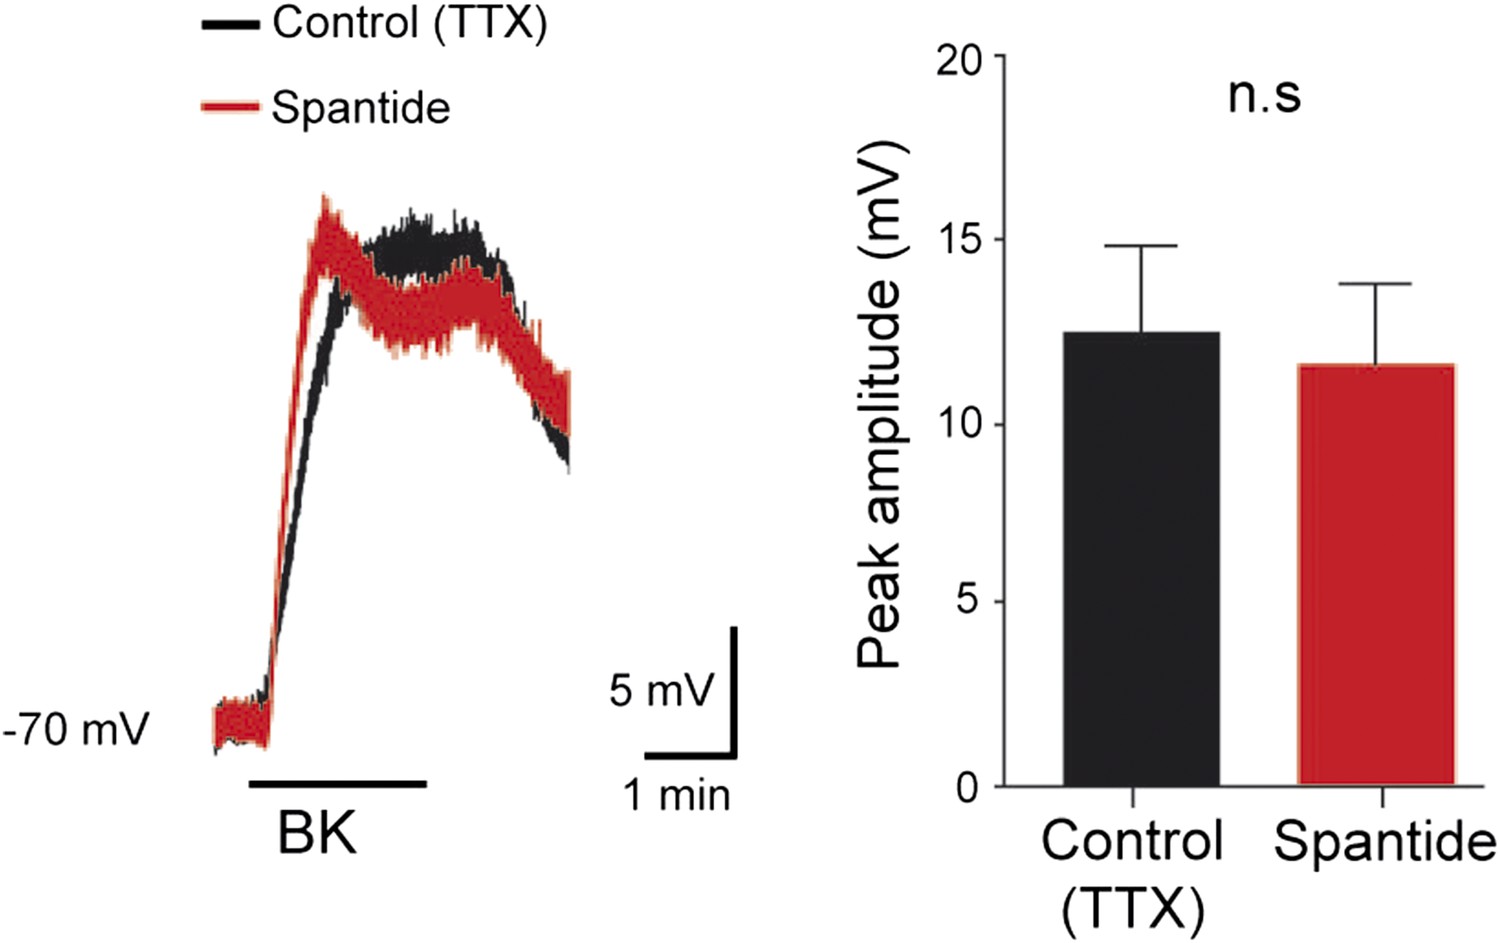
At the left, superimposed voltage traces recorded from a L5 motoneuron in response to bradykinin (Bk) collected under TTX (0.5 µM) before and after the application of spantide (2 µM).
At the right, histogram plotting the peak amplitude of membrane depolarizations induced by Bk before (black) and after (red) the superfusion of the medium. ns, not significant (Wilcoxon paired test).
Figure 4
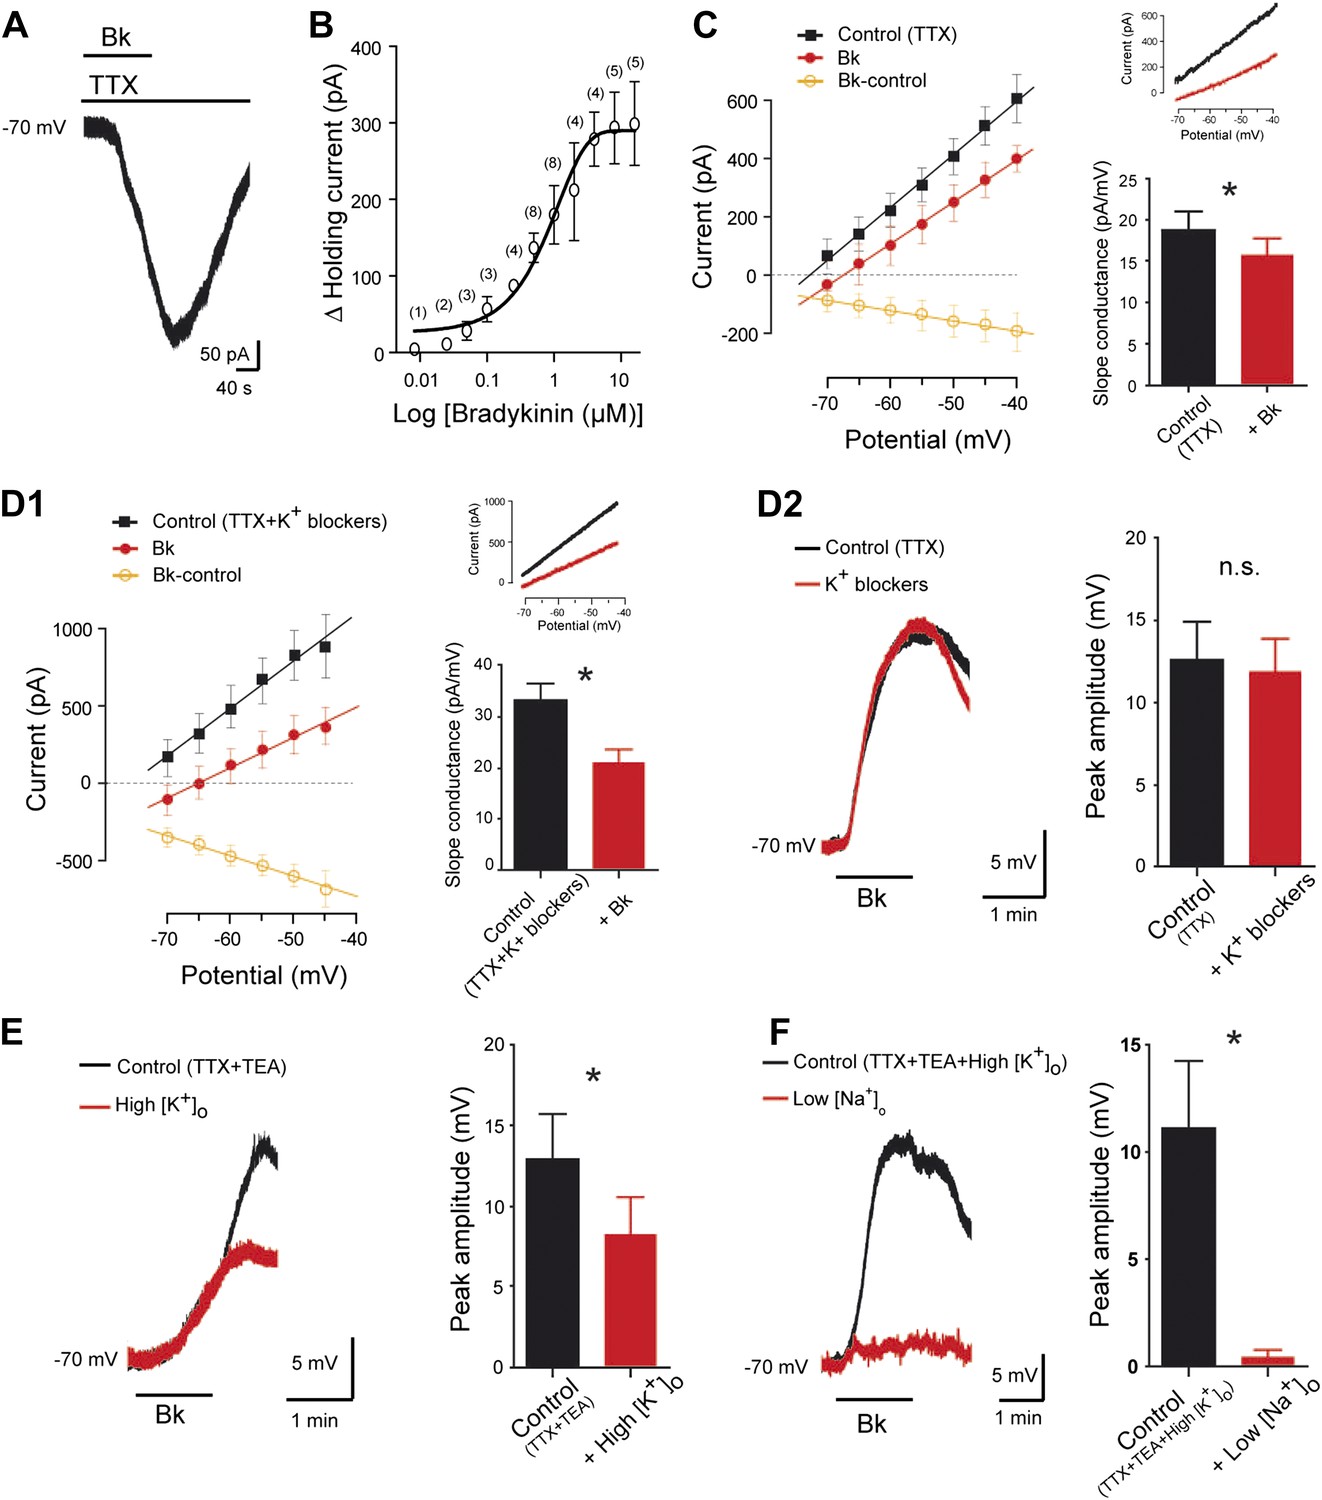
Bradykinin inhibits a leak K+ current and activates a Na+-dependent nonselective cationic current.
(A) Representative inward current induced by bradykinin (Bk, 8 µM) in lumbar motoneuron. Voltage clamp, Holding potential, −70 mV. (B) Dose-response curve of Bk-induced changes in peak holding current. Numbers in the parenthesis are number of cells recorded. (C) At the left, I–V relationships reconstructed from voltage ramp data under TTX (0.5 µM) before (black trace) and at the peak of the response to bath-applied Bk (red trace). The orange trace with open circles illustrates the I–V relation of the difference current representing the Bk-sensitive current. At the right, current traces from a representative cell and histogram plotting changes in the slope conductance induced by Bk. (D1) At the left, I–V relationships reconstructed from voltage ramp data in a medium containing TTX (0.5 µM), TEA (10 mM), 4-aminopyridine (2 mM), the HCN-channel blocker ZD7288 (20 µM), and apamin (100 nM) before (black trace) and after (red trace) a bath application of Bk (8 µM). The orange trace with open circles illustrates the mean I–V relation of the difference current representing the Bk-sensitive current. At the right, current traces from a representative cell and histogram plotting changes in the slope conductance induced by Bk. (D2) Superimposed voltage traces under TTX (0.5 µM) and TEA (10 mM) in response to Bk before (black) and after (red) the superfusion of a medium containing TEA (10 mM), 4-aminopyridine (2 mM), the HCN-channel blocker ZD7288 (20 µM) and apamin (100 nM). (E) Superimposed voltage traces under TTX (0.5 µM) and TEA (10 mM) in response to Bk before (black) and after (red) the superfusion of a medium with high [K+]o (9 mM). (F) Superimposed voltage traces under TTX (0.5 µM), TEA (10 mM), and high [K+]o (9 mM) in response to Bk before (black) and after (red) the superfusion of a medium with low [Na+]o. At the right of each panel, histogram plotting the peak amplitude of membrane depolarizations induced by Bk before (black) and after (red) the superfusion of the medium. Drug application periods are indicated by horizontal lines. Error bars indicate SEM, ns, not significant, *p < 0.05 (Wilcoxon paired test).
Figure 5
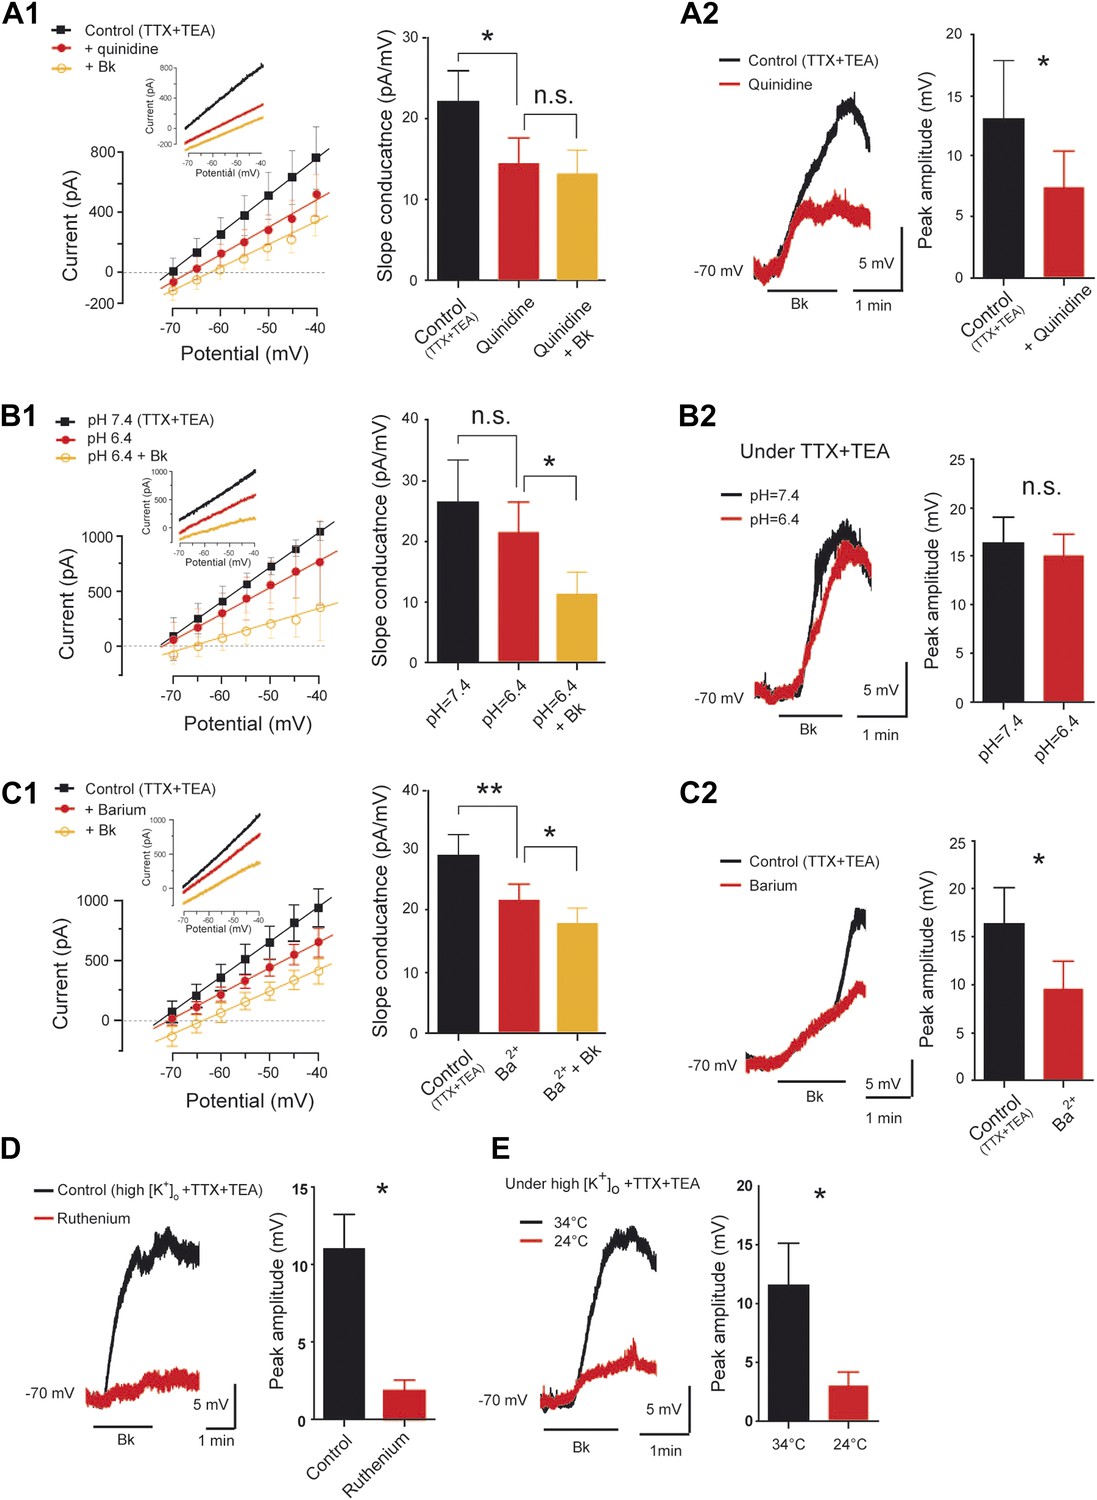
Pharmacological profile of the bradykinin-induced current.
(A1–C1) At the left, superimposed I–V relationships reconstructed from voltage ramp data (representative data in inserts) before (black trace) and after (red trace with filled circles) quinidine (200 µM, A1), extracellular acidosis (B1), or barium (300 µM, C1). In each panel the orange trace with open circles illustrates the mean I–V relation obtained during bradykinin application (Bk, 8 µM) under quinidine (A1), extracellular acidosis (B1), or barium (C1). At the right of each panel, histogram plotting changes in the slope conductance. (A2–C2) At the left, superimposed voltage traces in response to Bk before (black) and after (red) quinidine (200 µM, A2), extracellular acidosis (B2), or barium (300 µM, C2). At the right of each panel, histogram plotting the peak amplitude of membrane depolarizations induced by Bk. (D–E) At the left, superimposed voltage traces under high [K+]o in response to Bk before (black) and after (red) applying ruthenium red (200 µM, D) or lowering temperature from 34 to 24°C (E). At the right of each panel, histogram plotting the peak amplitude of membrane depolarizations induced by Bk. All recordings were performed under TTX (1 µM) and TEA (10 mM). Error bars indicate SEM, *p < 0.05, **p < 0.01 (A1, B1, C1: One-Way ANOVA; A2, B2, C2, D, E: Wilcoxon paired test).
Figure 6

The Bk-induced depolarization of lumbar motoneurons is associated with [Ca2+]i rise in dendrites.
(A) z-projection of two-photon image stack showing cells loaded by bolus injection of OGB1-AM (1 mM) and SR-101 (300 µM). (B) Bradykinin (Bk, 8 µM) increases calcium levels in the motoneuron somata. Each line is a different motoneuron, aligned to the time of Bk application, see color code (right) for quantification of increase in calcium fluorescence (C) Time course of the mean (±SEM) population calcium response to Bk application; n = 177 neurons. (D) z-projection of a two-photon image stack showing a representative motoneuron loaded with OGB1 (120 µM) and Alexa 594 (20 µM). (E) Simultaneously recorded dendritic (red trace) and somatic (blue trace) calcium transients of the motoneuron shown on (D). (F) Average dendritic (red trace) and somatic (blue trace) calcium responses along with the simultaneously recorded average voltage trace (black trace) acquired from the patched cells. n = 5 neurons. (G) Average somatic (blue trace) and dendritic (red trace) calcium traces of 5 sweeps in response to action potentials evoked by somatic current injection. Inset, points of interest on soma and dendrites (black and white diamonds, respectively). (H–I) At the left, superimposed voltage traces under TTX (0.5 µM) and TEA (10 mM) in response to Bk (Bk, 8 µM) before (black) and after (red) the superfusion of (H) cadmium (200 µM, H) or intracellular diffusion of BAPTA (10 mM, I). At the right of each panel, histogram plotting the peak amplitude of membrane depolarizations induced by Bk before (black) and after (red) the drug application. Error bars indicate SEM, **p < 0.01 (Wilcoxon paired test).
Figure 7
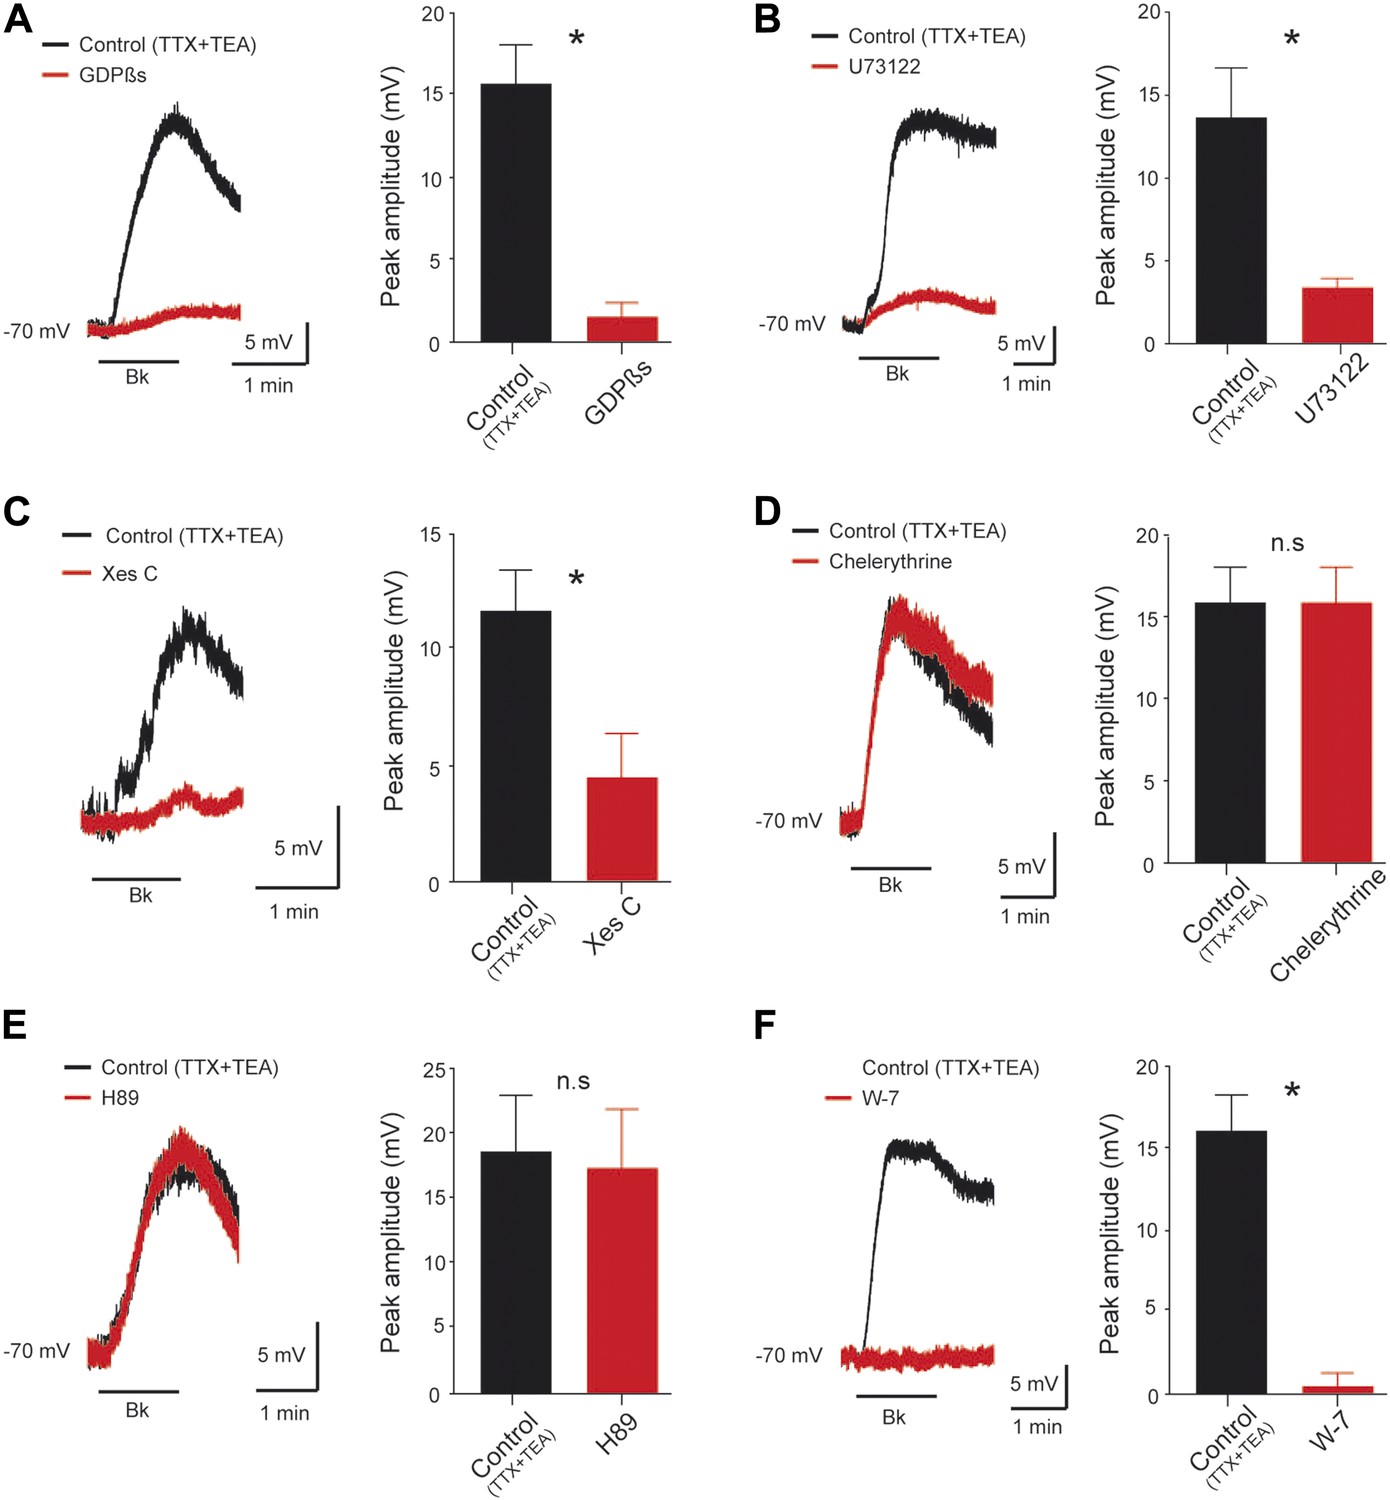
Signal transduction mechanism underlying the Bk effects.
(A–F) At the left, superimposed voltage traces under TTX (0.5 µM) and TEA (10 mM) in response to bradykinin (Bk, 8 µM) before (black) and after (red) GDPßS (2 mM, A), U73122 (10 µM, B), Xestospongin C (2.5 mM, C), Chelerythrine (10 µM, D), H89 (10 µM, E) or W-7 (100 µM, F). At the right of each panel, histogram plotting the peak amplitude of membrane depolarizations induced by Bk before (black) and after (red) the drug application. Error bars indicate SEM, *p < 0.05 (Wilcoxon paired test).
Figure 8
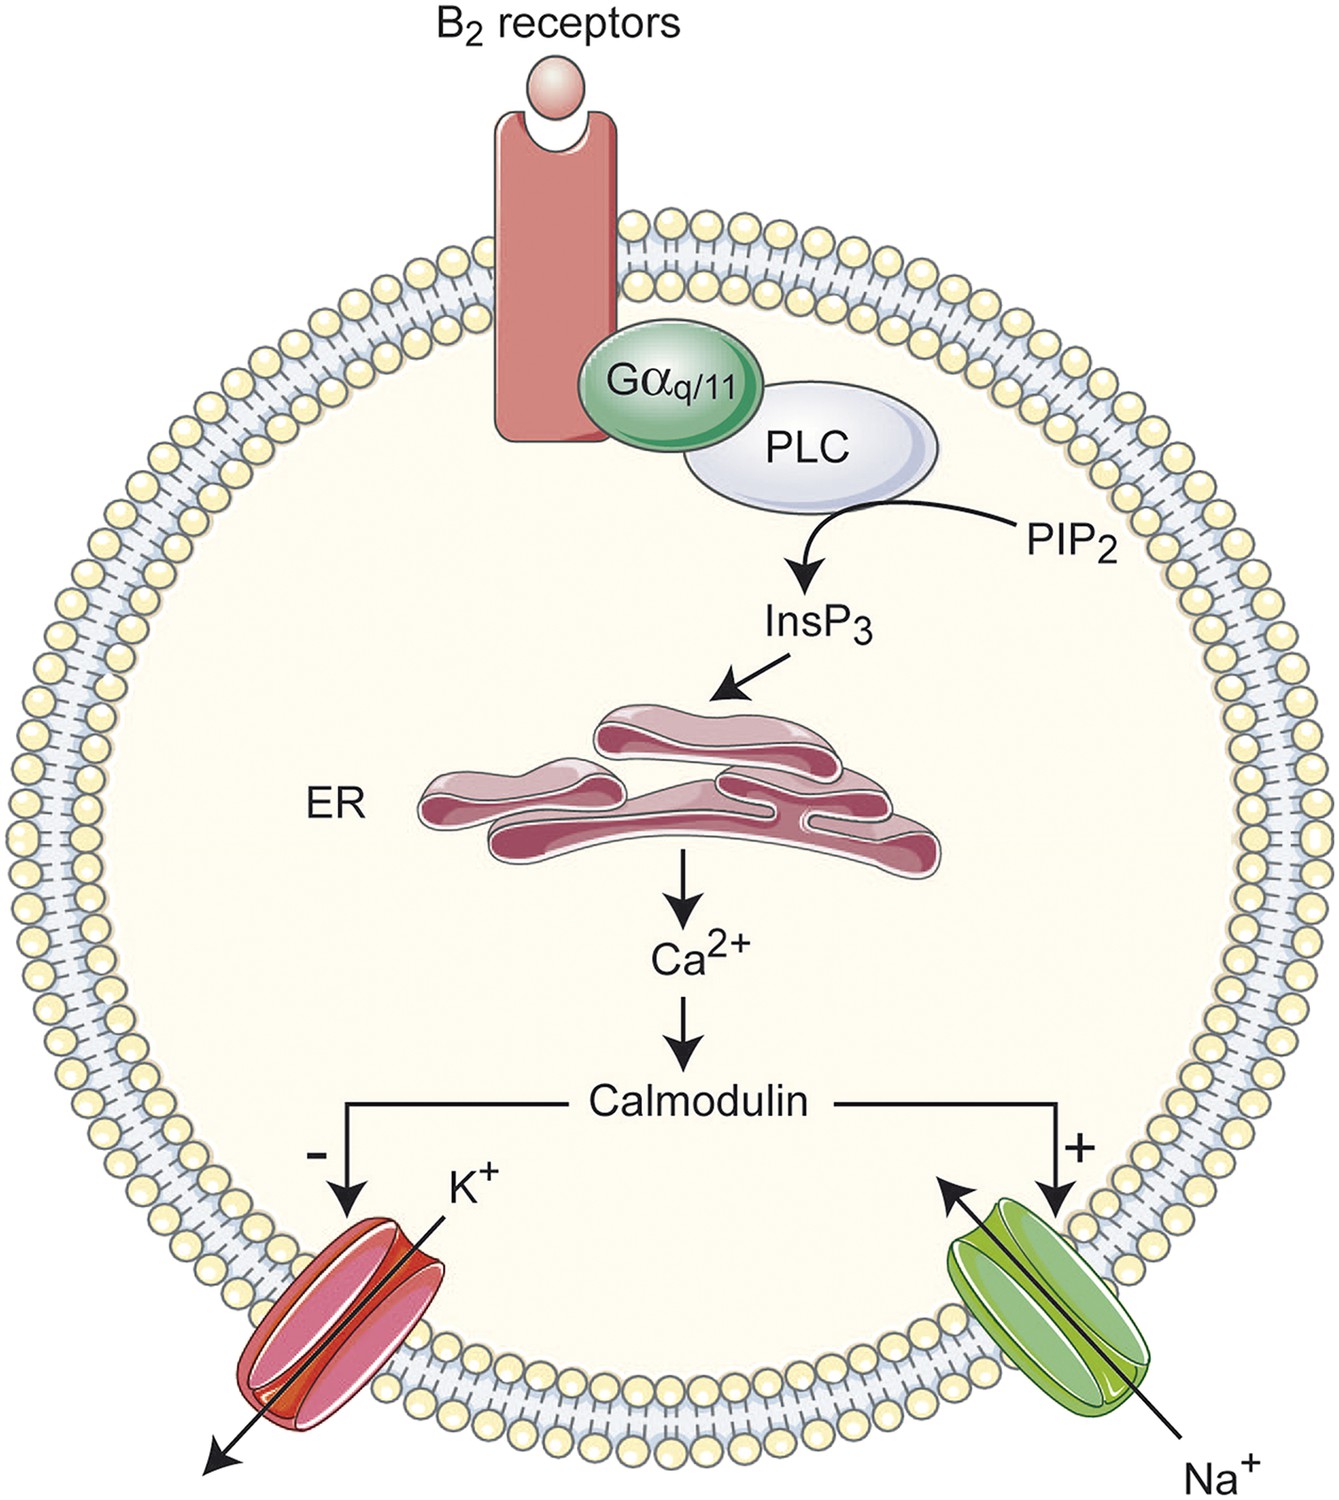
Overview of the signal transduction cascade for excitatory actions of Bk on lumbar motoneurons.
InsP3, inositol 1,4,5-trisphosphate; PIP2, phosphatidylinositol-4,5-diphosphate; PLC, Phospholipase C; ER, endoplasmic reticulum.
Tables
Table 1
Effects of bradykinin on passive and active membrane properties of lumbar motoneurons
| Control | Bradykinin | |
|---|---|---|
| N | 10 | 10 |
| Rm (MΩ) | 55.6 ± 5.4* | 62.9 ± 7.2 |
| AP amp (mV) | 67.0 ± 2.3* | 63.7 ± 2.2 |
| AP dur (ms) | 0.51 ± 0.02 | 0.51 ± 0.02 |
| AP threshold (mV) | −50.0 ± 2.1† | −52.8 ± 2.5 |
| f-I slope (Hz/pA) | 0.05 ± 0.004* | 0.06 ± 0.006 |
| Rheobase (pA) | 528 ± 118* | 299 ± 156 |
| sADP (mV) | 11.2 ± 1.4† | 18 ± 2.6 |
| AHP amp (mV) | −9.1 ± 0.9* | −11.2 ± 1.5 |
| AHP dur (ms) | 41.1 ± 2.5* | 48.6 ± 3.4 |
| Sag (%) | 12 ± 2.6 | 12.3 ± 2.5 |
-
Statistical significance was assessed by a Wilcoxon paired test.
-
*
p < 0.05,
-
†
p < 0.01,
-
n = number of cells. Mean firing frequency was measured at two times the rheobase.
-
AHP = afterhyperpolarization.
Download links
A two-part list of links to download the article, or parts of the article, in various formats.
Downloads (link to download the article as PDF)
Open citations (links to open the citations from this article in various online reference manager services)
Cite this article (links to download the citations from this article in formats compatible with various reference manager tools)
Sensitization of neonatal rat lumbar motoneuron by the inflammatory pain mediator bradykinin
eLife 4:e06195.
https://doi.org/10.7554/eLife.06195


