A novel inhibitory nucleo-cortical circuit controls cerebellar Golgi cell activity
- Hebrew University of Jerusalem, Israel
- Ecole Normale Supérieure, France
Figures
Figure 1 with 1 supplement
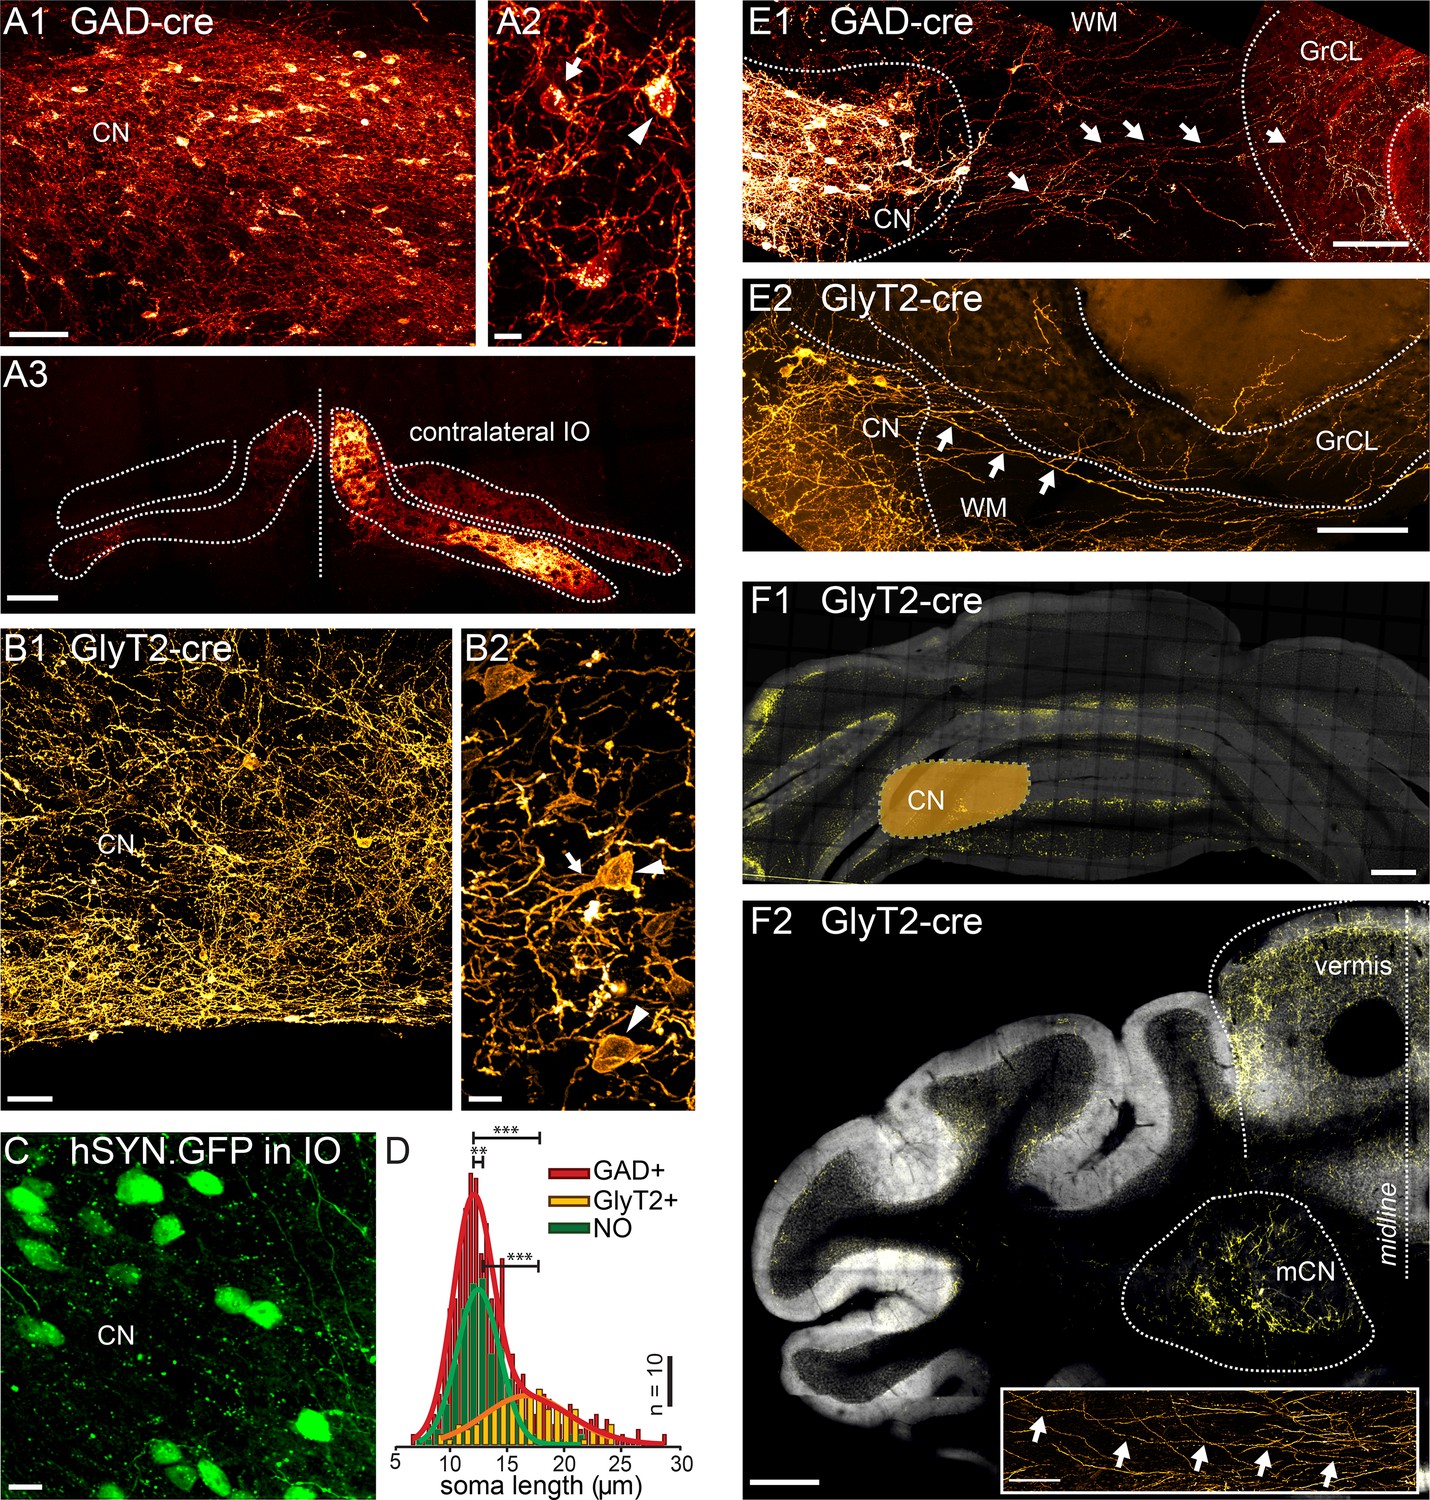
Targeted viral labeling of the GABAergic and glycinergic neurons in the CN reveals dense and wide-spread network of nucleo-cortical axons in the cerebellar cortex.
(A1–B1) Confocal images of coronal cerebellar sections in mice, where floxed virus was injected into the cerebellar nuclei of GAD-cre and GlyT2-cre mice. (A1) Flocculus, coronal view, 40× confocal scan tiles. (B1) Posterior vermis, horizontal view. (A2–B2) Higher magnification confocal images of the cerebellar nuclei show transfected GABAergic and glycinergic neurons, respectively. Note the lower density of labeled neurons in GlyT2-cre brain. In the GAD-cre mice, both small, globular and larger, multipolar neurons (arrows and arrowheads in A2, respectively) were seen. In the GlyT2-cre mice, only large, multipolar neurons were observed, characteristic to the glycinergic CN neurons (arrowheads in B2). In the GAD-cre mice, the transfected neurons included the GABAergic NO neurons, as evidenced by the fluorescent axons in the contralateral IO (A3). (C) Injection of hSyn-GFP-virus into the IO retrogradely labeled small, round NO neurons in the contralateral CN. (D) Comparison of soma sizes among the three labeled populations. The histograms are fitted with single (GlyT2+ and NO) or double (GAD+) Gaussians (thick lines), showing that the GlyT2+ neurons distribution matches the second peak in GAD + fit and that the GlyT2+ and NO neurons form distinct populations that contribute to the GAD + population. (E) Confocal composite images showing virally transfected CN neurons in GAD-cre (E1) and GlyT2-cre (E2) mice, and their axons (arrows) extending across the WM surrounding the CN into the GrCL of the cerebellar cortex. (F1) Confocal composite image of a caudal coronal section of GlyT2-cre cerebellum where the lateral CN was virally transfected (location of the CN is drawn schematically on top of the image). The wide distribution of the NC axons in medio-lateral direction, including parts of the contralateral cerebellum, is shown in yellow color. (F2) Confocal composite image of a horizontal section at the level of the CN in GlyT2-cre cerebellum with transfection of the glycinergic neurons in the medial CN. The axons of the labeled neurons can be seen extending through wide areas of the vermal cortex. The inset shows a single inhibitory nucleo-cortical (iNC) axon forming axonal swellings across several hundreds of μm in the GrCL. Abbreviations: GrCL, granule cell layer; CN, cerebellar nuclei; mCN, medial cerebellar nuclei; IO, inferior olive; NO, nucleo-olivary; WM, white matter. Scale bars: A1, B1: 50 μm; A2, B2, C, 10 μm; E, 100 μm, F1, 2: 400 μm; F2, inset: 100 μm. See also Figure 1—figure supplement 1.
Figure 1—figure supplement 1
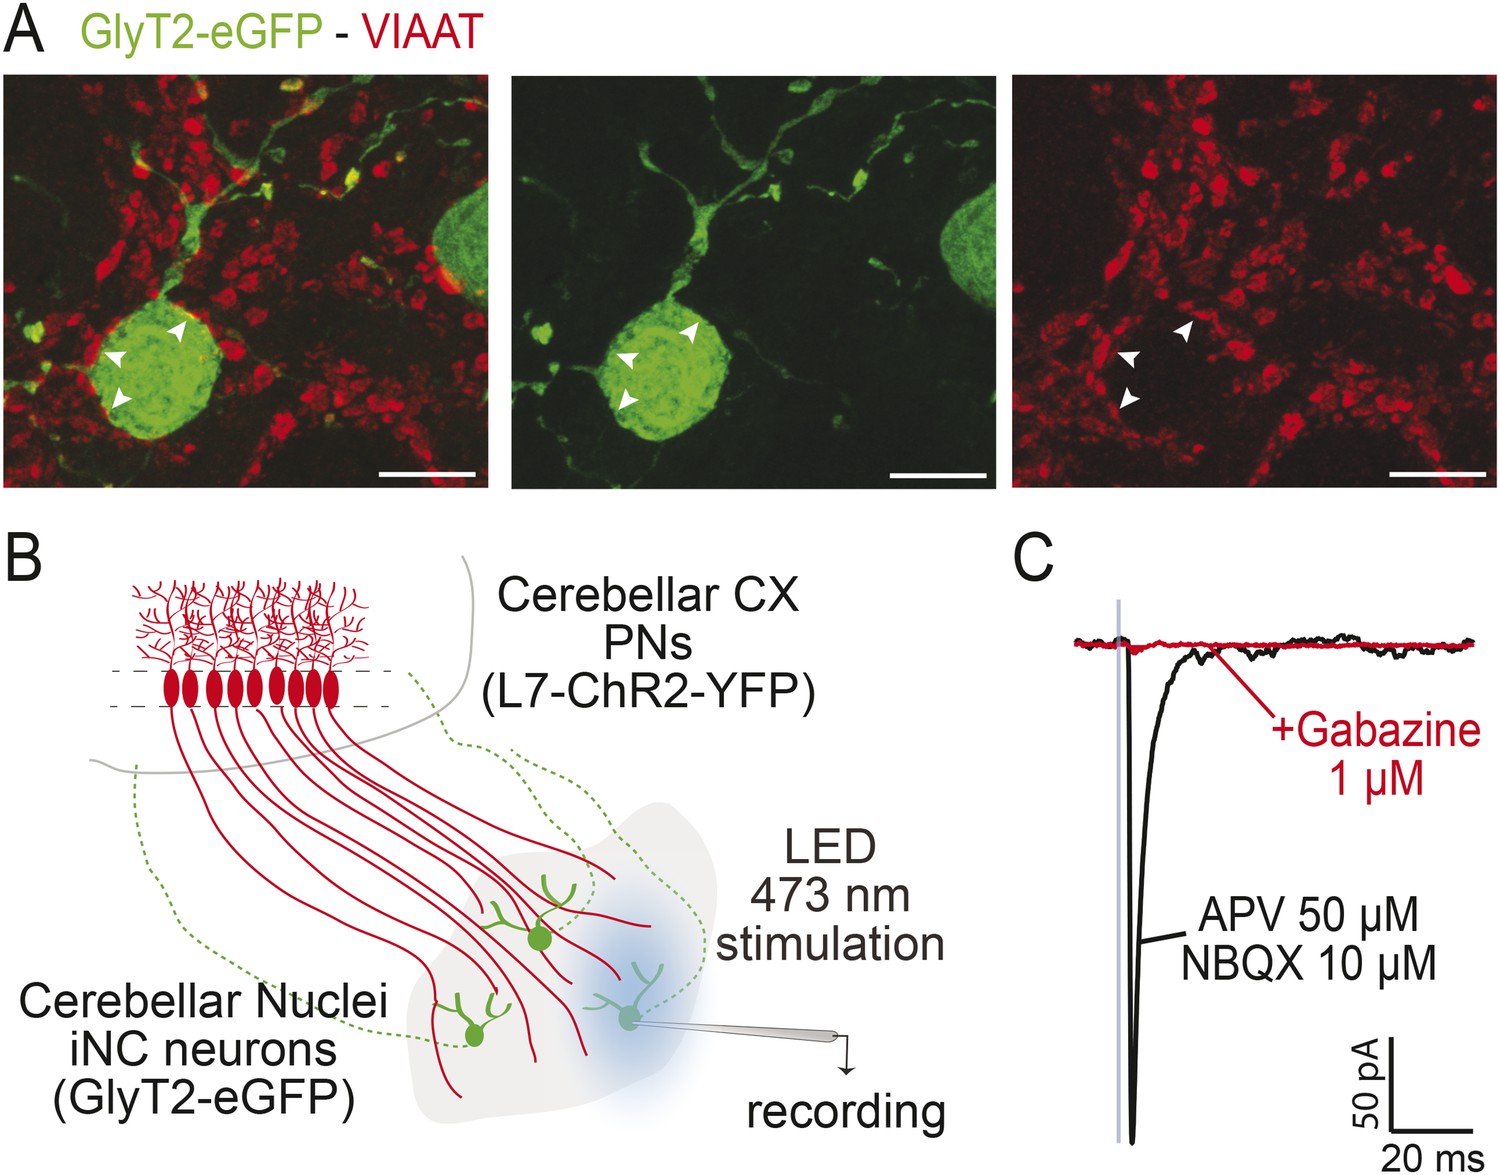
iNC neurons receive functional GABAergic Purkinje Neuron inputs.
(A) In the GlyT2-eGFP mouse, GFP-positive neurons (in green) are contacted by VIAAT-positive varicosities (in red). Points of contacts are indicated by arrows. (Z-projection thickness: 4.6 µm, scale bar: 10 µm). (B) Optogenetical stimulation of Purkinje neurons (PNs) axonal varicosities was performed by whole-field LED (470 nm) illumination of the cerebellar nuclei of L7-ChR2-YFP mice bred with GlyT2-eGFP mice. In these double-positive mice, PNs expressed specifically the channelrhodopsin (ChR2) (Chaumont et al., 2013) while iNC neurons can be easily targeted for patch-clamp recording using epifluorescence for GlyT2-eGFP. (C) One millisecond illumination (indicated by blue box) elicited large inhibitory responses in the iNC neurons (mean amplitude of 416.5 ± 332.1 pA, n = 10 cells), in presence of glutamate receptors blockers (APV 50 µM, NBQX 10 µM), which were blocked by 1 µM gabazine (98.1 ± 1.4 % block, n = 9 cells). The kinetics of the PN-originating inhibitory post-synaptic currents (IPSCs) in glycinergic CN cells (decay time constant 3.28 ± 0.72 ms, n = 10 cells) were similar to those of IPSCs at Purkinje cell synapses on glutamatergic projection neurons (Telgkamp and Raman, 2002; Person and Raman, 2012; Husson et al, 2014; Kawaguchi and Sakaba, 2015) but much faster than at Purkinje cell synapses on NO cells (Najac and Raman, 2015), suggesting differential control of the GABAergic NO cells and the larger, GABA-glycinergic CN cells by PNs.
Figure 2
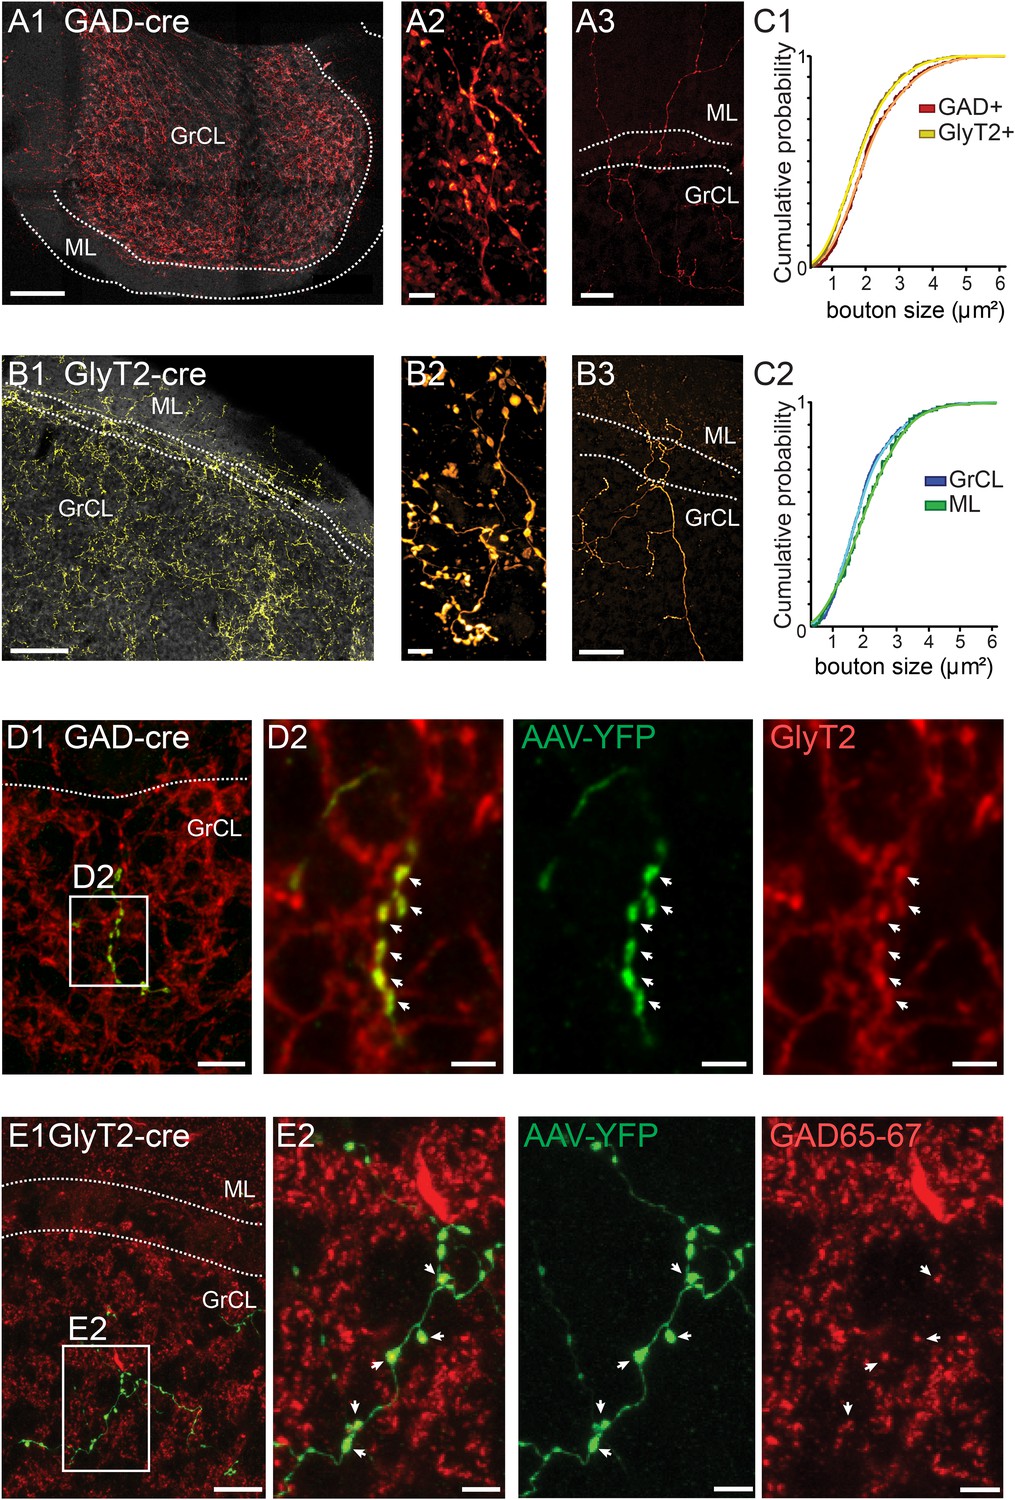
iNC axons are found in cerebellar granule cell and molecular layers and contain GAD65-67 and GlyT2.
(A–B) Confocal composite images of sections through the flocculus in GAD-cre (A1) and posterior vermis in GlyT2-cre (B1) mice, showing dense iNC axons in the GrCl as well as sparse axons in the ML (arrows). 40× composite tiles. Large axonal swellings from both GABAergic (A2) and glycinergic (B2) axons are found in the GrCL. Both GABAergic (A3) and glycinergic (B3) iNC axons occasionally rise into the lower ML. (C) Comparison of iNC axonal bouton sizes between the GABAergic and glycinergic axons (C1) and between the boutons in the GrCL and ML (C2) shows nearly identical distributions. (D) Merged confocal image (Z-projection thickness: 12.2 μm) showing iNC axons in GAD-cre mice injected with AAV-flox-EYFP (green) are co-stained for GlyT2 (red) (D1). Higher magnification of axonal swellings (arrows) co-stained for EYFP and GlyT2 (D2). (E) iNC boutons (green) transfected with AAV-flox-EYFP in GlyT2-cre mice are stained for GAD65-67 (red, E1, Z-projection thickness: 8.2 µm). (E2) Higher magnification of iNC axon (arrows) co-stained for EYFP and GAD65-77 (Z-projection thickness: 2.4 µm). Abbreviations: GrCL, granule cell layer; ML, molecular layer; PNL, Purkinje neuron layer; WM, white matter; n.s., non-significant. Scale bars: A1 and B1: 100 μm; A2 and B2: 5 μm; A3 and B3: 50 μm. D1: 20 μm. D2–4: 5 μm. E1a-e: 10 μm; E2a-e: 2 μm.
Figure 3 with 1 supplement
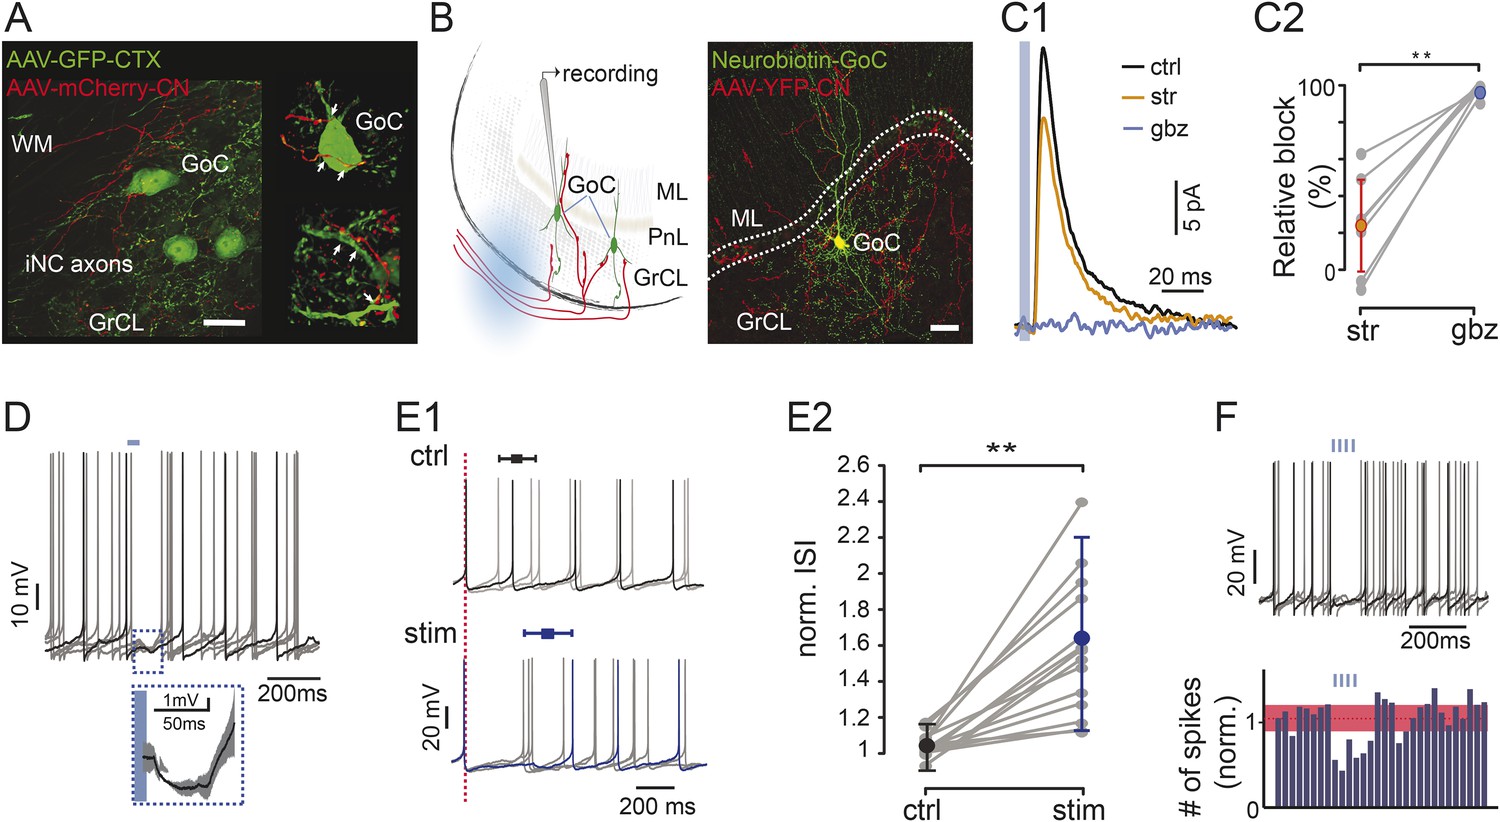
Optogenetic stimulation of iNC axons in cerebellar slices inhibits Golgi cells’ spiking.
(A) Confocal image (left) and reconstruction (right) of GrCL in GAD-cre mouse injected with AAV2-flox-ChR2-mCherry to the CN and AAV-GFP to the cerebellar cortex. iNC fibers (red) branch in the GrCL and form axonal swellings (arrows) on GoCs (green). (B) Left: schematic drawing of the in vitro experimental arrangement. GoCs were recorded in GlyT2-cre or GAD-cre animals where iNC axons express both ChR2 and a fluorescent marker (YFP in GlyT2-cre, mCherry in GAD-cre). Right: GoC patched and filled with Neurobiotin (green) in GlyT2-Cre mice surrounded by transfected axons (red) (Z-projection thickness: 36.4 μm; Sagittal view). (C) Optogenetic stimulation of the iNC fibers. (C1) An example of averaged IPSCs (n = 30) recorded in Golgi cell induced by 5-ms illumination (indicated by blue line), blocked by successive bath application of 300 nM strychnine (str; orange), and 2 µM gabazine (gbz, blue). (C2) Summary plot of the percentage of inhibitory current blocked by strychnine and gabazine (n = 9; p = 0.0039). (D) Example voltage traces from a recorded Golgi cell with a 50-ms single light pulse in GAD-Cre mice. The averaged IPSP response (± STD) of all 6 traces is magnified in the inset. (E) iNC activation delays spike generation in GoCs. (E1) The traces recorded without (top; ctrl; black) and with (bottom; stim; blue) light stimulation are aligned either on the first spike in the sweep (top) or on the spike preceding the stimulus (bottom; red, dashed line) to emphasize the increased ISI in response to iNC stimulation. Average inhibition delay (± STD) for the example cell is marked above traces in Box-and-whiskers symbols. (E2) Comparison of the average ISI without and with light pulse (± STD) normalized to the average ISI. (p = 0.0001; n = 15). (F) Example voltage traces from a recorded GoC during train of light pulses stimulation of iNC axons showing no spikes occurring during the illumination (upper panel). Peri-stimulus time histograms (PSTH) of the GoCs (n = 16, 100-ms bin) shows a decrease in the number of spikes after train pulse stimulation. Baseline average marked in dashed red line and STD values in red area (all cells normalized to baseline frequency; lower panel). Scale bars: A: 20 µm, B: 50 µm. ‘Asterisks’ indicate statistical significance. Abbreviations: WM, white matter; GrCL, granule cell layer; GoC, Golgi cell; ML, molecular layer; ISI, inter-spike interval. See also Figure 3—figure supplement 1.
Figure 3—figure supplement 1
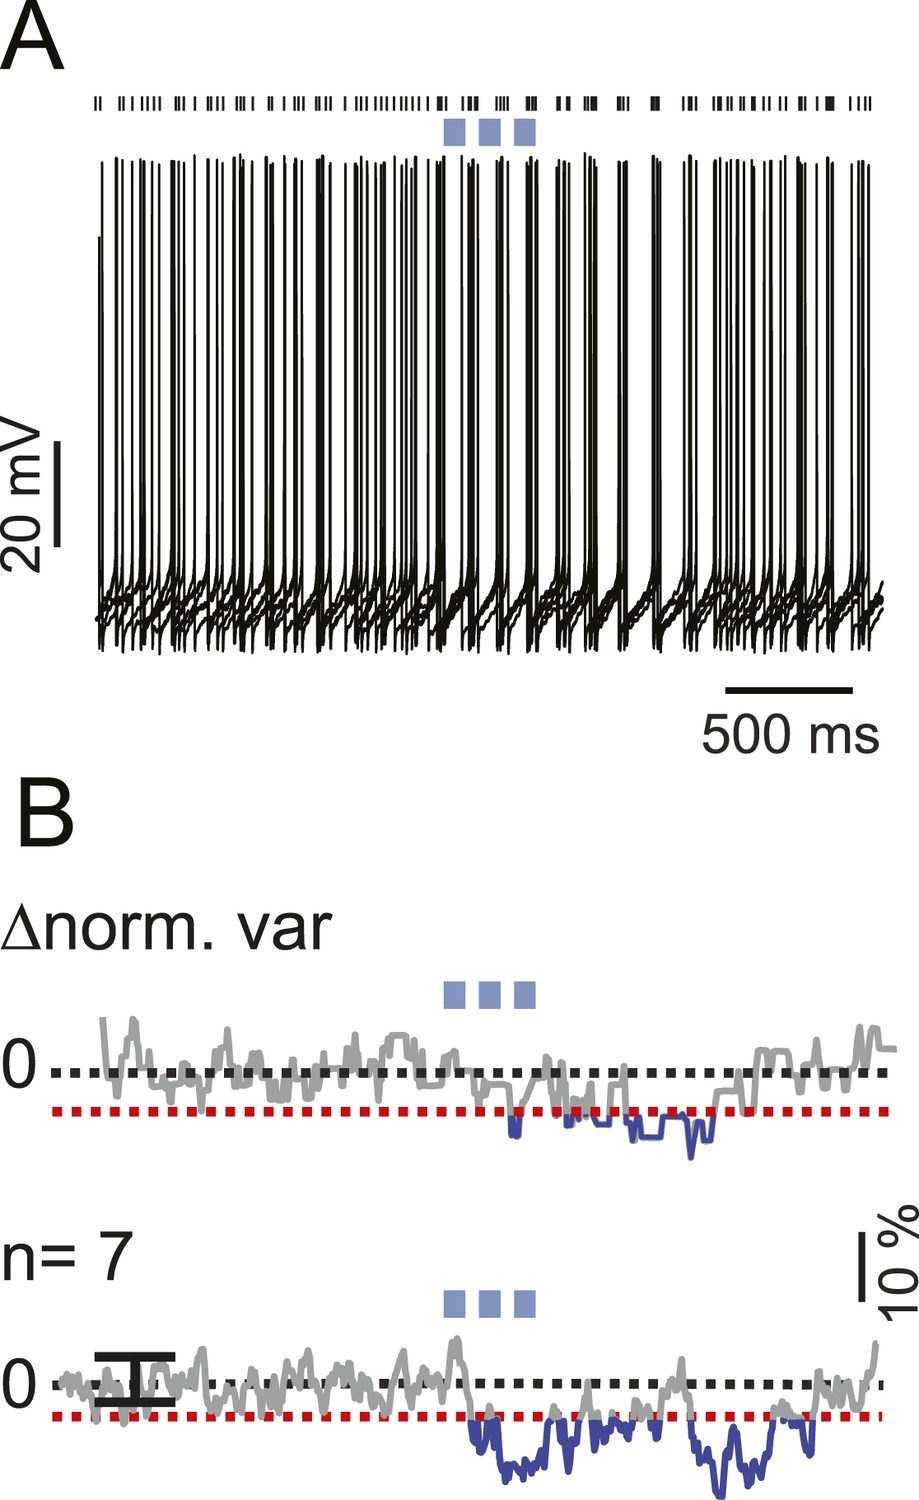
iNC activation modulate spike times in a fraction of non-responsive s-Golgi cells.
(A) An example Golgi cell current-clamp recording showing spike-timing response to train of light pulses (upper panel, 6 traces). Spike-timing analysis shows a significant decrease in the voltage variability between the different recorded traces (bottom panel; red dashed line indicate z-score = 3, p = 0.05). (B) Population spike-timing analysis showing a decrease in the voltage variability in GoCs after optogenetic stimulation of iNC fibers (n = 7; p = 0.05). Black dots above traces mark spike times.
Figure 4
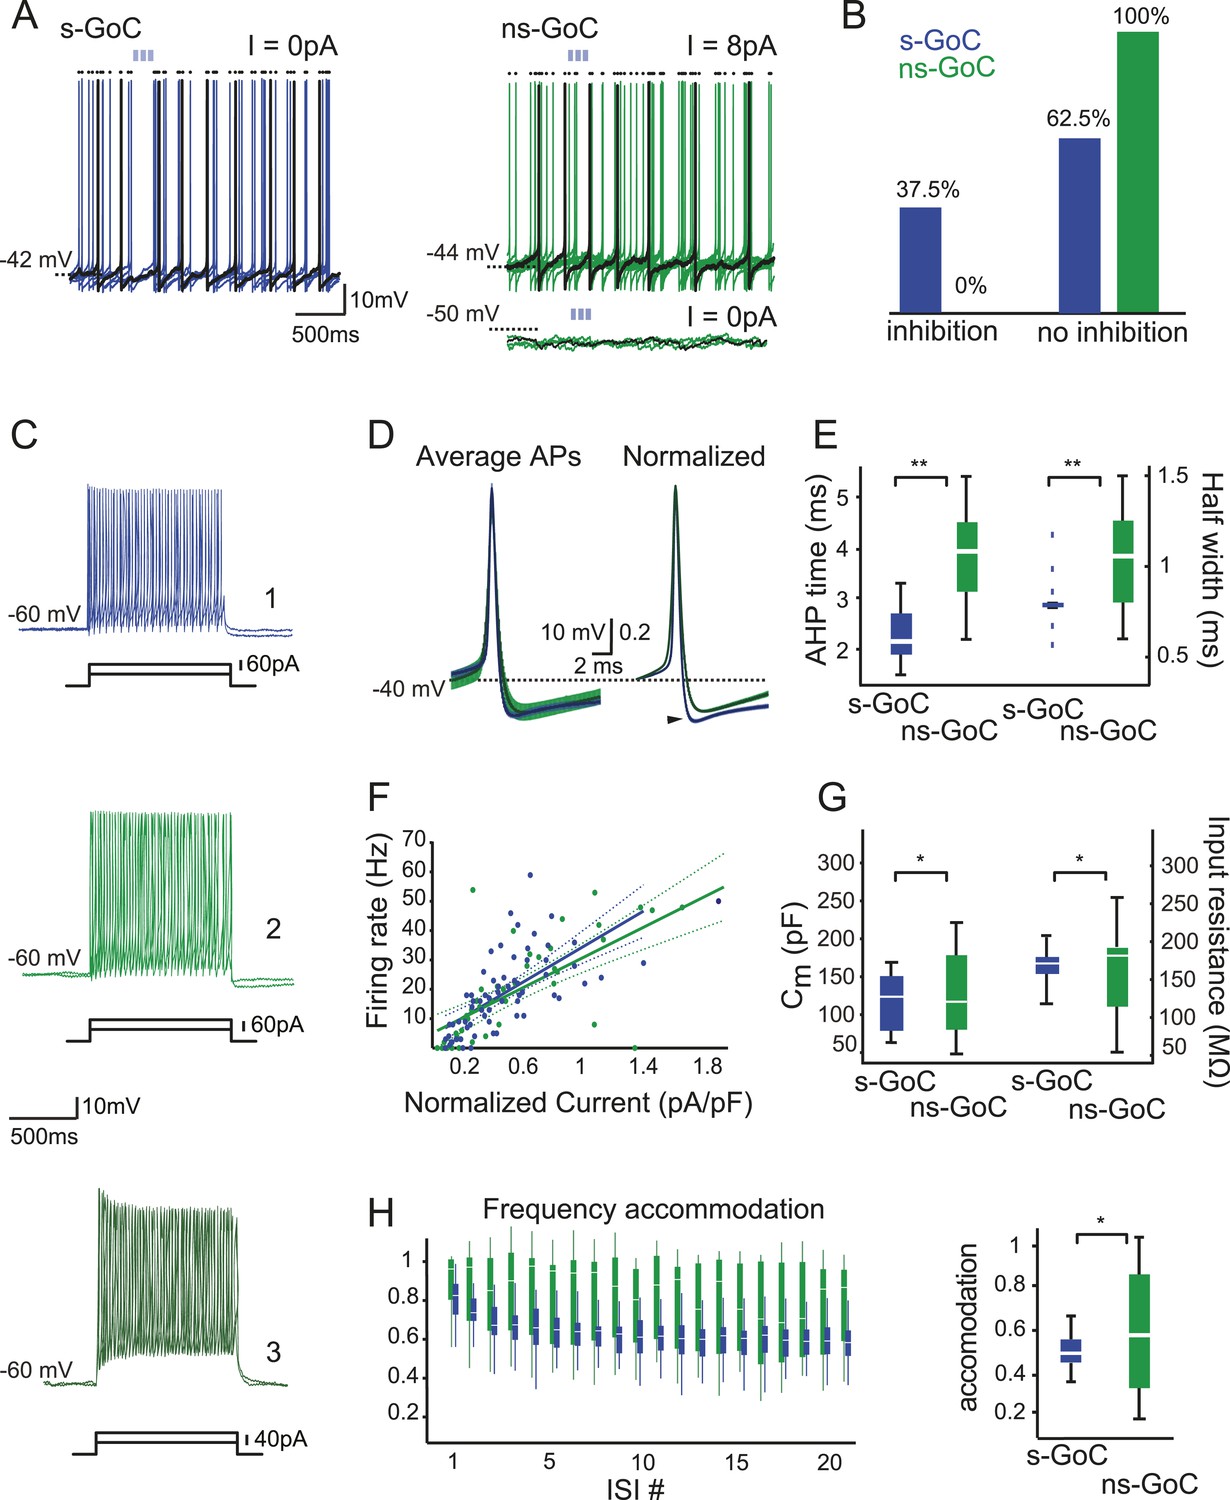
Golgi cell subtypes differ in their sensitivity to iNC input and have different intrinsic properties.
(A) Left: a spontaneously active GoC (s-GoC) is inhibited by optogenetic iNC activation (light-blue bars above traces). Six superimposed traces with no holding current. (A) Right: a not-spontaneously spiking GoC (ns-GoCs) shows no response to iNC activation. Bottom trace: without depolarizing current injection; top trace: with +8 pA current injection to evoke spiking. Black dots above traces in both panels mark spike times. (B) Percentage and numbers of s-GoCs (blue) and ns-GoCs (green) that are inhibited by iNC axons (left) and those that are not (right). (C) Example traces of three GoCs’ responses to positive current steps. Cell 1, blue: s-GoC (Cm = 173.5 pF); Cell 2, dark green: a large ns-GoC (Cm = 125.3 pF); Cell 3, light green: small ns-GoC (Cm = 73.0 pF). (D) AP waveforms differ between s-GoCs and ns-GoCs. Left: superimposed, grand average AP shapes (± STD) obtained from s-GoCs (n = 31 cells, blue) and ns-GoCs (n = 13 cells, green) during steady-state firing. Right: APs are peak-normalized (± SEM). s-GoCs show faster spike repolarization as well as faster after-hyperpolarization (arrowhead). (E) Comparison of AP parameters shows that s-GoCs (n = 31 cells) spikes are faster than those in ns-GoCs (n = 13 cells). (F) Current-to-firing frequency (IF) relationship of s-GoCs (blue, n = 23) and ns-GoCs (green, n = 11) is not significantly different. The solid and dashed lines show fitted single polynomials and the confidence intervals, respectively. The current injection values are normalized to the estimated Cm of the cells. (G) Cm and input resistance of s-GoCs (blue; n = 23) and ns-GoCs (green; n = 11). (H) Comparison of instantaneous firing frequency accommodation during a depolarizing step. Left: box-plot chart showing the development of frequency accommodation in s-GoCs (blue) and ns-GoCs (green). For visual clarity, the s-GoC bars are slightly shifted to the right in respect to the ns-GoC. Right: box plots of the steady-state accommodation among s-GoCs (blue) and ns-GoCs (green) show that s-GoCs have a smaller range of accommodation than ns-GoCs (t-test, p = 0.008). ‘Asterisks’ denote statistical significance. Abbreviations: s-GoC, spontaneously spiking Golgi cell; ns-GoC, not-spontaneously spiking Golgi cell, AP, action potential; AHP, after-hyperpolarization; acc val, accommodation value.
Figure 5

iNC fibers contact preferentially a neurochemically distinct subtype of Golgi cells expressing neurogranin.
(A–C) iNC fibers were transfected with AAV-flox-tdTomato in GlyT2-Cre X GlyT2-eGFP mice. iNC fibers were identified in the cerebellar cortex by their co-labeling for both GFP (green) and tdTomato (red). (A–B) In the GrCL, iNC fibers contact somata and proximal dendrites of neurogranin-expressing (blue) GoCs, either devoid of GFP staining or exhibiting a faint GFP staining at their somata (indicated by ‘asterisks’). (C) In the ML, GFP-positive / tdTomato-positive iNC fibers (arrowheads) were also seen apposed to GoC apical dendrites stained for neurogranin (blue) and virtually devoid of GFP staining (green). (D) iNC fibers, transfected with AAV-flox-YFP virus (green) in GAD-cre mice, contacted neurogranin-positive (blue) GoCs. iNC varicosities (arrowheads) are co-stained for GAD65-67 (red). (E) Plot of the mean GlyT2-eGFP intensities over mean neurogranin intensities allows statistical discrimination (k-means 2D) between two GoCs populations. A first population (blue) was distinguished from the second population (green) by its none-to-low levels of GlyT2-eGFP staining, as seen with the bimodal distribution of mean GFP intensities (F), while the mean neurogranin intensities were less discriminative (G). According to the color-coded number of iNC inputs received by each GoC (H), most of the ‘iNC-contacted’ GoCs were found in the neurogranin-positive/GlyT2-eGFP negative GoC population (blue) (I). (J) Schematic drawing of the percentages obtained for each GoC subtypes. Z-projection thickness: A: 34 µm; B: 18.4 µm; C: 16.3 µm; D: 30 µm; D close up: 2.4 µm. Scale bar: A: 20 µm, B–D: 10 µm, D close up: 2 µm. Abbreviation: GoC, Golgi cell.
Figure 6
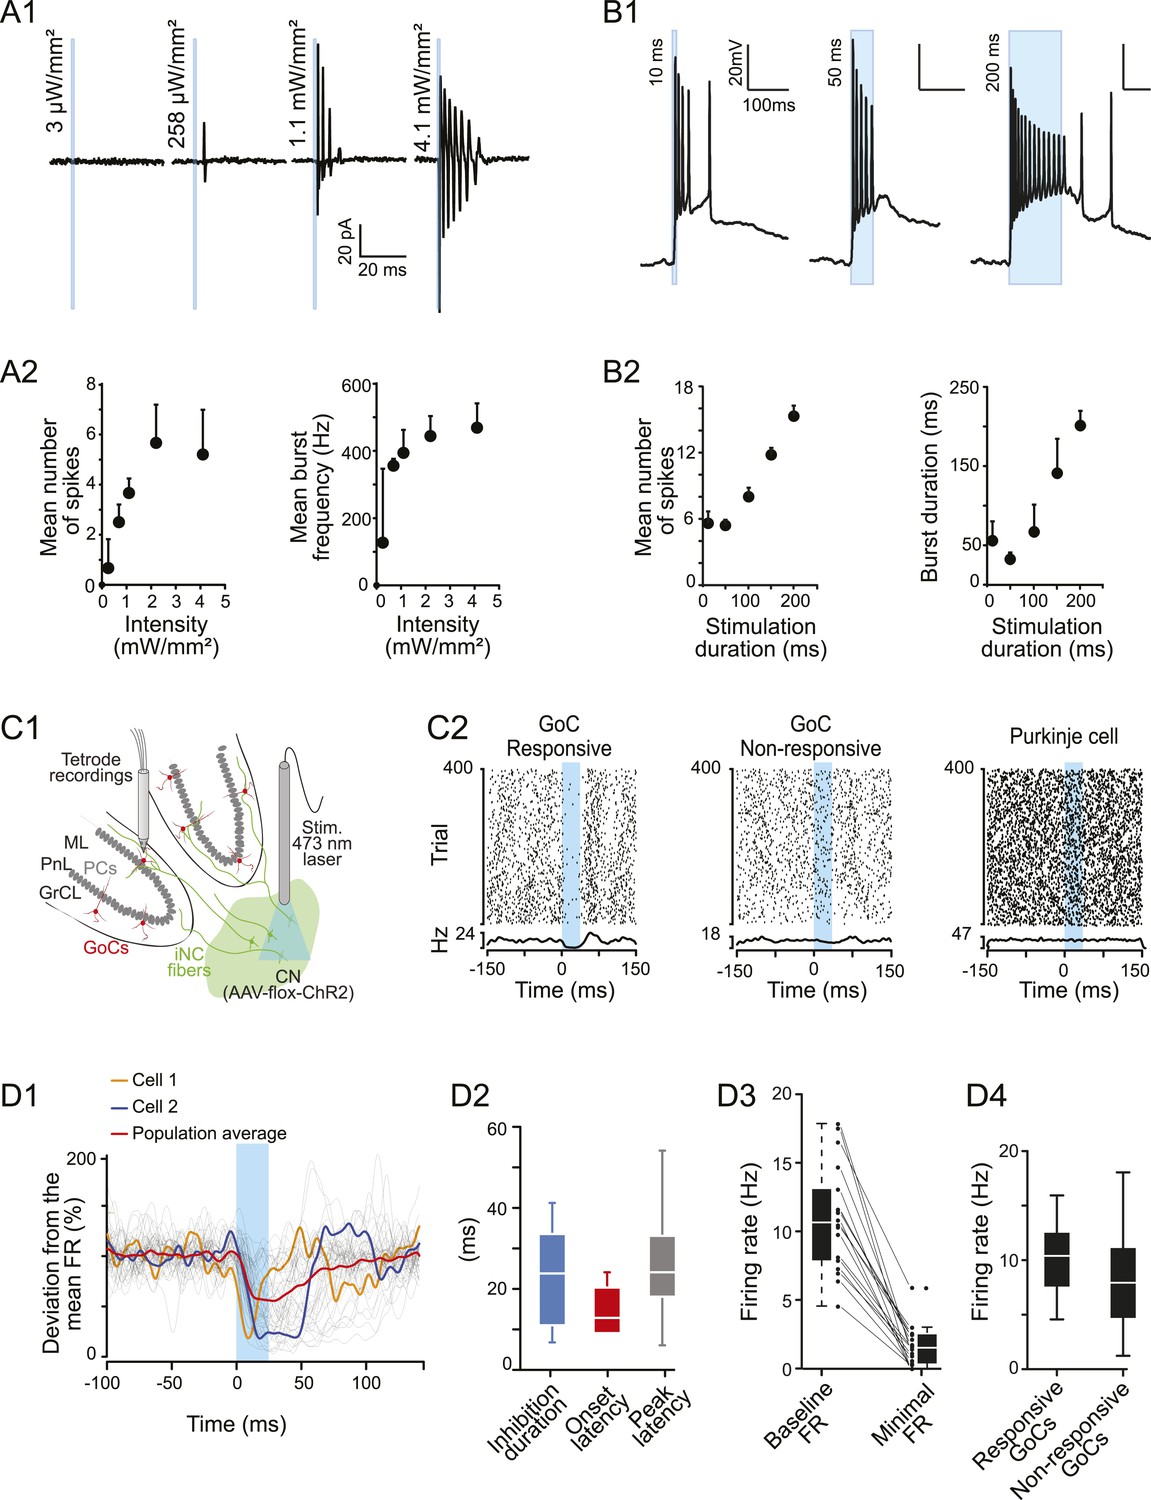
iNC neurons exhibited a burst firing phenotype and their optogenetic stimulation has inhibitory effects on Golgi cells firing in vivo.
(A1) Extracellular recordings of iNC neurons in GlyT2-Cre mice transfected with ChR2 virus during increasing intensity of stimulation (1-ms duration pulse; blue bars). (A2) iNC neurons exhibit a burst firing phenotype with increase of mean number of spikes per burst (left) and mean burst frequency (right) when increasing illumination intensity. (B1) Whole-cell current-clamp recording of GAD-Cre iNC neurons transfected with ChR2 during 10-, 50-, or 200-ms long light pulse (blue bars; light intensity: 1.3 mW/mm2) has burst firing phenotype. (B2) GAD-Cre transfected iNC neurons show increase of their mean number of spikes per burst (left) and mean burst duration (right) with increasing illumination duration. (C1) Schematic drawing of the experimental system for in vivo recordings: extracellular recordings of GoCs during 25-ms pulse illumination of the CN in anesthetized GlyT2-Cre mice injected with ChR2 in the CN. (C2) Raster plots of two GoCs recorded at the same time and of one PN recorded in the same area, with their corresponding PSTH. Light pulse start at 0 ms. (D1) All superimposed smoothed PSTHs of responsive GoCs (18 out of 86 recorded GoCs), normalized to their mean firing rate (FR), with the population average trace (red). Two individual traces are highlighted (orange and blue), illustrating the high variability of the inhibition period parameters. Smoothed PSTHs are obtained by convolving 1-ms time bin PSTHs with a Gaussian kernel with 3 ms standard deviation. (D2) Characterizing parameters of the responses. (D3) Light stimulation of iNC neurons decreased the firing rate. (D4) Comparison of responsive and non-responsive GoCs firing rates. Abbreviations: GoC, Golgi cell.
Author response image 1

Comparison of the axonal swelling size between Lugaro, Golgi and iNC axons reveals that the iNC boutons are significantly larger, allowing reliable differentiation between the different axons even in acute slices. Lugaro and Golgi confocal images obtained from cerebellar slices from GlyT2-cre and GAD-cre mice, where floxed EYFP or GFP-expression virus was injected into the cerebellar cortex. iNC image from material used in the present study.
Author response image 2
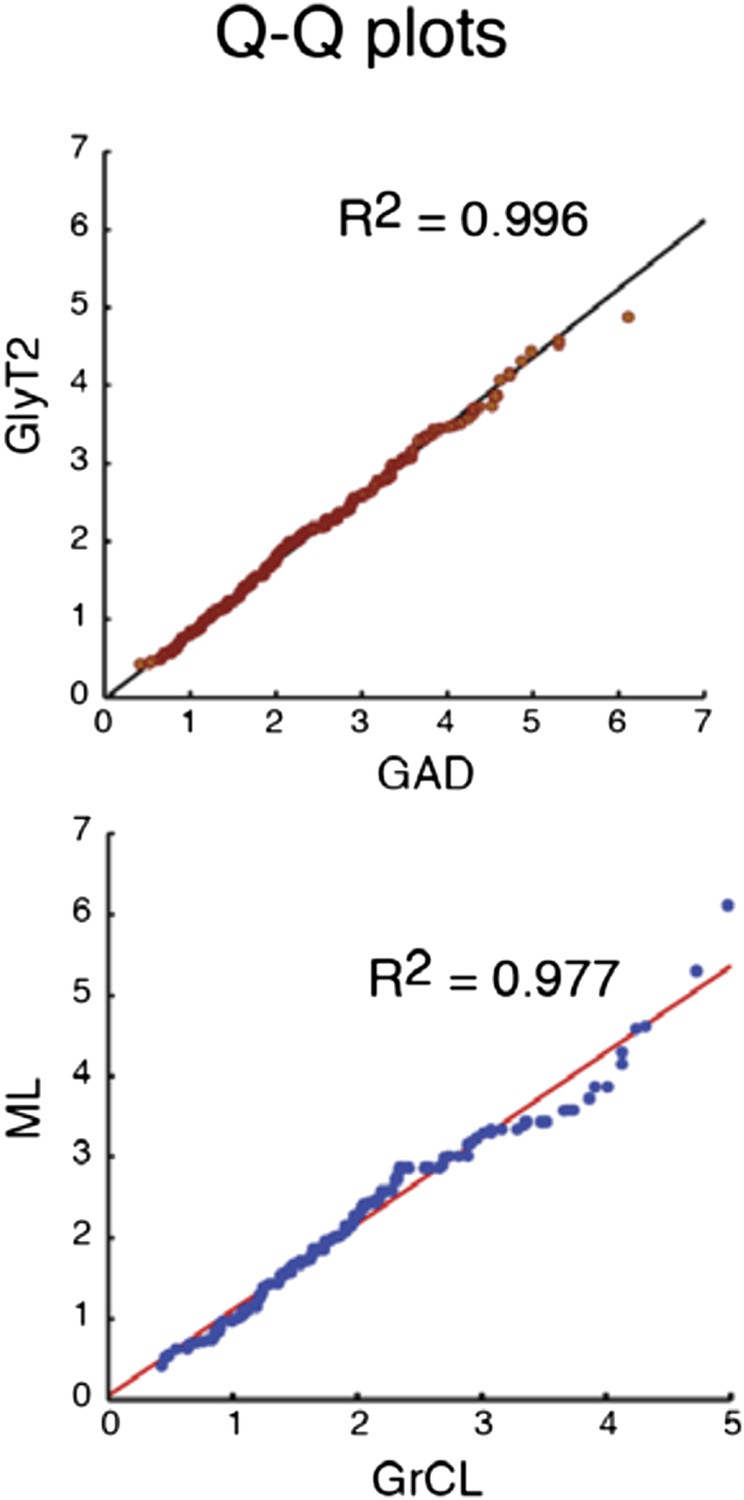
Comparison of the quantiles of cu- mulative distributions of iNC axon swellings obtained with GAD-cre vs. GlyT-cre models (top) and from granule cell layer vs. molecular layer (bottom; GAD-cre and GlyT2-cre models pooled). The near-perfect match with unity lines demonstrates near-identity.
Tables
Table 1
Summary of s-Golgi and ns-Golgi cells spiking parameters
| s-Golgi | ns-Golgi | N (s) | N (ns) | p-value (Wilcoxon) | p-value (F-test) | |
|---|---|---|---|---|---|---|
| AP half-width (ms) | 0.8 ± 0.2 | 1.2 ± 0.4 | 33 | 11 | 0.01 | 0.001 |
| AP threshold (mV) | 38.9 ± 6.04 | −36.4 ± 9.4 | 33 | 11 | 0.8 | 0.1 |
| AP amplitude (mV) | 51.2 ± 9 | 43.5 ± 10.7 | 33 | 11 | 0.06 | 0.4 |
| AP peak voltage (mV) | 22.4 ± 8.7 | 16.8 ± 13.03 | 33 | 11 | 0.1 | 0.17 |
| AHP min voltage (mV) | −51.9 ± 4.5 | −51.5 ± 8.8 | 33 | 11 | 0.8 | 0.01 |
| AHP time (ms) | 2.1 ± 0.8 | 4.0 ± 0.5 | 33 | 11 | 0.009 | 0.03 |
| AHP amplitude (mV) | 24.3 ± 4.2 | 23.1 ± 8.4 | 33 | 11 | 0.9 | 0.003 |
| I-F slope (r2) | 0.5 | 0.4 | 23 | 11 | – | 0.3 (cov-analysis) |
| Freq. Acc. (%) | 53 ± 8% | 59 ± 29% | 23 | 11 | 0.3 | 1.1 × 10⁻⁶ |
| Cm (pF) | 127.5 ± 48.3 | 118.9 ± 78.3 | 23 | 11 | 0.052 | 0.0018 |
| Rm(MΩ) | 185.5 ± 43.2 | 161 ± 75.5 | 23 | 11 | 0.054 | 8.3 × 10⁻⁵ |
Table 2
Summary of the viral constructs used
| Virus | Constructs | Mouse line and injection site | Used in Figures |
|---|---|---|---|
| AAV2/9.EF1.dflox.hChR2 (H134R)-mCherry | Addgene 20,297 | GAD-cre (CN) | 1A, 1E1, 2A, 3A, 3E–I, 4A–H, 6B |
| AAV2/9.EF1a.DIO.eNpHR3.0-EYFP.WPRE.hGH | Addgene 26,966 | GAD-Cre (CN) | 2C, 5D |
| AAV2.1.EF1á.DIO.hChR2(H134R).eYFP | Addgene 20,298 | GlyT2-cre (CN) | 1B, F, 2B, D, 3B–D, 6A, C |
| AAV2.1.CAG-Flex.tdTomato | Allen Institute #864 | GlyT2-Cre x GlyT2-eGFP (CN) | 5A–C, E–F |
| AAV2/9.hSynapsin.EGFP.WPRE.bGH | UPenn AV-9-PV1696 | GAD-cre (CN + Cortex) | 1C, 3A |
| AAV2/9.CAG.Flex.EGFP.WPRE.bGH | Allen Institute #854 | GAD-cre (CCTX) | not shown |
Table 3
Composition of solutions used for slice preparation and experiments
| Solution 1 (in MilliQ water) | Solution 2 (in Volvic water) | Solution 3 (in Volvic water) | Solution 4 (in Volvic water) | Intracellular solution | |
|---|---|---|---|---|---|
| Experimental details | HUJI Cutting (33°C) and Chamber-perfusion (25–28°C) solutions | IBENS Cutting solution Ice-cold | IBENS Recovery solution 33°C | IBENS Chamber-perfusion solution (33°C) | IBENS HUJI |
| NaCl | 124 | 125.7 | 4 | ||
| K-gluconate | 130 | 140 | |||
| D-mannitol | 225 | ||||
| KCl | 3 | 14.6 | 2.3 | 3.3 | |
| Glucose | 20 | 25 | 25 | 25 | |
| KH2PO4 | 1.2 | ||||
| NaH2PO4 | 1.25 | 1.25 | |||
| MgSO4 | 3.5 | ||||
| MgCl2 | 7.7 | 1.5 | |||
| NaHCO3 | 26 | 25 | 24.8 | ||
| CaCl2 | 2 | 0.51 | 1.6 | 0.5 | |
| EGTA | 2 | 5 | |||
| HEPES | 20 | 10 | |||
| D-APV (µM) | 20 [in chamber-perfusion solution] | 50 | 50 | 20 | |
| Minocycline (nM) | 50 | 50 | 50 | ||
| Mg-ATP | 3 |
Download links
A two-part list of links to download the article, or parts of the article, in various formats.
Downloads (link to download the article as PDF)
Open citations (links to open the citations from this article in various online reference manager services)
Cite this article (links to download the citations from this article in formats compatible with various reference manager tools)
A novel inhibitory nucleo-cortical circuit controls cerebellar Golgi cell activity
eLife 4:e06262.
https://doi.org/10.7554/eLife.06262


