Palmitoylation of LIM Kinase-1 ensures spine-specific actin polymerization and morphological plasticity
- Temple University School of Medicine, United States
- University of Ottawa, Canada
Figures
Figure 1 with 2 supplements
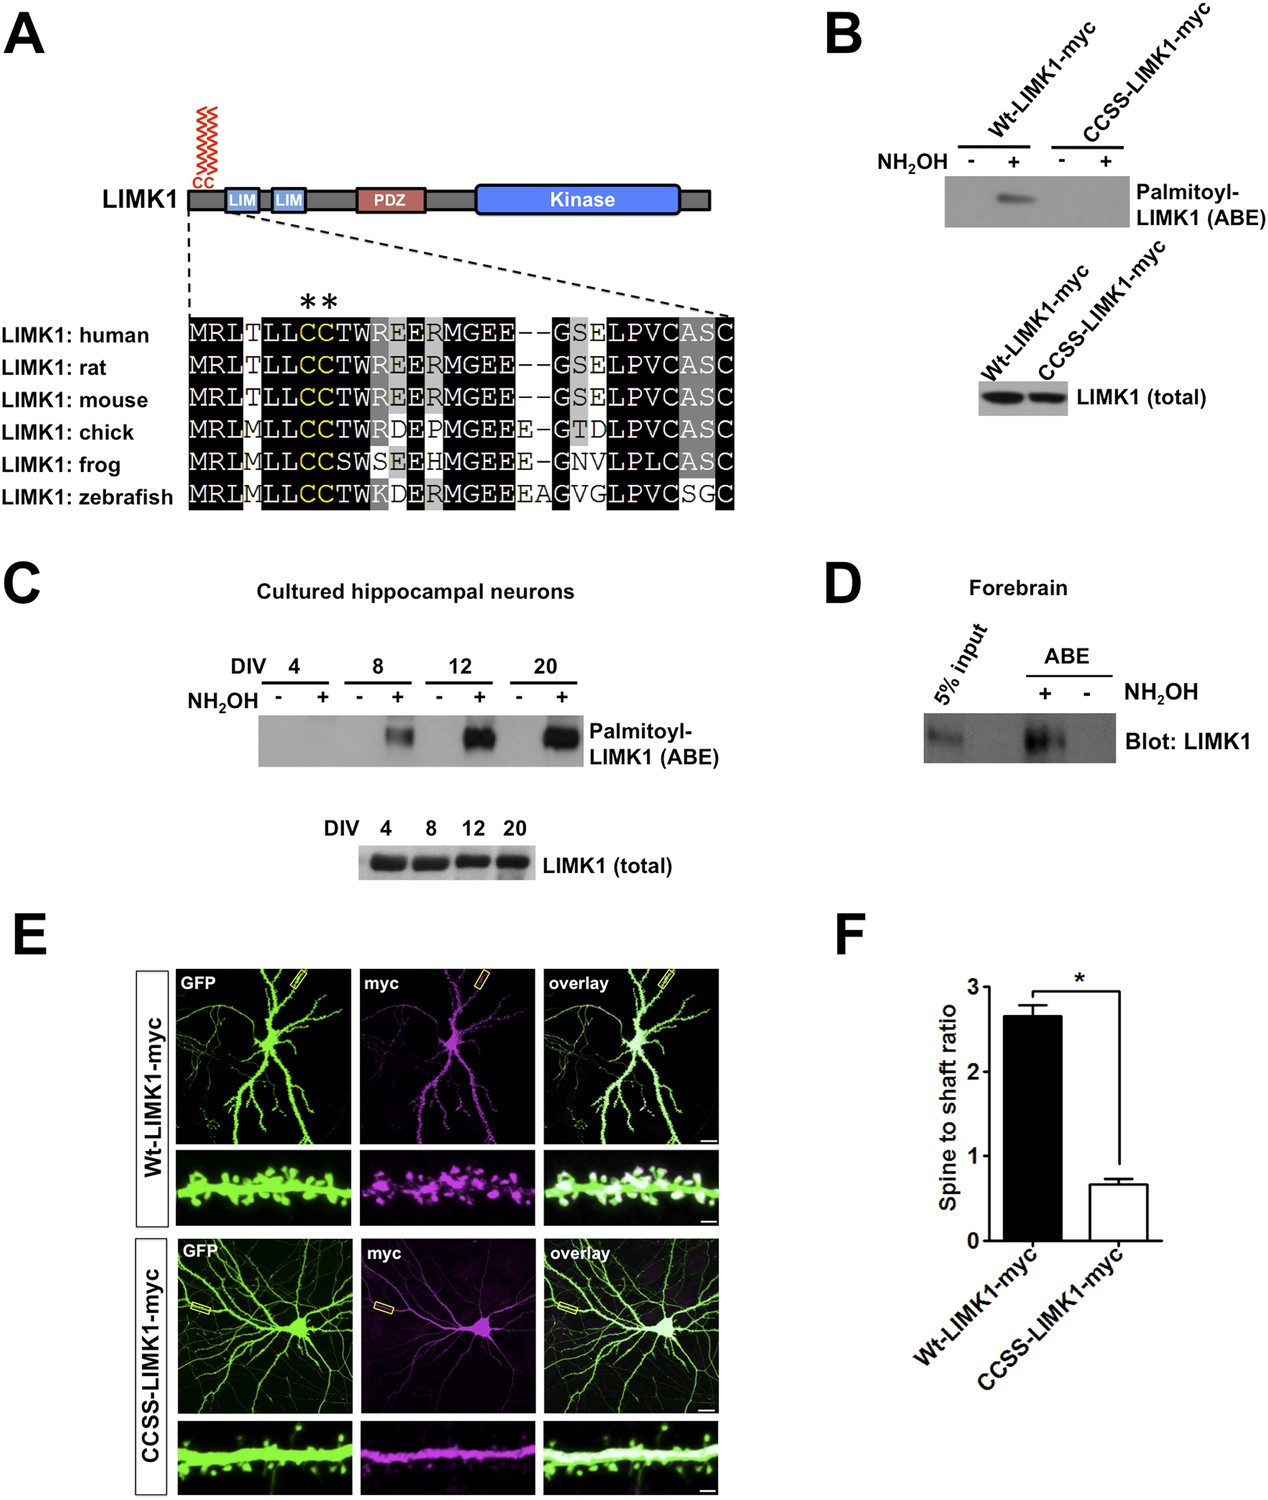
Palmitoylation at a unique di-cysteine motif targets LIMK1 to dendritic spines.
(A). Upper panel: LIMK1 schematic, showing predicted palmitoyl-motif (CC, red) and LIM, PDZ and kinase domains. Lower panel: Multiple sequence alignment of the N-terminal region of LIMK1 orthologs from the indicated species. CC palmitoylation motif (highlighted with asterisks) is conserved in vertebrates. (B) HEK293T cells were transfected with C-terminal myc-tagged LIMK1wt (wt-LIMK1-myc) or CCSS-LIMK1-myc (cys 7, 8 mutated to Ser). ABE fractions prepared from lysates were blotted to detect palmitoyl-LIMK1 (top panel). Lysates were blotted to detect total LIMK1 expression (bottom panel). CCSS mutation eliminates LIMK1 palmitoylation. (C) LIMK1 palmitoylation increases, coincident with spine maturation and synapse formation. Hippocampal neurons, cultured for the indicated number of Days in vitro (DIV), were lysed and identical amounts of total protein were subjected to ABE to detect palmitoyl-LIMK1. (D) Homogenate and palmitoylated (ABE) fractions from rat forebrain were blotted to detect LIMK1. (E) Palmitoylation targets LIMK1 to dendritic spines. Representative images of hippocampal neurons (DIV18), transfected to express GFP plus Wt-LIMK1-myc or CCSS-LIMK1-myc and immunostained with the indicated antibodies. Scale bar: 20 μm. Lower panels show magnified images of single dendrites (scale bar: 1 μm). (F) Quantified spine targeting ratio (signal intensity in dendritic spines compared to adjacent dendritic shaft) for each construct from E. Data are mean + SEM for n = 30 neurons for each condition. *p < 0.05, ANOVA with Dunnett's post hoc correction.
Figure 1—figure supplement 1
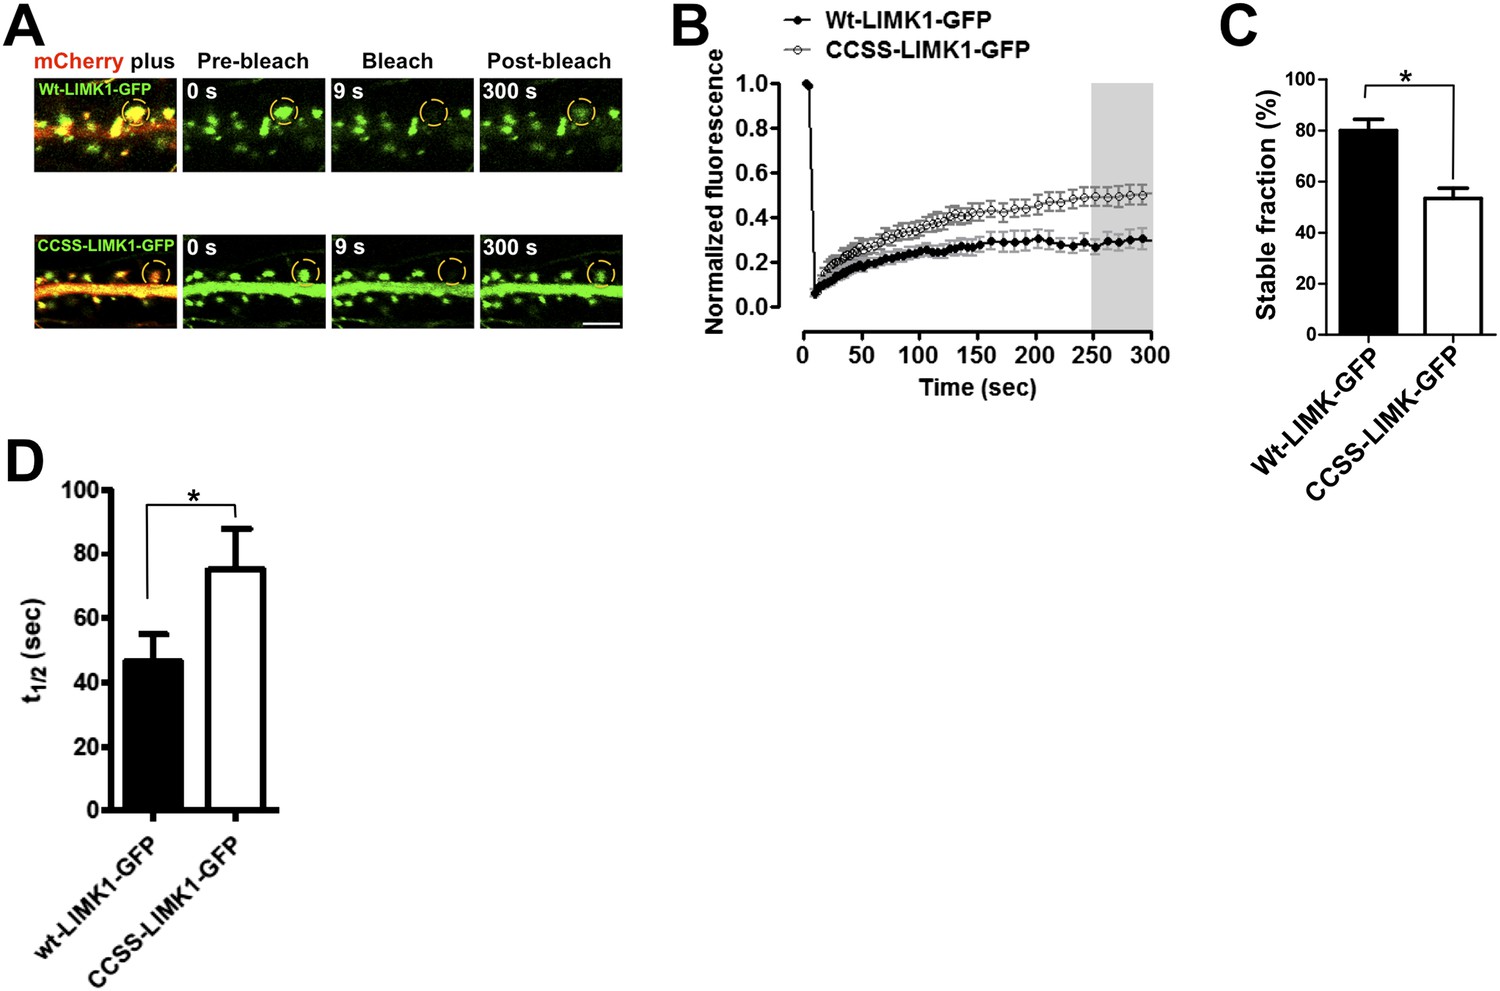
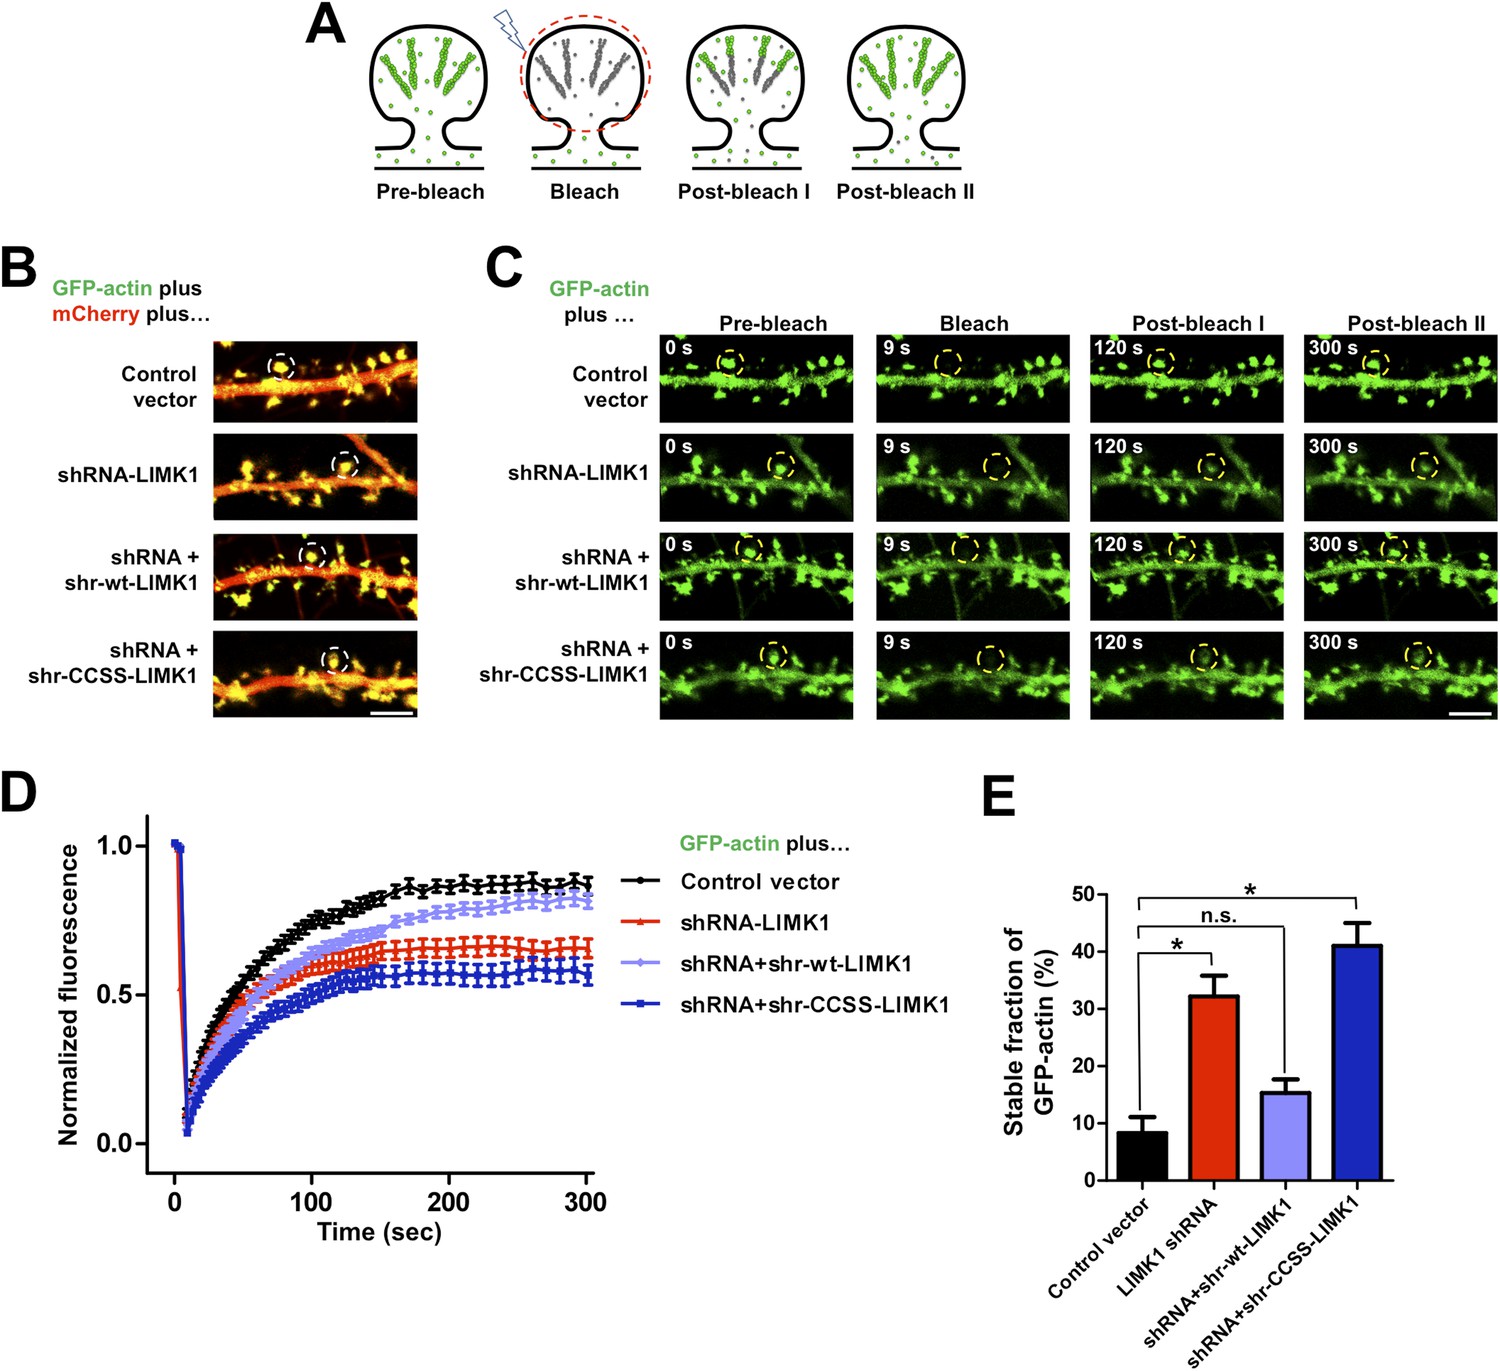
Palmitoylation helps to anchor LIMK1 in spines.
(A) Hippocampal neurons (DIV18) were transfected with the indicated GFP-tagged LIMK1 cDNAs plus morphology marker (mCherry). 18–24 hr post-transfection, a ROI centered on an individual spine (yellow circle) was photobleached (third column) and fluorescence recovery was monitored (right column). (B) Quantified FRAP from n = 12–18 spines per condition from A. (C) Histogram of the stable fraction of wt- and CCSS-LIMK1-GFP, calculated as in ‘Materials and methods’. *p < 0.05, t-test. (D) Histogram of the half-time of recovery of the dynamic fraction of mobile LIMK1-GFP, determined by fitting individual fluorescence recovery traces to a single exponential. * p < 0.05, t-test. Although this result is statistically significant, note that the determination for wt-LIMK1-GFP is affected by the very low fraction of recovery seen in many individual traces, which reduces the accuracy of curve-fitting. Recovery half-times for wt- and CCSS-LIMK1-GFP are markedly longer than other proteins that are predicted to be freely soluble in spines (Star et al., 2002; Bingol et al., 2010; Zheng et al., 2010).
Figure 1—figure supplement 2
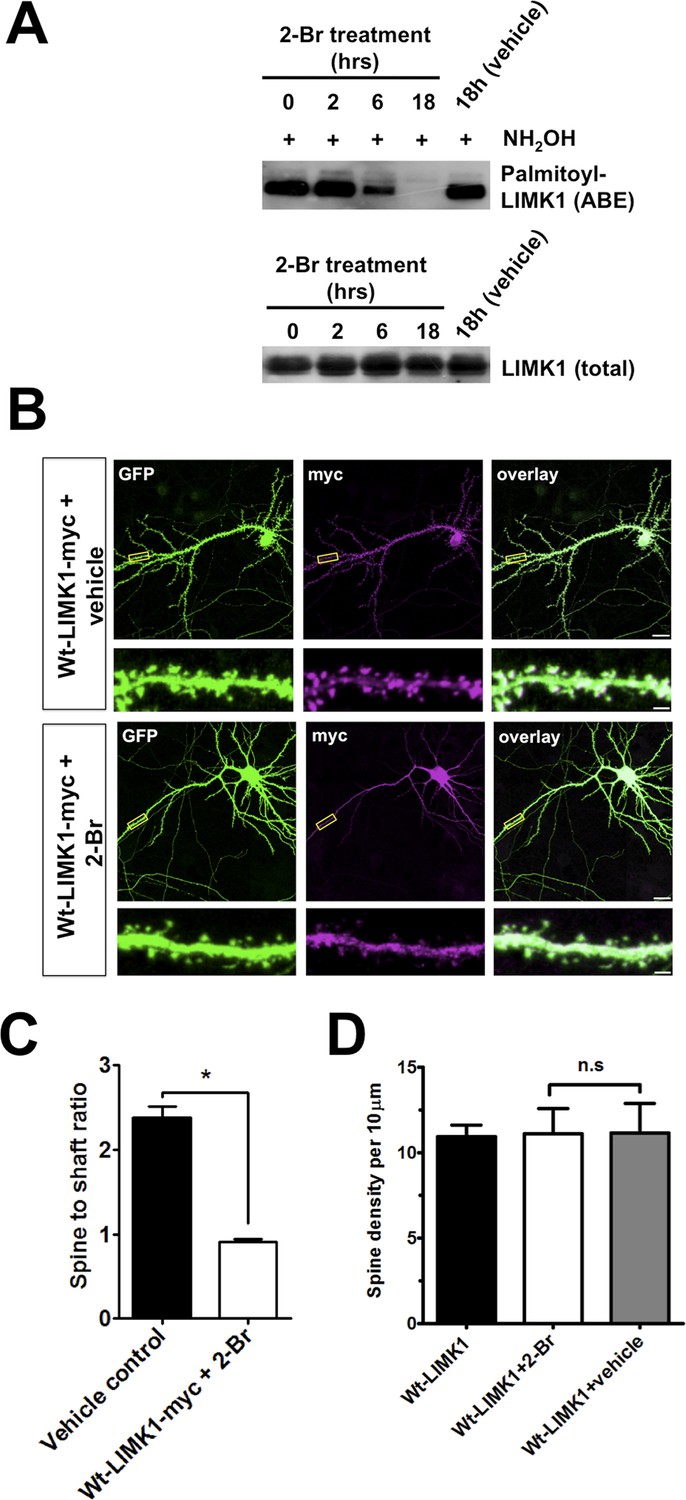
Further evidence that palmitoylation targets LIMK1 to spines.
(A) Treatment of hippocampal neurons with the palmitoylation inhibitor 2-Bromopalmitate (2-Br) confirms palmitoylation of LIMK1. Cultured hippocampal neurons (DIV20) were treated with 2-Br (100 µM) or vehicle control (EtOH) for the indicated times. ABE assays were performed to detect palmitoylated and total LIMK1 levels. (B) Representative images of DIV18 hippocampal neurons, transfected to express GFP plus wt-LIMK1-myc, treated with 100 mM 2-Br or vehicle 2 hr post-transfection, fixed 12 hr later and immunostained with the indicated antibodies. Scale bar: 20 μm. Lower panels show magnified images of single dendrites (scale bar: 1 μm). (C) Spine targeting ratio (mean ± SEM) for n = 32 neurons per condition from B. * p < 0.05, ANOVA with Dunnett's post hoc correction. (D) Quantified assessment of dendritic morphology for each condition in B confirms that 2-Br treatment does not affect dendritic spine density, n = 20–30 neurons per condition, p > 0.05, ANOVA with Dunnett's post hoc correction.
Figure 2 with 2 supplements
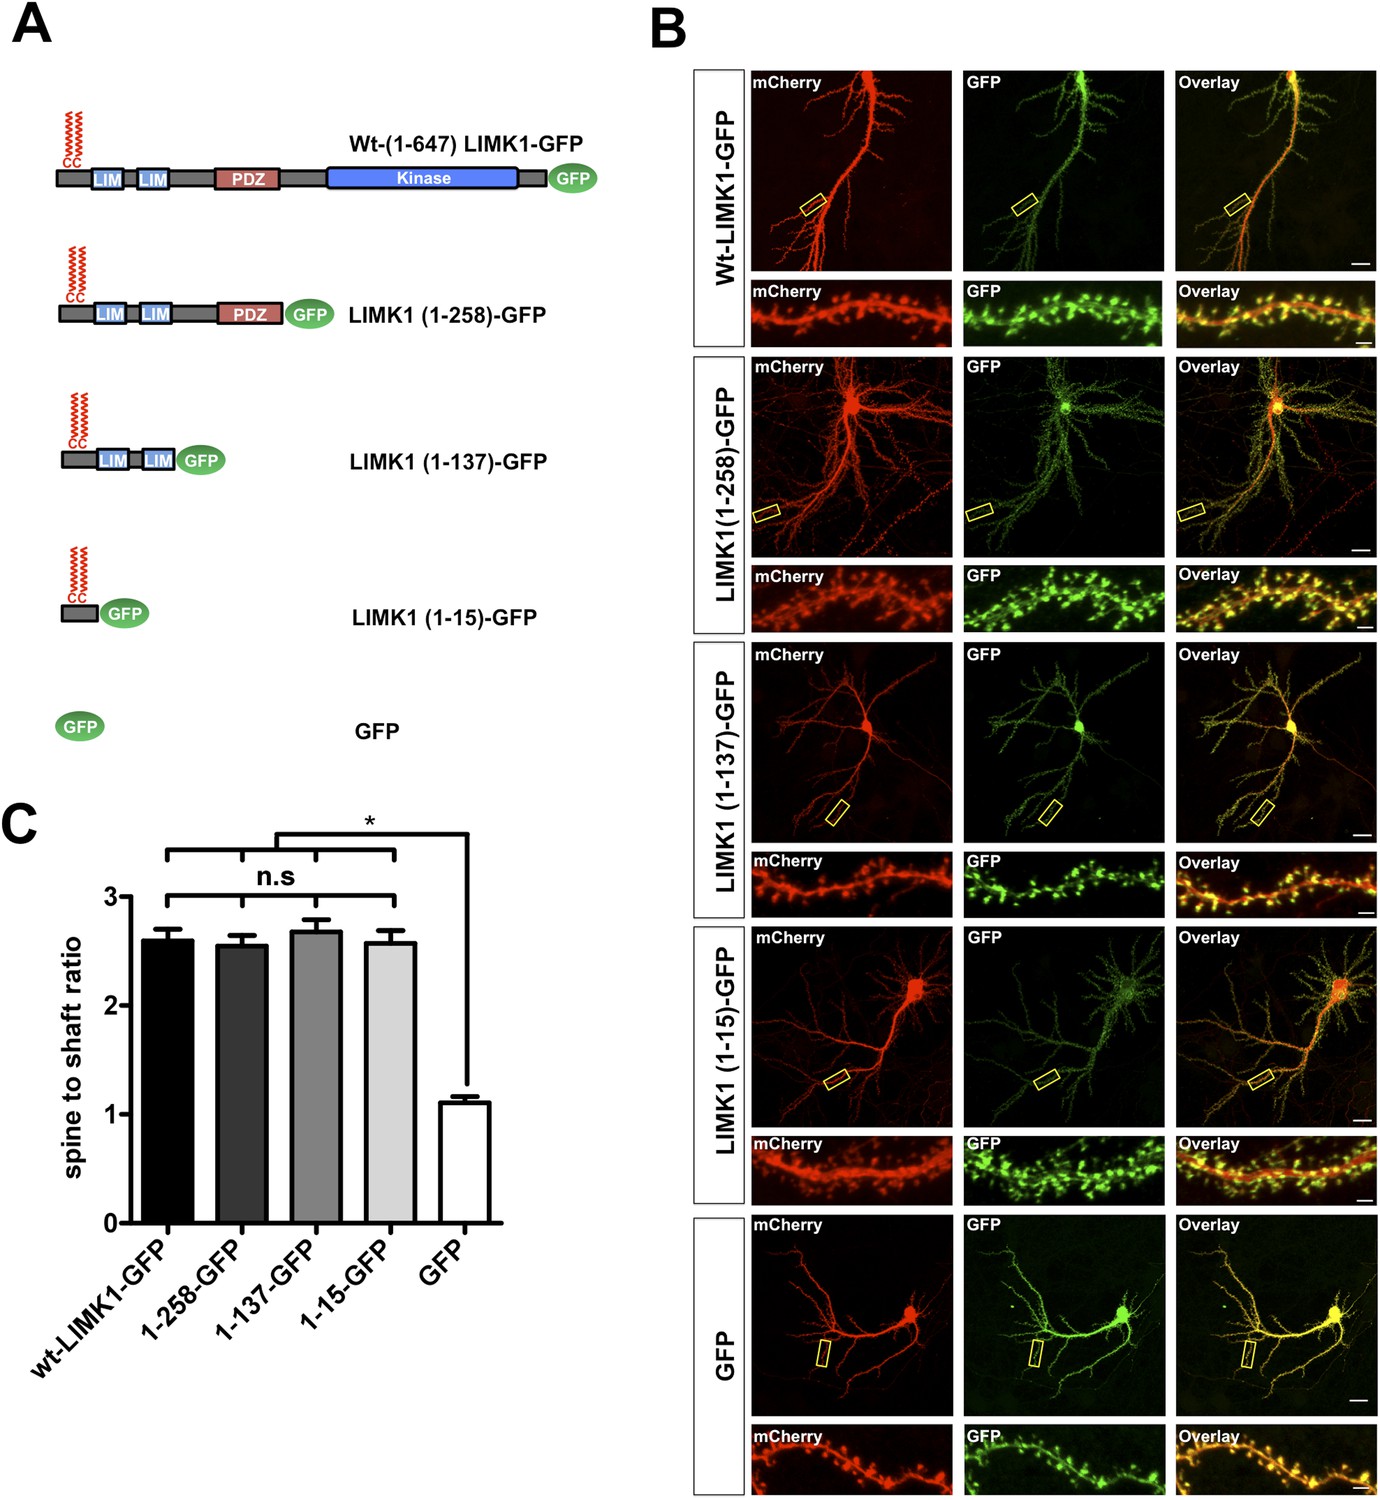
LIMK1's palmitoyl-motif is a minimal spine targeting sequence.
(A) Schematic of LIMK1 deletion mutants. (B) LIMK1's palmitoyl-motif is sufficient for spine targeting. Representative images of hippopcampal neurons (DIV18), transfected to express mCherry plus the indicated GFP-tagged LIMK1 deletion mutants from A and immunostained with the indicated antibodies (scale bar: 20 μm). Lower panels show magnified images of single dendrites (scale bar: 1 μm). (C) Spine targeting ratio (mean ± SEM ) for n = 5–15 neurons per condition from B. n.s.; p > 0.05 compared to wt-LIMK1-GFP. *; p < 0.05 compared to GFP. ANOVA with Tukey post hoc test.
Figure 2—figure supplement 1
Dual palmitoylation is necessary for LIMK1 spine targeting.
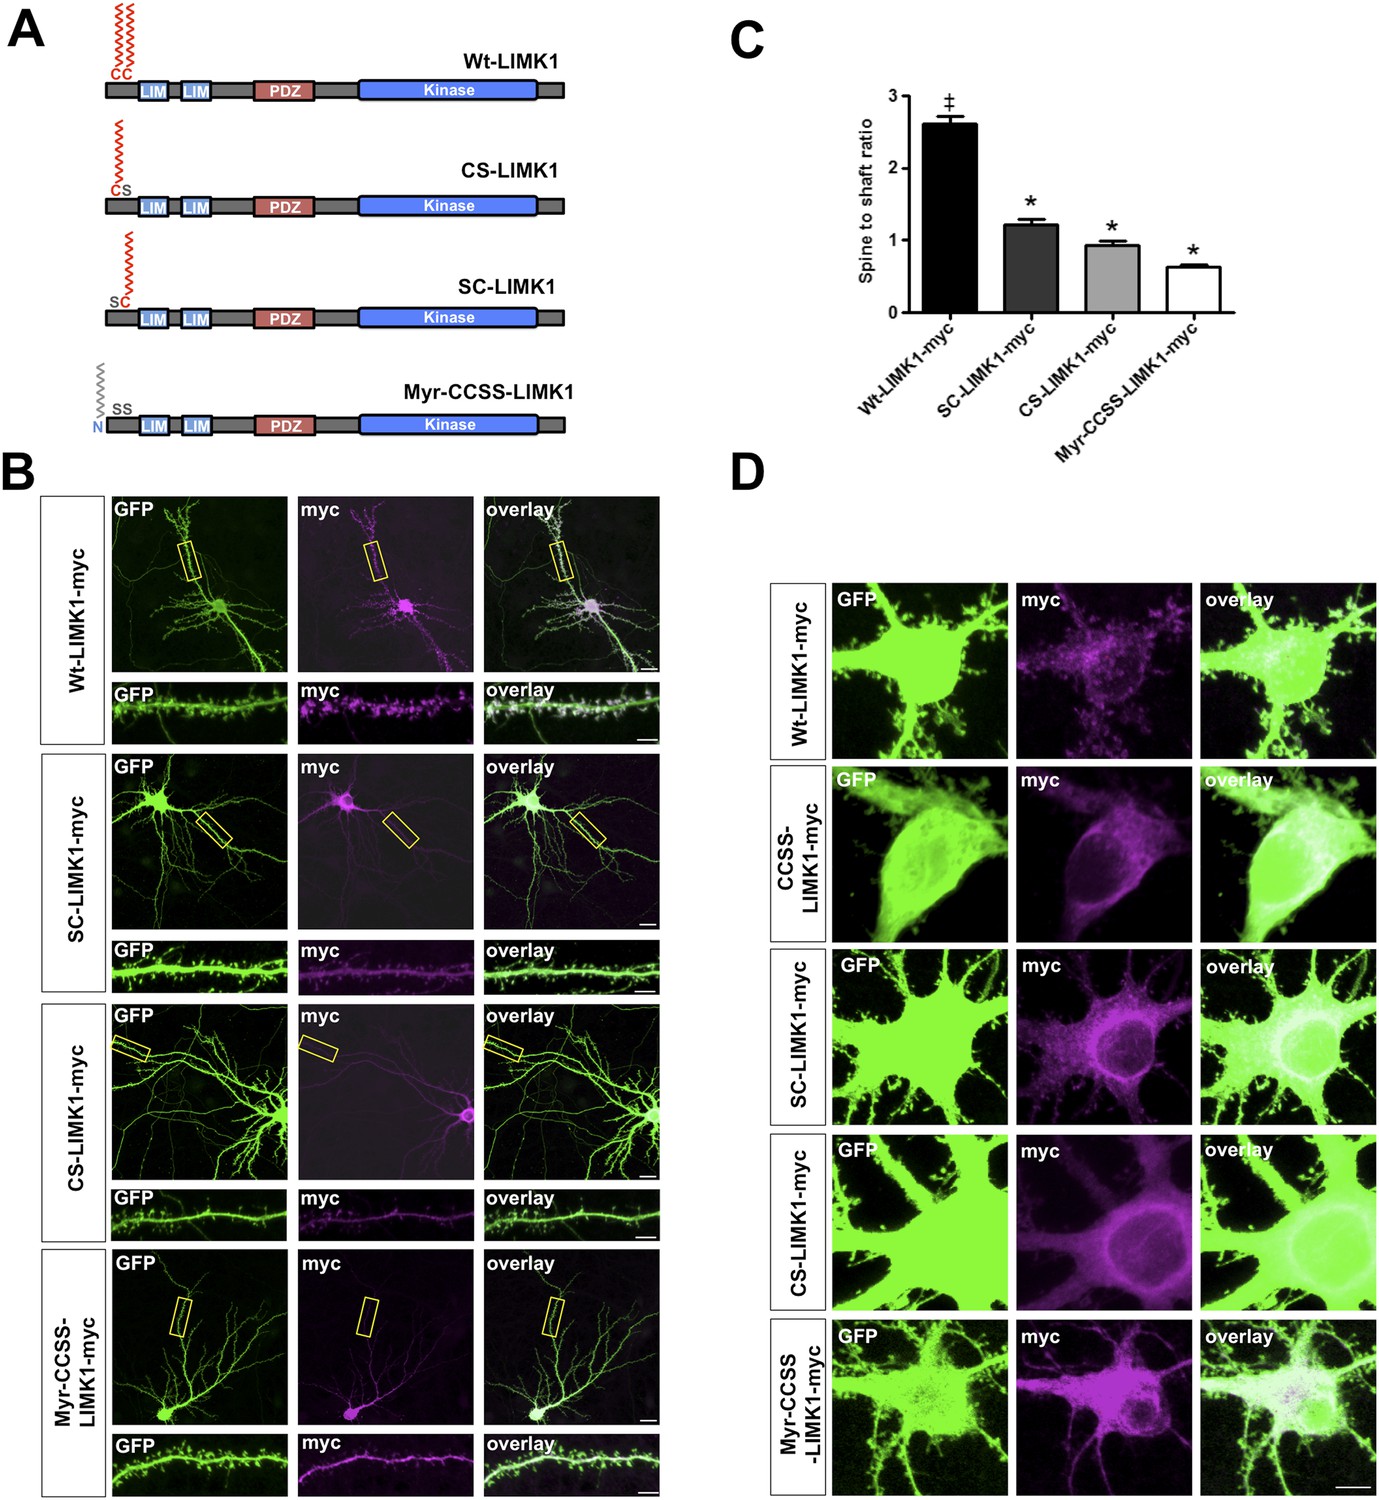
(A) Schematic of LIMK1 single palmitoylation site mutants (SC-LIMK1, CS-LIMK1) and a LIMK1 mutant in which a sequence directing addition of the lipid myristate is added to the N-terminus of CCSS-LIMK1 (Myr-CCSS-LIMK1). (B) Representative images of hippocampal neurons (DIV18), transfected to express the indicated myc-tagged LIMK1 constructs from A, plus GFP (morphology marker), immunostained with the indicated antibodies. Scale bar: 20 μm. Lower panels show magnified images of dendrites (scale bar: 1 μm). (C) Quantified spine targeting ratio for n = 30 neurons per condition from B confirm that only wt-LIMK1-myc is enriched in spines. *:p < 0.05, ANOVA with Dunnett's post hoc correction. (D) Confocal images of cell soma regions from the same conditions as in B show apparent enrichment of SC-LIMK1 and CS-LIMK1 on intracellular membranes, raising the possibility that the remaining cysteine is palmitoylated in these mutants.
Figure 2—figure supplement 2
LIMK1 mutants that are predicted to be dually lipid modified are not enriched in spines.
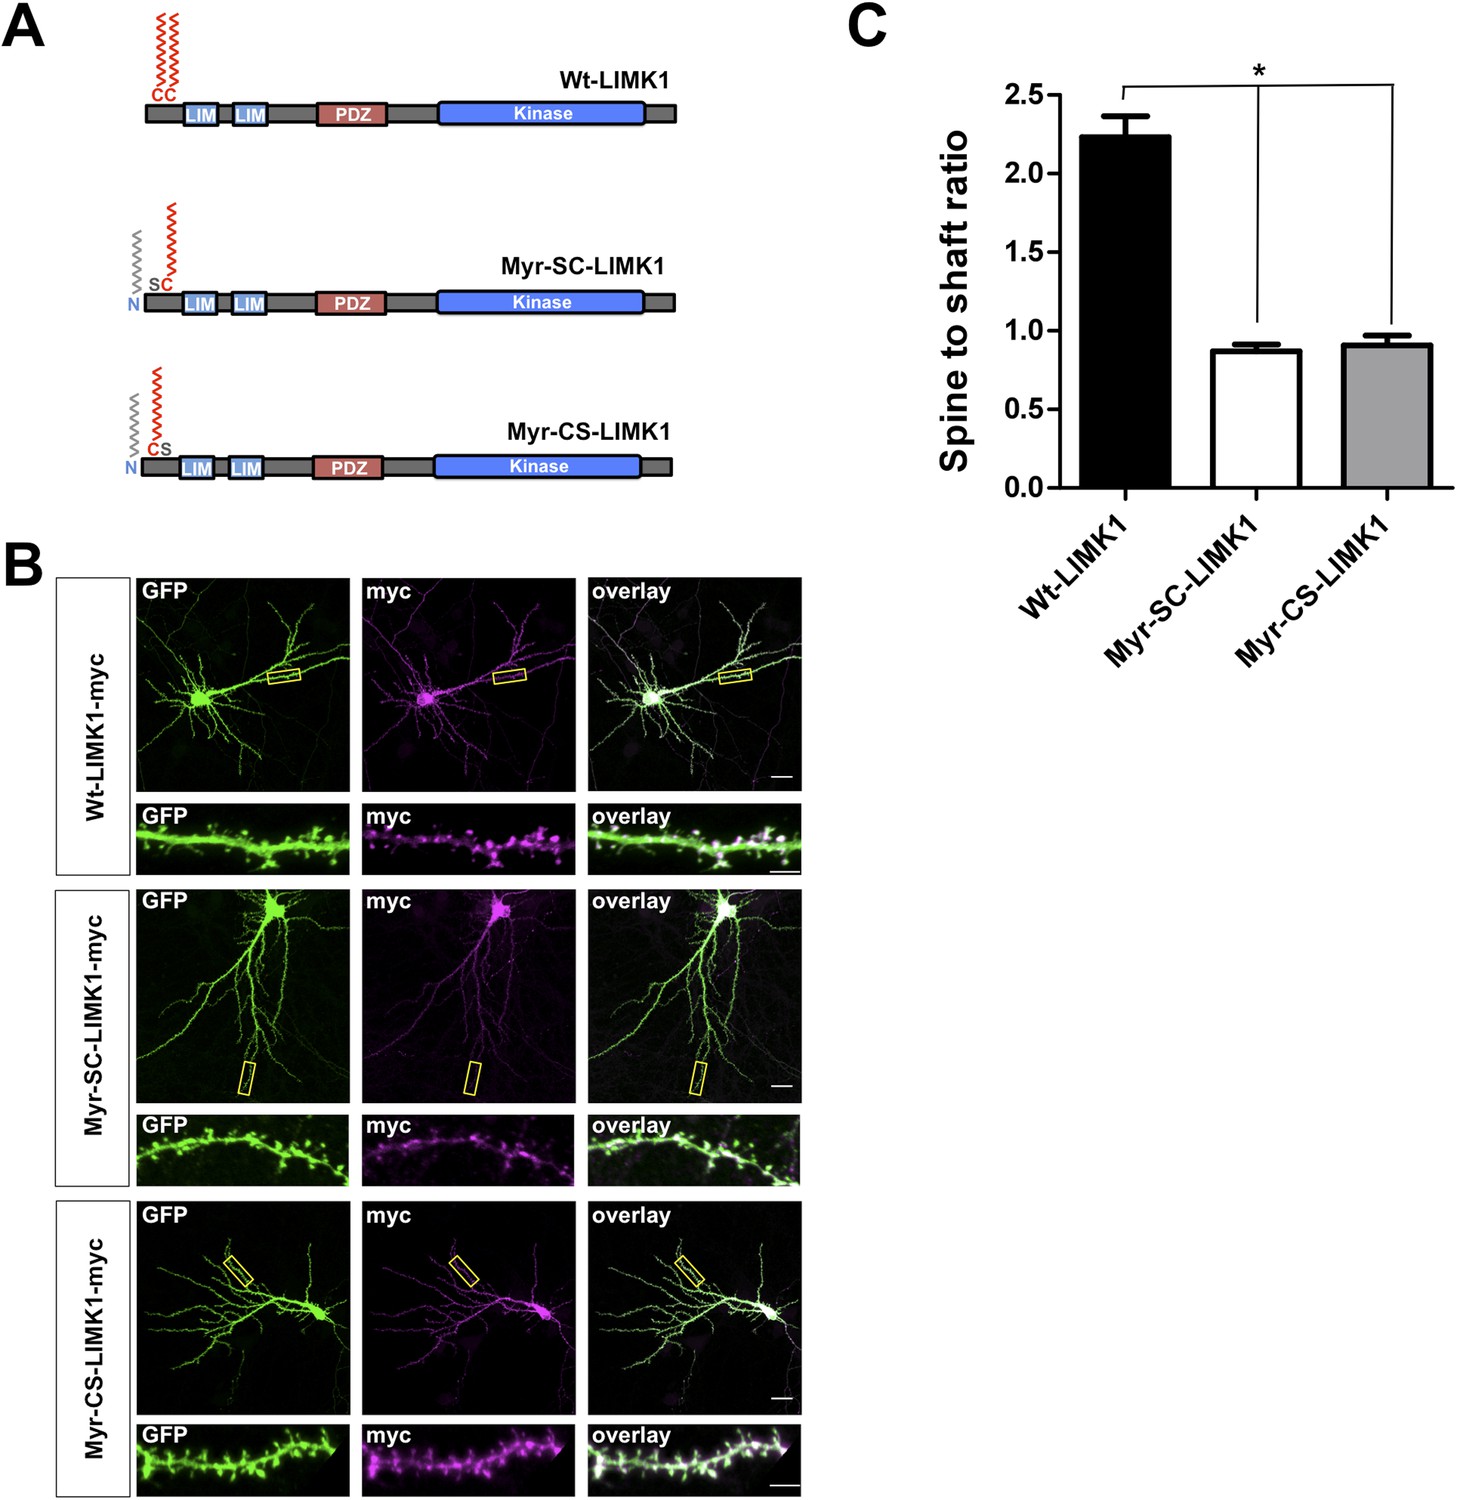
(A) Schematic of LIMK1 mutants that are predicted to be dually lipid modified with myristate plus palmitate (Myr-SC-LIMK1, Myr-CS-LIMK1). (B) Representative images of hippocampal neurons (DIV18), transfected to express the indicated myc-tagged LIMK1 constructs from A, plus GFP (morphology marker), immunostained with the indicated antibodies. Scale bar: 20 μm. Lower panels show magnified images of dendrites (scale bar: 1 μm). (C) Quantified spine targeting ratio for n = 6 neurons per condition from B confirm that only wt-LIMK1-myc is enriched in spines. *:p < 0.05, ANOVA with Dunnett's post hoc correction.
Figure 3 with 1 supplement
LIMK1's palmitoyl-motif accounts for differential localization of LIMK1 and LIMK2.
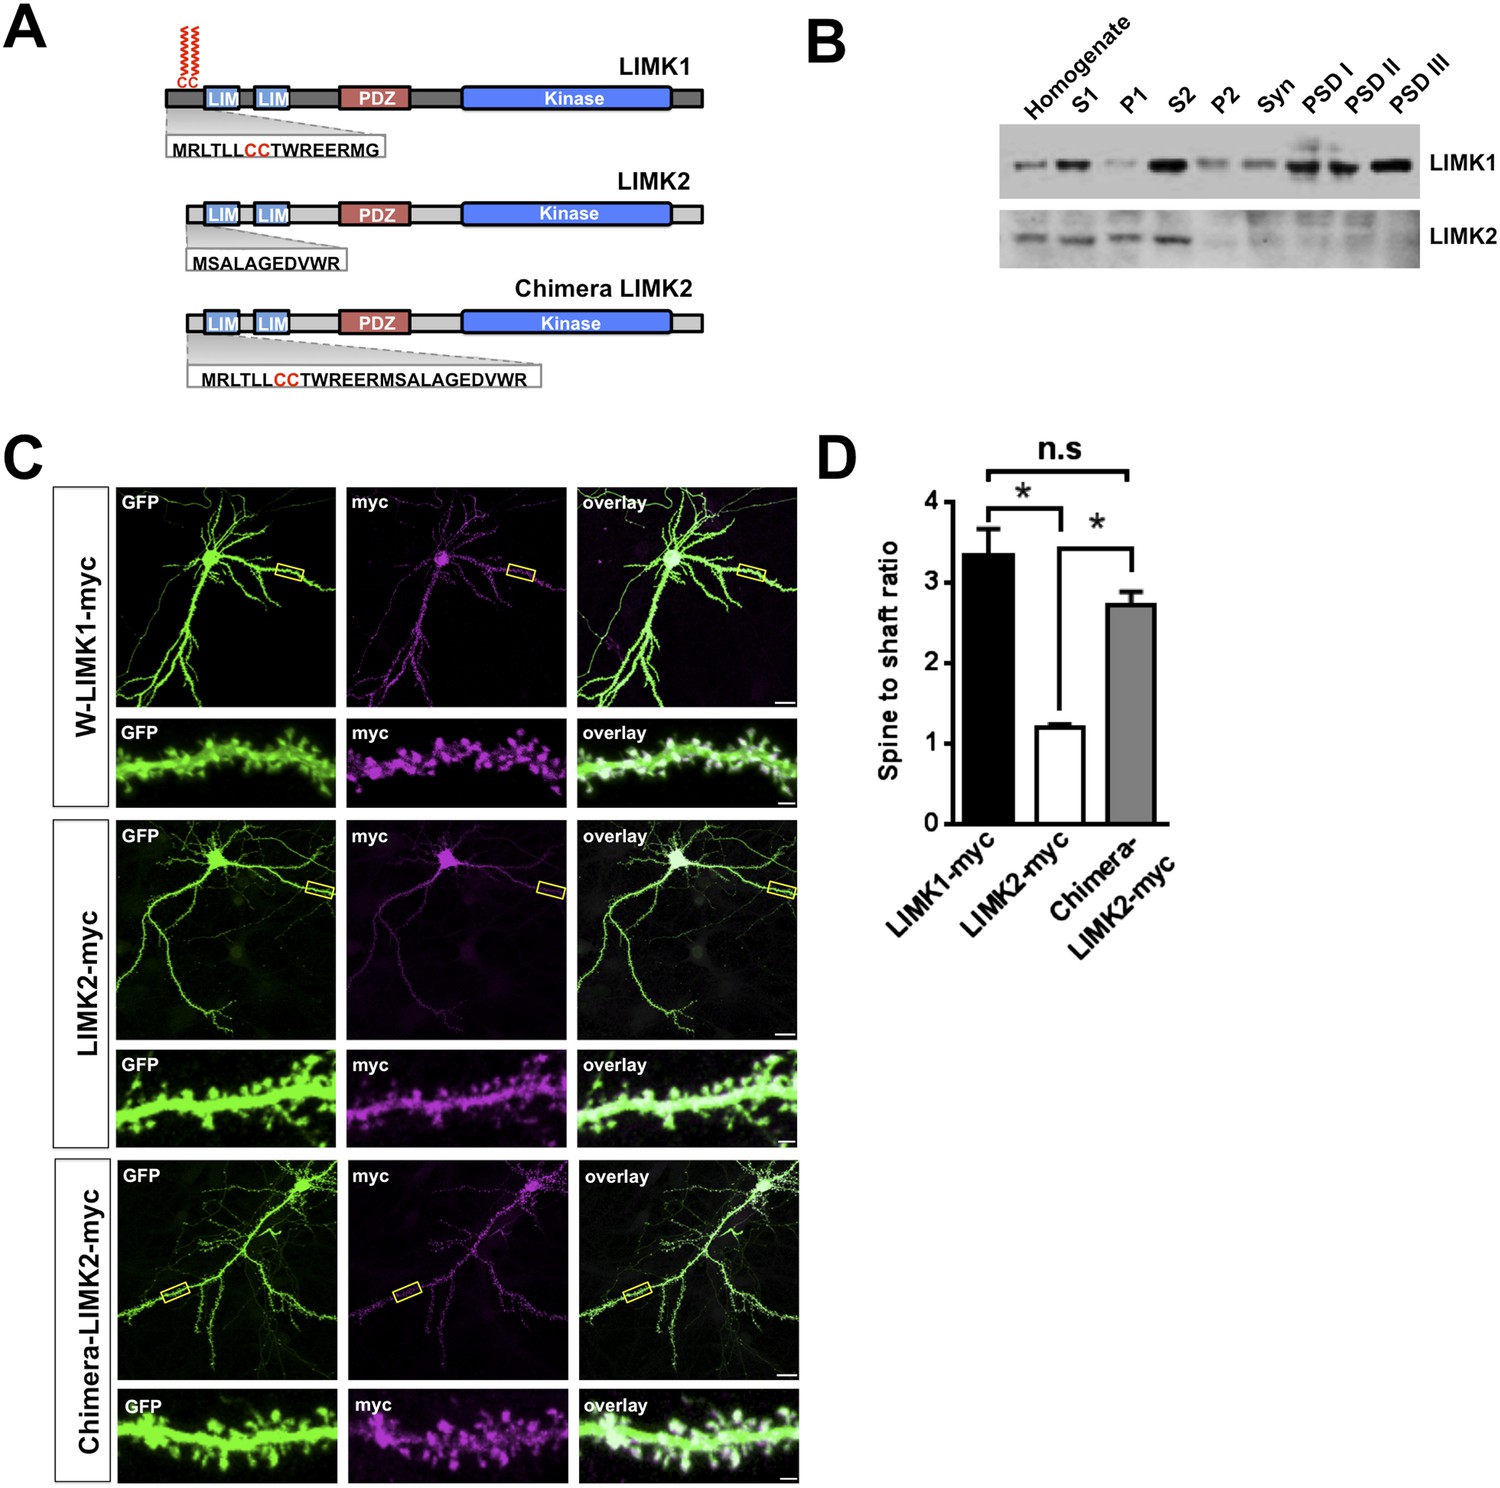
(A) Schematic of LIMK1 (top) and LIMK2 (middle), showing similar overall domain arrangement. Rat LIMK1 and LIMK2 kinase domains are 70% identical, 84% similar (NCBI BLAST). Expanded N-terminal sequences show LIMK1's unique CC motif. Lower schematic shows a chimeric protein in which the N-terminal 15 amino acids of LIMK1 are fused to LIMK2 (‘Chimera LIMK2’). (B) The indicated rat forebrain subcellular fractions were blotted to detect endogenous LIMK1 and LIMK2. LIMK1 is seen in Post-synaptic Density (PSD) fractions, consistent with a previous study, but LIMK2 is not. Fidelity of the preparation and antibody specificity is confirmed in Figure 3—figure supplement 1. (C) Hippocampal neurons (DIV18) were transfected to express GFP plus the indicated myc-tagged LIMK variants. Representative images of single neurons immunostained with the indicated antibodies are shown (scale bar: 20 μm). Lower panels show magnified images of single dendrites. (D) Spine targeting ratio (mean ± SEM) for n = 30 neurons per condition from C. * p < 0.05; n.s.: p > 0.05, ANOVA with Dunnett's post hoc correction.
Figure 3—figure supplement 1
Specificity of LIMK1 and LIMK2 antibodies and fidelity of subcellular fractionation.
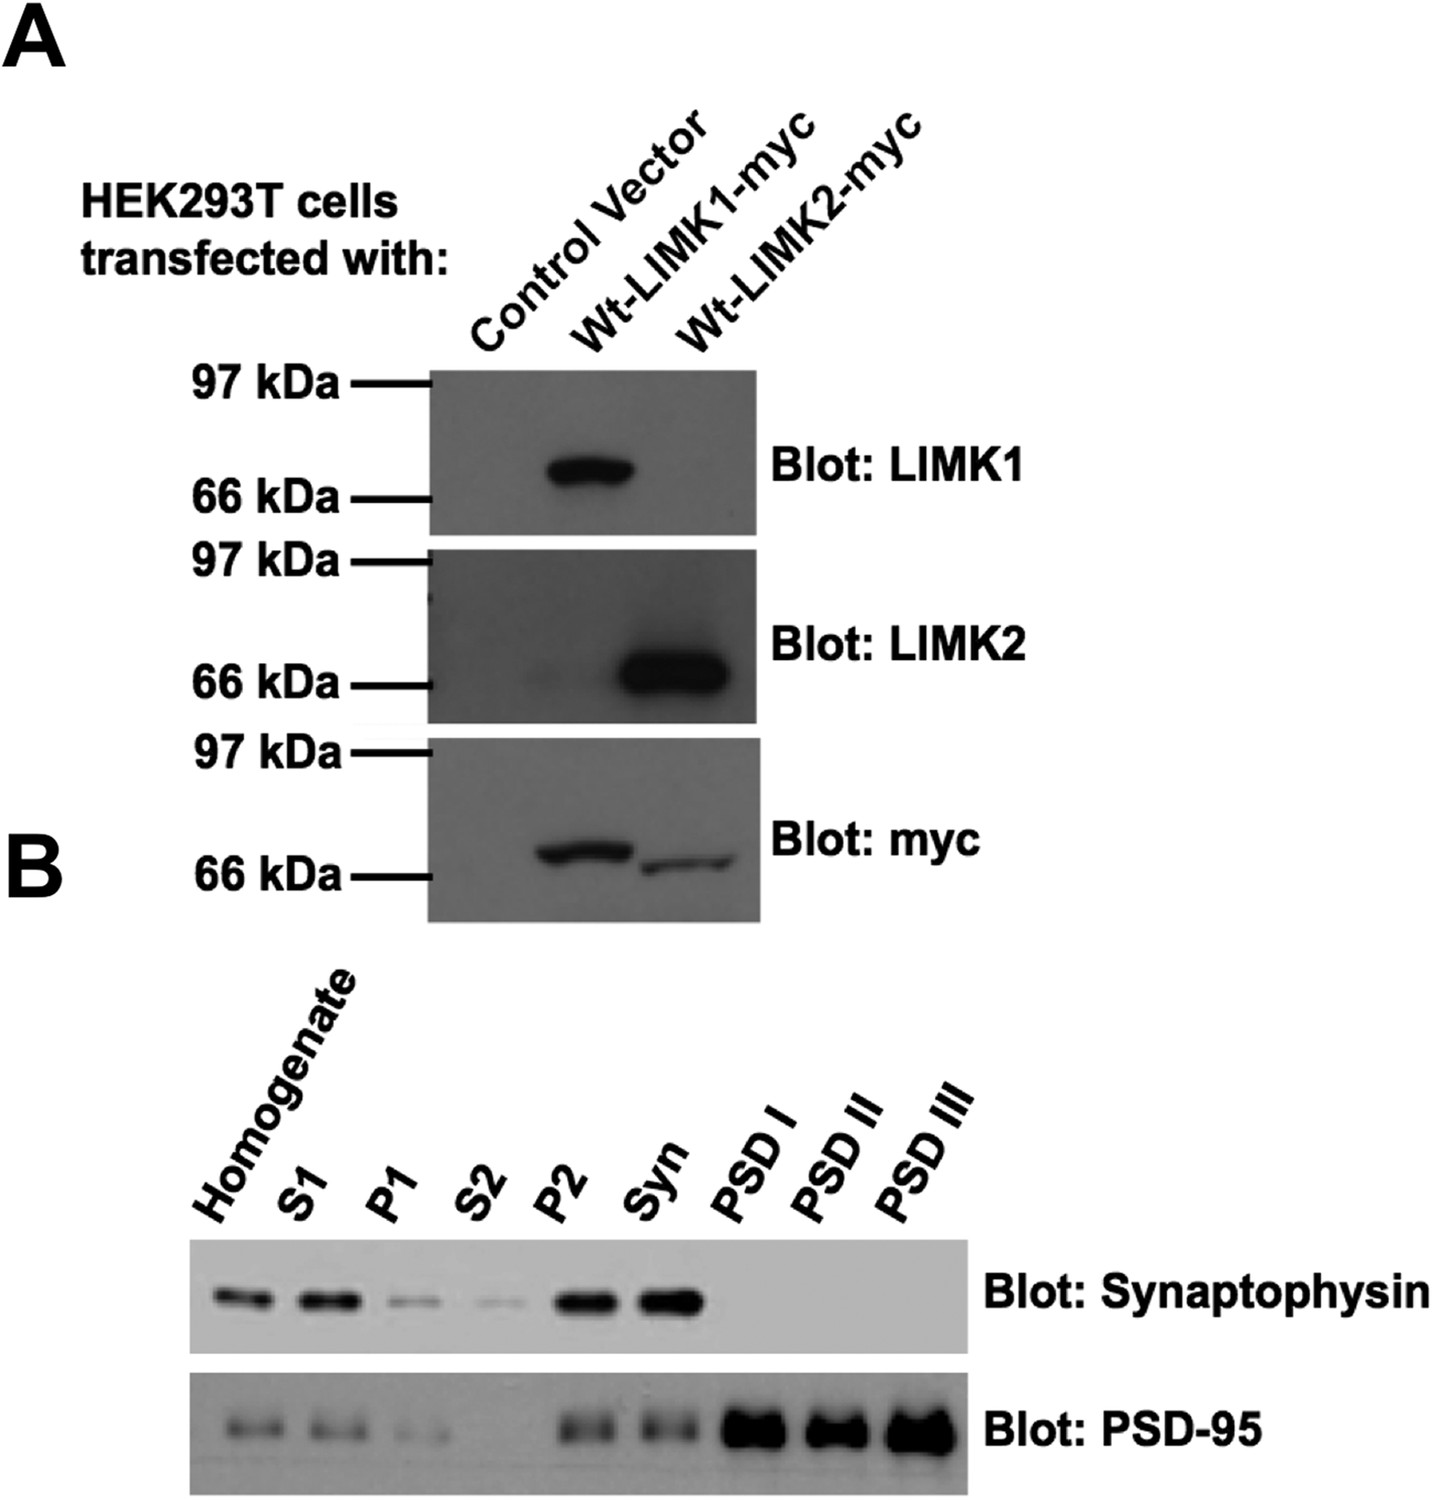
(A) HEK293T cells were transfected with empty vector, wtLIMK1-myc or wtLIMK2-myc. Lysates were blotted with the indicated antibodies. (B) Blotting of rat brain subcellular fractions with presynaptic marker (synaptophysin) and postsynaptic marker (PSD-95) confirms the fidelity of the preparation from Figure 3B.
Figure 4 with 2 supplements
Acute loss of palmitoyl-LIMK1 impairs Fluorescence Recovery After Photobleaching (FRAP) of GFP-actin in dendritic spines.
(A) Schematic of FRAP assay. GFP-actin is photobleached in a single spine. When actin filament turnover is normal, fluorescence recovers as new fluorescent actin molecules are incorporated at the barbed ends of filaments, while bleached actin is released from pointed ends. (B) Hippocampal neurons (DIV17) were transfected to coexpress GFP-actin and mCherry with or without LIMK1 shRNA, plus shr-LIMK1 rescue constructs as indicated. Dual color live images of individual dendrites are shown for each condition. (C) Images of baseline GFP-actin signal from the same dendritic regions shown in B (left column, t = 0 s, Pre-bleach). A Region of Interest (ROI, yellow circle) was photobleached and the dendrite was imaged immediately thereafter (second column images, ‘Bleach’) and at the indicated times post-bleach (third, fourth columns). (D) FRAP curves (normalized to average pre-bleach fluorescence), plotted from multiple single-spine ROIs for each condition from C. Values are mean ± SEM, n = 16–26 spines per condition. (E) Histogram of the stable fraction of GFP-actin (mean ± SEM) between t = 250 s and t = 300 s, calculated for each individual FRAP trace used to generate the pooled data in D. (Control vector: 8.3 ± 2.8%; LIMK1 knockdown: 32.2 ± 3.6%; shr-wt-LIMK1 ‘rescue’: 15.3 ± 2.4%; shr-CCSS-LIMK1 ‘rescue’: 41.0 ± 4.0%. *, p < 0.05 compared to control vector, n.s.; not significantly different, ANOVA with Dunnett's post hoc correction.
Figure 4—figure supplement 1
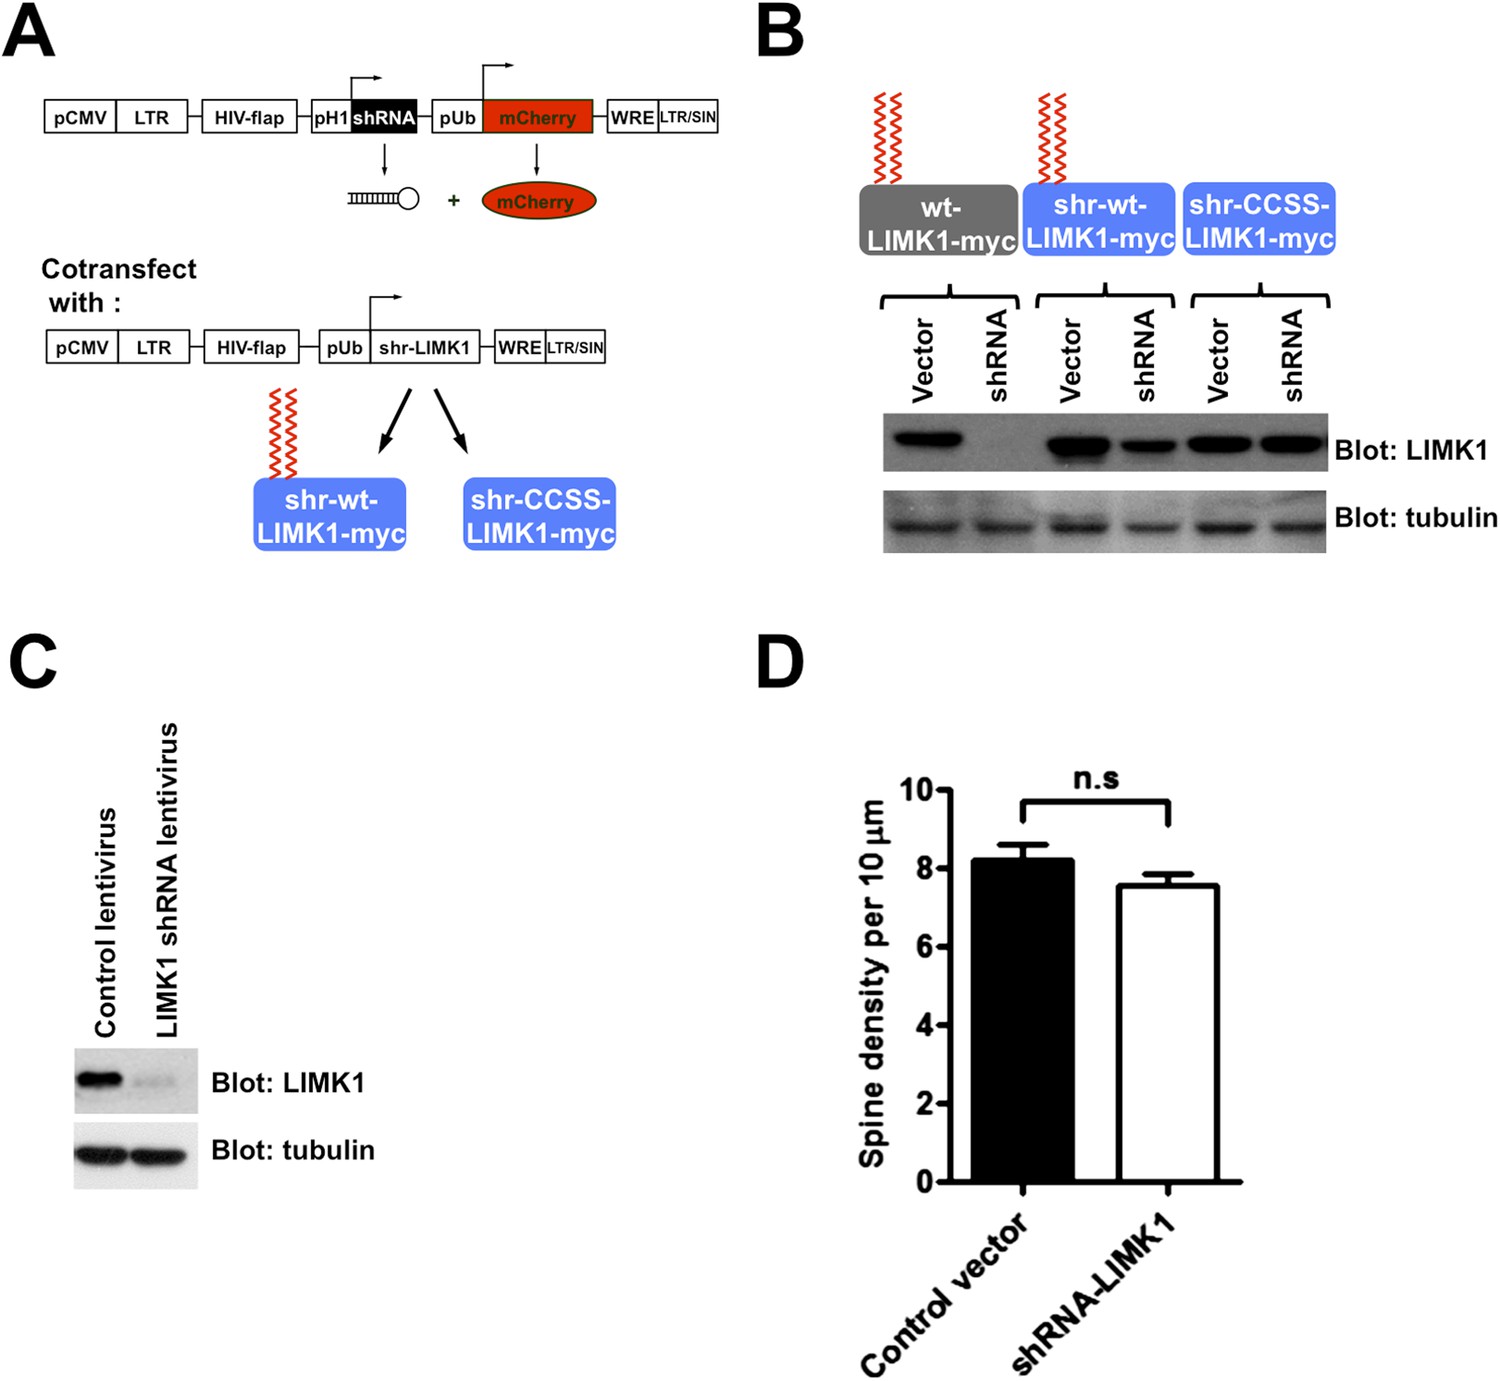
Schematic and efficacy of shRNA knockdown/rescue approach.
(A) Experimental design schematic. Transfected cells express mCherry (morphology marker) with or without LIMK1 shRNA. A cotransfected vector expresses shRNA-resistant (shr-) wt-LIMK1 or CCSS-LIMK1. (B) Effective shRNA knockdown/rescue of LIMK1. HEK293T cells were transfected with wt-LIMK1-myc, shr-wt-LIMK1-myc or shr-CCSS-LIMK1-myc cDNAs, plus either empty vector or LIMK1 shRNA-expressing vector. Lysates were blotted to detect LIMK1-myc (top) and tubulin (load control, bottom). Cotransfected LIMK1 shRNA suppresses expression of wt-LIMK1-myc (lanes 1, 2) but not shr-wt-LIMK1-myc (lanes 3, 4) or shr-CCSS-LIMK1-myc (lanes 5, 6). (C) Hippocampal neurons (DIV9) were infected with control or LIMK1 shRNA lentiviruses, generated using the vector in A. At DIV15, lysates were prepared and immunoblotted to detect LIMK1 and tubulin (load control). (D) Acute LIMK1 knockdown does not affect spine number. Hippocampal neurons were transfected with vector expressing morphology marker (GFP) with or without LIMK1 shRNA as in Figure 5, fixed 24 hr later and immunostained with anti-GFP antibody. Spines were outlined using Metamorph software and spine density per 10 micron length of dendrite was quantified.
Figure 4—figure supplement 2
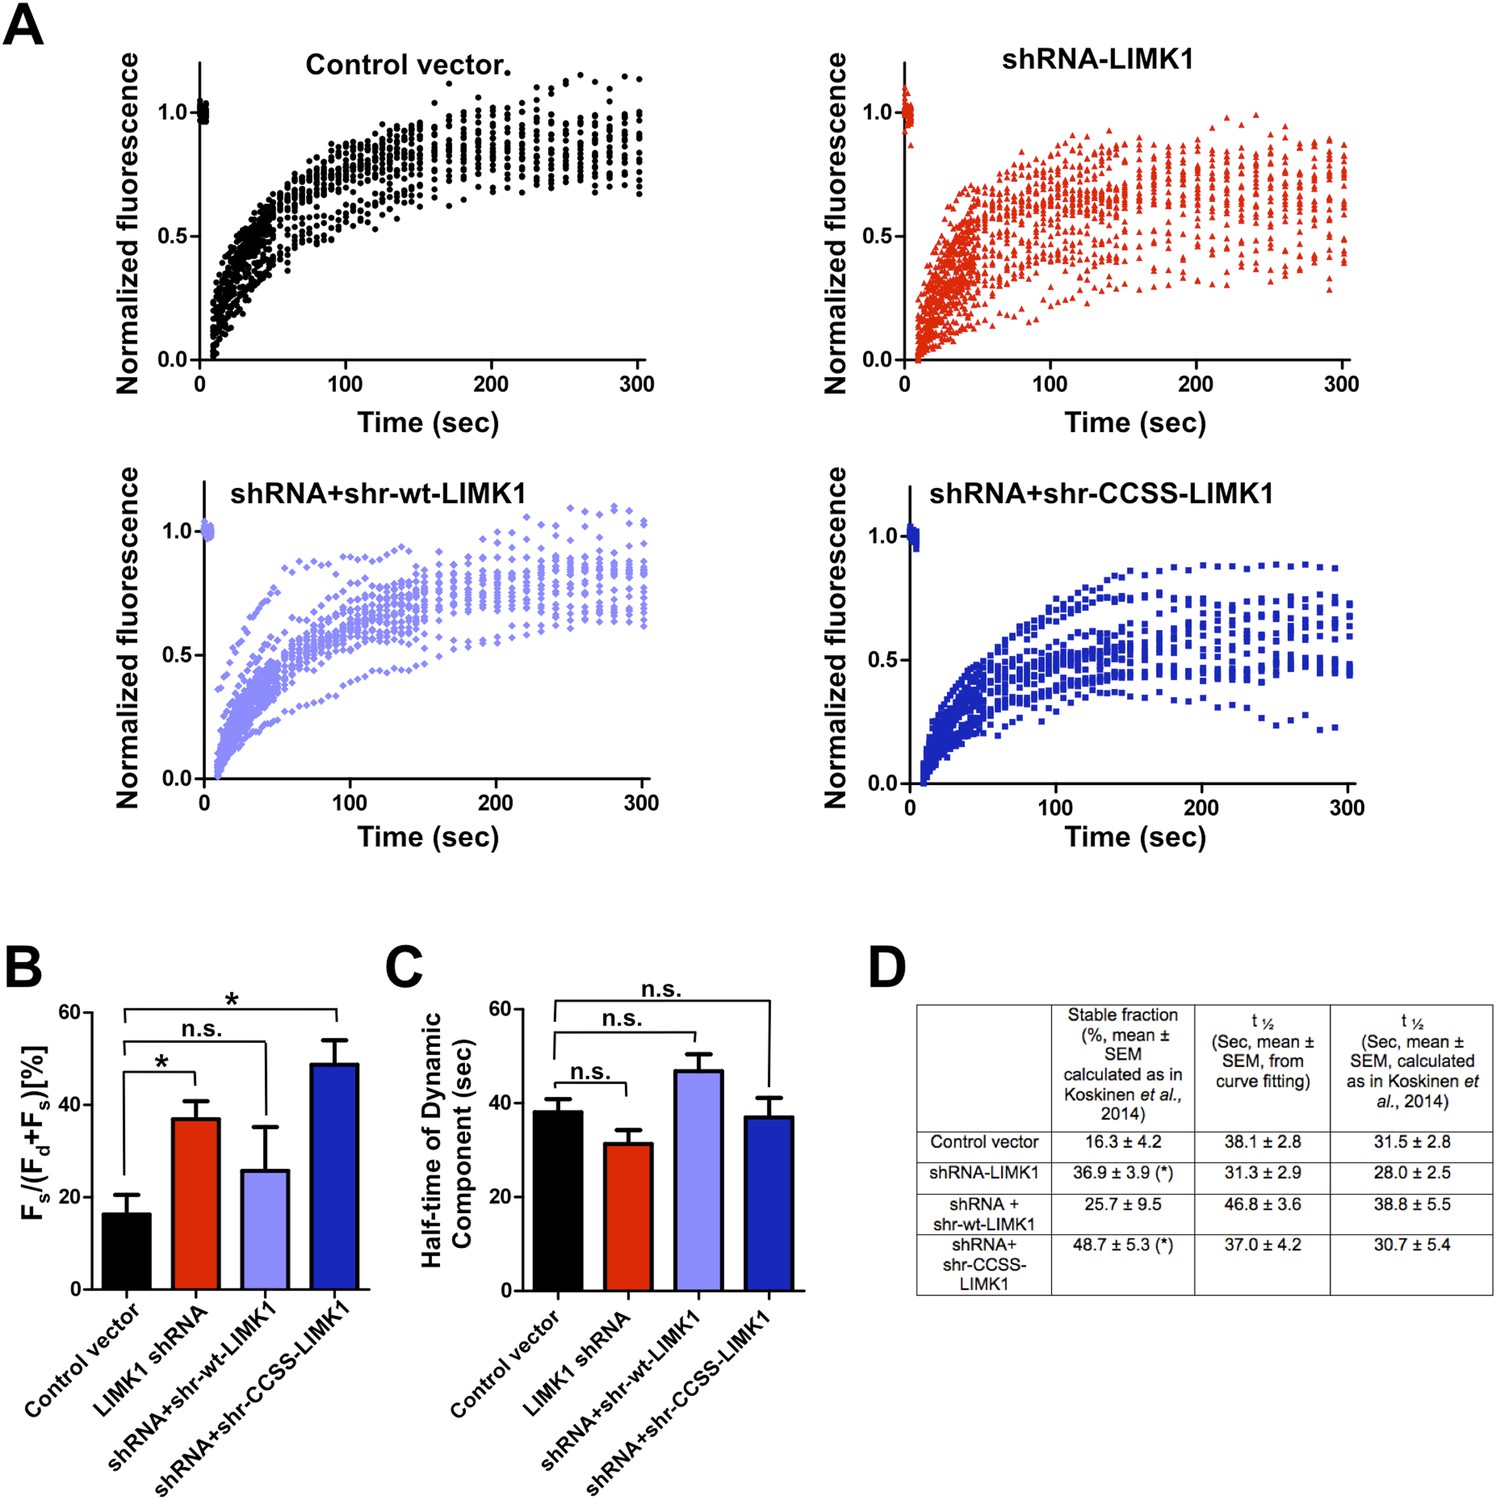
Further analysis of FRAP data confirms that acute loss of palmitoyl-LIMK1 increases the pool of stable GFP-actin in dendritic spines.
(A) Individual data points from FRAP experiments for each of the indicated conditions, which were used to generate the averaged traces shown in Figure 4D. (B) Histogram (mean ± SEM) of the stable fraction of GFP-actin (Fs/[Fs ± Fd], where Fd represents the dynamic pool) for each condition in Figure 4, calculated as in Koskinen et al., 2014 (see ‘Materials and methods’ for details). *; p < 0.05 compared to control vector, n.s.; not significantly different from control condition, ANOVA with Dunnett's post hoc correction. (C) Histogram of half-time of the dynamic component of GFP-actin, calculated by fitting individual traces to a single exponential (similar to Star et al., 2002; Koskinen and Hotulainen, 2014). (D) Table summarizing the indicated measurements from GFP-actin FRAP experiments, for the histograms in panel B (first column) and panel C (second column). The third column shows the recovery half-time of the dynamic component, calculated as in Koskinen et al., 2014. Results using this method are very similar to those obtained by curve-fitting. *; p < 0.05 compared to control vector.
Figure 5 with 2 supplements
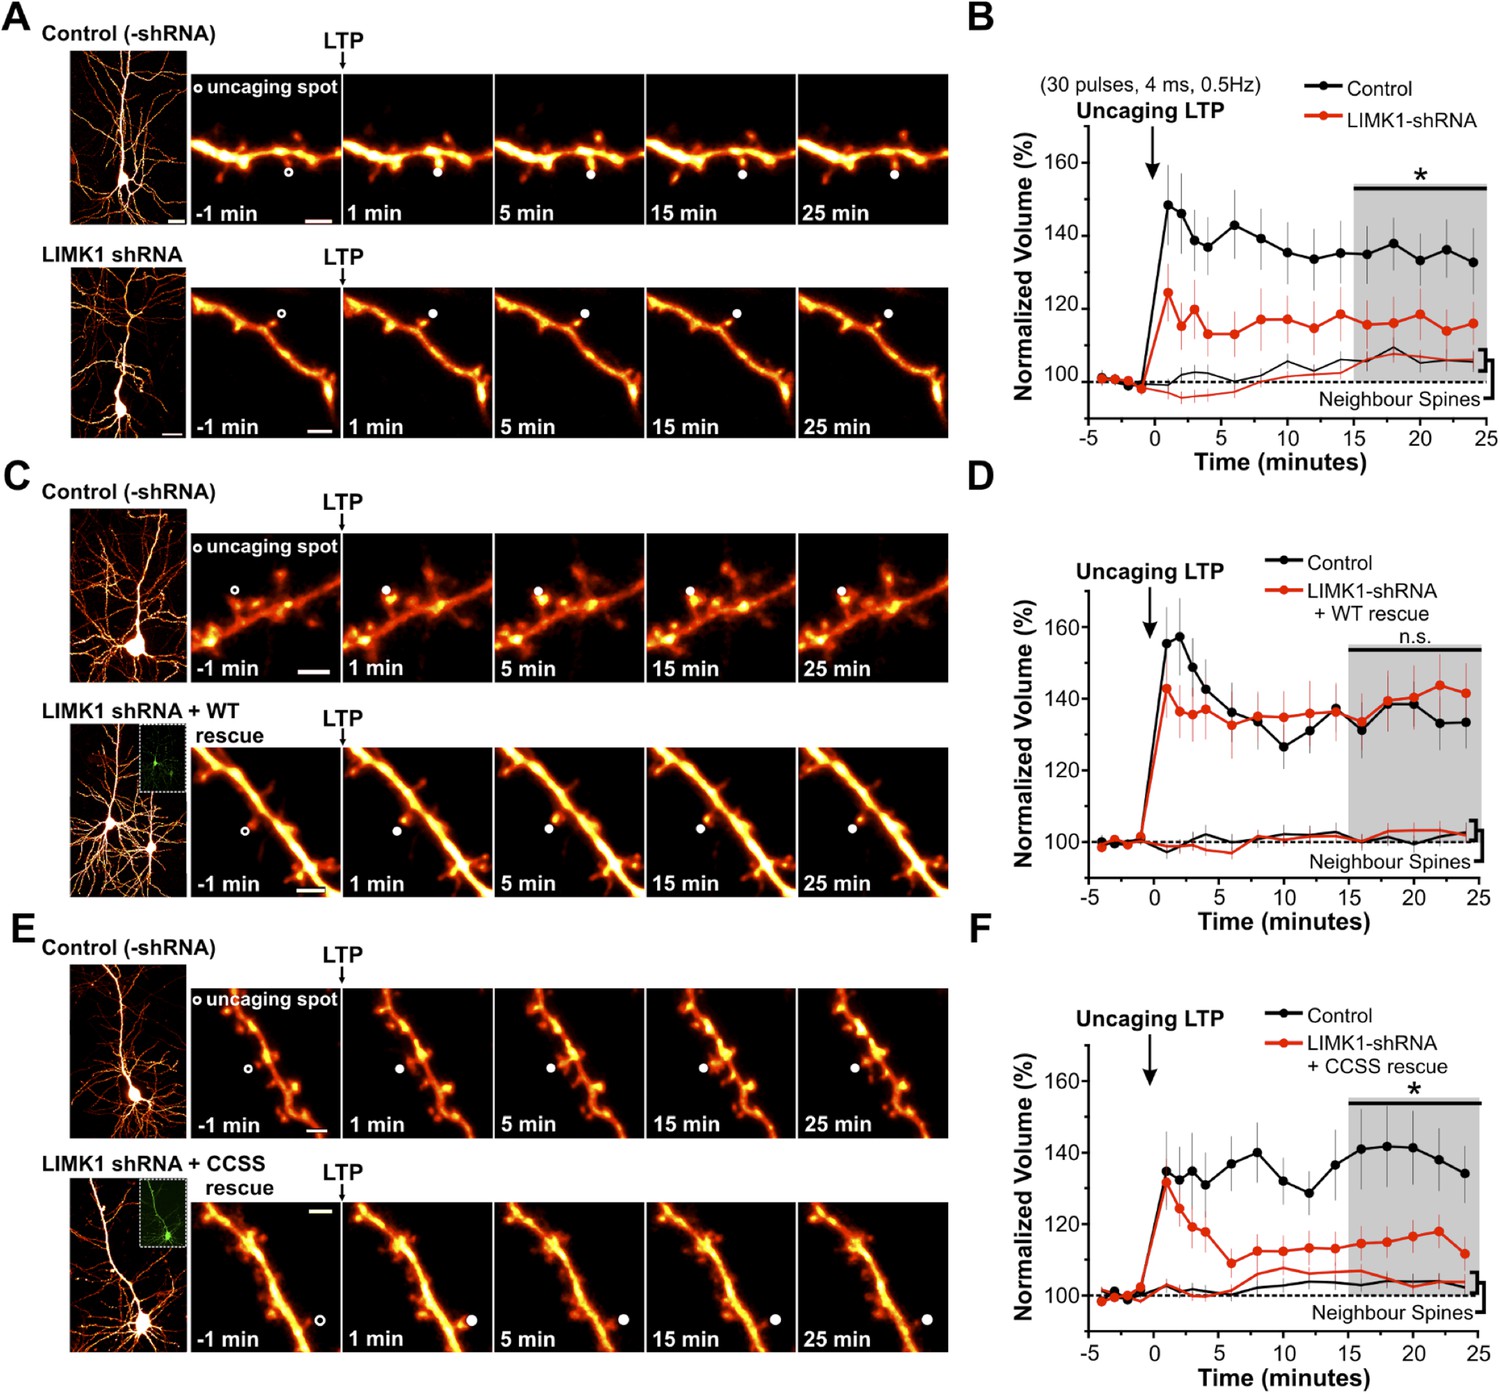
Palmitoyl-LIMK1 is required for spine-specific activity-dependent morphological plasticity.
(A) Left panels: images of individual neurons in organotypic hippocampal slices expressing mCherry with or without LIMK1 shRNA. Magnified images of individual dendrites were acquired at the indicated times prior to and following uncaging of MNI-Glutamate on the head of the indicated spine (white circles). Scale bars: low magnification, 20 μm, magnified, 2 μm. (B) Time course of normalized spine-head volume (mean ± SEM) of stimulated and neighboring spines (control: 24 stimulated spines, 72 neighbors, 6 neurons; LIMK1 shRNA: 28 stimulated spines, 84 neighbors, 6 neurons). Average normalized spine volume (15–25 min post-uncaging) was plotted and used for statistical comparison (*: p < 0.05, Mann–Whitney U test, details in main text). (C, D) Images and time courses plotted as in A, B for neurons expressing mCherry (Control; 21 stimulated spines, 63 neighbors, 6 neurons) or mCherry, LIMK1 shRNA and shr-wt-LIMK1-GFP (LIMK1-shRNA + WT rescue; 27 stimulated spines, 81 neighbors, 8 neurons). (E, F) Images and time courses plotted as in A, B for neurons expressing mCherry (control; 23 stimulated spines, 69 neighbors, 6 neurons) or mCherry, LIMK1 shRNA and shr-CCSS-LIMK1-GFP (LIMK1-shRNA+ CCSS rescue; 28 stimulated spines, 84 neighbors, 8 neurons).
Figure 5—figure supplement 1
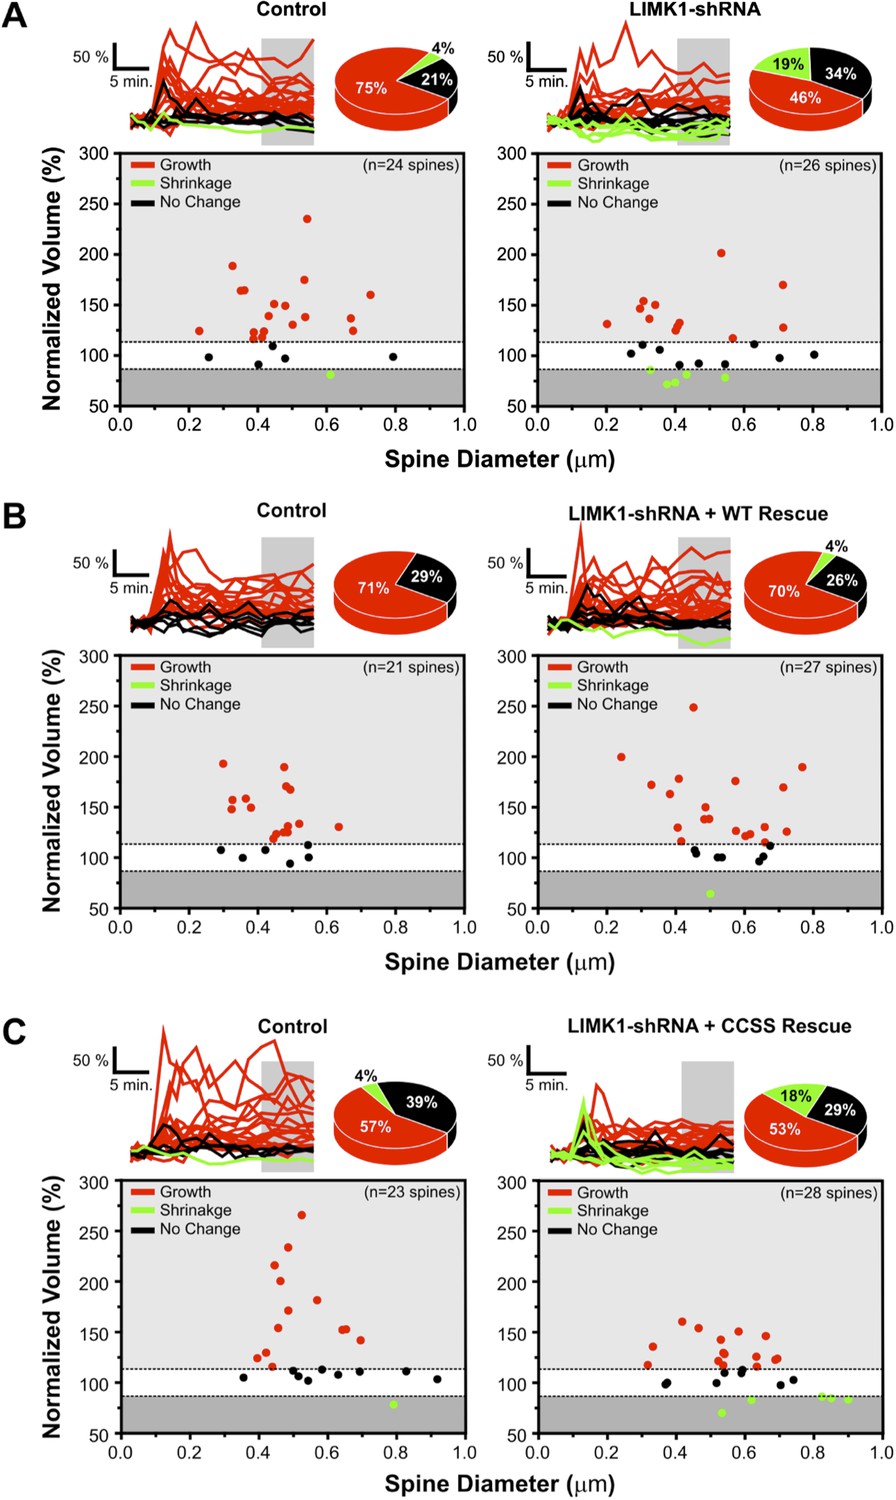
Probability of spine growth or shrinkage in response to glutamate uncaging.
(A) Upper left: individual traces for the average data in Figure 5A for control (vector-transfected) neurons. Normalized volumes for each spine, color-coded based on whether spine volume increased (red), decreased (green), or did not change (black) post-uncaging. Pie chart summarizes percentage of spines in each category. Lower left: average normalized spine volume (15–25 min post-uncaging), plotted against initial spine diameters for each spine. Right panels: same as left panels but for spines from LIMK1 ‘knockdown’ neurons. LIMK1 knockdown not only reduced the magnitude of activity-dependent spine enlargement (Figure 6A), but also decreased spine growth success (12/26 spines; 46%) compared with control neurons (18/24 spines; 75%). LIMK1 knockdown also more frequently caused spine shrinkage (5/26 spines; 19%) compared with control neurons (1/24 spines; 4%). (B) Individual traces for average data from Figure 5C, plotted as in A for spines from interleaved control and shRNA-LIMK1 + WT ‘rescue’ neurons. Spine growth success was similar in wt-LIMK1 rescue neurons (19/27 spines; 70%) and controls (15/21 spines; 71%). (C) Individual traces for the average data in Figure 5E, plotted as in A for spines from interleaved control and shRNA-LIMK1 + CCSS ‘rescue’ neurons. CCSS-LIMK1 ‘rescue’ more frequently caused spine shrinkage (5/28 spines; 18%) compared with controls (1/23 spines; 4%).
Figure 5—figure supplement 2
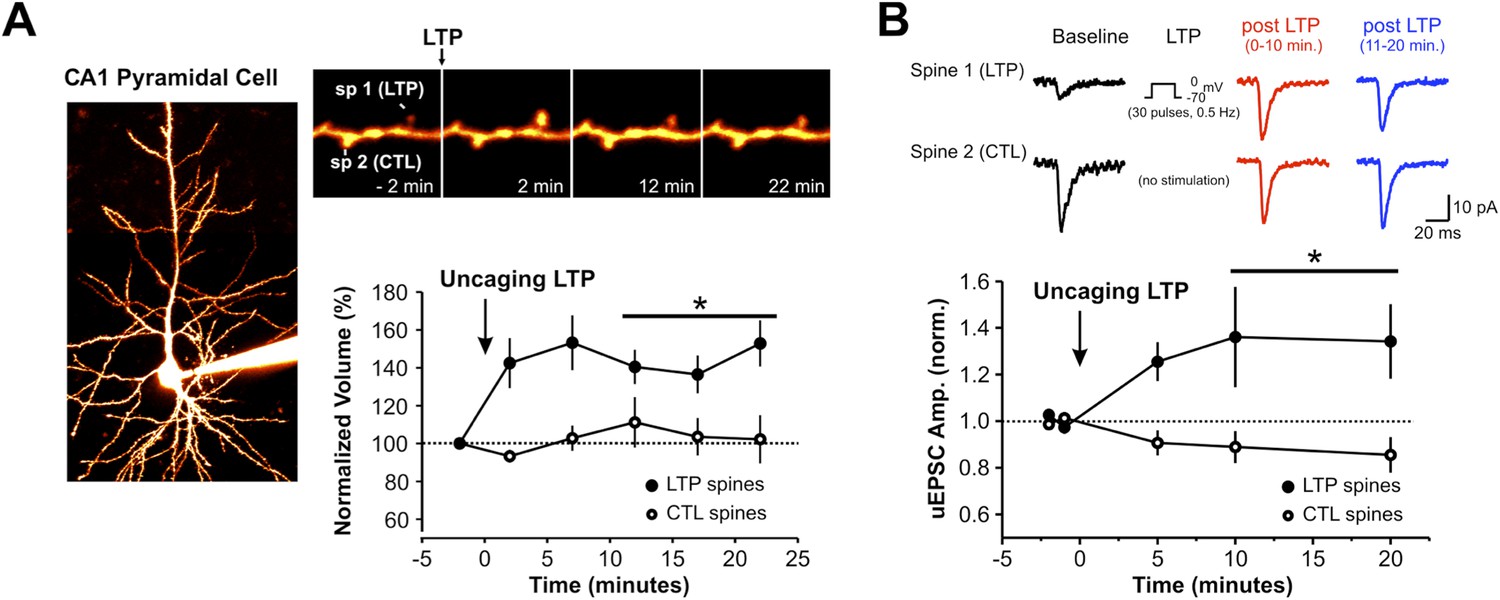
2-photon uncaging of MNI-glutamate induces spine-specific increases in both spine volume and synaptic strength.
(A) A CA1 pyramidal neuron in an organotypic hippocampal slice is filled with Alexa594 dye via the patch pipette. Repetitive focal uncaging of MNI-glutamate (4 ms pulses at 720 nm, 30 pulses, 0.5 Hz) when neurons are clamped at 0 mV results in structural enlargement of stimulated spine but not unstimulated control spines (spine volume at 10–20 min post LTP; stimulated spines: 141.3 ± 7.4% of baseline, n = 11 spines, p < 0.01; unstimulated spines: 106.4 ± 9.6% of baseline, n = 11 spines, p = 0.519 ). (B) Amplitude of uncaging-evoked excitatory postsynaptic currents (uEPSCs) from stimulated spines (at −70 mV) was also significantly increased following single spine repetitive uncaging at 0 mV (normalized uEPSC amplitude at 10–20 min post LTP; stimulated spines: 1.31 ± 0.13, n = 11 spines, p < 0.05; unstimulated spines: 0.89 ± 5.5, n = 11 spines, p = 0.09).
Figure 6
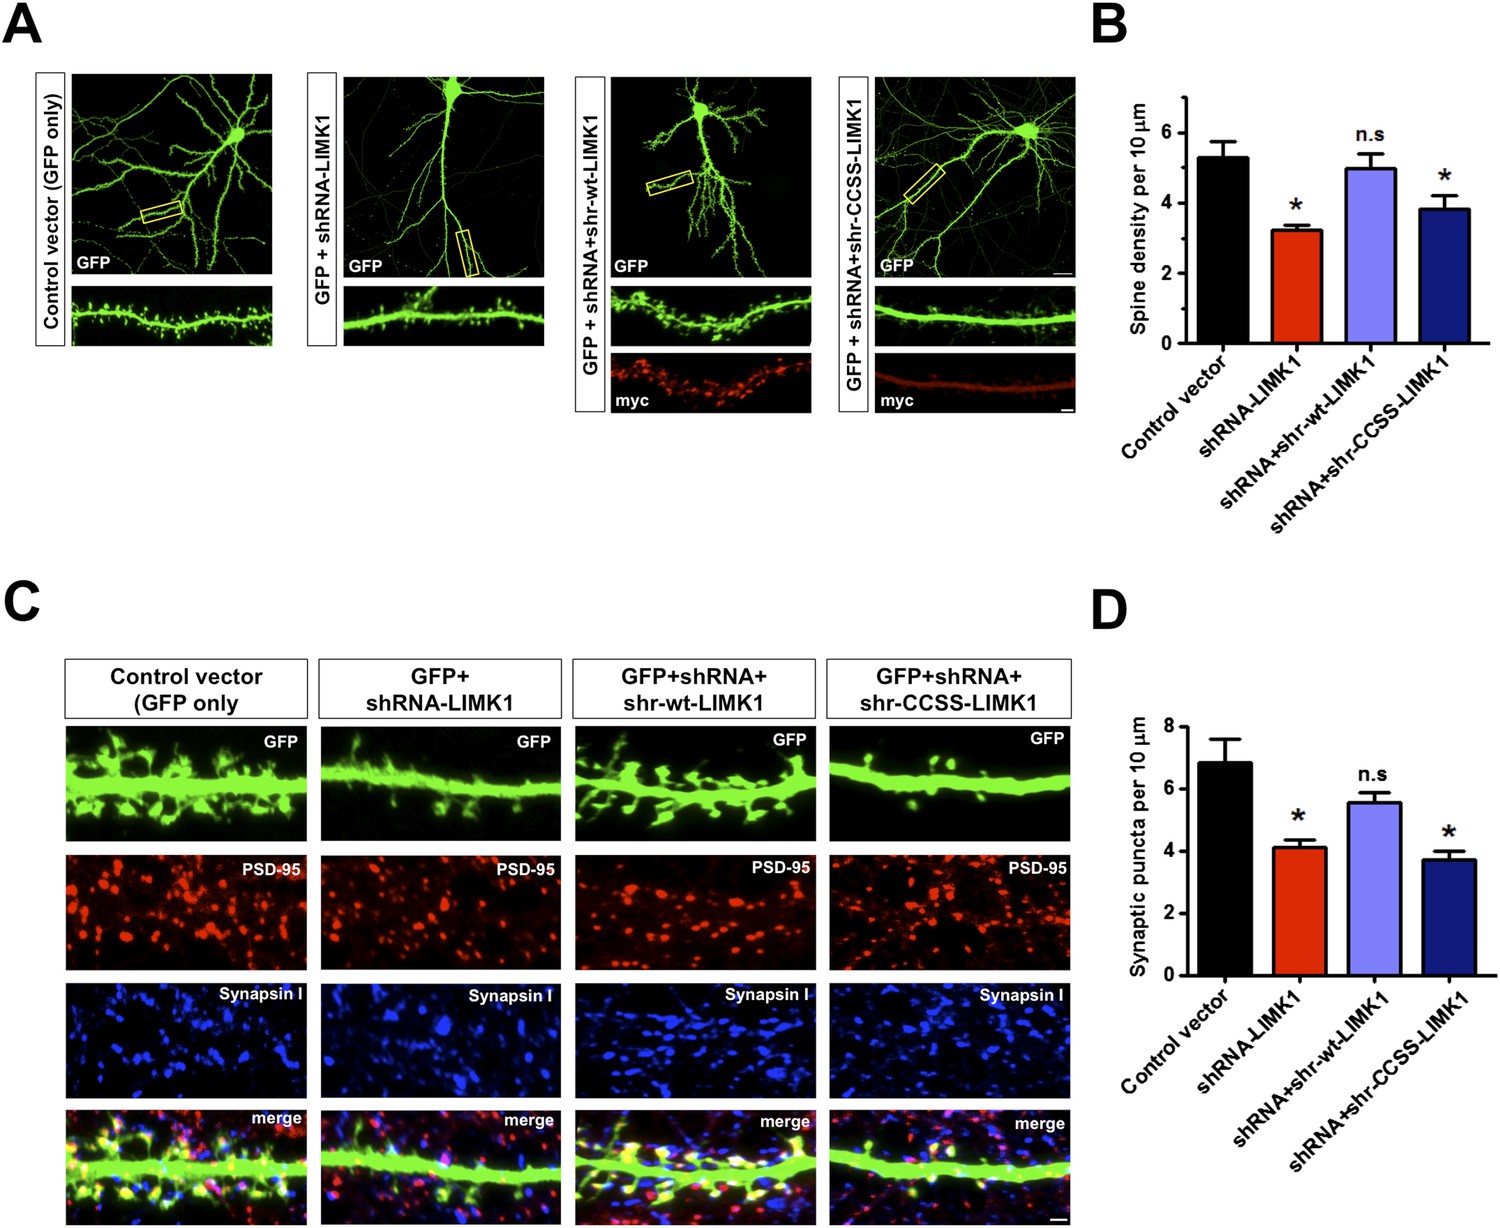
Prolonged loss of palmitoyl-LIMK1 reduces dendritic spine and synapse number.
(A) Hippocampal neurons (DIV17) transfected to express GFP alone (first panel), GFP plus LIMK1 shRNA (second panel), or GFP plus LIMK1 shRNA, plus the indicated LIMK1 ‘rescue’ constructs (third, fourth panels). Neurons were fixed 5 days later and immunostained to detect GFP and myc. Scale bar: 20 μm. Lower panels show magnified images of single dendrites (scale bar: 1 μm). (B) Spine density per 10 μm dendritic length from multiple neurons from A (mean ± SEM: control vector: 5.38 ± 0.48 spines; LIMK1 shRNA: 3.23 ± 0.15 spines; shRNA plus shr-wt-LIMK1: 4.99 ± 0.41 spines; shRNA plus shr-CCSS-LIMK1: 3.82 ± 0.40 spines; *p < 0.05 compared to control vector, ANOVA, Dunnett's post hoc correction. N = 40–50 neurons per condition). (C) Neurons transfected as in A were immunostained to detect GFP (morphology marker, green), presynaptic marker synapsin I (blue) and postsynaptic marker PSD-95 (red) (scale bar, 1 μm). (D) Quantified density (mean ± SEM) of colocalized PSD-95 and synapsin I puncta (morphologically defined synapses) per 10 μm dendritic length per condition from C. (Synaptic puncta: vector alone: 6.83 ± 0.76; LIMK1 shRNA: 4.12 ± 0.21; shRNA plus shr-wt-LIMK1: 5.54 ± 0.32; shRNA plus shr-CCSS-LIMK1: 3.71 ± 0.28; *p < 0.05 compared to control vector, ANOVA with Dunnett's post hoc correction. N = 30 neurons per condition).
Figure 7 with 1 supplement
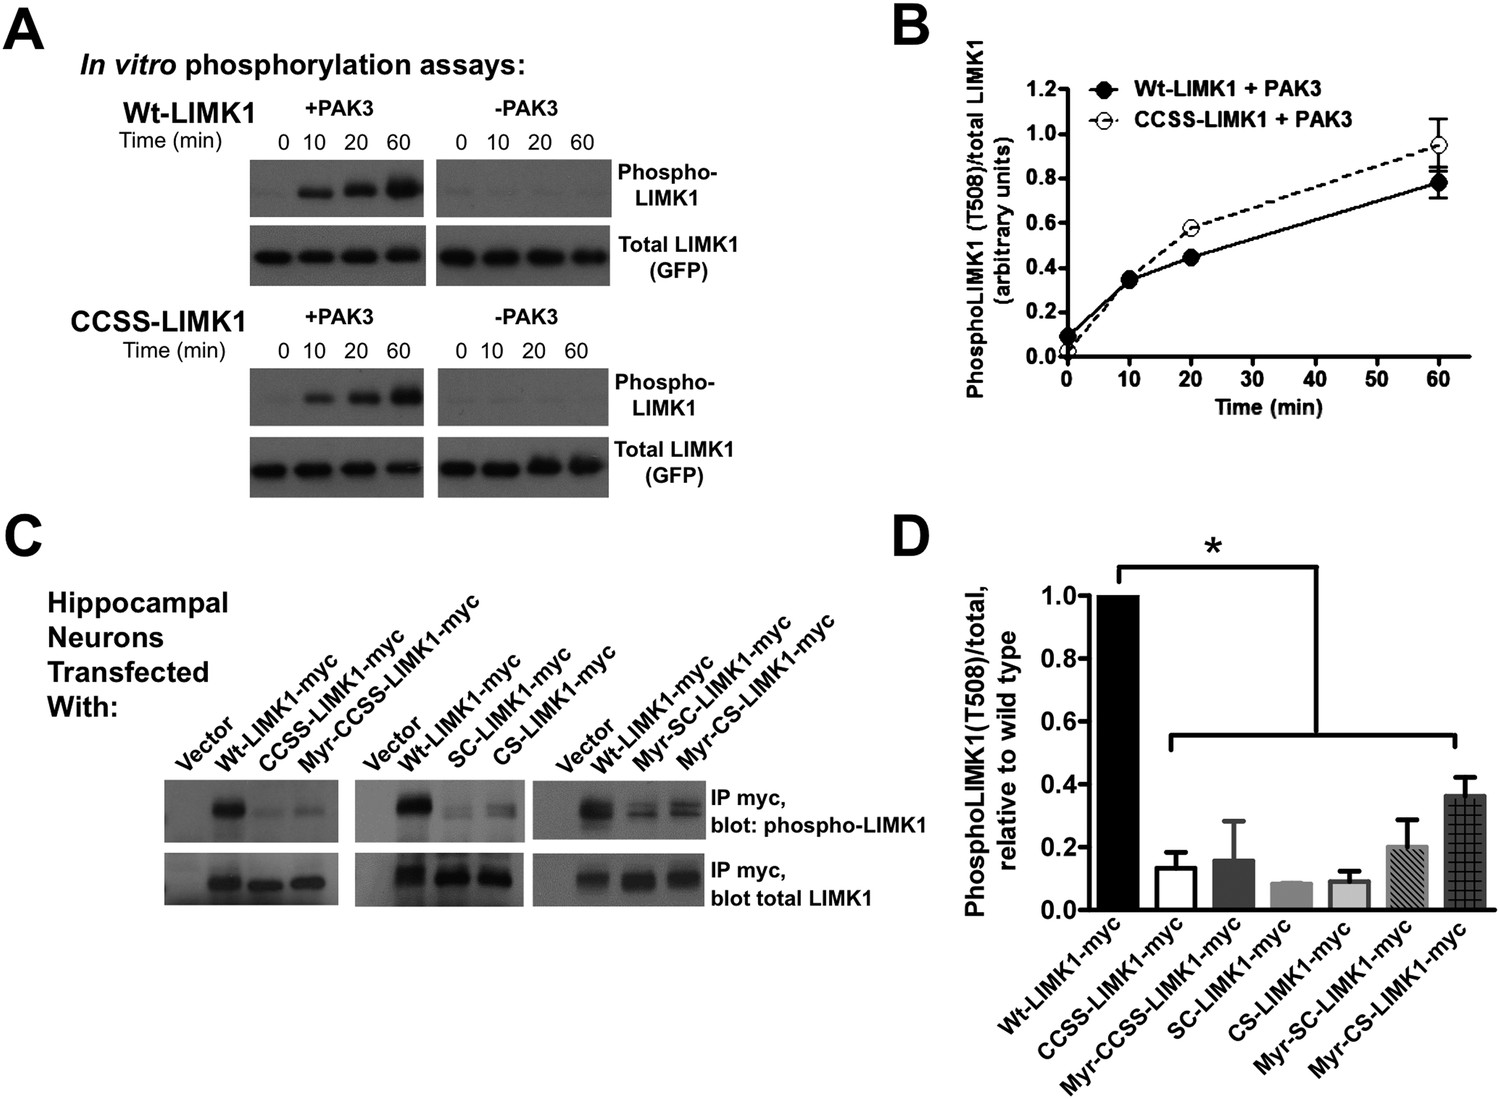
Di-palmitoylation is critical for LIMK1 activation in neurons.
(A) CCSS mutation does not affect LIMK1 T508 phosphorylation in vitro. Wt- and CCSS-LIMK1-GFP were incubated in vitro with Mg-ATP, with or without active PAK3. Reactions were stopped at the indicated times, subjected to SDS-PAGE and immunoblotted to detect phospho-T508 LIMK1 and total LIMK1. (B) Quantified data (mean ± SEM, N = 3 determinations per condition) from assays in A. Timecourse and extent of phosphorylation of Wt- and CCSS-LIMK1 by PAK3 is similar in vitro. (C) Dual palmitoylation is uniquely required for LIMK1 T508 phosphorylation in neurons. Hippocampal neurons transfected with the indicated myc-tagged LIMK1 constructs were lysed and myc immunoprecipitates were immunoblotted to detect phospho-T508 and total LIMK1. (D) Quantified signals (mean ± SEM) for N = 3–6 determinations per condition from C. *p < 0.05 compared to wt-LIMK1-myc. ANOVA with Dunnett's post hoc correction. Note that phosphorylation of Myr-CS LIMK1 differs from that of CS-LIMK1 or Myr-CCSS-LIMK1 (ANOVA). This result suggests that, at least for Myr-CS-LIMK1, addition of the myristolyation tag does not interfere with recognition of the remaining palmitoyl-site.
Figure 7—Figure supplement 1
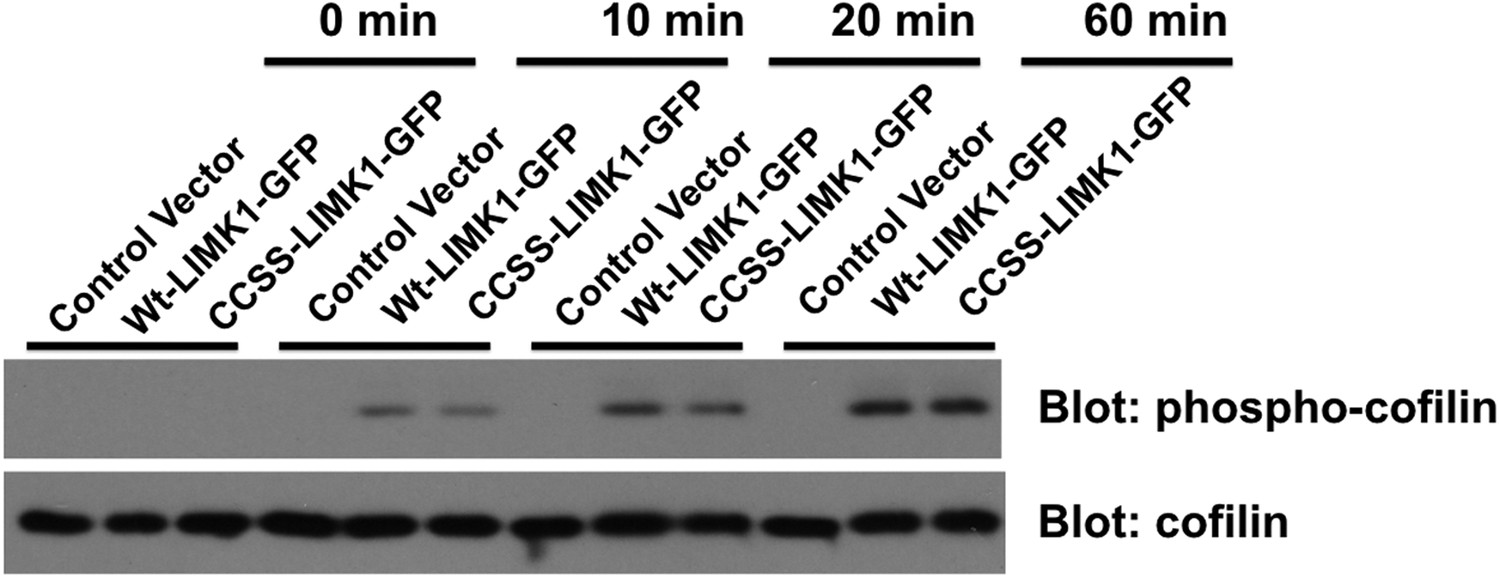
CCSS mutation does not affect phosphorylation of cofilin by LIMK1.
Wt-LIMK1-GFP and CCSS-LIMK1-GFP were purified from transfected HEK293T cells and phosphorylated in vitro by PAK3 as in Figure 7A, then assayed for their ability to phosphorylate recombinant cofilin. Both wt- and CCSS-LIMK1 phosphorylate cofilin to a very similar extent.
Figure 8
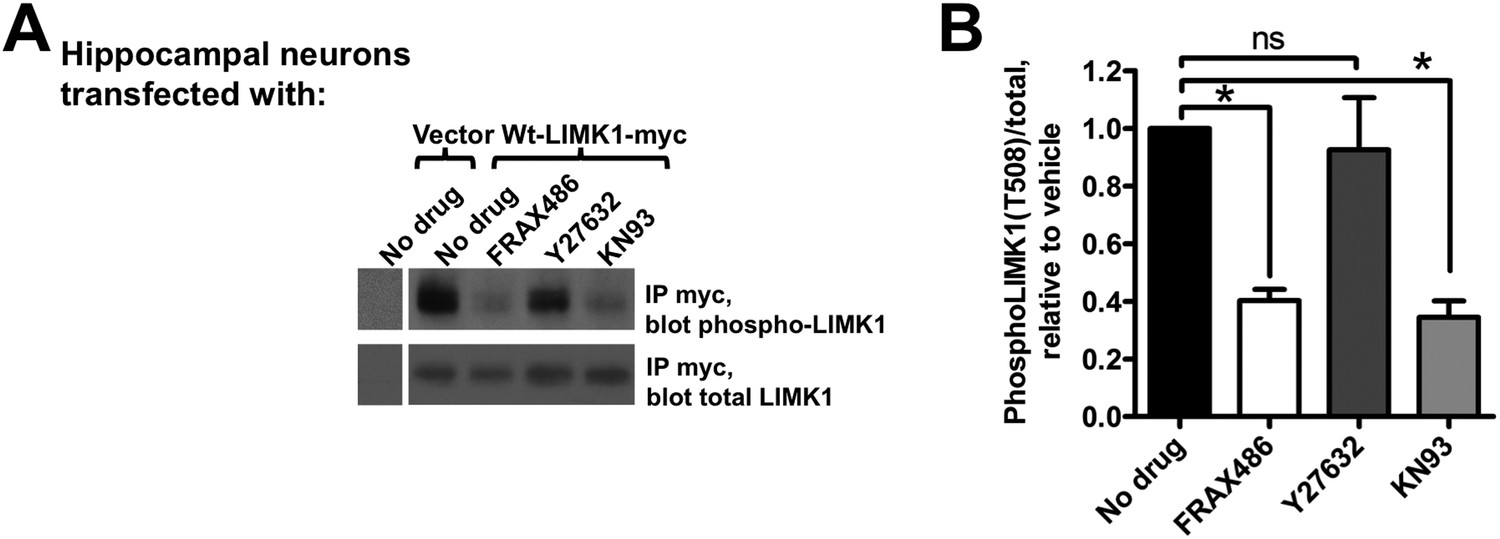
Activation of palmitoyl-LIMK1 in neurons requires CaMKII and PAK, but not ROCK.
(A) Hippocampal neurons transfected with the indicated cDNAs were left untreated, or were incubated for 1 hr with PAK inhibitor FRAX 486 (5 μM), ROCK inhibitor Y27632 (10 μM), or CaMKII inhibitor KN93 (10 μM) prior to lysis. Myc immunoprecip-itates were blotted with the indicated antibodies. (B) Quantified data of multiple determinations from A confirms that LIMK1 phosphorylation in neurons is PAK- and CaMKII-dependent, but not ROCK-dependent. (*p < 0.05 compared to control (no drug), ns: not significant. ANOVA with Dunnett's post hoc correction. n = 5–7 determinations per condition).
Figure 9
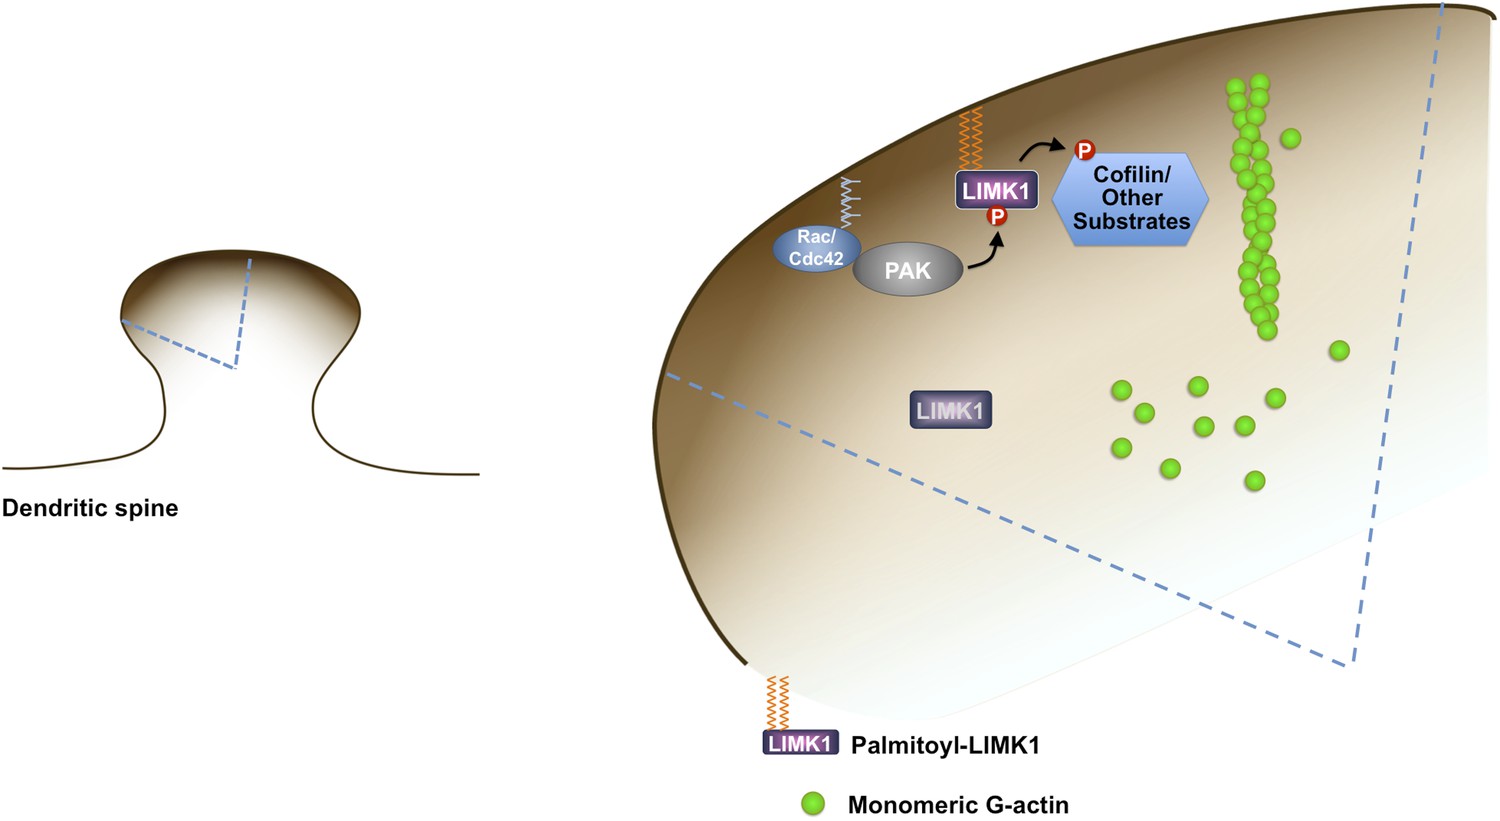
Model of palmitoyl-LIMK1-dependent control of actin dynamics in dendritic spines.
Dendritic spine schematic (left panel) with the indicated region expanded (blue boundary) to the right. Palmitoylation targets LIMK1 to the spine membrane, where it is phosphorylated by membrane-bound activators such as Rac/Cdc42/PAK. In contrast, any non-palmitoylated LIMK1 in the spine ‘core’ remains inactive. By governing both LIMK1 localization and activation, palmitoylation may also facilitate local, juxtamembrane-specific phosphorylation of cofilin and/or other LIMK1 substrates to enhance the spatial control of actin filament turnover in spines. For clarity, other actin regulatory processes such as filament capping and branching are not shown.
Download links
A two-part list of links to download the article, or parts of the article, in various formats.
Downloads (link to download the article as PDF)
Open citations (links to open the citations from this article in various online reference manager services)
Cite this article (links to download the citations from this article in formats compatible with various reference manager tools)
Palmitoylation of LIM Kinase-1 ensures spine-specific actin polymerization and morphological plasticity
eLife 4:e06327.
https://doi.org/10.7554/eLife.06327


