Mitochondrial Ca2+ and membrane potential, an alternative pathway for Interleukin 6 to regulate CD4 cell effector function
- University of Vermont, United States
- Trudeau Institute, United States
- Temple University, United States
Figures
Figure 1
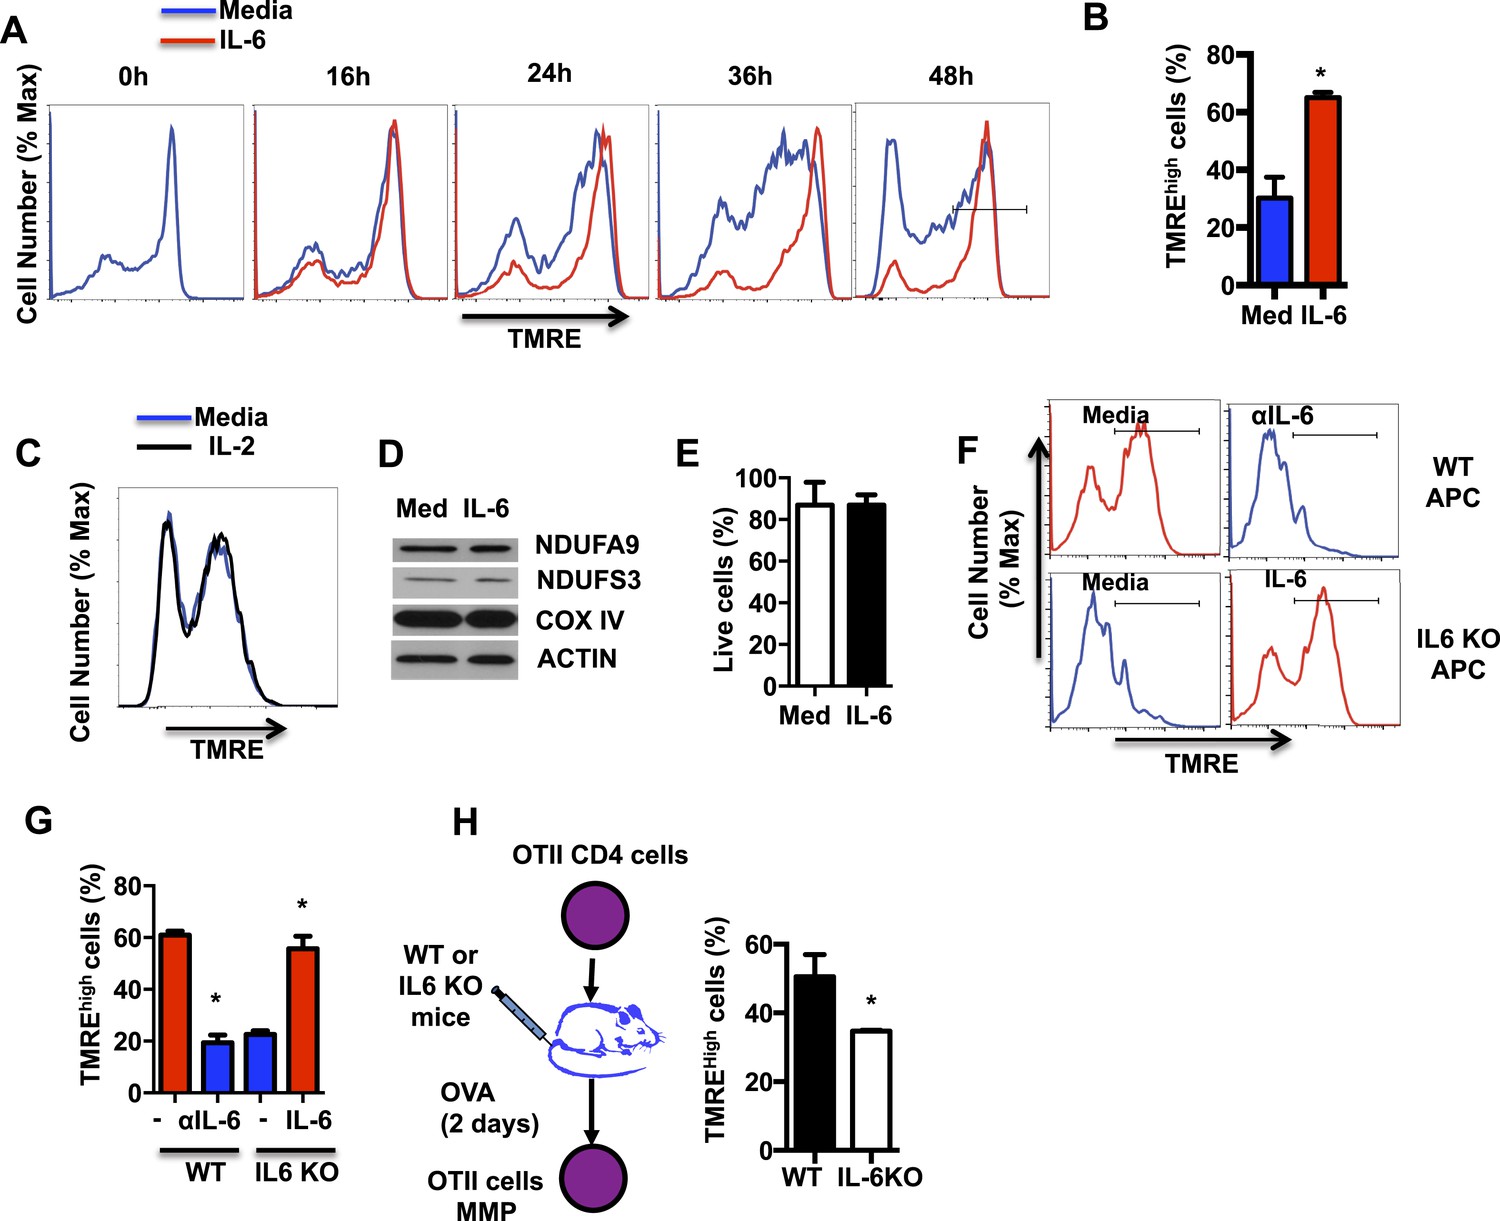
IL-6 sustains high mitochondrial membrane potential (MMP) late during activation.
(A) MMP during activation of CD4 cells with anti-CD3/CD28 Abs over time in the presence or absence of IL-6, as determined by staining with TMRE and flow cytometry analysis. (B) Percentage of CD4 cells with TMREhigh (defined by the gate displayed in (A) at 48 hr, after activation as in (A) (n = 3). (C) MMP during activation of CD4 cells in the absence or presence of IL-2 was determined by staining with TMRE and flow cytometry analysis. (D) Expression of NDUFA9, NDUFS3, COX IV and ACTIN examined by Western blot analysis using whole-cell extracts from CD4 cells activated for 48 hr. (E) Percentage of live CD4 cells activated as in (A) for 48 hr, determined by flow cytometry. (n = 3). (F) MMP in OT-II CD4 cells activated by WT or IL-6 KO APCs with OVA peptide in the presence or absence of the supplement of exogenous of IL-6 (IL-6) or blocking anti-IL-6 antibody (αIL-6) for 48 hr. (n = 3). (G) Percentage of TMREhigh population in OT-II CD4 cells from (F) (n = 3). (H) OT-II CD4 cells were adoptively transferred to WT or IL-6 KO recipient mice that were then immunized with ovalbumin (and Alum). After 2 days, cells were harvested to examine for MMP. Percentage of TMREhigh population in activated OT-II T cells from WT or IL-6 KO mice were determined by TMRE staining and flow cytometry analysis. Error bars represent the mean ± SD. *denotes p < 0.05, as determined by Student's t test. Results are representative of 2–3 experiments.
Figure 2 with 1 supplement

IL-6 facilitates the formation of respiratory chain supercomplexes in CD4 cells during activation.
(A) Transmission electron microscopy analysis of mitochondria in CD4 cells activated in the presence or absence of IL-6. Original magnification, 6,000×. Bars represent 500 nm; Blue arrows indicate mitochondria (B) Representative image of an ‘expanded cristae’ mitochondrion (Left). Number of mitochondria with expanded cristae in CD4 cells activated in the presence or absence of IL-6 (right). (n = 25). (C) Representative image of a ‘tight cristae’ mitochondrion (Left). Number of mitochondria with tight cristae in CD4 cells activated in the presence or absence of IL-6 (right). (n = 23). Error bars represent the mean ± SD. *denotes p < 0.05, as determined by Student's t test. Results are representative of 2 experiments. (D) Digitonin-soluble mitochondrial extracts from CD4 cells were resolved by BN-PAGE and transferred onto a membrane (Western blot) and immunoblotted for NDUFA9 and Core1 protein. Immunoreactivity for the two proteins within the supercomplex (SC) region is shown. Immunoreactivity for NDUFA9 with monomeric complex I (Com I) and Core1 with dimeric complex III (Com III) are shown. Lower panels display the densitometry of NDUFA9 (left) and Core I (right) subunits within the supercomplex region (SC) and densitometry at the individual Complex I (Com I) and Complex III (Com III) respectively. (E) Mitochondrial ROS during activation of CD4 cells with anti-CD3/28 Abs in the presence or absence of IL-6 for 48 hr was determined by staining with MitoSox and flow cytometry analysis. (F) Percentage of CD4 cells with mROShigh, defined by the gate displayed in (E) at 48 hr, after activation as in (E) (n = 4). Error bars represent the mean ± SD. *denotes p < 0.05, as determined by Student's t-test. Results are representative of 2 experiments.
Figure 2—figure supplement 1
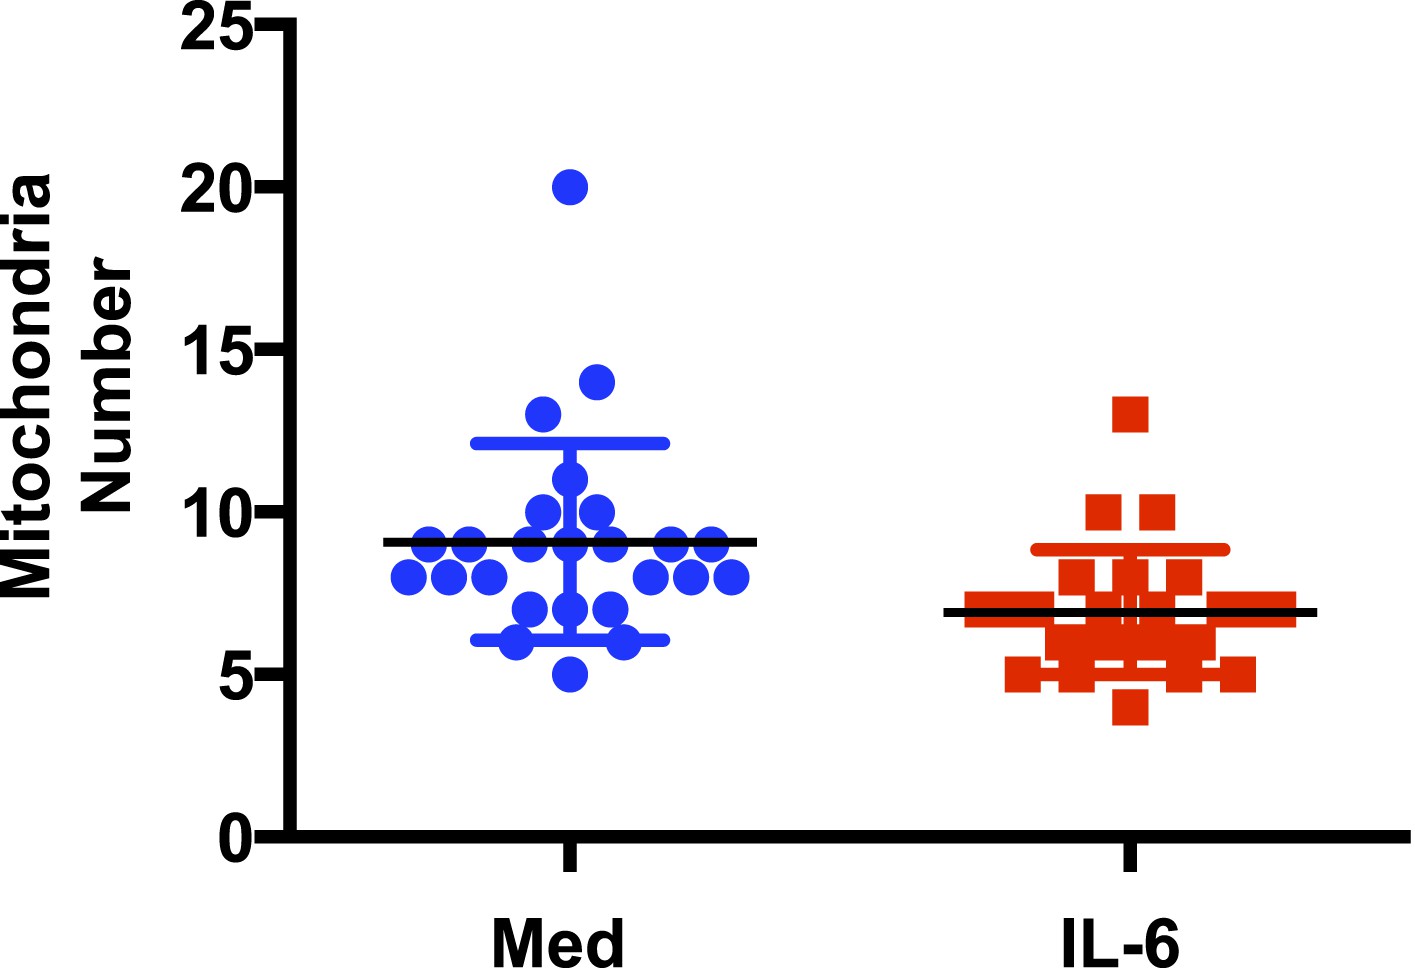
IL-6 does not increase the number of mitochondria in CD4 cells during activation.
Number of mitochondria in CD4 cells activated in the presence or absence of IL-6 was analyzed by TEM. (n = 25). p > 0.5, as determined by Student's t test.
Figure 3
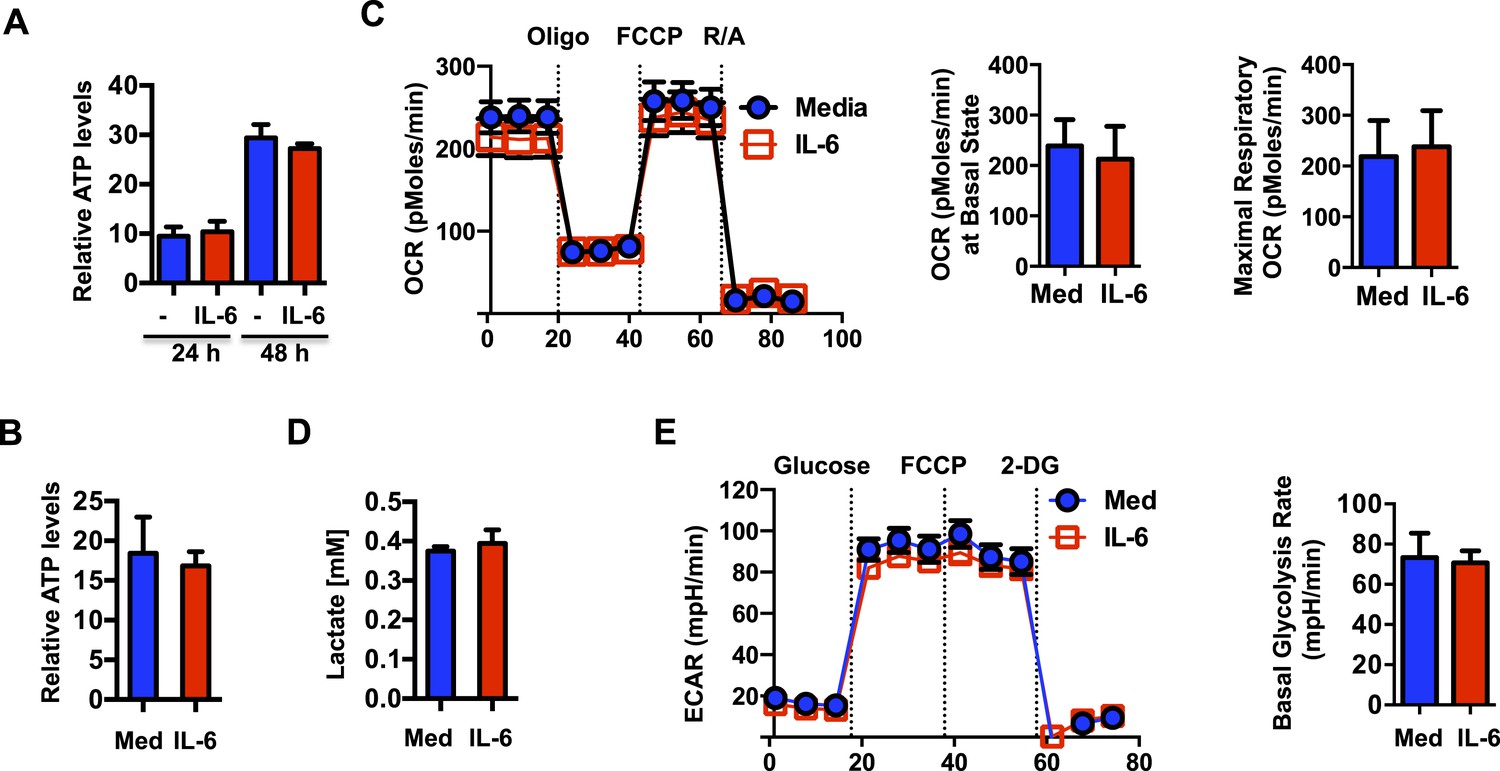
IL-6-mediated increase in mitochondrial membrane potential in CD4 cells is uncoupled from OXPHOS.
(A) Intracellular ATP levels (per 104 cells) in CD4 cells activated in the presence (IL-6) of absence of IL-6 (Med) (n = 5). (B) Extracellular ATP levels in supernatants of CD4 cells activated for 48 hr (n = 3). (C) Oxygen consumption rates in CD4 cells activated with or without IL-6 for 48 hr, under basal conditions and in response to oligomycin (oligo), FCCP or rotenone plus antimycin (R/A). Average of basal level OCR (n = 3) and the average of maximal OCR (n = 3) are shown. (D) Lactate levels in supernatant of CD4 cells activated for 48 hr (n = 3). (E) Extracellular acidification rates (ECAR) were measured in activated CD4 cells (48 hr) under basal conditions or in response to glucose, FCCP or 2-deoxyglucose (2-DG) sequentially. Average of basal ECAR levels are graphed on the right (n = 3). Error bars represent mean ± SD. No statistically significant differences (p > 0.05) were found for any of the assays, as determined by Student's t-test or two-way ANOVA. Results are representative of 2–3 experiments.
Figure 4 with 1 supplement

IL-6-mediated high MMP results in elevated mitochondrial Ca2+ levels.
(A) Mitochondrial Ca2+ in CD4 cells activated in absence or presence of IL-6 for 48 hr was determined by staining with Rhod-2 AM and flow cytometry analysis. (B) Rhod-2 staining in CD4 cells activated with IL-6 for 46 hr followed by incubation with CCCP or vehicle (Veh) for 2 hr. (C) Percentage of Rhod-2high population in CD4 cells activated as in (A). Gates are shown in (A) and (B) (n = 4). (D) CD4 cells were activated for 48 hr with or without IL-6 and treated for the last 4 hr with vehicle, rotenone plus antimycin (R/A) or CGP-37157 (CGP). Cytoplasmic Ca2+ was measured using Fura-2 AM staining. Fluorometric ratio at 340 nm/380 nm (F340/380) is shown. (n = 3). Error bars represent the mean ± SD. *denotes p < 0.05, as determined by Student's t test and one-way or two-way ANOVA test. Results are representative of 2–3 experiments.
Figure 4—figure supplement 1
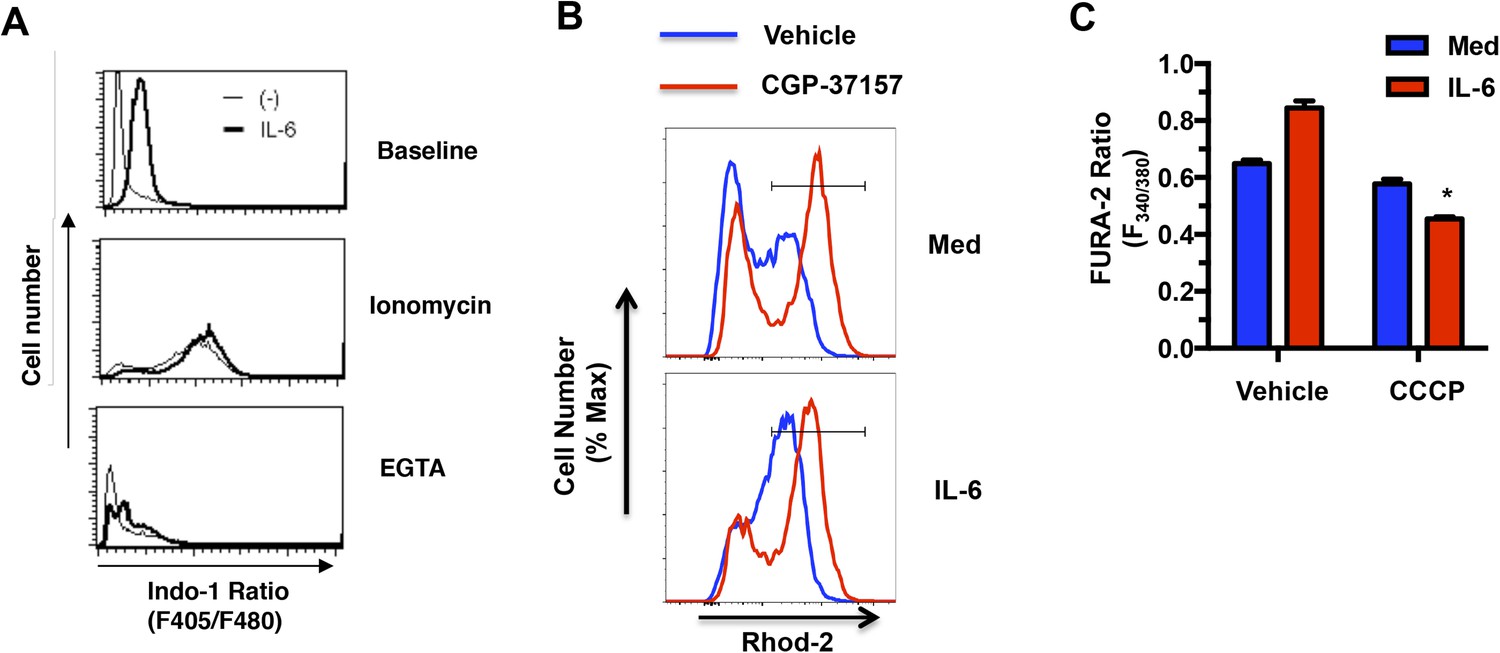
IL-6 maintains elevated cytosolic Ca2+ through its effect on the MMP and mitochondrial Ca2+.
(A) Cytosolic calcium of CD4 cells activated with anti-CD3/CD28 Abs for 48hr in the absence or presence of IL-6, as determined by staining with Indo-1. The ratio of Ca2+-bound Indo-1 fluorescence (405 nm) to unbound indo-1 fluorescence (480 nm) was then determined by flow cytometry analysis. Ionomycin (500 ng/mL) and EGTA (50 mM) were used as positive and negative control for indo-1 measurements. (B) Mitochondrial Ca2+ determined by Rhod-2 AM staining and flow cytometry analysis in CD4 cells activated in absence or presence of IL-6 for 42 hr followed by treatment with CGP-37157 (50 μM) or vehicle for 6 hr. (C) Cytoplasmic Ca2+ determined by Fura-2 AM staining in CD4 cells activated in the presence or absence of IL-6 for 44 hr followed by IL-6 treatment with CCCP (2 μM) or vehicle for 4 hr. Fluorometric ratio at 340 nm/380 nm (F340/380) is shown. n = 3, *denotes p < 0.05 as determined by student's t test. Results are representative of 2–3 experiments.
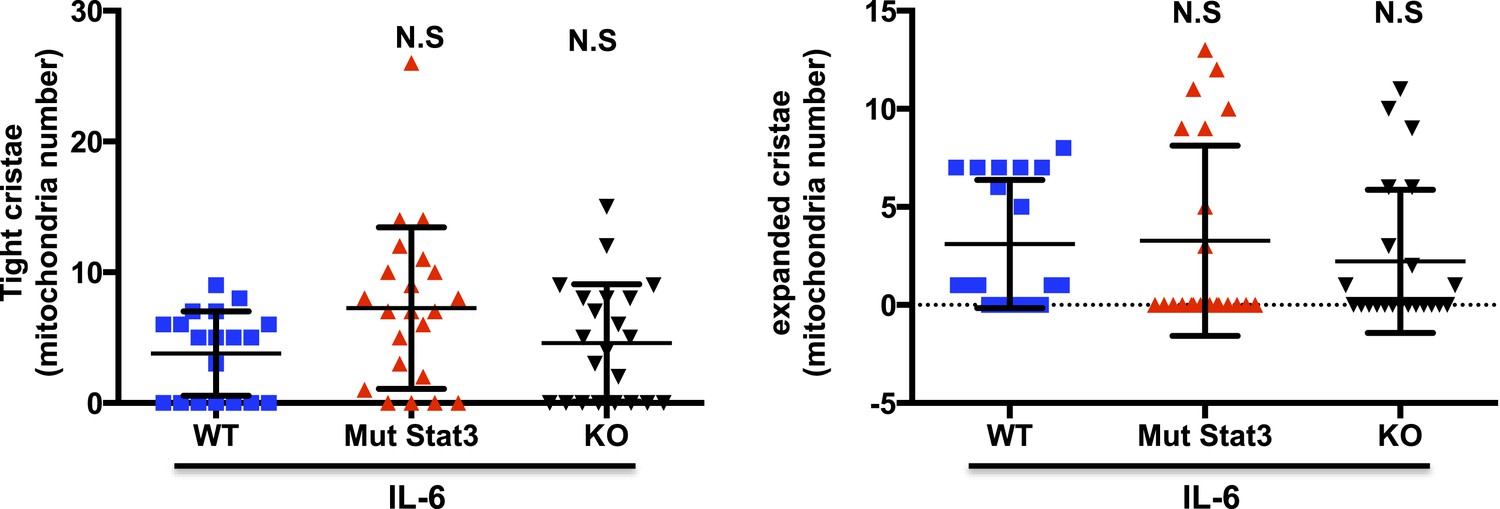
Figure 5 with 2 supplements
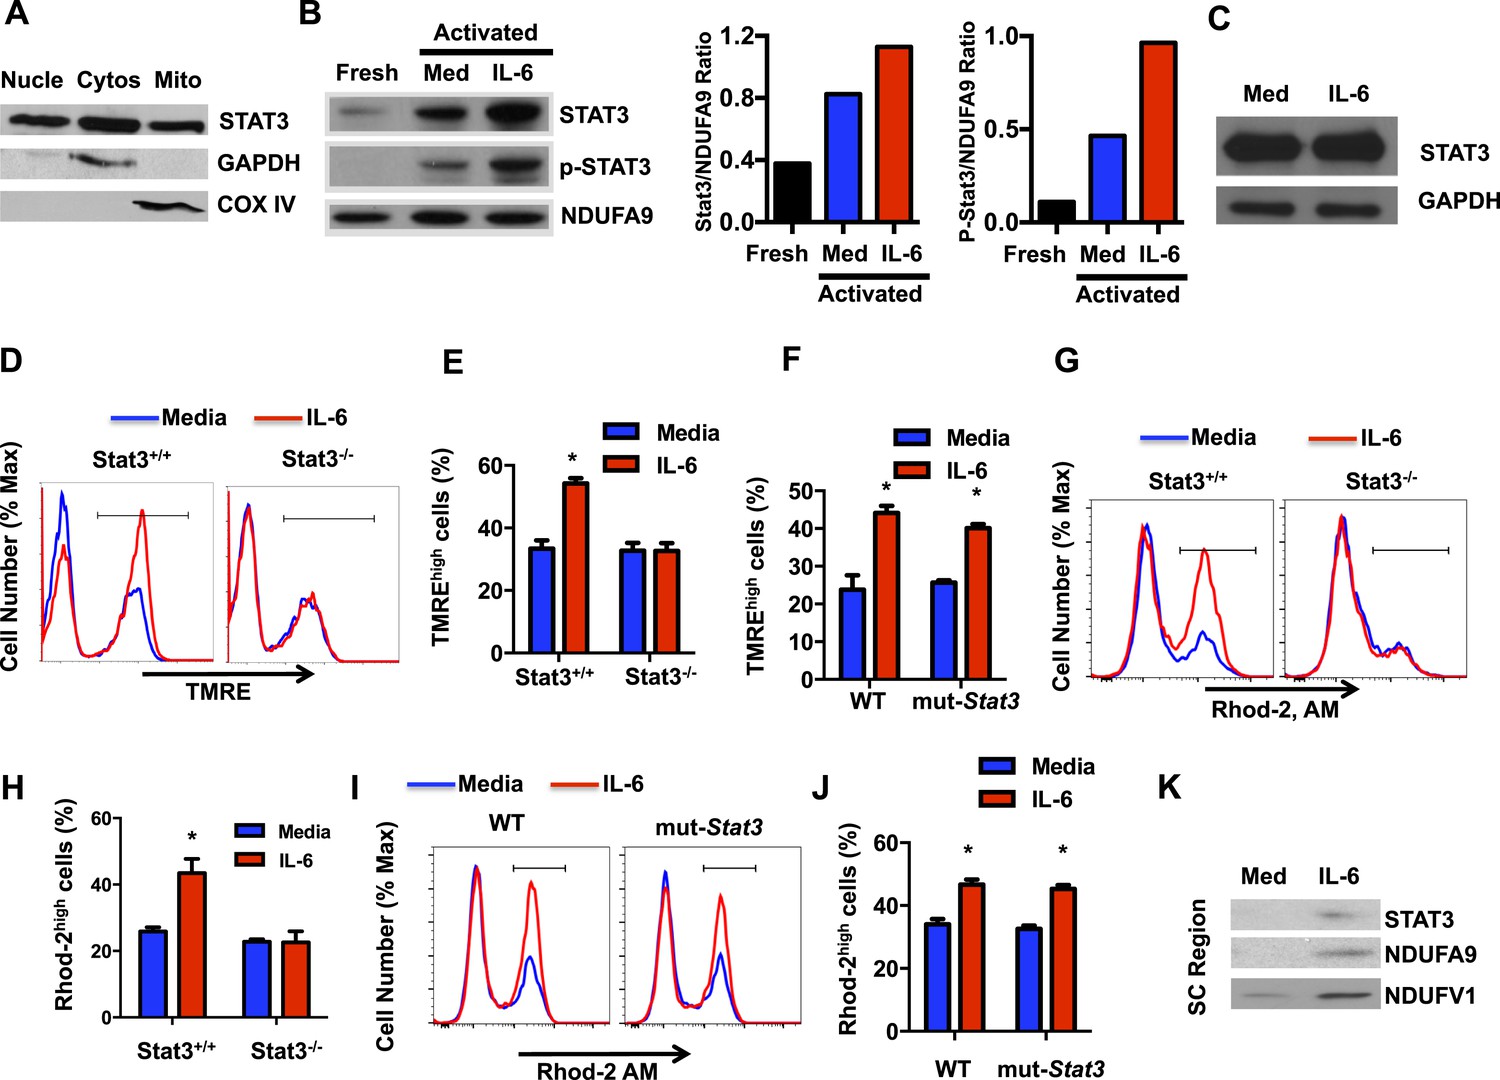
The regulation of the MMP and mitochondrial Ca2+ elicited by IL-6 is Stat3 dependent.
(A) CD4 cells were activated with anti-CD3 and anti-CD28 mAbs. After 48 hr, cytosolic, nuclear and mitochondrial fractions were prepared and used to examine Stat3 by Western blot analysis. GAPDH and COX IV were used as markers for cytosol and mitochondria, respectively. (B) Mitochondrial fractions from freshly isolated CD4 cells, and CD4 cells activated (48 hr) with (IL-6) or without IL-6 (Media) were analyzed for Stat3, phospho-Stat3 (p-Stat3) and the Complex I subunit NDUFA9, as mitochondrial loading control. Relative densitometry ratios of p-Stat3 to NDUFA9 and total Stat3 to NDUFA9 in cells activated in the presence and absence of IL-6 are shown. (C) Total Stat3 levels in CD4 cells activated (48 hr) with or without IL-6 were examined by Western blot analysis using whole cell extracts. GAPDH was used as loading control. (D) MMP in Stat3+/+ or Stat3−/− CD4 cells activated with anti-CD3/28 Abs in the presence or absence of IL-6 for 48 hr (n = 3). (E) Percentage of TMREhigh population in Stat3+/+ or Stat3−/− CD4 cells activated from (D) (n = 3). (F) Percentage of TMREhigh population in WT or mut-Stat3 CD4 cells activated from (n = 3). (G) Mitochondrial Ca2+ (Rhod-2 AM staining) in Stat3+/+ or Stat3−/− CD4 cells activated as in (D). (H) Percentage of Rhod-2high population (gate shown in panel G) in Stat3+/+ or Stat3−/− CD4 cells (n = 3). (I) Mitochondrial Ca2+ (Rhod-2 AM staining) in WT or mut-Stat3 CD4 cells activated as in (D). (J) Percentage of Rhod-2high population (gate shown in panel I) in WT or mut-Stat3 CD4 cells activated as in (D) (n = 3). (K) Mitochondrial fractions of CD4 cells activated (48 hr) with or without IL-6 were resolved by BN-PAGE. Supercomplexes regions (SC region) of BN-PAGE were excised and analyzed for Stat3, NDUFA9 and NDUFV1 by Western blot analysis. Error bars represent the mean ± SD. *denotes p < 0.05, as determined by Student's t test and one-way or two-way ANOVA test. Results are representative of 2–3 experiments.
Figure 5—figure supplement 1
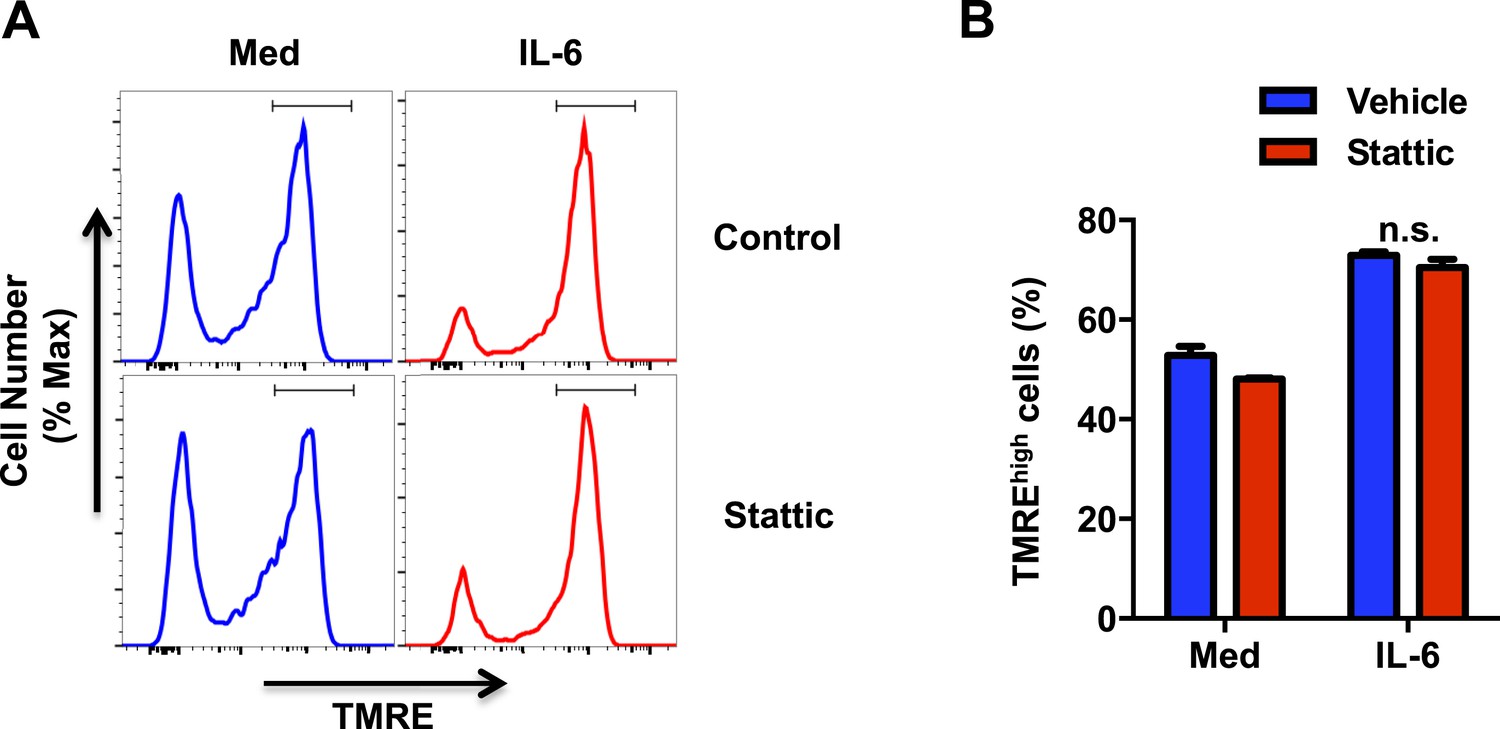
Stat3 transcription activity is not required for IL-6 to sustain the MMP.
(A and B) Mitochondrial membrane potential determined by TMRE staining and flow cytometry analysis in CD4 cells activated in absence or presence of IL-6 for 42 hr were treated with Stattic (10 μM) or vehicle for 6 hr. (A) Representative profiles and (B) percentage of CD4 cells with TMREhigh (defined by the gate displayed in (A)). n = 3, denote p < 0.05 as significant, Defined n.s. as ‘not significant’ determined by two-way ANOVA. Results are representative of 3 experiments.
Figure 5—figure supplement 2
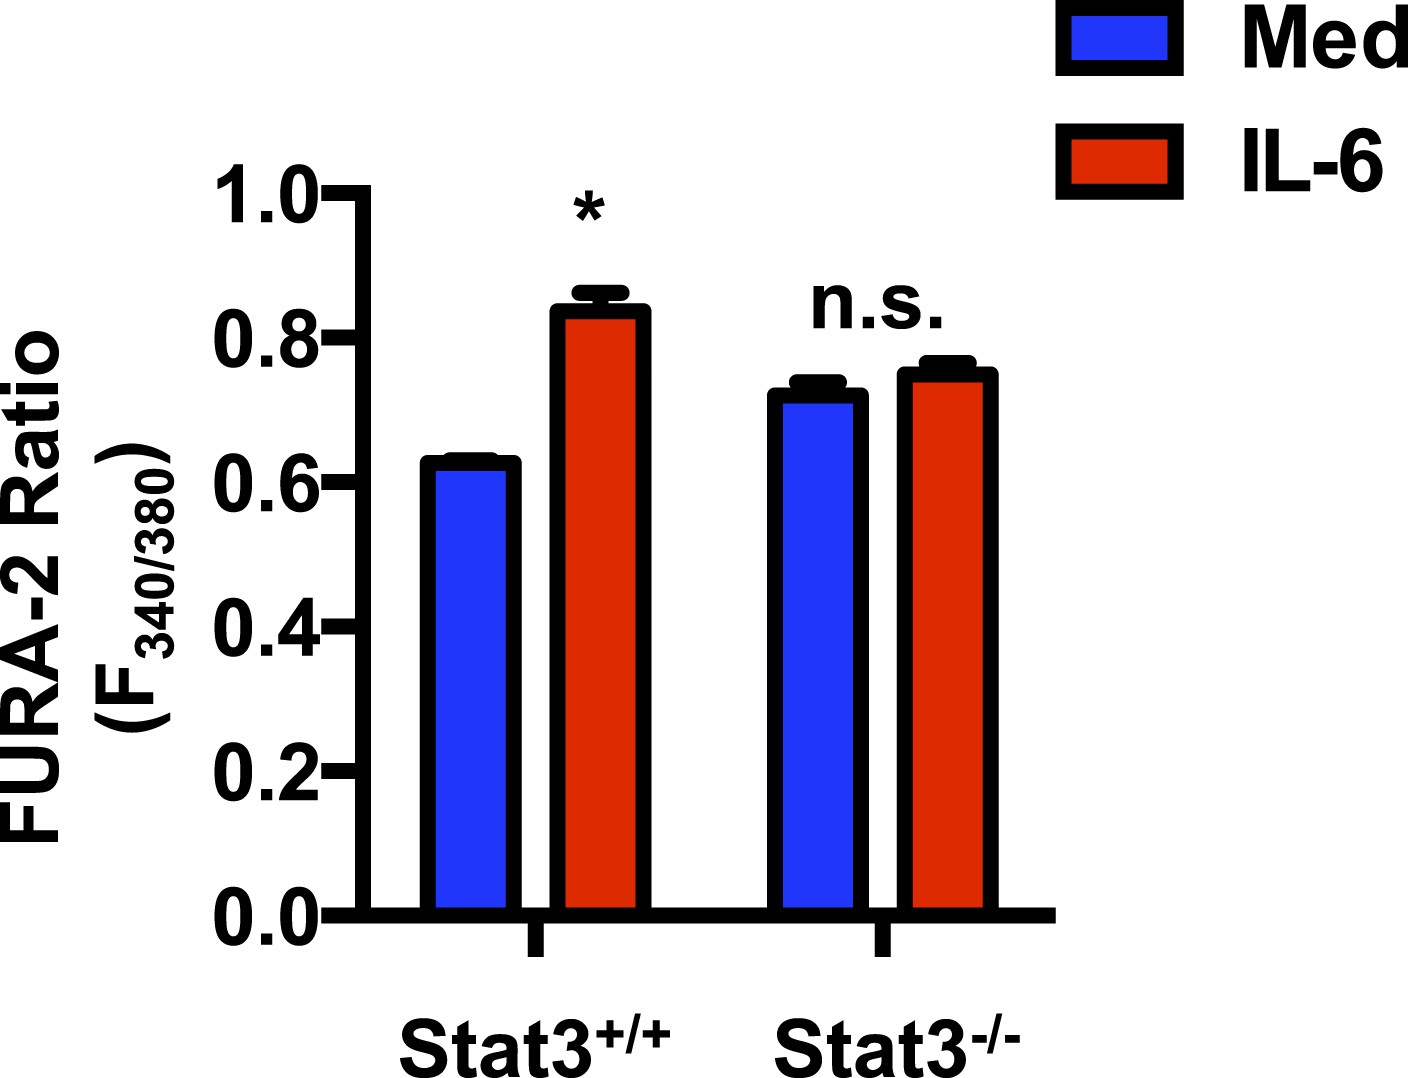
Stat3 contributes to elevated cytosolic Ca2+ elicited by IL-6.
Cytoplasmic Ca2+ determined by Fura-2 AM staining in CD4 cells from Stat3+/+ or Stat3−/− mice activated (48 hr) in the presence or absence of IL-6. Fluorometric ratio at 340 nm/380 nm (F340/380) is shown. n = 3, *denotes p < 0.05, n.s. denotes ‘not significant’ based on two-way ANOVA test. Results are representative of 2 experiments.
Figure 6 with 3 supplements
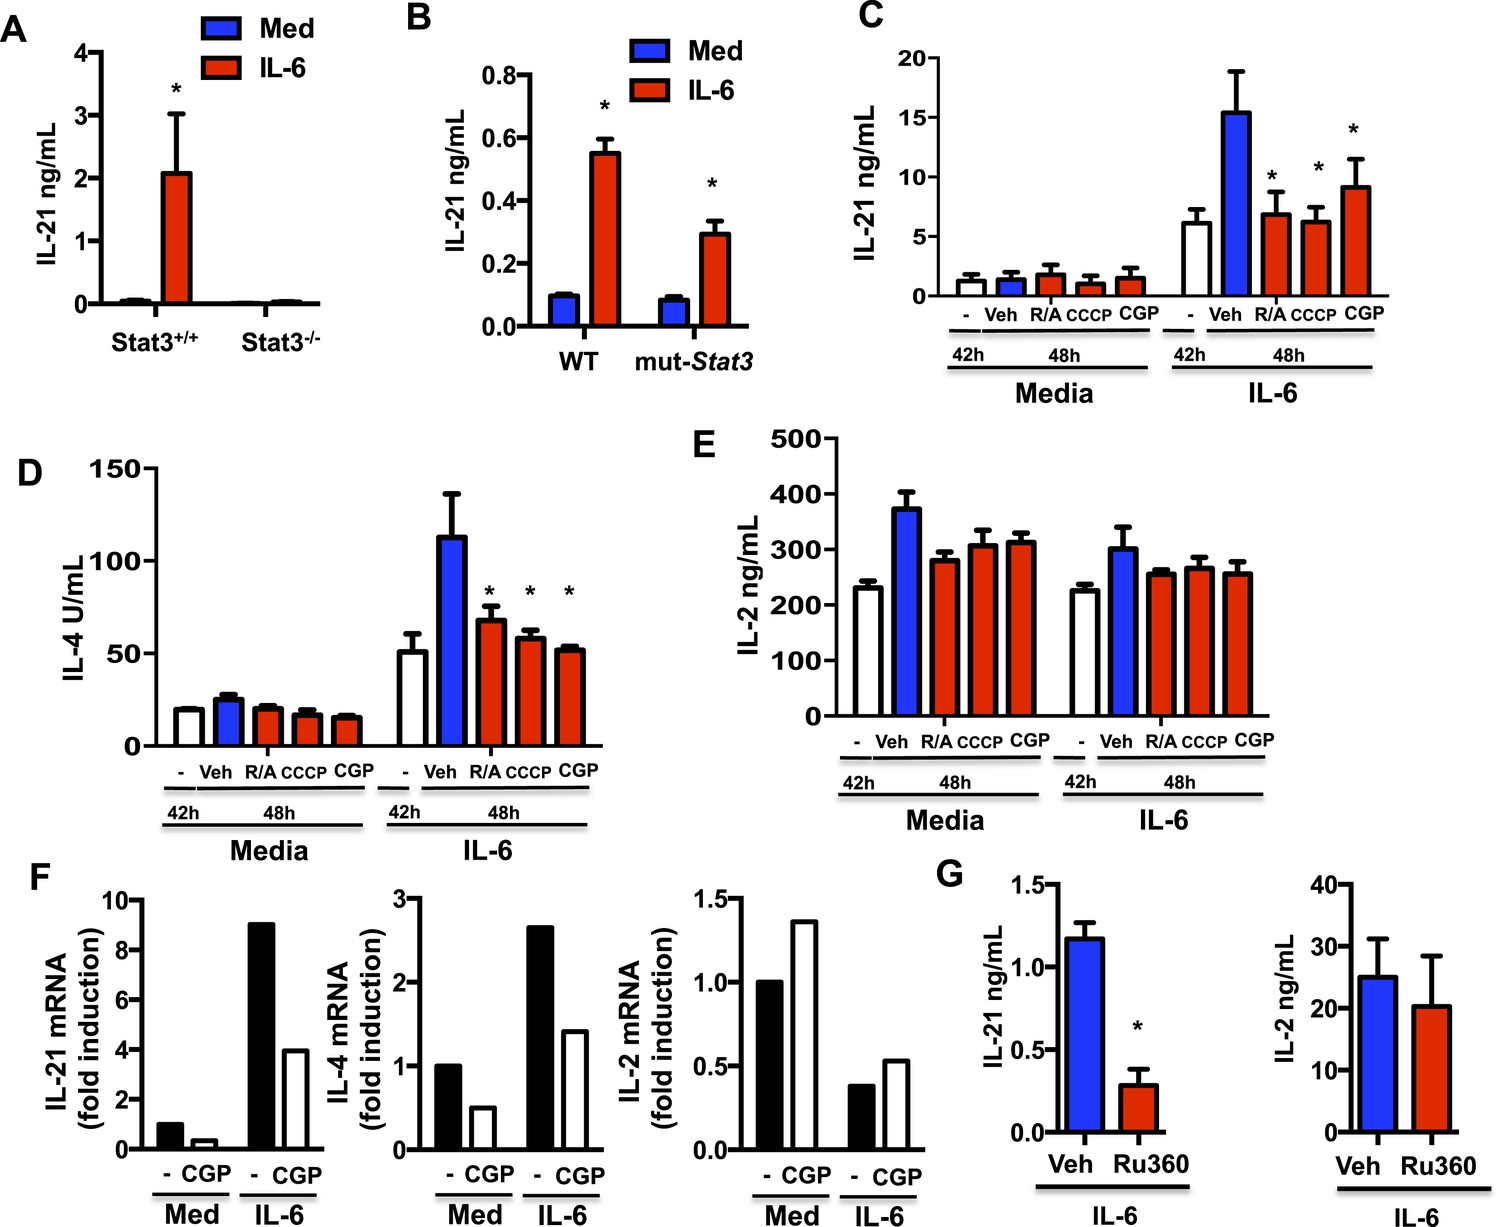
Mitochondrial Ca2+ is essential for IL-6 to sustain the production of IL-21 and IL-4 late during activation of CD4 cells.
(A) CD4 cells from Stat3+/+ or Stat3−/− mice were activated in the presence or absence of IL-6 for 48 hr. IL-21 production was measured by ELISA. (B) IL-21 production from WT or mut-Stat3 CD4 cells with or without IL-6 during activation was measured as in (A) CD4 cells were activated in the presence or absence of IL-6. After 42 hr, rotenone/antimycin (R/A), CCCP, GCP-37157 or vehicle were added to the cultures. Supernatants were collected 6 hr later. IL-21 (C), IL-4 (D), IL-2 (E) production was measured by ELISA. (F) Relative mRNA levels for IL-21, IL-4 and IL-2 in activated in CD4 cells (48 hr) were measured by real-time PCR (RT-PCR). (G) CD4 cells were activated in the presence of IL-6. After 24 hr, Ru360 or vehicle control (Veh) were added to the cultures. Supernatants were collected 24 hr later. IL-21 and IL-2 production was measured by ELISA. Error bars represent the mean ± SD. *denotes p < 0.05, as determined by two-way ANOVA test. Results are representative of 2–3 experiments.
Figure 6—figure supplement 1
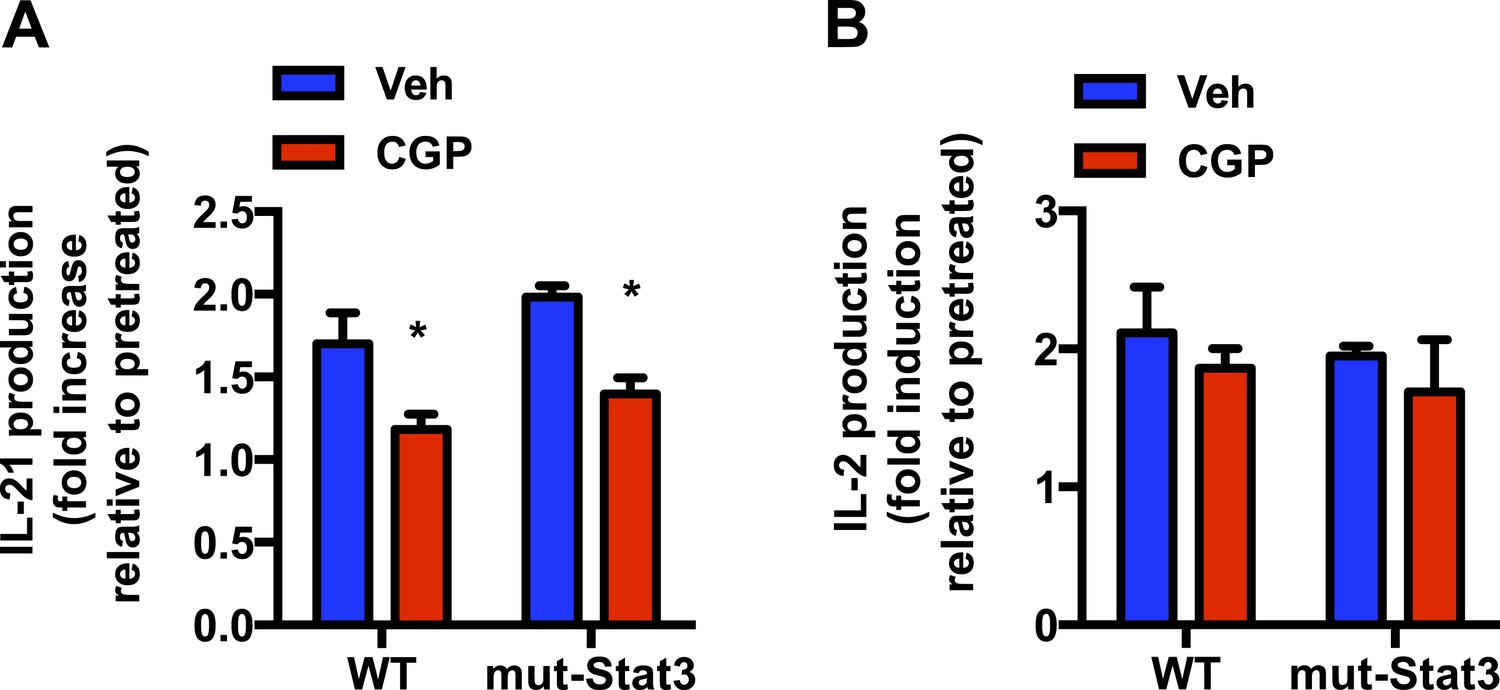
A transcriptionally inactive Stat3 is sufficient for IL-6 to promote IL-21 production through mitochondrial Ca2+.
(A and B) CD4 cells from WT and mut-Stat3 mice were activated in the presence of IL-6 for 42 hr, CGP-17157 (CGP) or vehicle (Veh) were added and supernatants were harvested 6 hr later. IL-21 (A) and IL-2 (B) levels in supernatant were measured by ELISA. Cytokine production is shown as fold increase between the levels at 42 hr (prior to treatment) and the level at 48 hr (6 hr after treatment). n = 3, *denotes p < 0.05 as determined by two-way ANOVA.
Figure 6—figure supplement 2
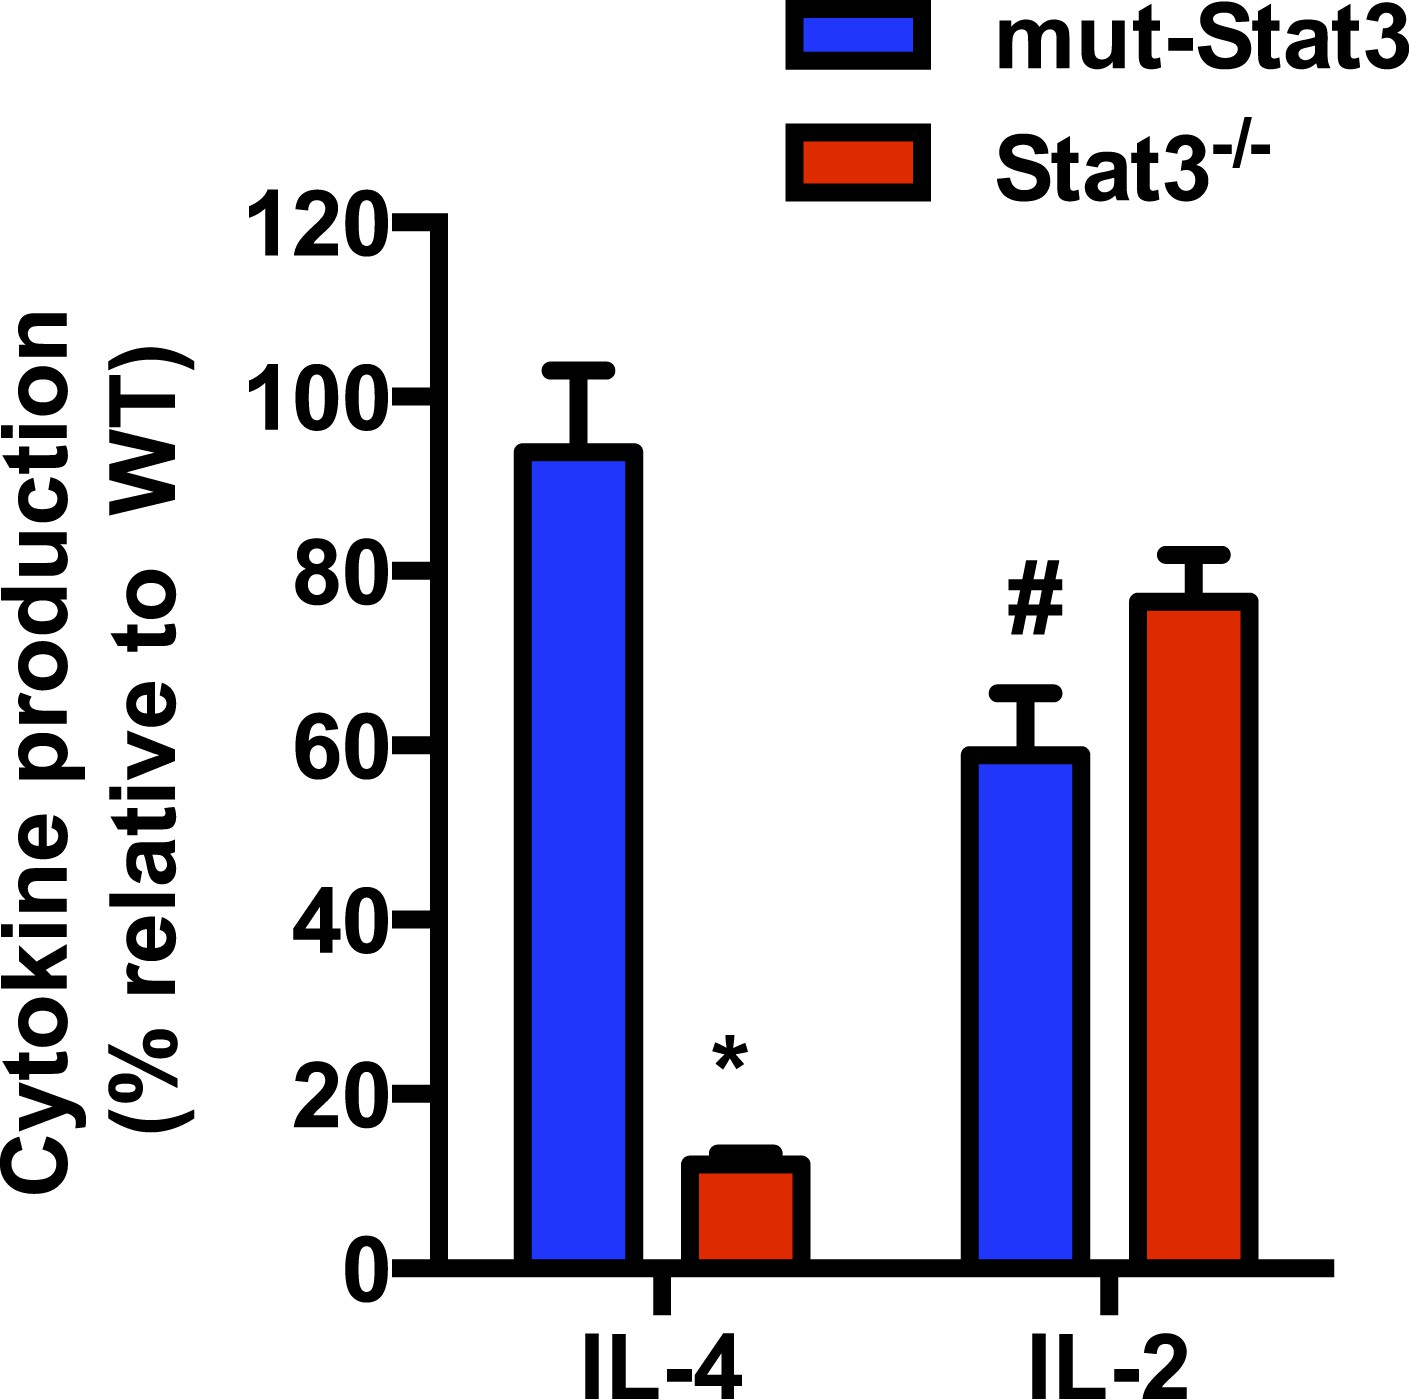
Stat3 contributes to the production of IL-4 in response to IL-6 independently of its function of transcription factor.
CD4 cells from WT, mut-Stat3 and Stat3−/−were activated in the presence of IL-6 for 48 hr. IL-4 and IL-2 production in the supernatant was measured by ELISA. The percentage of IL-4 and IL-2 levels in mut-Stat3 and Stat3−/− CD4 cells relative to the levels in WT CD4 cells are provided. n = 3. *denotes p < 0.05 as determined by student's t-test, showing greater reduction in IL-4 production in Stat3−/− CD4 cells than in mut-Stat3 cells relative to WT cells. #denotes p < 0.05 as determined by student's t-test, showing greater reduction in IL-2 production in mut-Stat3 cells than in Stat3−/− cells relative to WT cells.
Figure 6—figure supplement 3
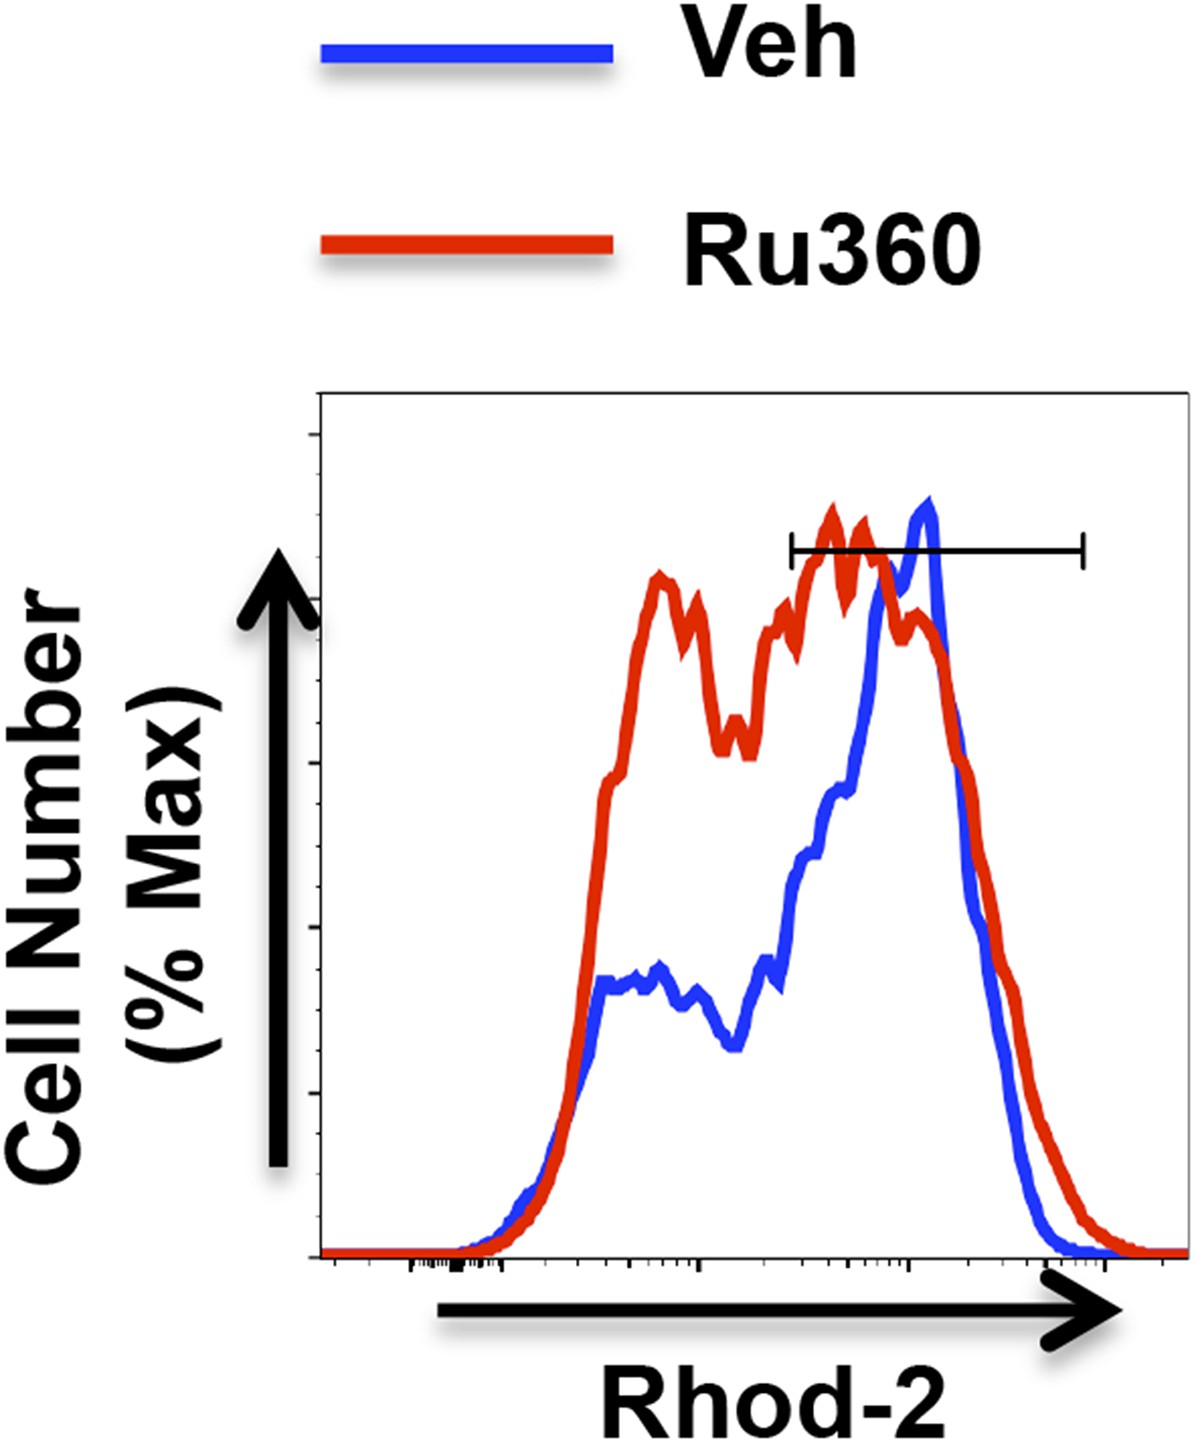
Ru360 decreases mitochondrial Ca2+ in CD4 cells in response to IL-6 during activation.
Mitochondrial Ca2+ determined by Rhod-2 AM staining and flow cytometry analysis in CD4 cells activated with IL-6 and treated with vehicle (Veh) or Ru360 (10 μM) for the last 24 hr.
Figure 7
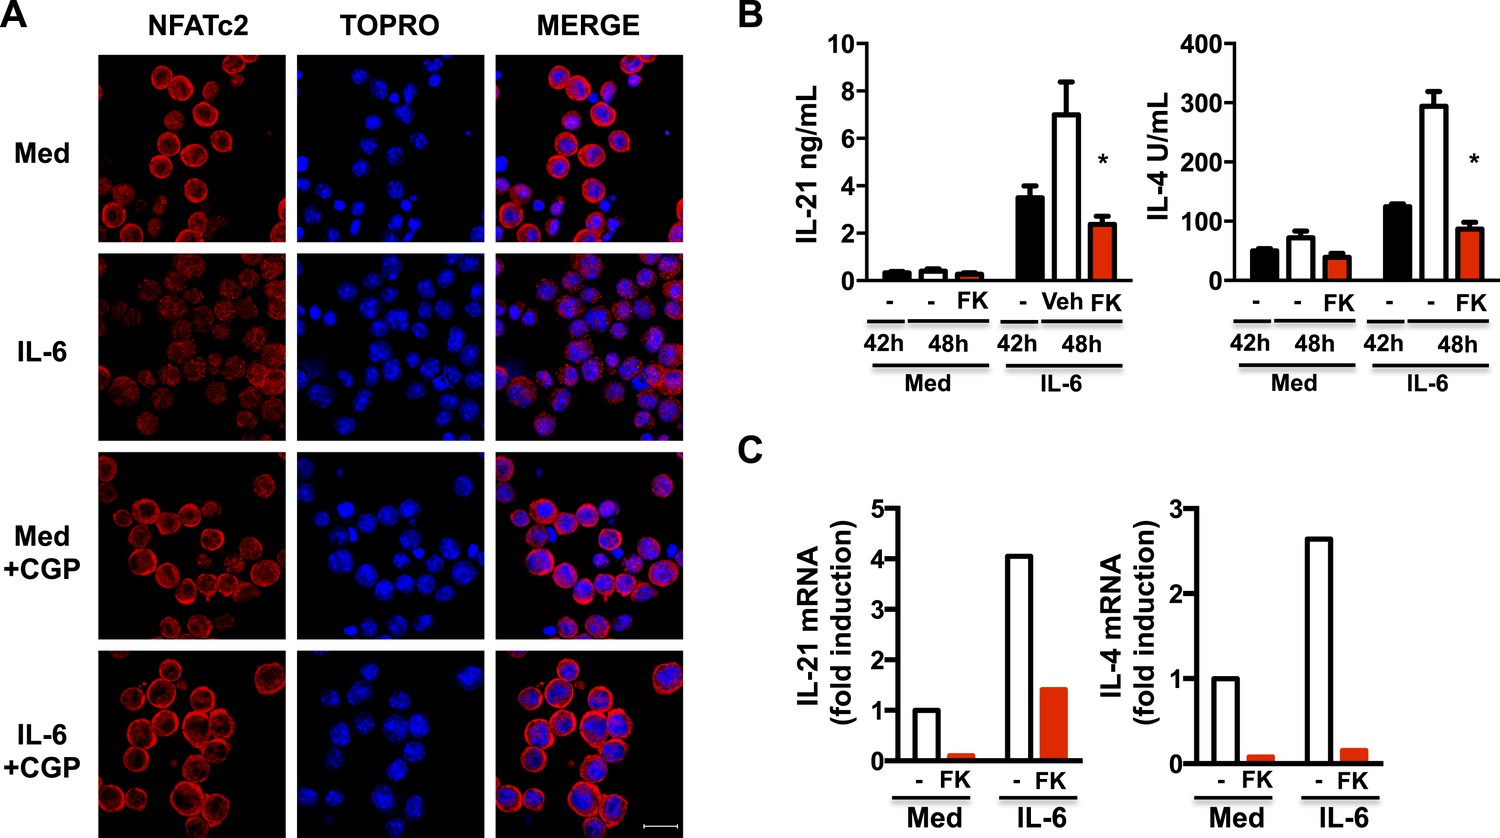
Increased mitochondrial Ca2+ by IL-6 is required to sustain nuclear NFAT accumulation late during activation of CD4 cells.
(A) CD4 cells were activated in the presence or absence of IL-6 for 42 hr followed by 6 hr treatment with medium (Med) or CGP-37157 (CGP). NFATc2 (red) was examined by immunostaining and confocal microscopy. TOPRO was used as nuclear dye. 40× Magnification. Bars represent 20 μm. (B) CD4 cells were activated in the presence or absence of IL-6 for 42 hr. FK506 (FK) was added to culture for another 6 hr. Supernatants were collected, and IL-21 and IL-4 levels were measured by ELISA. (C) Relative mRNA for IL-21 and IL-4 levels in CD4 cells activated as in (B) was measured by RT-PCR. Error bars represent the mean ± SD. *denotes p < 0.05, as determined by two-way ANOVA test. Results are representative of 2–3 experiments.
Author response image 1
Download links
A two-part list of links to download the article, or parts of the article, in various formats.
Downloads (link to download the article as PDF)
Open citations (links to open the citations from this article in various online reference manager services)
Cite this article (links to download the citations from this article in formats compatible with various reference manager tools)
Mitochondrial Ca2+ and membrane potential, an alternative pathway for Interleukin 6 to regulate CD4 cell effector function
eLife 4:e06376.
https://doi.org/10.7554/eLife.06376


