Genome-wide errant targeting by Hairy
- Michigan State University, United States
- Colgate University, United States
- Janelia Research Campus, Howard Hughes Medical Institute, United States
Figures
Figure 1 with 1 supplement
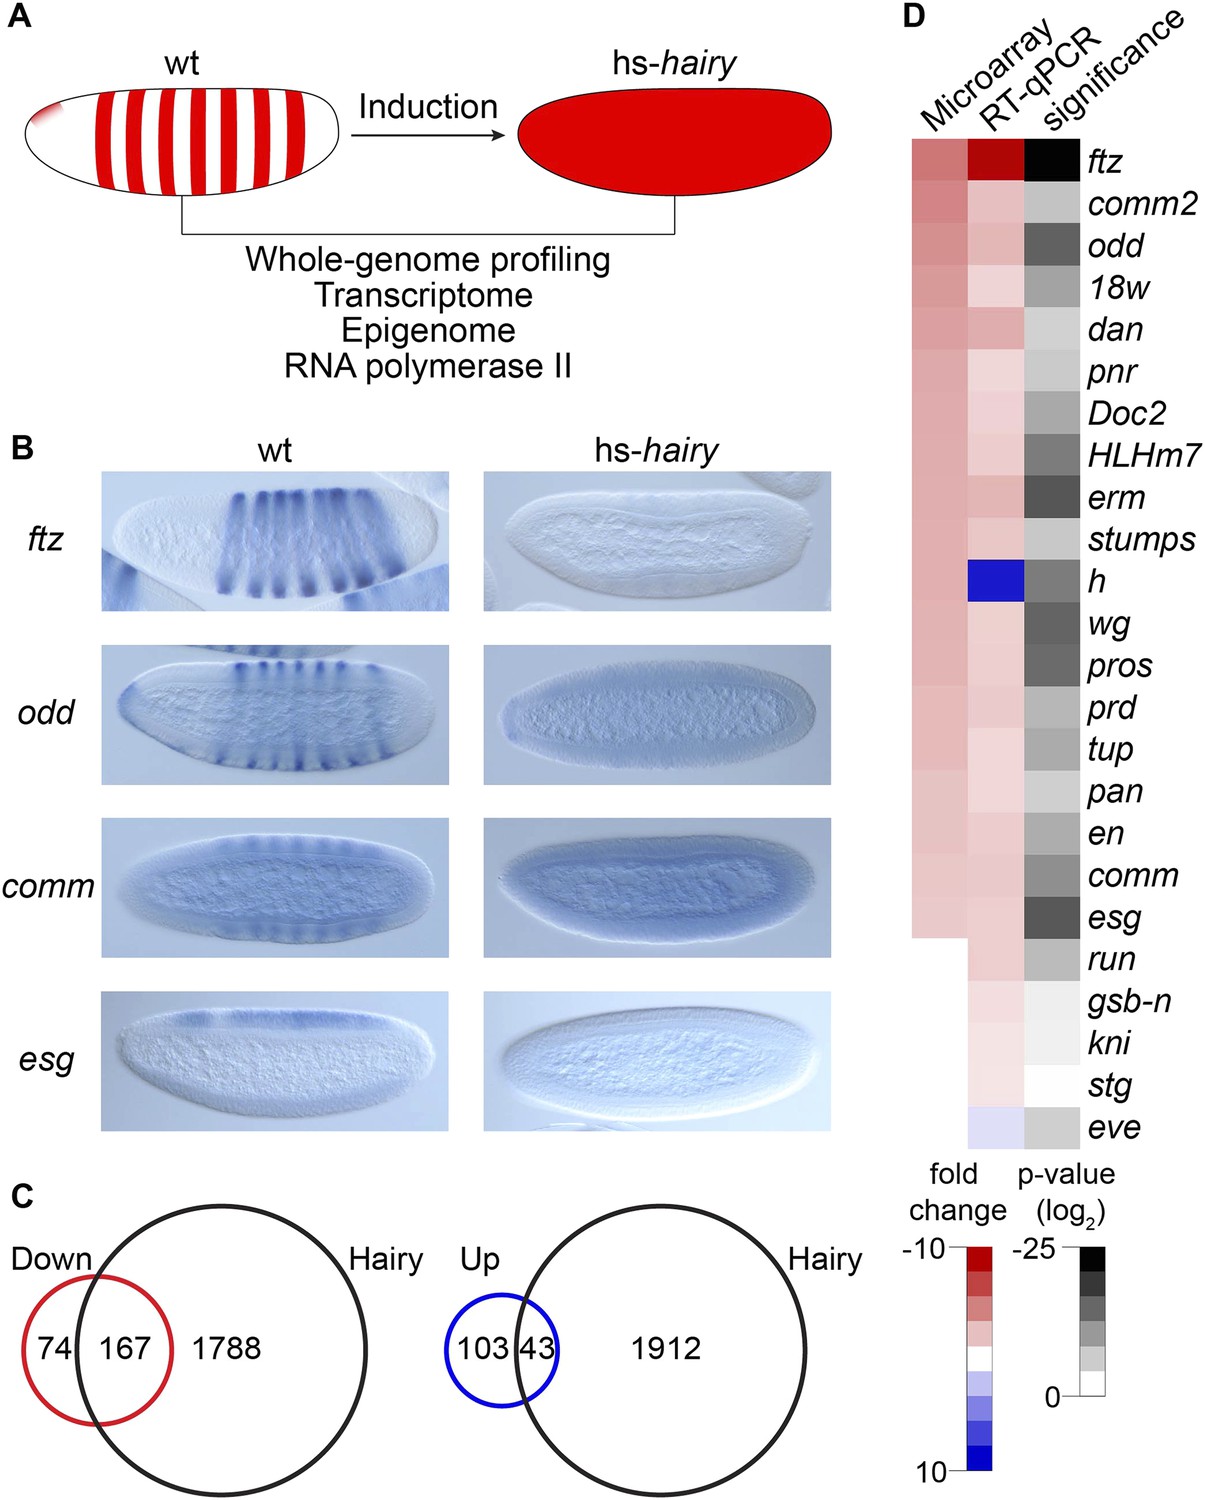
Global analysis of Hairy regulation.
(A) Schematic expression of Drosophila embryo system used for Hairy repression, with outline of the genome-wide analysis of transcription, chromatin, and RNA polymerase II (Pol II). (B) Repression of ftz, odd, comm and esg revealed by in situ hybridization in wild-type (wt) and Hairy transgenic embryos (hs-hairy) after 20 min induction. Similar repression of 18w, HLHm7 and erm was also observed (not shown). (C) Transcriptionally regulated (red, down; blue, up) and Hairy bound genes identified by microarray and ChIP–chip (MacArthur et al., 2009). A larger fraction of down-regulated genes were physical targets of Hairy than for up-regulated genes (significance: p = 3.8e-95 and p = 3.5e-08 respectively, hyper-geometric test). Differentially expressed genes are selected based on p < 0.05 and fold change >2. (D) Validation of microarray data by RT-qPCR, showing concordance between these methods. Genes are ranked by the fold change from the microarray measurements. Significance was tested by Student's t-test. y-axis values were normalized as described in ‘Materials and methods’.
Figure 1—figure supplement 1
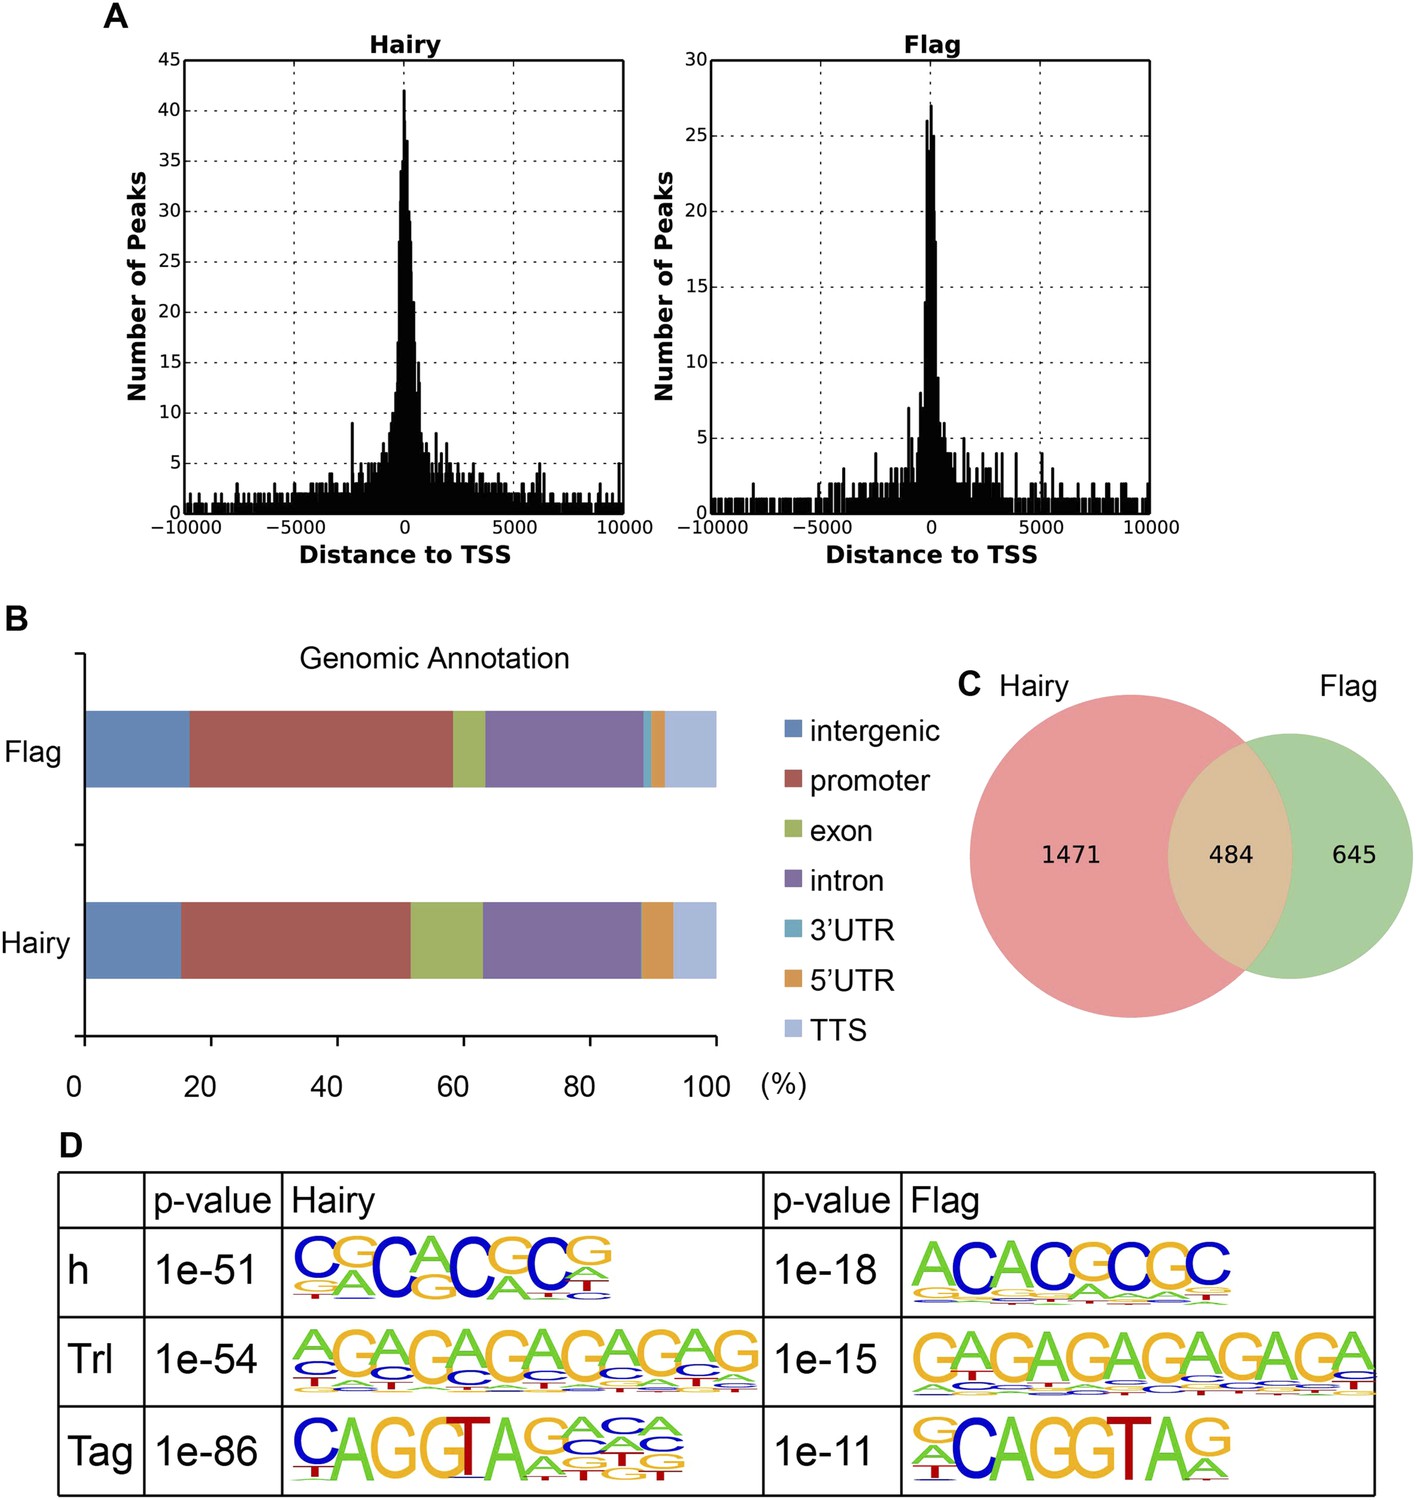
Similarity between binding of endogenous Hairy and overexpressed Hairy protein.
(A) Similarity of promoter proximities. Histogram shows the global distribution of Hairy peaks around TSS identified from ChIP-seq of induced Flag tagged Hairy protein (right panel) and by previous ChIP–chip detection of endogenous Hairy binding (left panel) (MacArthur et al., 2009). (B) Genomic annotation of peaks shows similar binding distributions on genic and intergenic regions. (C) Area-proportional Venn diagram showing significant overlap between endogenous and induced Hairy binding (p = 2.15e-159). (D) De novo motif analysis reveals similar motifs enriched under peaks of both data, including canonical Hairy binding site (CACGCG). We used the ChIP–chip data from MacArthur et al. (2009) for our analysis because the Flag epitope gave low signals overall, although high-confidence functional targets such as ftz, Impl2, odd, h, 18w, wg, tup, pros, nht, and en were found.
Figure 2 with 1 supplement
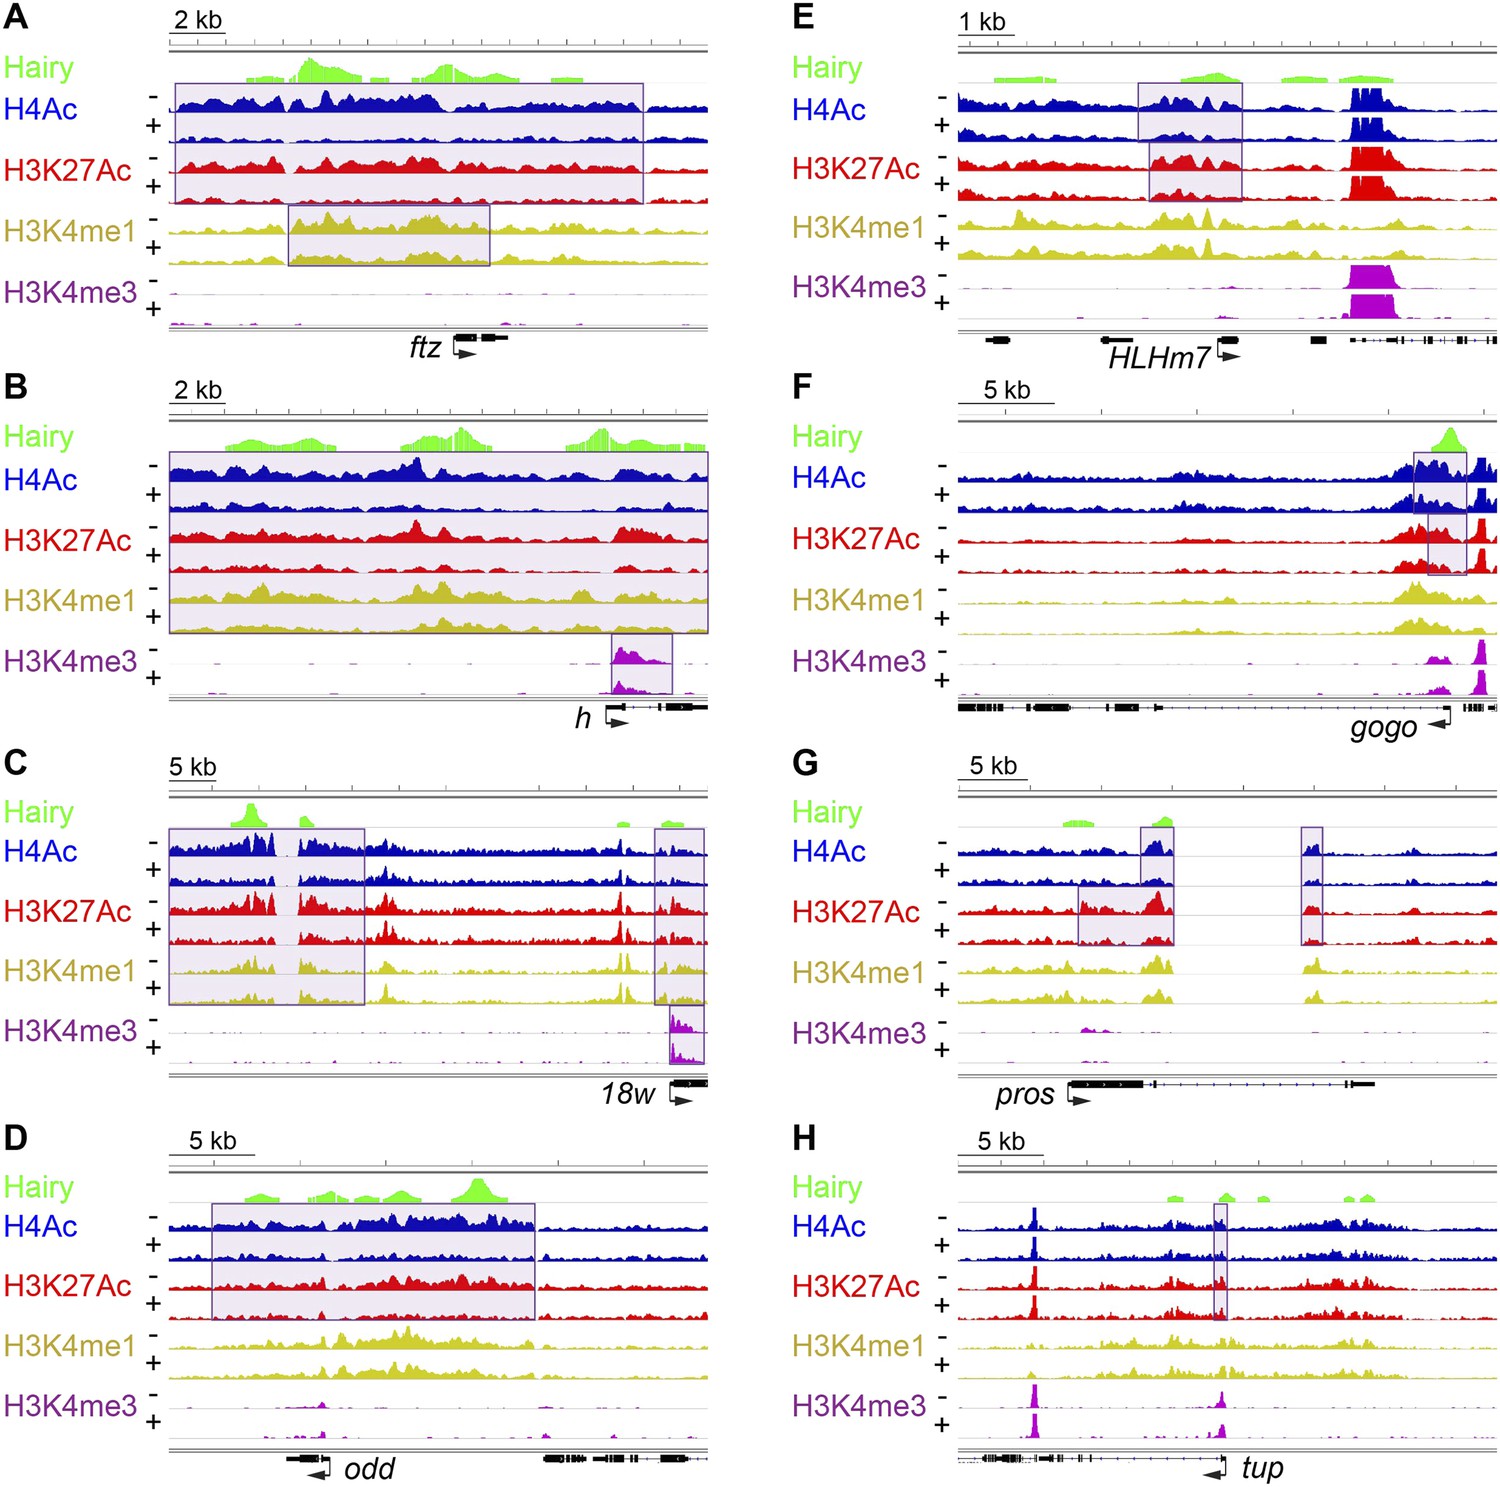
Examples of coupled, large-scale chromatin changes mediated by Hairy.
Chromatin immunoprecipitation-high throughput sequencing (ChIP-seq) tracks for H4Ac, H3K27Ac, H3K4me1 and H3K4me3 are shown at repressed genes before (−) and after Hairy (+) induction, with gene models below. (A–D) Coupled reduction of active histone marks was observed in a wide-spread fashion on ftz, h, 18w and odd genes (scale at top left). (E–H) Relatively smaller blocks of chromatin changes were detected on HLHm7, gogo, pros and tup genes. Significantly changed regions (shaded boxes) were identified by the diffReps program. Hairy binding (top track) from MacArthur et al. (2009).
Figure 2—figure supplement 1
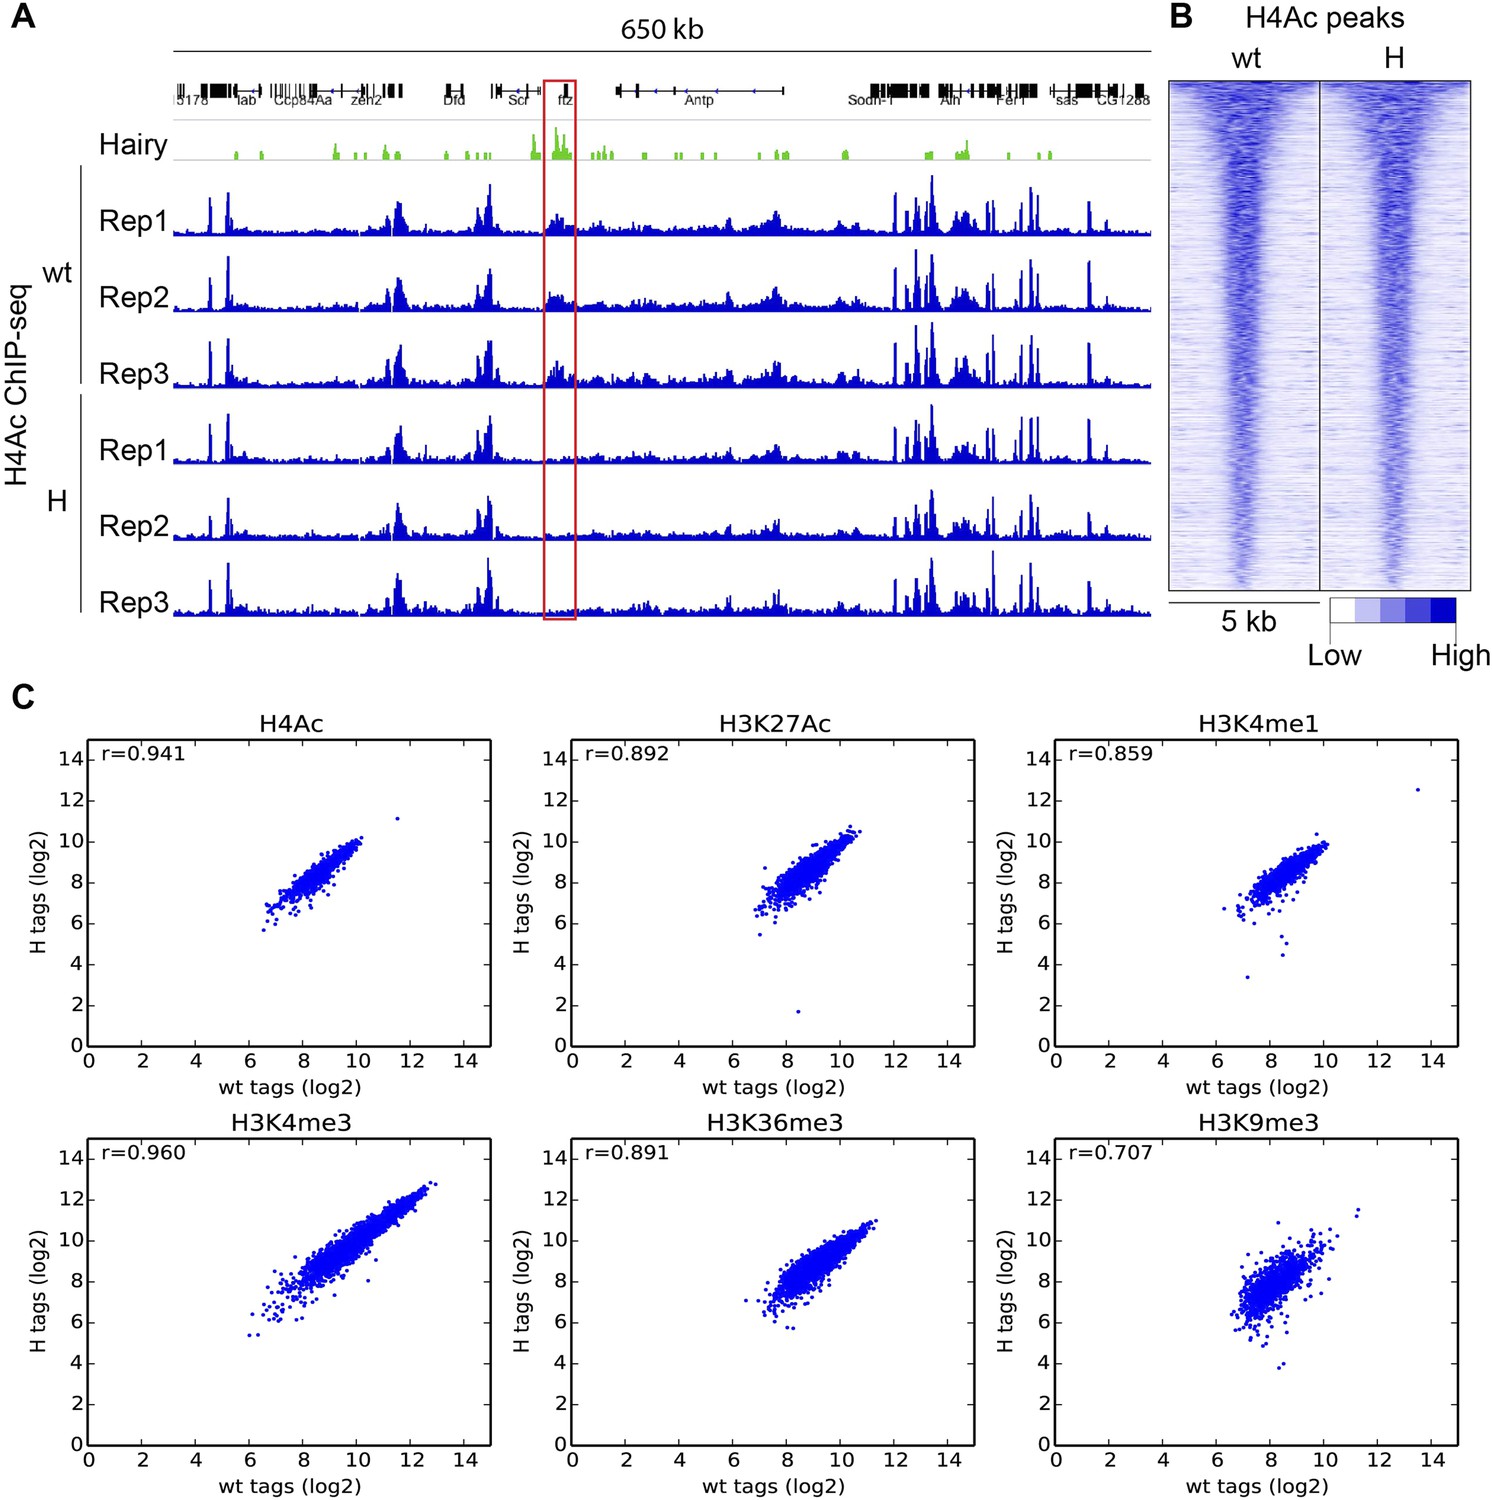
ChIP-seq reproducibility of biological replicates and variation between wild-type (wt) and transgenic embryos (H).
(A) Specific reduction of H4Ac signal at ftz locus (red box) in three biological replicates after induction of Hairy (H). (B) H4Ac peaks were not altered globally in genome by Hairy expression. Heatmaps show 5 kb window centered on called H4Ac peaks, ranked by peak height. (C) Measured global chromatin features were similar in wt and H samples, indicating that Hairy does not affect the majority of chromatin features throughout the genome. Scatter plots indicate the correlation (r = Pearson's correlation coefficient) between wt and H embryos for H4Ac, H3K27Ac, H3K4me1, H3K4me3, H3K36me3 and H3K9me3 marks. Each dot represents a peak. ChIP-seq read counts on the axis are transformed to log2 base.
Figure 3 with 2 supplements
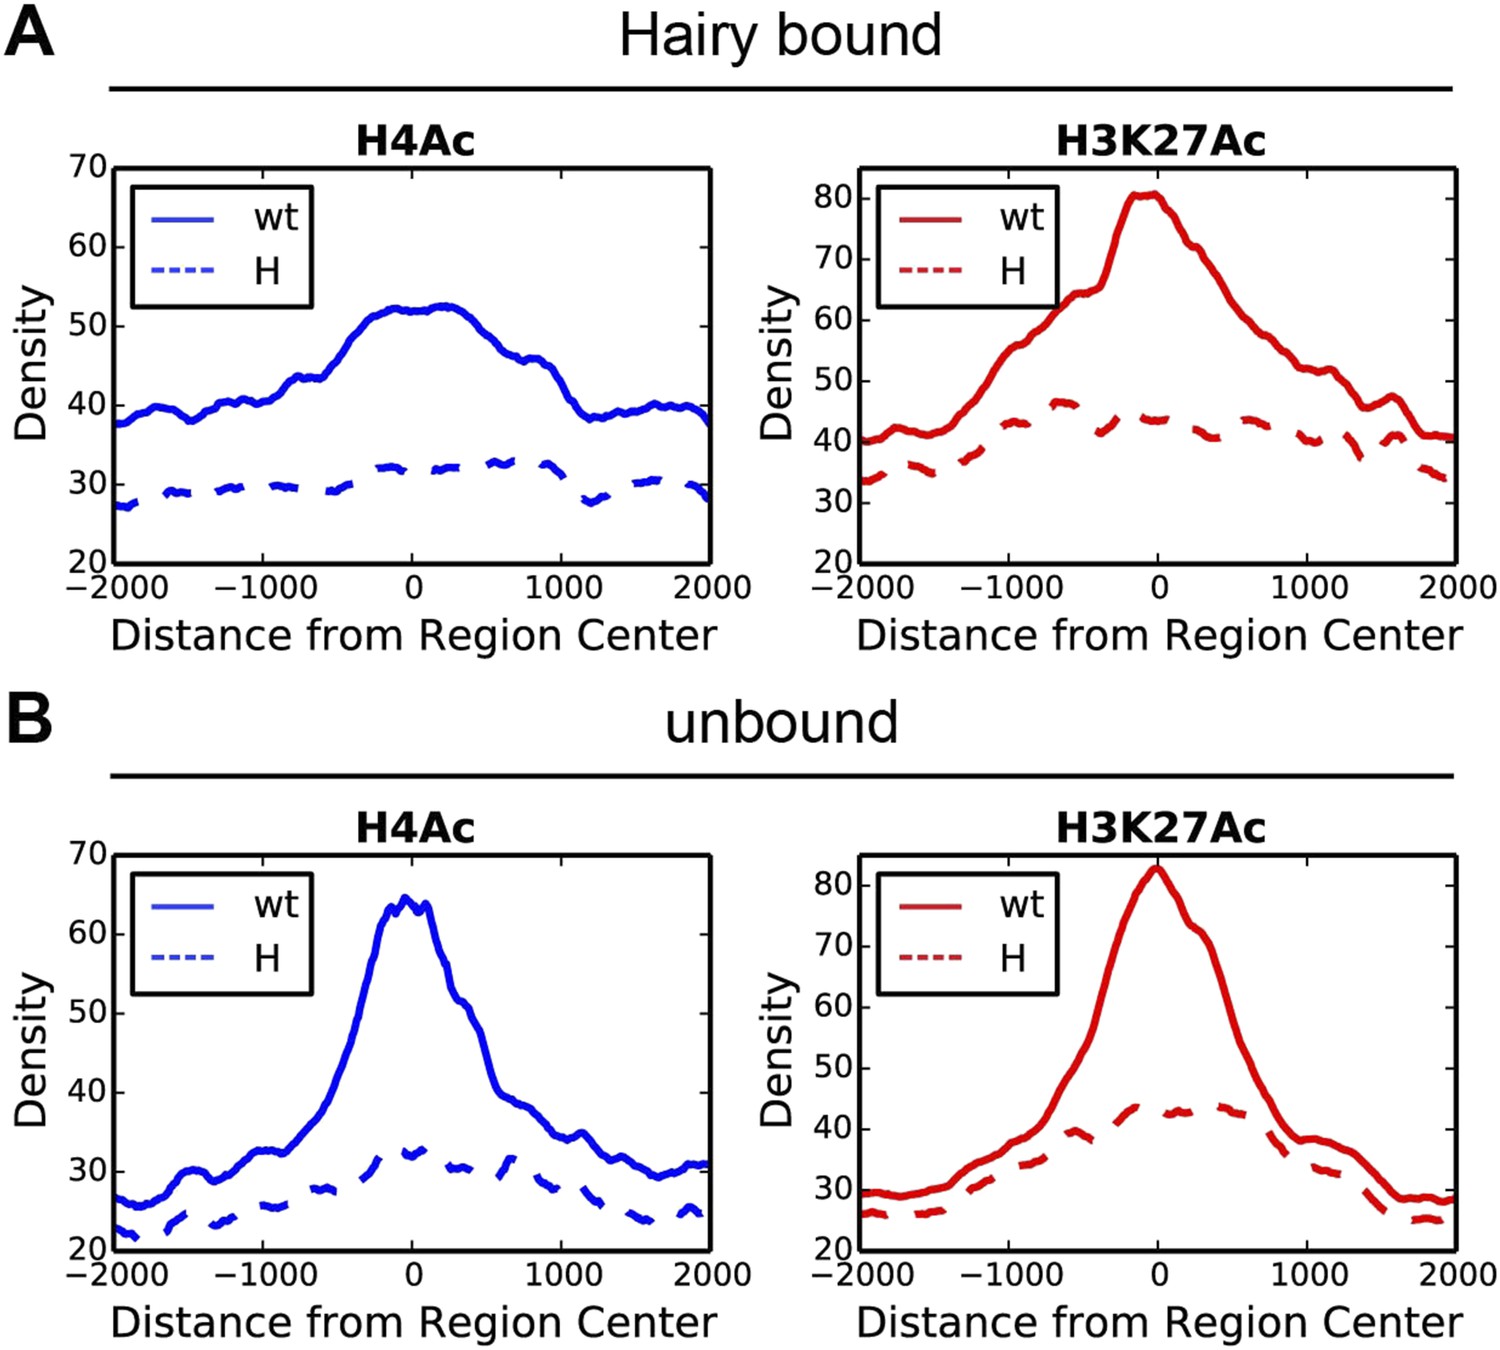
Direct Hairy target genes exhibit broad domains of chromatin effects.
Distribution of genome-averaged ChIP-seq signals before (straight line) and after (dashed line) Hairy induction, showing 4 kb window around affected regions. (A) Distributions of histone H4Ac and H3K27Ac marks of direct Hairy targets were significantly broader than for regions (B) not bound by Hairy (p = 2.55e-92 and p = 5.63e-70 respectively; KM test).
Figure 3—figure supplement 1
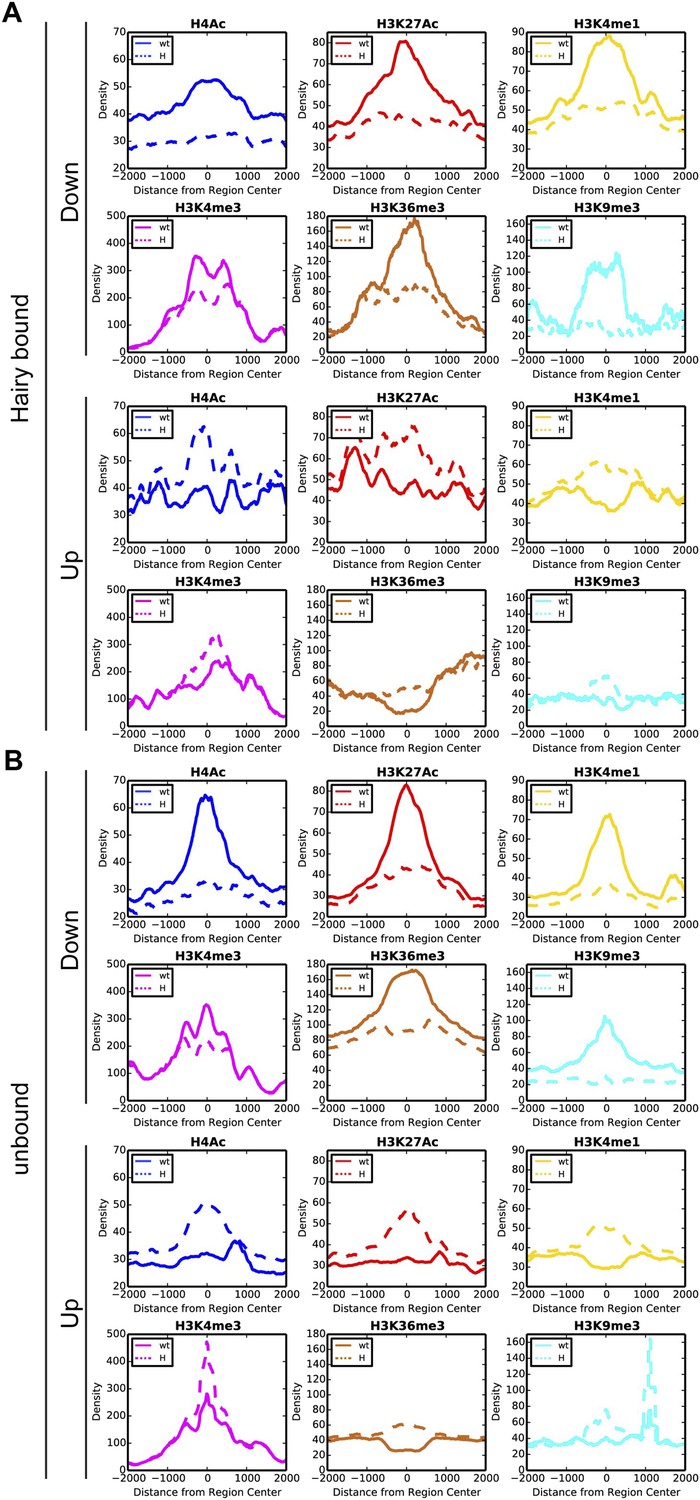
Distinct chromatin profiles associated with direct and indirect Hairy targeted loci.
Histograms show the distribution of averaged ChIP-seq signals in a window of 4 kb centered on differentially changed regions associated with Hairy bound (A) and unbound (B) genes in the wild-type (wt, solid lines) and Hairy induced (H, dashed lines) embryos for H4Ac, H3K27Ac, H3K4me1, H3K4me3, H3K36me3 and H3K9me3.
Figure 3—figure supplement 2
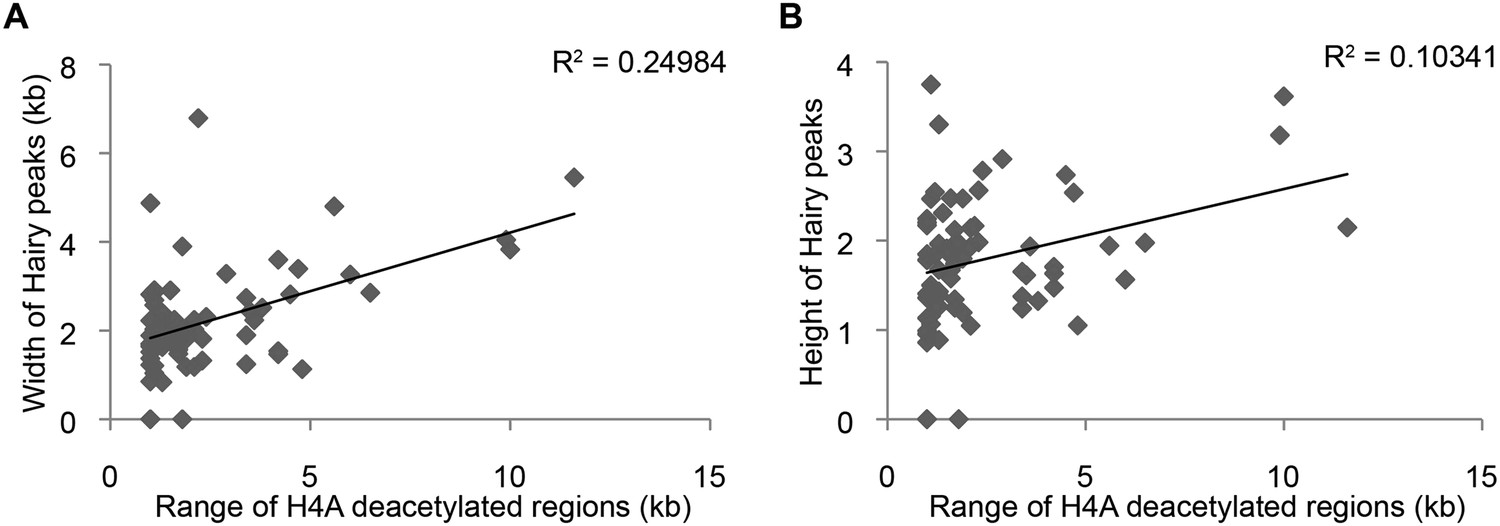
Little correlation between height of Hairy peaks or width of Hairy-bound region and extent of H4 deacetylation blocks and width (A) or height (B) of Hairy peaks.
Other marks also exhibited little correlation between Hairy peak width and height and range of chromatin alterations (not shown).
Figure 4 with 2 supplements
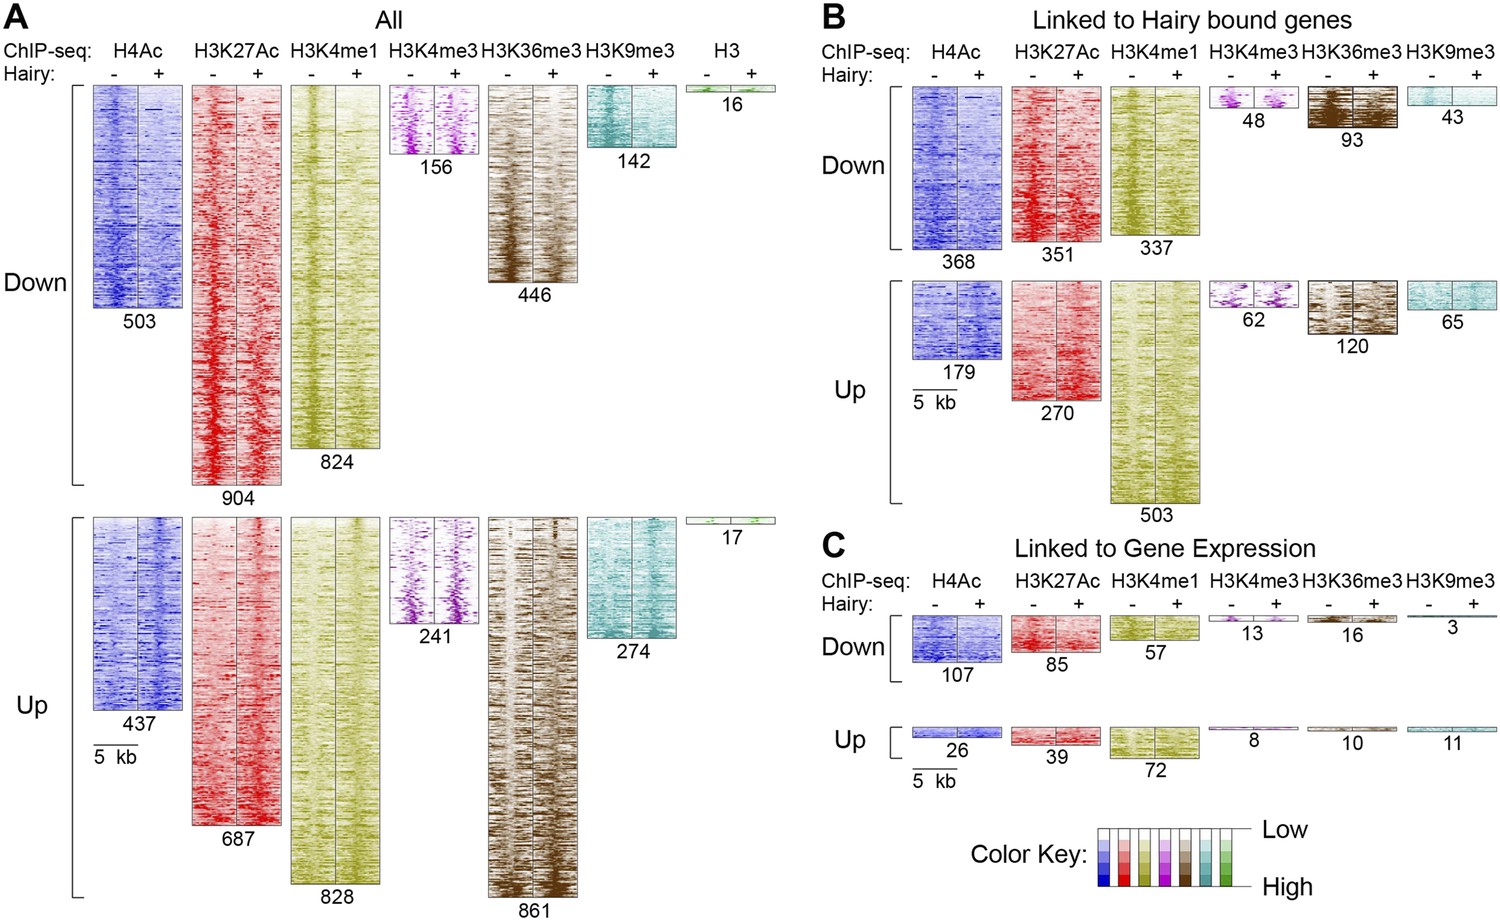
Pervasive genome-wide chromatin effects of Hairy.
(A) All reduced (top) and increased (bottom) chromatin marks in the genome for H4Ac, H3K27Ac, H3K4me1, H3K4me3, H3K36me3, H3K9me3 and H3 shown as heatmaps for 5 kb windows from the center of significantly affected regions before (−) and after (+) Hairy induction. The number of affected regions indicated below each mark. (B) Affected chromatin regions associated with Hairy-bound genes show preferential enrichments for H4Ac, H3K27Ac, and H3K4me1. All affected regions were assigned to closest genes, and those in the vicinity of Hairy-bound genes are shown. (C) Subset of modified regions from (B) that were linked to genes transcriptionally regulated by Hairy. Significance of enrichment for chromatin modifications shown in Figure 4—figure supplement 1A,B.
Figure 4—figure supplement 1
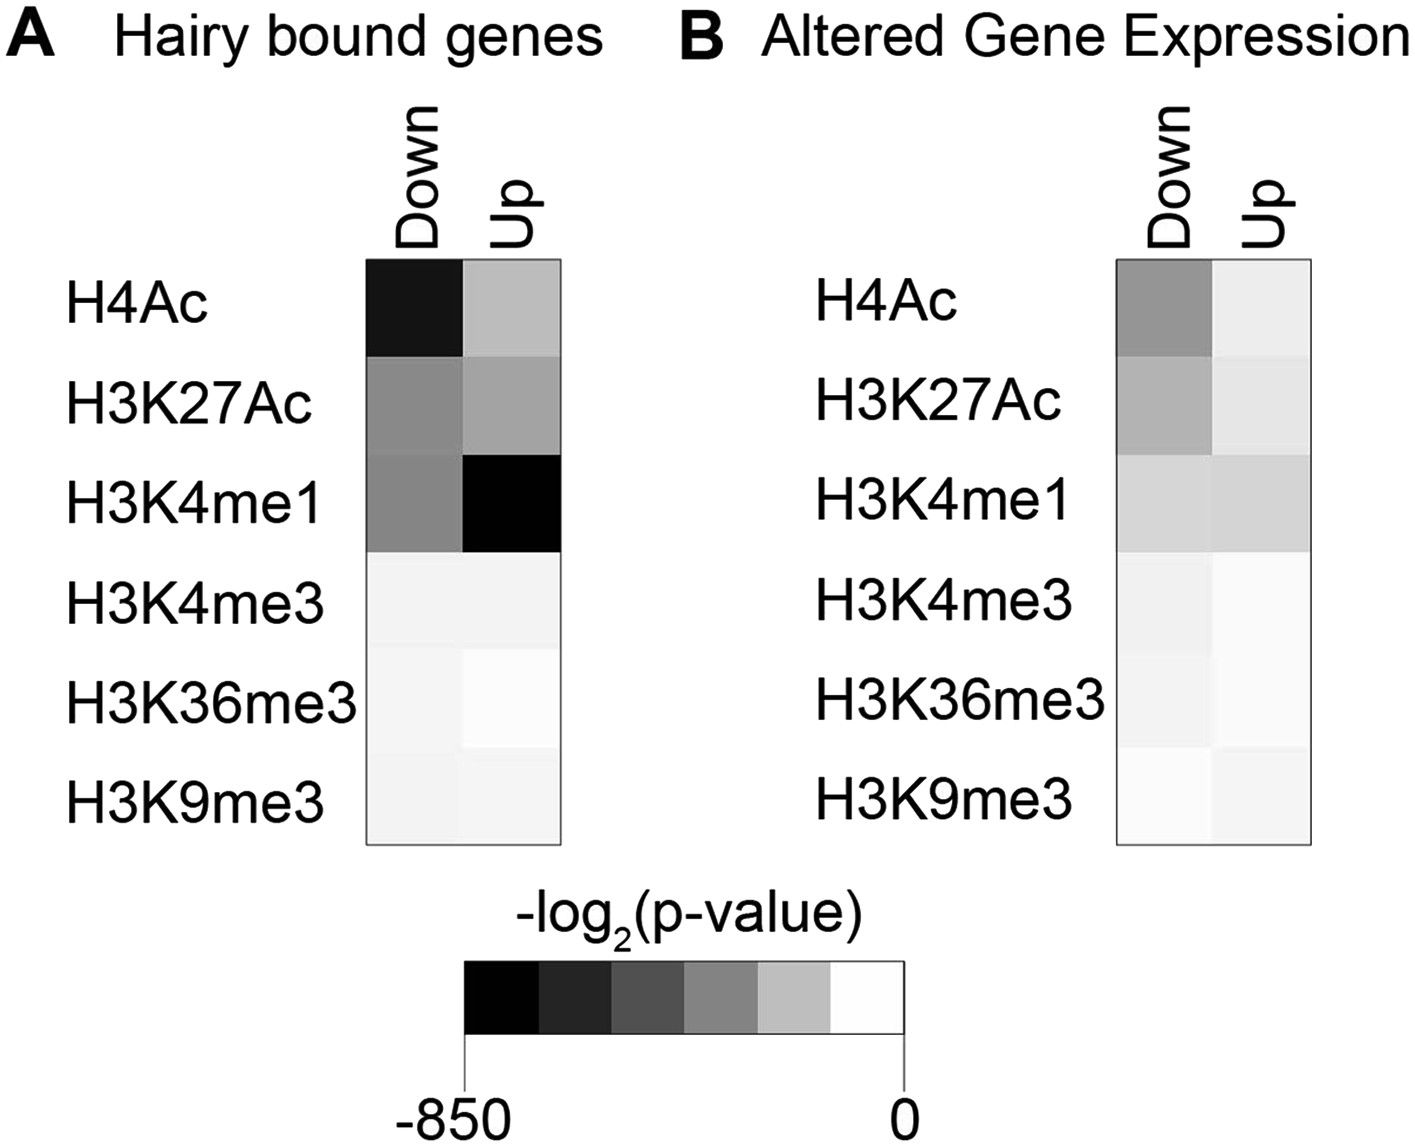
Significance of individual histone modifications associated with Hairy bound genes and transcriptionally regulated genes.
(A) Strongest link between loss of H4Ac, gain of H3K4me1, and presence of Hairy on genes. (B) Transcriptionally repressed genes associated with loss of H4Ac, H3K27Ac, and gain or loss of H3K4me1.
Figure 4—figure supplement 2
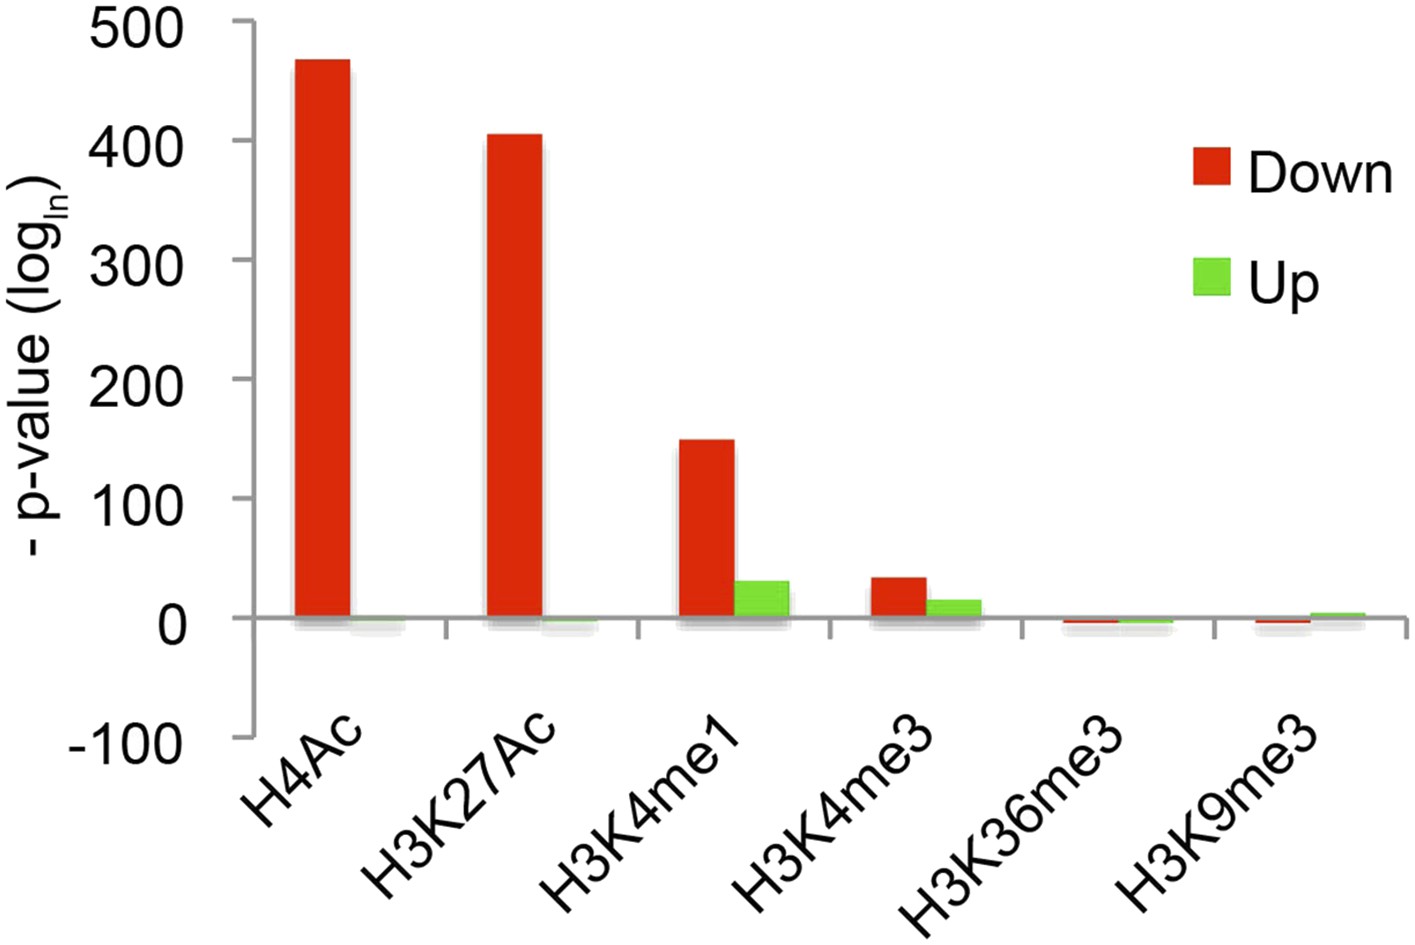
Strong correlation between the presence of Hairy binding and chromatin alterations on specific chromatin blocks.
Reduced H4Ac, H3K27Ac, and H3K4me1 significantly associated with Hairy binding. Hairy bound regions overlapped with chromatin blocks by at least 1 bp. y-axis indicates p-value (logln).
Figure 5 with 1 supplement
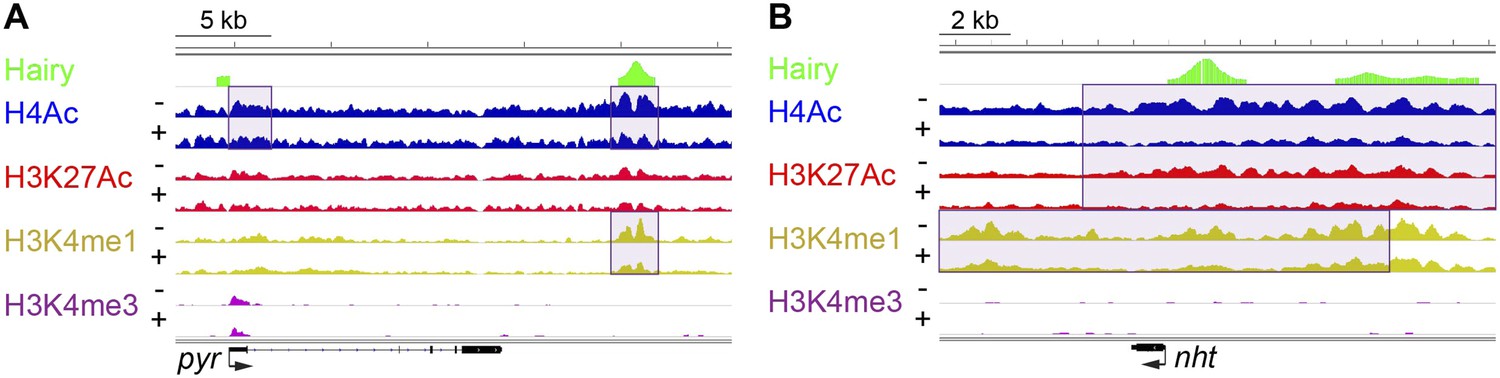
Examples of chromatin-modified loci unlinked to changes in gene expression.
(A) pyr is actively transcribed, and not significantly repressed by Hairy, (B) while nht is not expressed at this stage. ChIP-seq tracks for H4Ac, H3K27Ac, H3K4me1 and H3K4m3 are shown before (−) and after Hairy (+) induction.
Figure 5—figure supplement 1
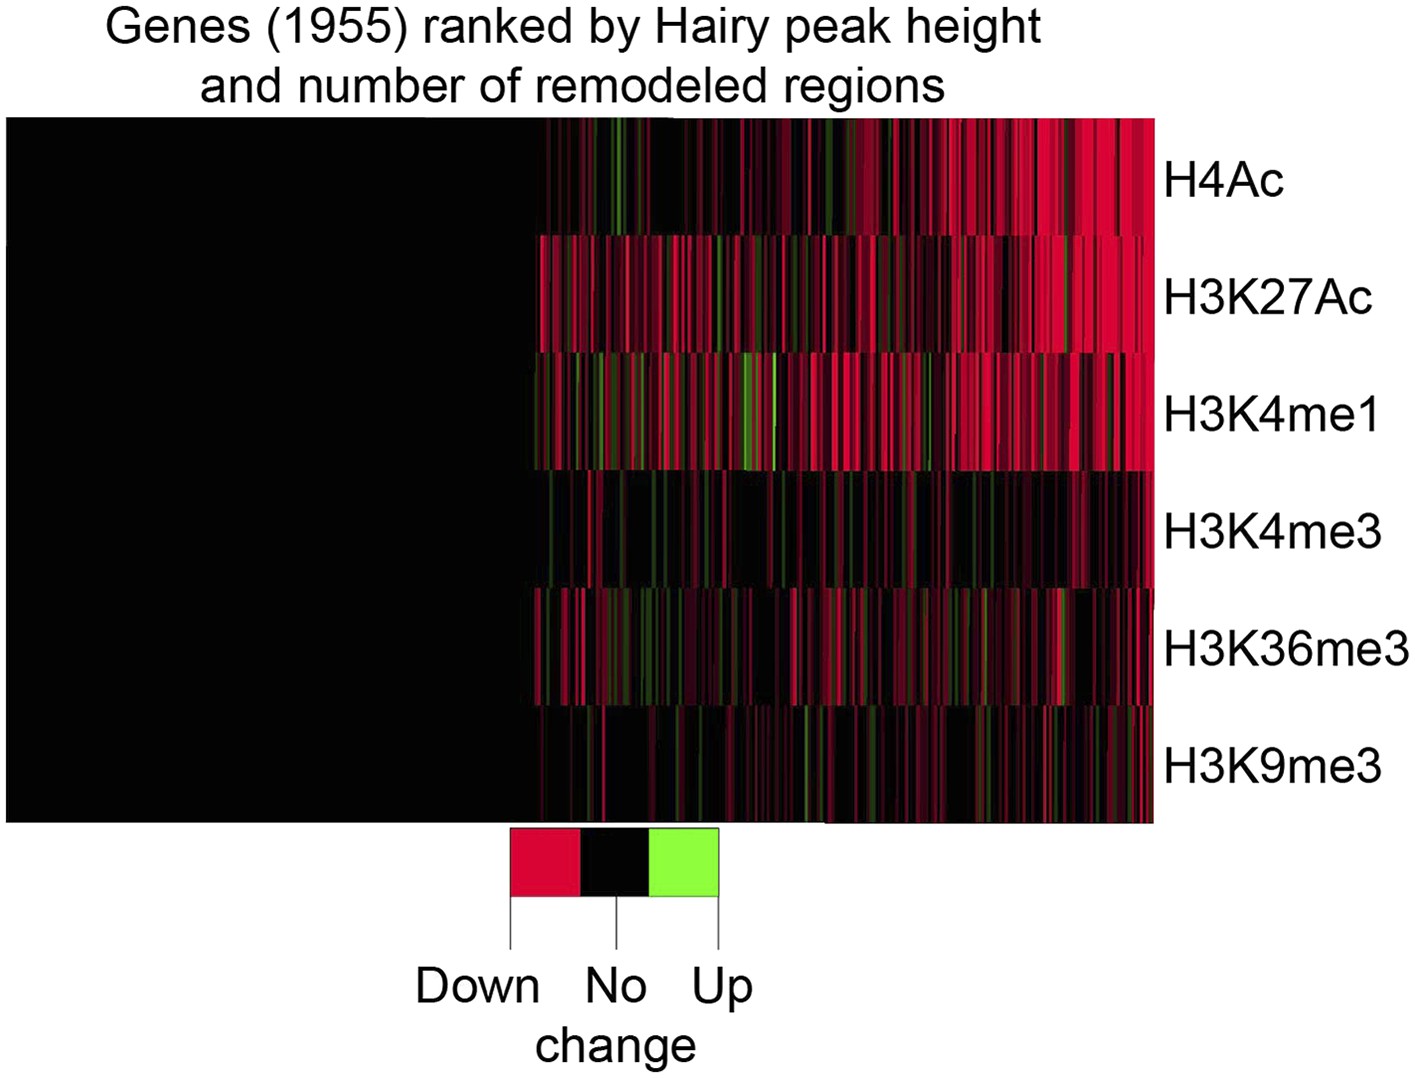
Global association of Hairy binding with histone mark alterations.
Changes in histone marks, predominantly reductions, were detected for more than half of the Hairy bound genes. Genes were divided into two groups; no detectable histone mark changes vs at least one change, and then ranked (right to left) by height of Hairy peaks and total number of changes in histone marks. Differential changed regions of histone marks and Hairy peaks were assigned to genes with the closest TSS.
Figure 6
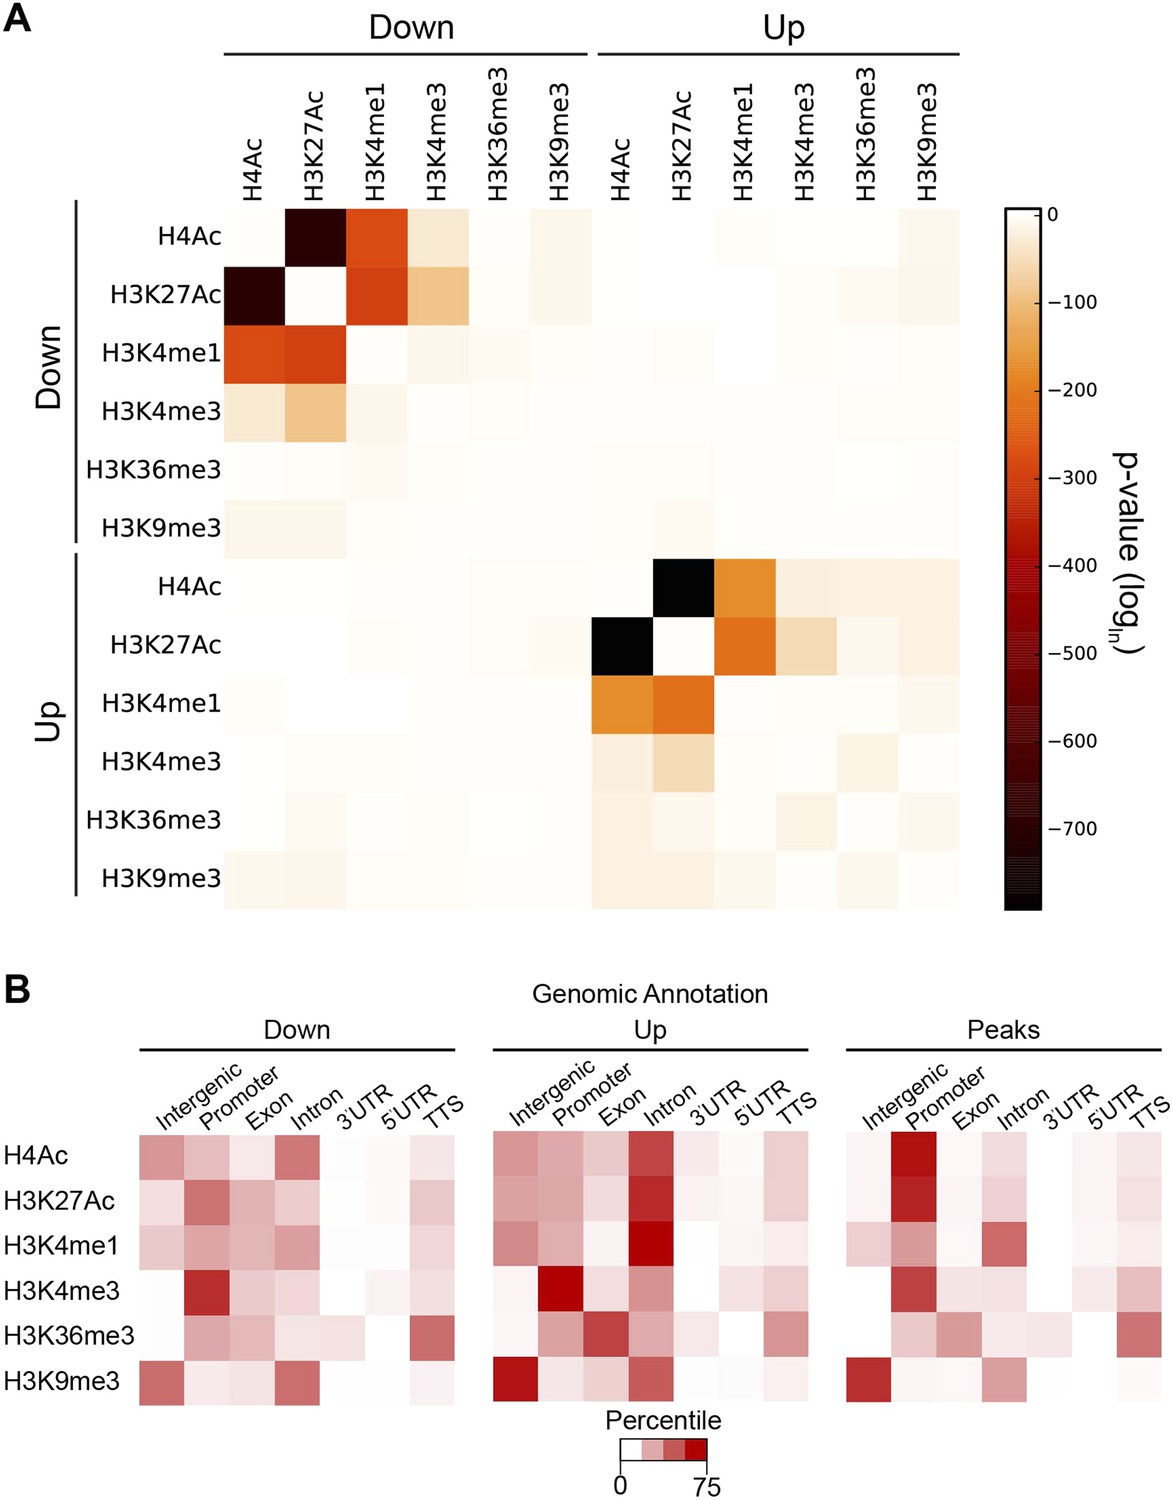
Coordination in changes of specific chromatin modifications by Hairy.
(A) Very strong overlap between decreases in regions of H4Ac, H3K27Ac, H3K4me1 (heat map, upper left quadrant). Similar coordination between increases of H4Ac, H3K27Ac, H3K4me1 was noted (lower right quadrant). Combined increases and decreases of different marks were rarely observed. (B) Distribution of modified blocks by genomic regions show preferential action of Hairy at a distance from transcription start site (TSS). Affected regions were mapped to intergenic regions, promoter, exon etc. Overall distribution of genomic peaks for measured marks shown at right; the distributions for affected H4Ac and H3K27Ac regions deviated from the genomic averages (left, decreased, and center, increased levels).
Figure 7

Diverse impact on RNA Pol II occupancy by Hairy.
(A) A minority of genes show significant changes in Pol II occupancy after Hairy repression, although a larger proportion of the directly targeted genes have measureable decreases in Pol II. ‘Repressed genes’ shows entire set of transcriptionally downregulated genes, with reduced Pol II occupancy shown in dark gray. Subsets of genes directly bound or not bound by Hairy shown in center and at right. (B–I) Pol II occupancy on transcriptionally regulated genes before (−) and after (+) Hairy induction. Pol II occupancy decreases in the promoter and gene body of ftz and odd, only on the gene body of h, 18w and pros, and only at the promoter of HLHm7 and gogo. Pol II signal was not changed significantly on tup. (J, K) Consistent with lack of transcriptional effects on other genes with associated chromatin modifications, Pol II occupancy on pyr is not changed, and absent on nht.
Figure 8
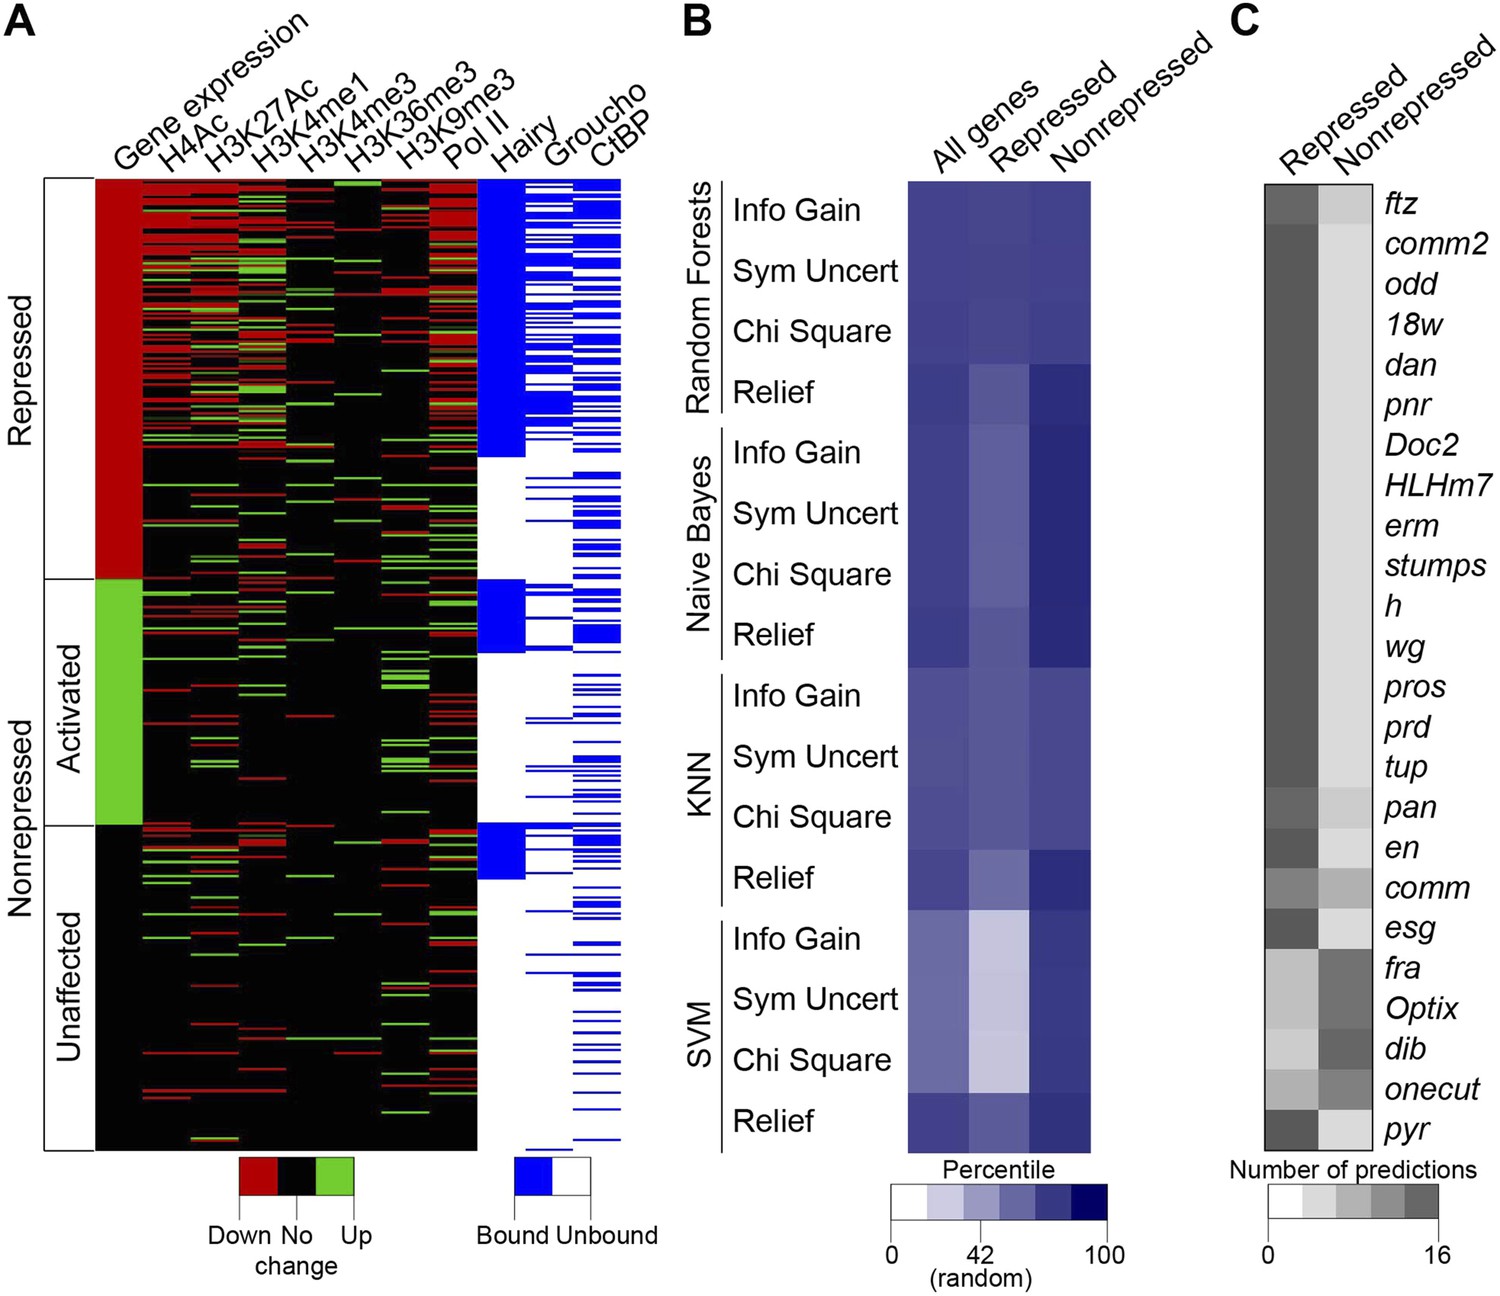
Machine learning reveals complex chromatin code for repression of Hairy target genes.
(A) Changes in histone marks, Pol II occupancy and Hairy, Gro and CtBP binding on repressed (red), activated (green) and unaffected (black) genes upon Hairy induction. Genes were grouped by change in expression, then subgrouped into Hairy bound or unbound, and finally ranked by fold change in gene expression. Activated and unaffected genes were grouped as nonrepressed genes. (B) Relative success rate at calling repressed and nonrepressed genes for four different machine learning models. Background prediction for this entire set is expected to be 58%; Random Forests, Naive Bayes, KNN classifiers had an average success of 75% overall, while the SVM classifier was not better than background. Classifiers were used in conjunction with Information Gain, Symmetrical Uncertainty, Chi Square and Relief feature selection algorithms. The average prediction accuracies of each method are shown in the first column. Expected random success (42%) for repressed genes (middle column) shown on heat map scale bar. (C) Model predictions for subset of repressed genes including those identified in Figure 1; top 19 were successfully predicted by almost all methods. fra, Optix, dib, and onecut were genes with disparate predictions that had few measureable chromatin features. At bottom, uniform false ‘repressed’ calls for pyr, which was not transcriptionally repressed.
Figure 9
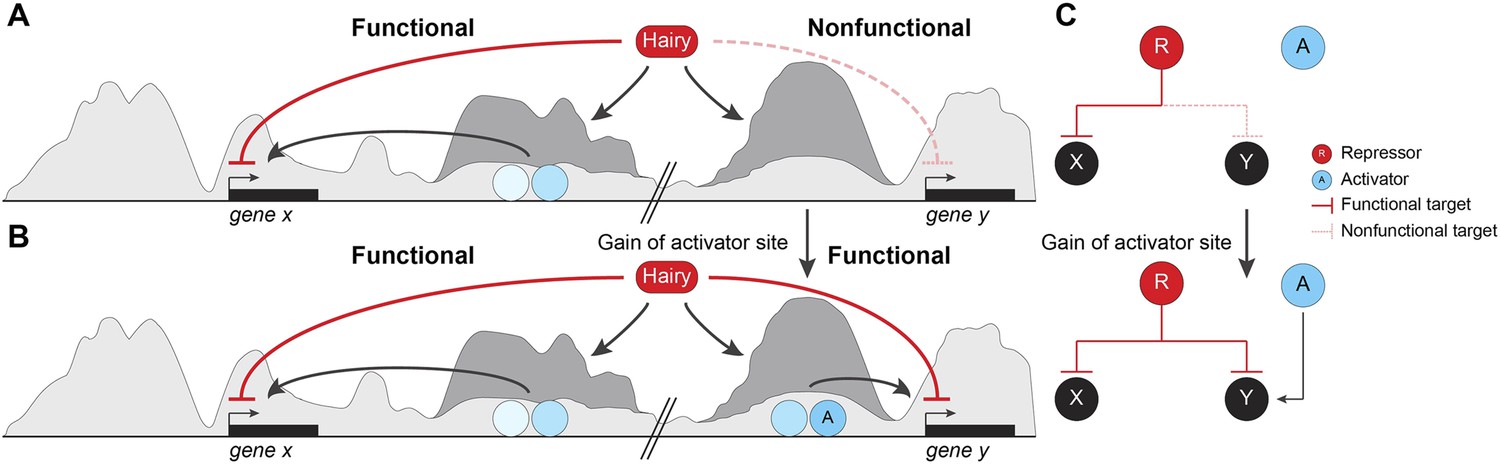
Pervasive biochemical activities on ‘off-target’ loci may represent molecular exaptations that generate novel edges between nodes of a standing gene regulatory networks (GRN).
Functional and nonfunctional interactions of Hairy with chromatin are depicted. (A) Hairy repression of target genes results in loss of active histone marks such as H4Ac, H3K27Ac, and H3K4me1 (dark gray peaks; gene x). Hairy interacts with many other nonfunctional targets where it carries out biochemical activities similar to those seen on transcriptionally controlled loci (gene y). The latter chromatin changes are inconsequential and unlikely to be evolutionarily selected. (B) Gain of activator sites in a region of Hairy-modified chromatin may generate an on/off switch and result in functional targeting. (C) Schematic representation of cooption of Hairy physical interaction into modified GRN.
Author response image 1
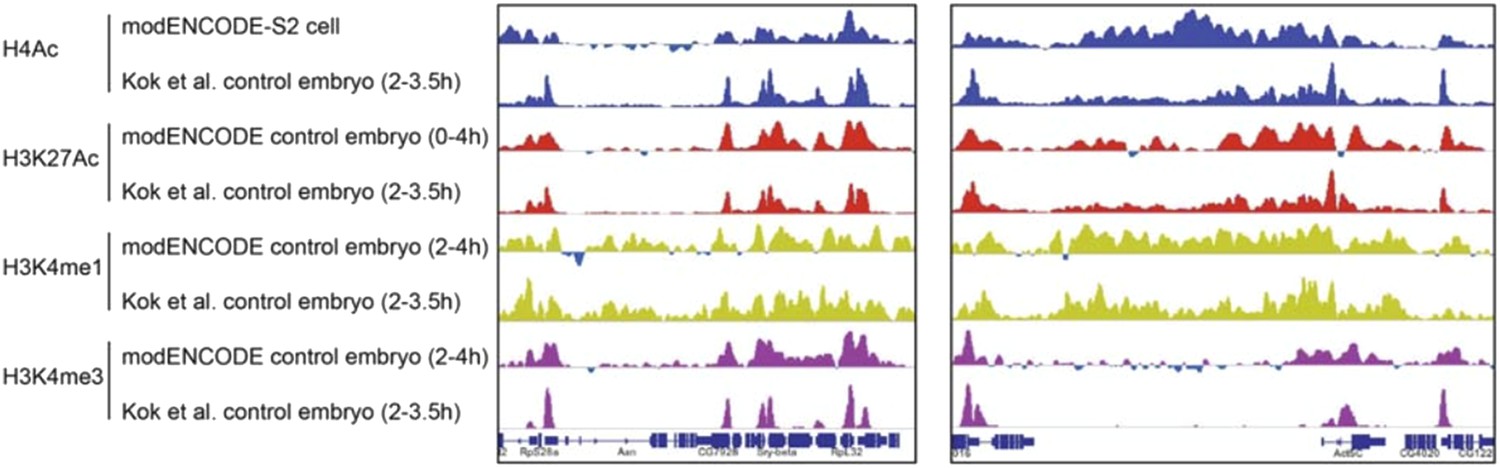
Comparison of modENCODE data with our data from control embryos not expressing Hairy that were heat shock treated. The high level of similarity for the genome tracks of H4Ac, H3K27Ac, H3K4me1 and H3K4me3 at two loci were representative of the overall similarity across many genomic loci.
Author response image 2
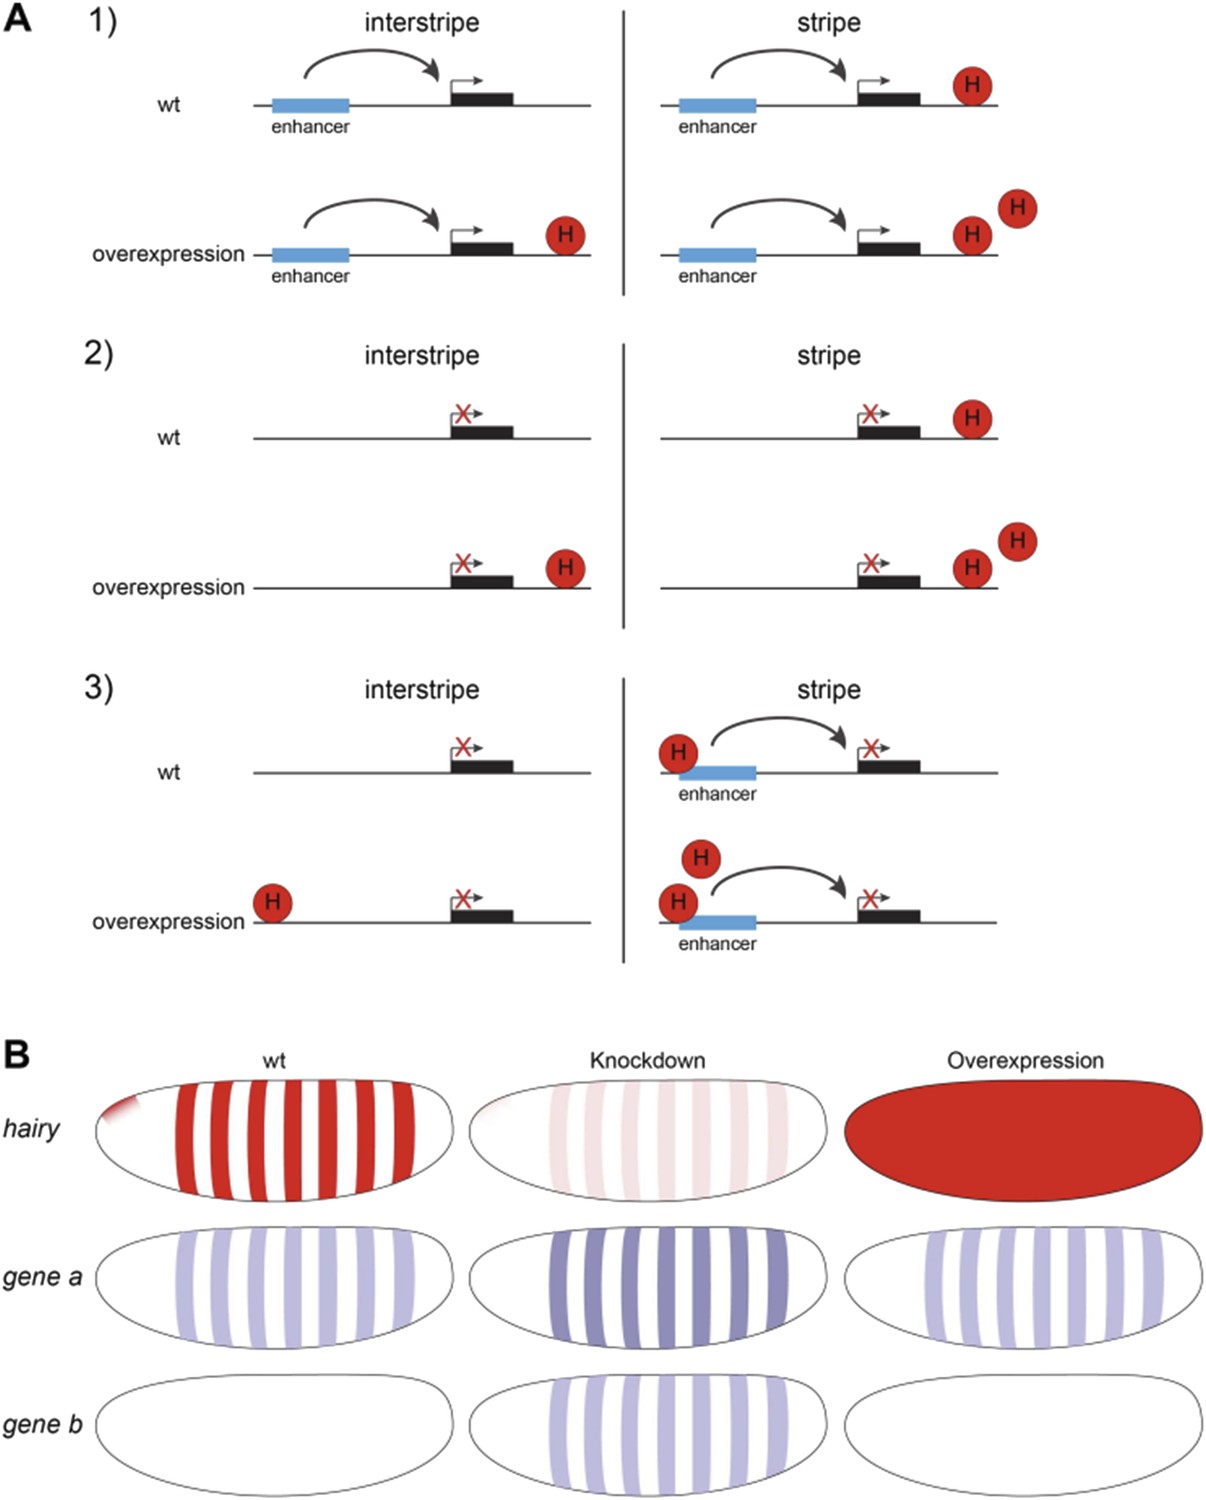
A) Three scenarios explaining why genes might be unresponsive to Hairy induction in interstripes and stripes even though chromatin changes were detected. 1. Enhancers are far from Hairy sites. 2. Gene is generally inactive. 3. Stripe-specific activators are present within Hairy stripe region, and are partially or completely repressed by the endogenous Hairy, so that ectopic Hairy has no effect on transcription. Promoters are shown in Hairy stripe and interstripe areas, before and after Hairy induction. B) Diagrams show expression pattern of Hairy (red) and Type 3 unresponsive genes (blue) to Hairy overexpression in wild-type (wt) embryos, loss-of-function and overexpression assays.
Additional files
-
Supplementary file 1
GO analysis of down-regulated genes.
- https://doi.org/10.7554/eLife.06394.019
-
Supplementary file 2
GO analysis of up-regulated genes.
- https://doi.org/10.7554/eLife.06394.020
-
Supplementary file 3
Comparison of ChIP-seq signal around differentially changed histone marks using Kolmogorov Smirnov test.
- https://doi.org/10.7554/eLife.06394.021
-
Supplementary file 4
Feature ranking in predicting gene expression.
- https://doi.org/10.7554/eLife.06394.022
-
Supplementary file 5
Diffentially regulated genes identified by microarray analysis.
- https://doi.org/10.7554/eLife.06394.023
-
Supplementary file 6
Summary of sequencing reads.
- https://doi.org/10.7554/eLife.06394.024
-
Supplementary file 7
Randomly selected unaffected genes for machine learning analysis.
- https://doi.org/10.7554/eLife.06394.025
Download links
A two-part list of links to download the article, or parts of the article, in various formats.
Downloads (link to download the article as PDF)
Open citations (links to open the citations from this article in various online reference manager services)
Cite this article (links to download the citations from this article in formats compatible with various reference manager tools)
Genome-wide errant targeting by Hairy
eLife 4:e06394.
https://doi.org/10.7554/eLife.06394


