Building accurate sequence-to-affinity models from high-throughput in vitro protein-DNA binding data using FeatureREDUCE
- Columbia University, United States
- University of Massachusetts Boston, United States
Figures
Figure 1
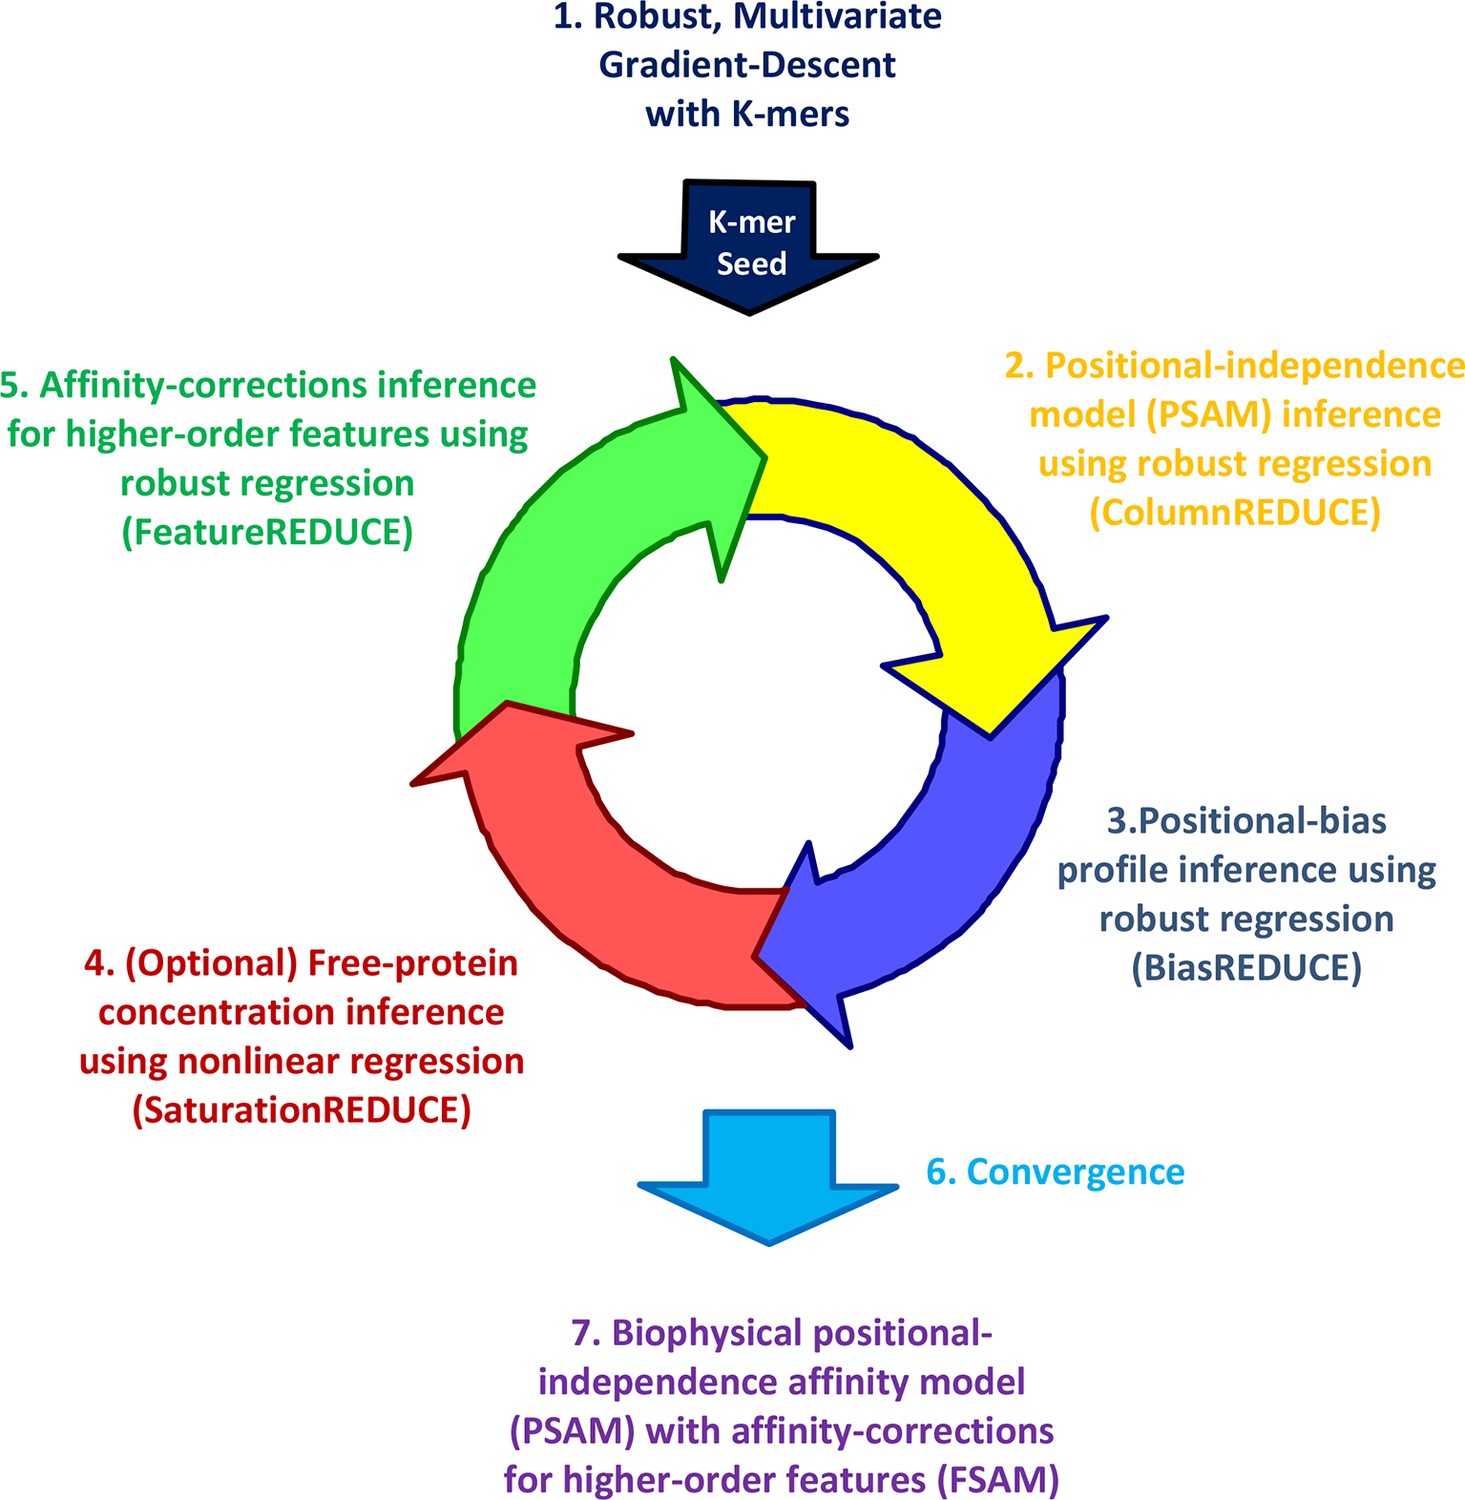
The FeatureREDUCE workflow for analyzing PBM intensities.
(1) A robust method is used to estimate relative affinities for each K-mer of a given length. The K-mer with the highest affinity is chosen as the seed. (2) Using the seed as a reference, robust linear regression is used to estimate the relative affinity parameters in each column of the position-specific affinity matrix (PSAM). (3) With the current affinity model, linear regression is used to estimate the positional bias profile across the probe. (4) An optional step uses nonlinear regression to solve for the free protein concentration. (5) Robust regression is used to estimate free energy contributions associated with higher-order sequence features such as dinucleotides. (6) Steps 2 through 5 are repeated until convergence. (7) The procedure results in a feature-specific affinity model (FSAM) that can be used to predict the relative affinity for any DNA sequence.
Figure 2 with 1 supplement
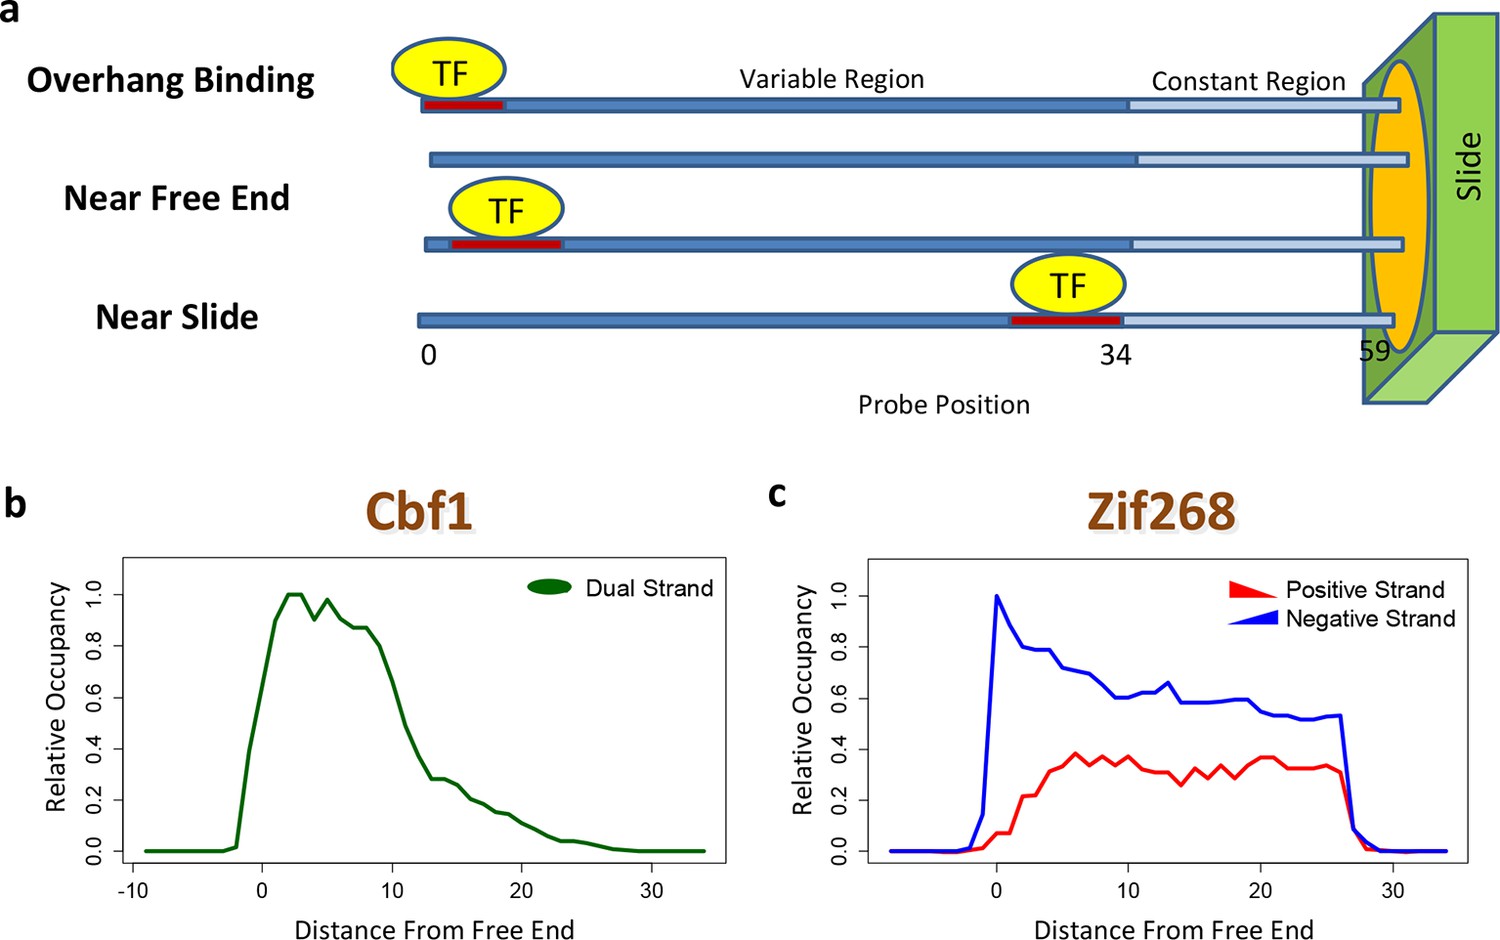
Quantifying PBM-specific positional and orientational bias.
(a) Accounting for biases related to the position of the binding site within the probe. The effective protein concentration is lower closer to the substrate, presumably due to steric hindrance. Furthermore, binding near the free end of probe is associated with loss of contacts with the DNA backbone. (b) Positional bias profile for the homo-dimeric bHLH transcription factor Cbf1p, as inferred by a model fit to the PBM intensities. (c) Idem, for the monomeric zinc finger transcription factor Zif268. Figure 2—figure supplement 1 shows how positional bias can be used as an indicator of data quality.
Figure 2—figure supplement 1
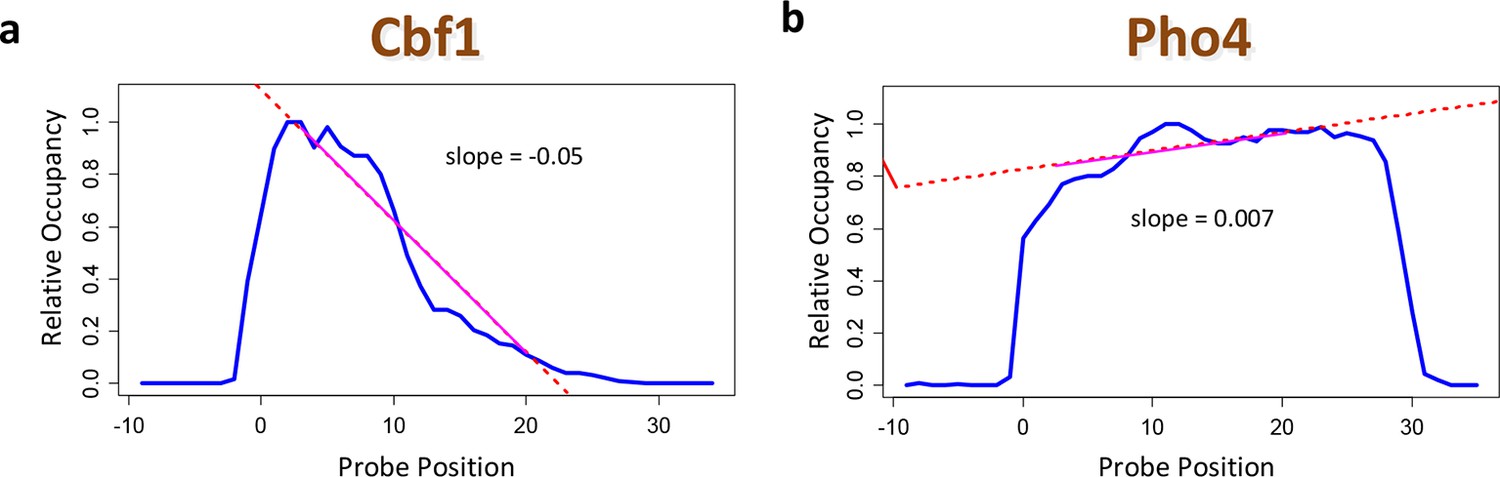
Using positional bias profiles as an indicator of data quality.
(a) The positional bias profile for Cbf1p exhibits a strong preference for binding far from the substrate. The negative slope of the dashed red line is an indicator of high data quality. (b) The same plot for Pho4p. Here, the quality of the data is questionable. The sign of the slope from a linear regression over the range denoted by the solid red line is a useful data quality indicator.
Figure 3 with 2 supplements

Robust estimation of dependencies between nucleotide positions.
(a) Overview of the dependencies between pairs of neighboring nucleotides positions identified by FeatureREDUCE for homodimers of the basic helix-loop-helix (bHLH) factor Cbf1p. (b) Including dinucleotide dependencies in the sequence-to-affinity model, in combination with the use of robust regression, improves the ability to delineate Gene Ontology associations with Cbf1p targets predicted from the genome sequence. Figure 3—figure supplement 1 shows the crucial importance of using robust inference methods for estimating the binding free energy correction terms associated with dinucleotide features. Figure 3—figure supplement 2 shows the underlying cumulative distributions of yeast promoter affinities for 'sulfur compound metabolic process', the GO category with the most statistically significant association with Cbf1p.
Figure 3—figure supplement 1
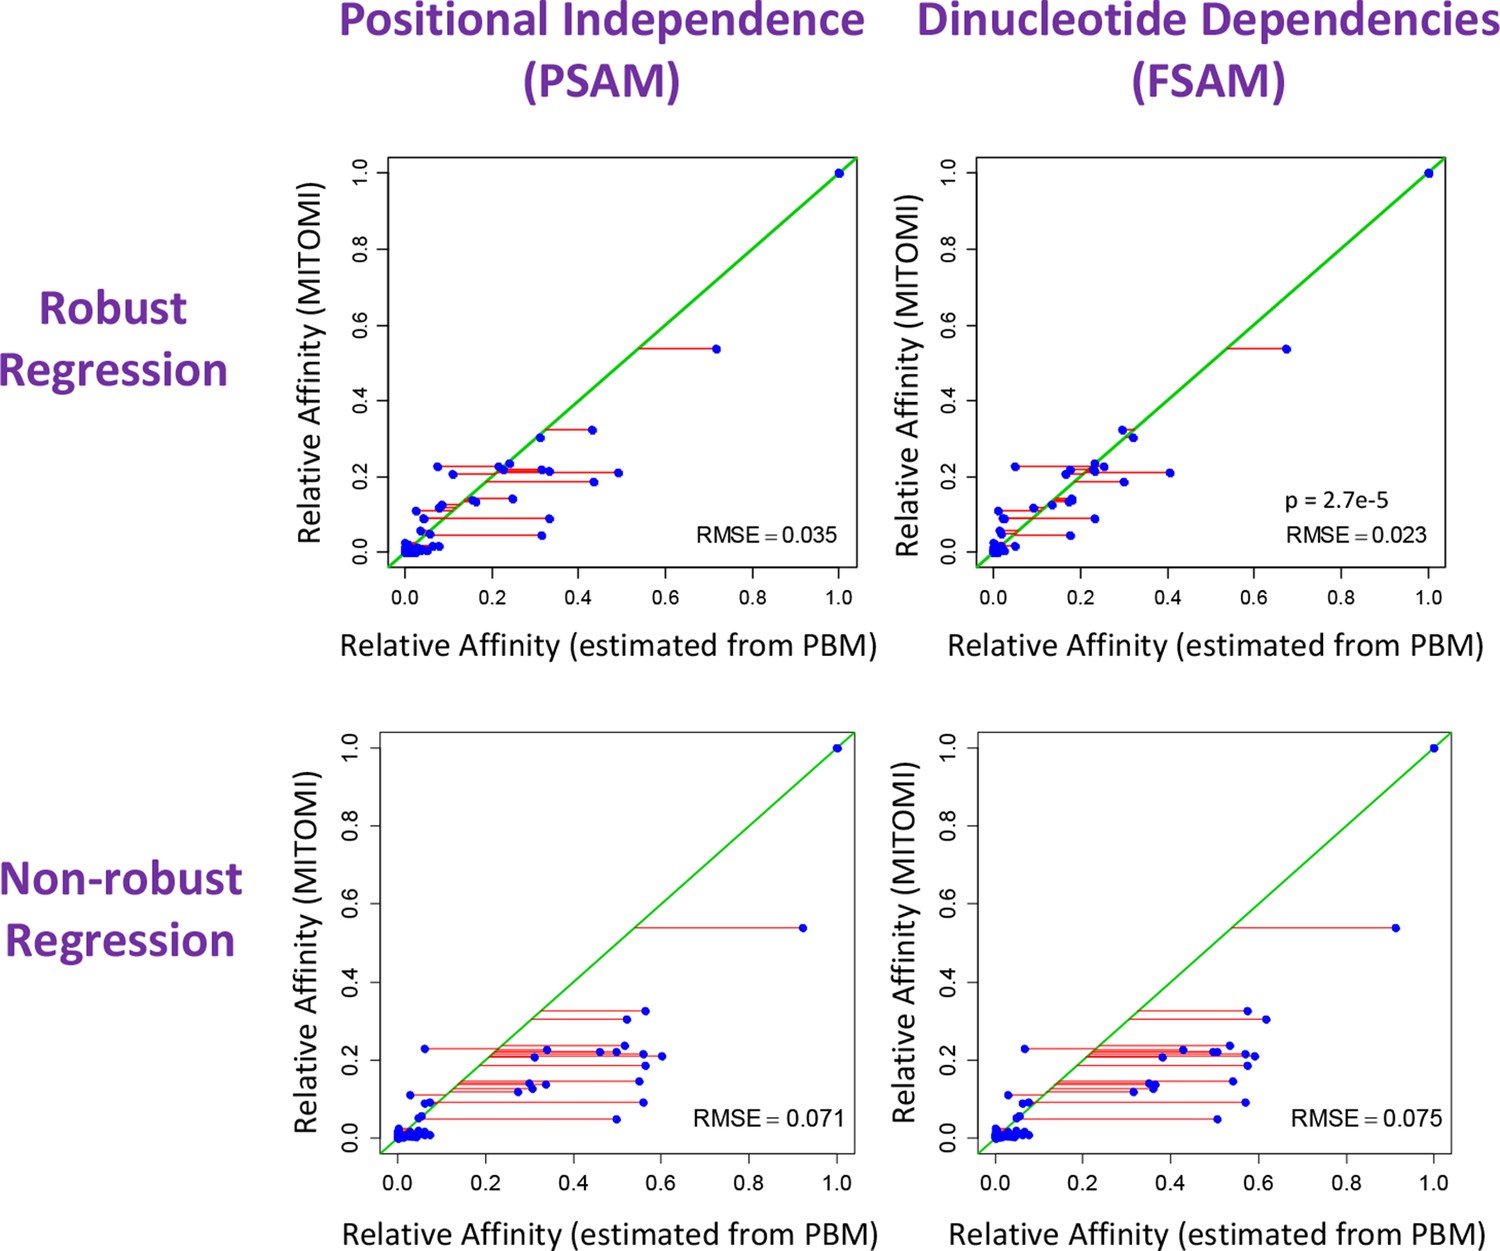
The crucial importance of using robust inference methods for estimating the binding free energy correction terms associated with dinucleotide features.
Shown is comparison between relative affinities inferred by FeatureREDUCE from PBM data for the transcription factor Cbf1p (horizontal axis) and the gold-standard measurement of the same affinity obtained using MITOMI (vertical axis). When the independent-nucleotide model (PSAM) is augmented with nearest-neighbor dinucleotide dependencies (FSAM), the agreement with the gold standard improves significantly, as indicated by the root-mean-square error (RMSE) and corresponding 100,000-iteration permutation p-value of 2.7e-5. The lower plots show that using robust regression techniques is essential for capturing the effect of dinucleotide features.
Figure 3—figure supplement 2
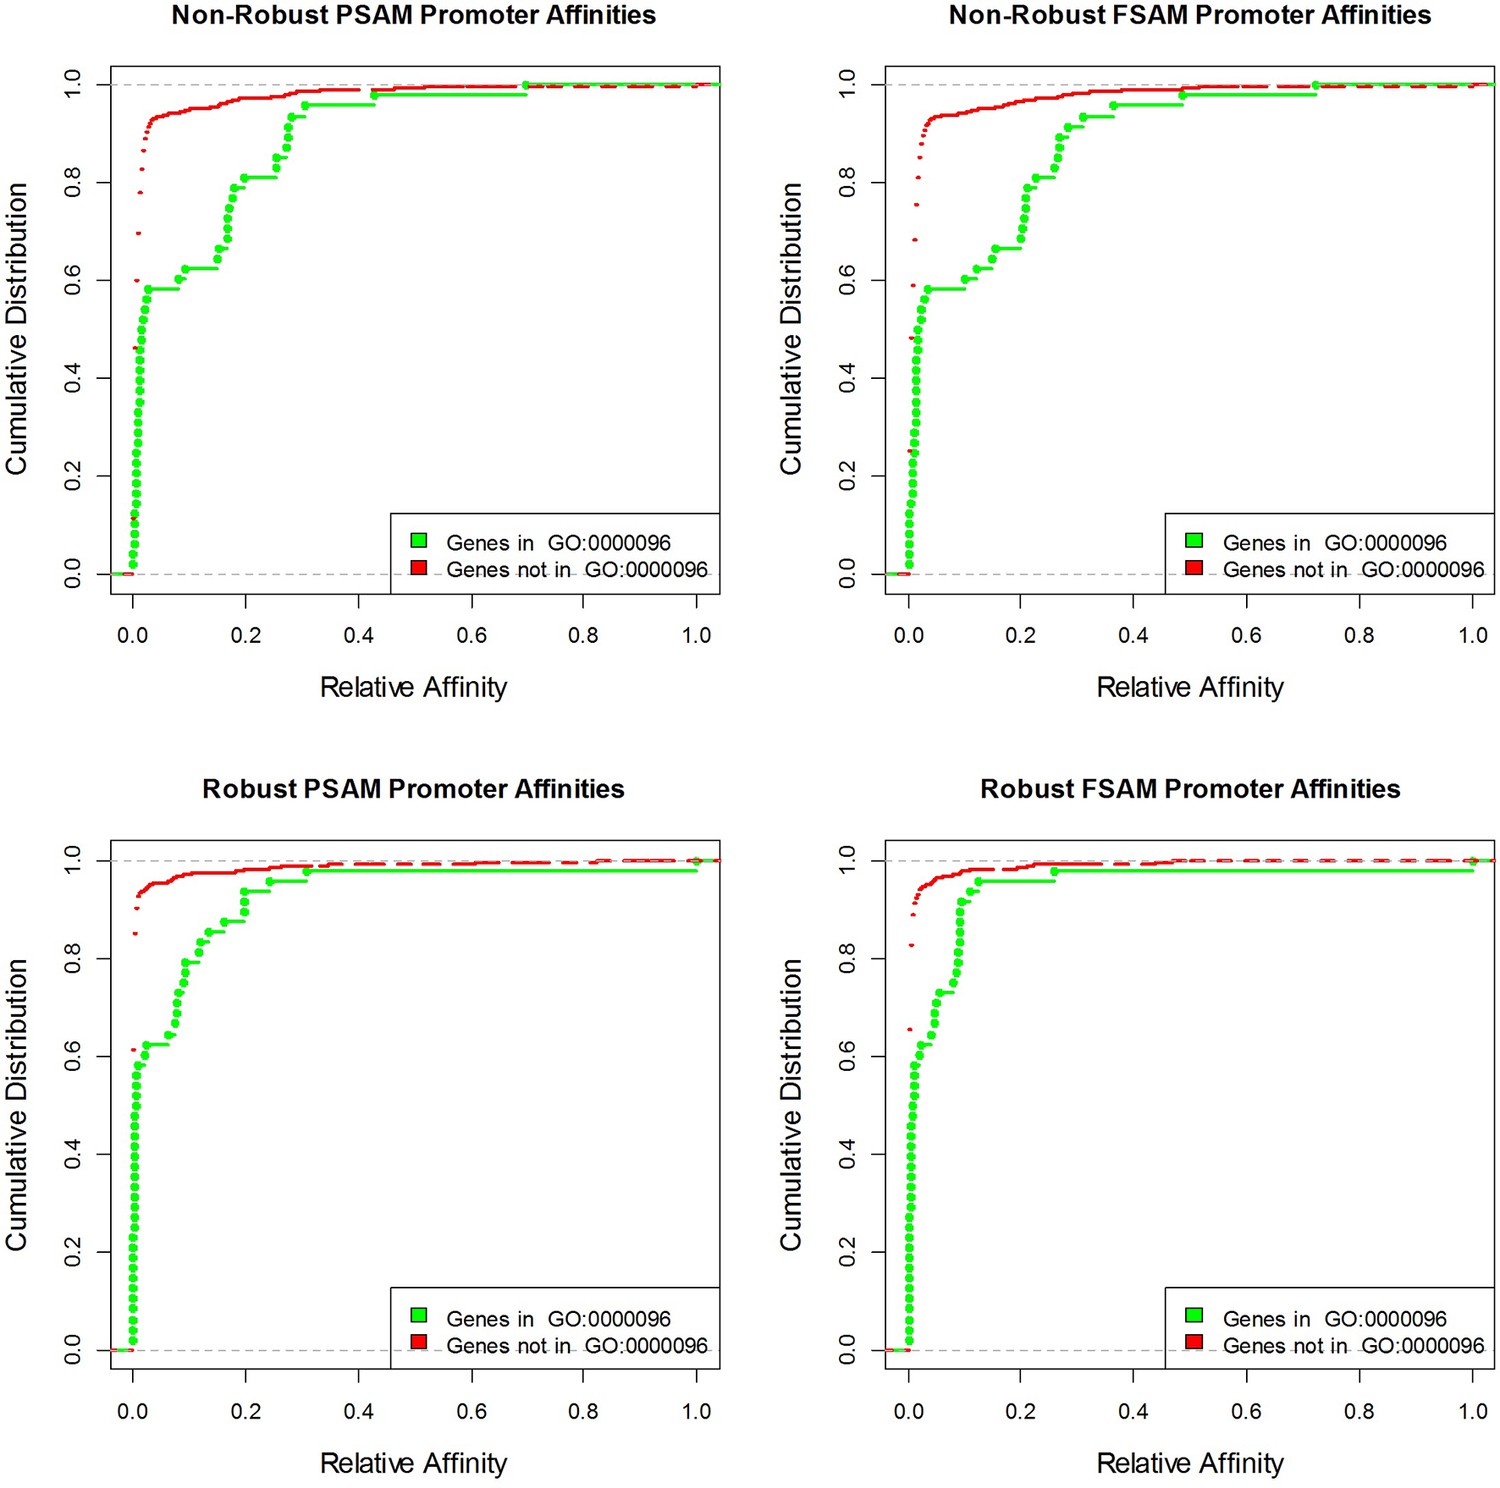
Cumulative distributions of yeast promoter affinities for Cbf1 using four different affinity models and the GO category with the highest association p-value ('sulfur compound metabolic process').
https://doi.org/10.7554/eLife.06397.008
Figure 4
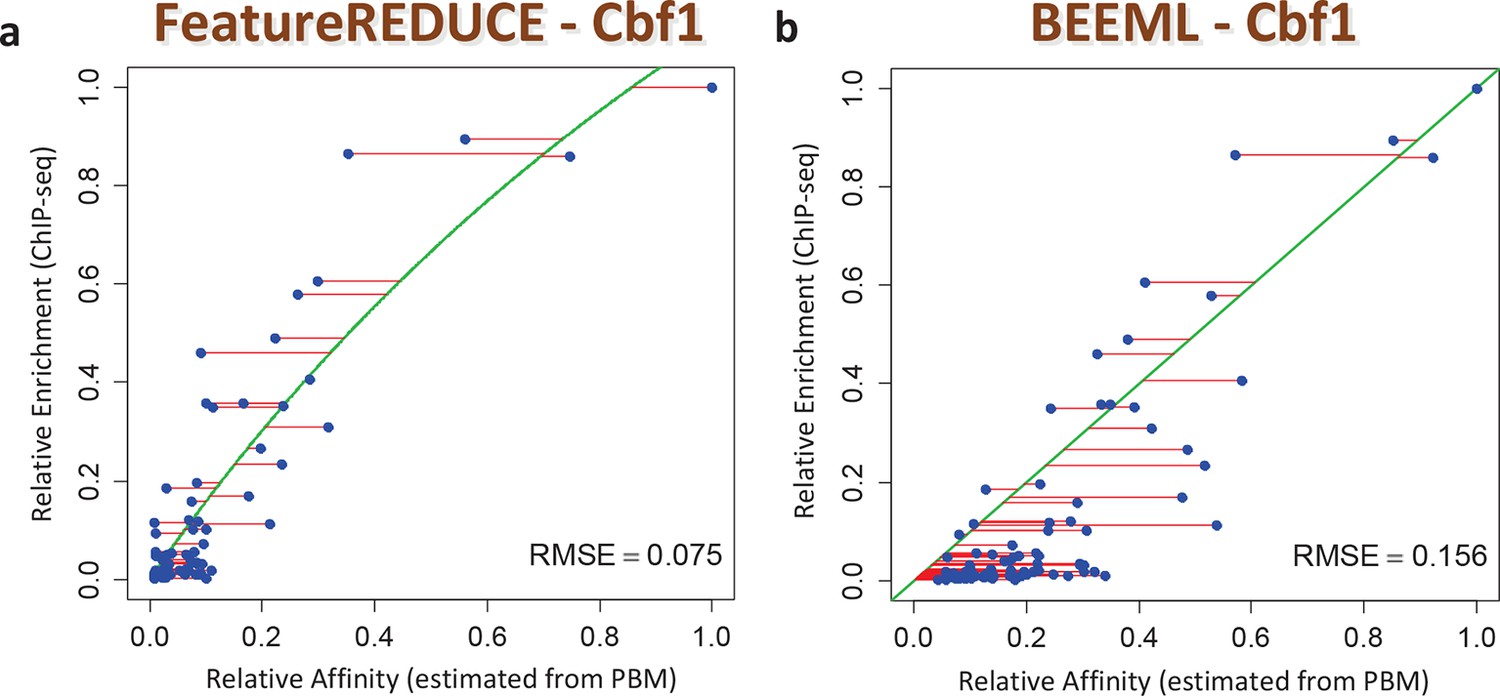
ChIP-seq based validation of position-specific affinity matrix (PSAM) inferred for Cbf1p.
(a) Direct comparison between relative affinities for 10-mers inferred from PBM intensities by FeatureREDUCE and relative in vivo occupancy at 955 genomic locations of type NNCACGTGNN (E-box with flanks) as measured by ChIP-seq (Zhou and O'Shea, 2011). Trimmed-mean (trim = 10%) ChIP-seq fold-enrichments were computed for all unique 10-mer sequences that occur at least three times in the genome. To account for saturation of higher-affinity binding sites, a basic equilibrium model (green curve) was fit with a single free-protein parameter. Red lines indicate the error between the observed and predicted relative ChIP enrichments. (b) The same plot for the BEEML-PBM algorithm (Zhao and Stormo, 2011). The same equilibrium model (green curve) was fit, but the optimal free protein concentration parameter was much lower than in (a), so the saturation is not apparent in this case.
Figure 5
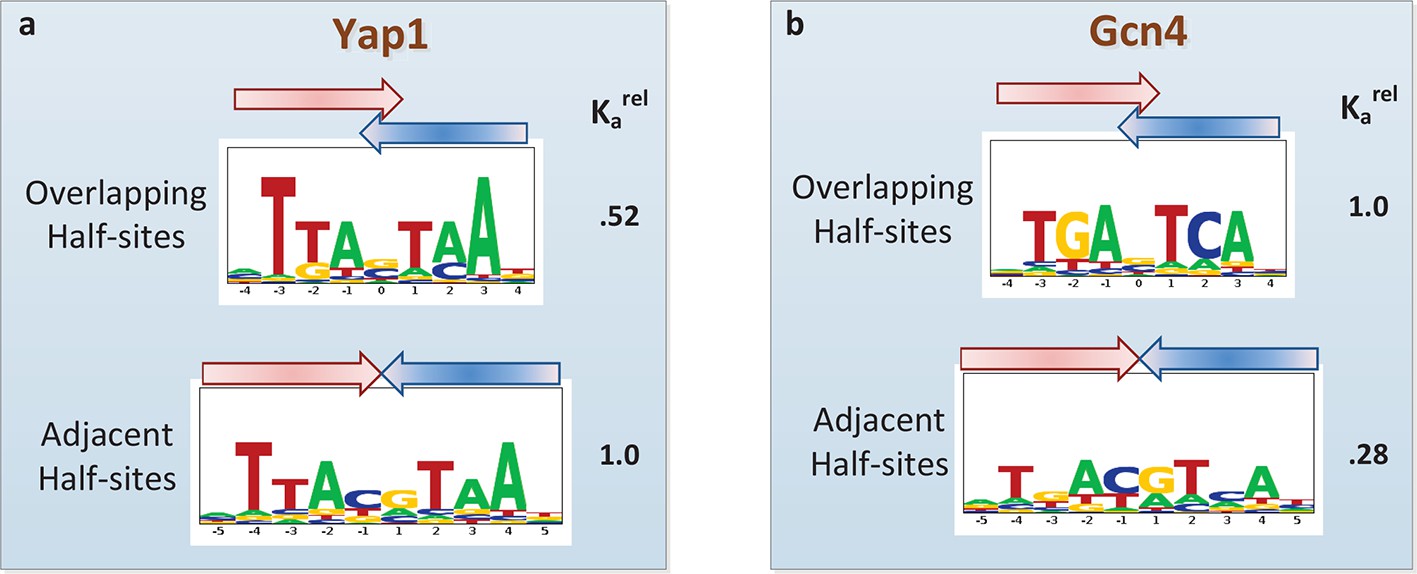
Quantifying the differential usage of alternative binding modes.
The transcription factors Yap1p (a) and Gcn4p (b) can each bind in two distinct modes, in which the two half-sites respectively do (top) and do not (bottom) overlap. Not only is the sequence of preferred half-site different between the two factors, the preferred binding mode is different too, as indicated by the relative association constant (Ka) inferred from the PBM data by FeatureREDUCE.
Download links
A two-part list of links to download the article, or parts of the article, in various formats.
Downloads (link to download the article as PDF)
Open citations (links to open the citations from this article in various online reference manager services)
Cite this article (links to download the citations from this article in formats compatible with various reference manager tools)
Building accurate sequence-to-affinity models from high-throughput in vitro protein-DNA binding data using FeatureREDUCE
eLife 4:e06397.
https://doi.org/10.7554/eLife.06397


