Corelease of acetylcholine and GABA from cholinergic forebrain neurons
- Howard Hughes Medical Institute, Harvard Medical School, United States
Figures
Figure 1

Optogenetic stimulation of cortical Chat+ fibers evokes fast, monosynaptic GABAA receptor-mediated currents.
(A) Low-magnification view of sagittal section from Chat i-Cre; Rosa26 lsl-ChR2-EYFP mouse forebrain. ChR2-EYFP (green) is expressed in the nucleus basalis (NB), globus pallidus externus (GP), striatum and cortex (Ctx). (B) Higher-magnification view of ChR2-EYFP expression combined with ChAT immunostaining (magenta) in frontal cortex (top) and nucleus basalis (bottom). Arrowheads indicate cells immunopositive for ChAT. (C) Example 2-photon stack from a layer 1 interneuron following whole-cell recording and dialysis with Alexa Fluor 594. (D) High-magnification view of ChR2-EYFP+ somata and fibers in layers 1 and 2/3 of frontal cortex. NeuN immunostain (magenta) highlights the distribution of neuronal somata across layers. Arrowhead indicates an example layer 1 interneuron surrounded by ChR2-EYFP fibers. (E) Example PSCs from voltage-clamp recordings of three different layer 1 interneurons in response to blue light stimulation (blue bar) of ChR2+ cholinergic fibers. Neurons were voltage-clamped at −70 mV (left) to isolate EPSCs or at 0 mV (middle and right) to isolate IPSCs. PSCs recorded in the presence of glutamate receptor antagonists CPP and NBQX are shown in black and after bath application of nAChR antagonists (MEC, MLA, and DHβE) in red. (F) Example light-evoked IPSCs from a layer 1 interneuron in a Chat i-Cre; Rosa26 lsl-ChR2-EYFP mouse voltage-clamped at 0 mV in the presence of CPP and NBQX (baseline) and following subsequent bath application of (from left to right) nAChR antagonists, TTX, 4AP, and SR95531. (G) Summary graph of IPSC peaks normalized to baseline (n = 5 cells from 4 mice). Asterisk, condition vs baseline p < 0.05, Mann–Whitney test). (H) Onset latencies for monosynaptic nEPSCs (n = 41 cells), monosynaptic IPSCs (n = 9 cells), and polysynaptic IPSCs (n = 19 cells from 9 mice). Mean (±sem) are shown in green. Asterisk, p < 0.05, Mann–Whitney test.
Figure 2
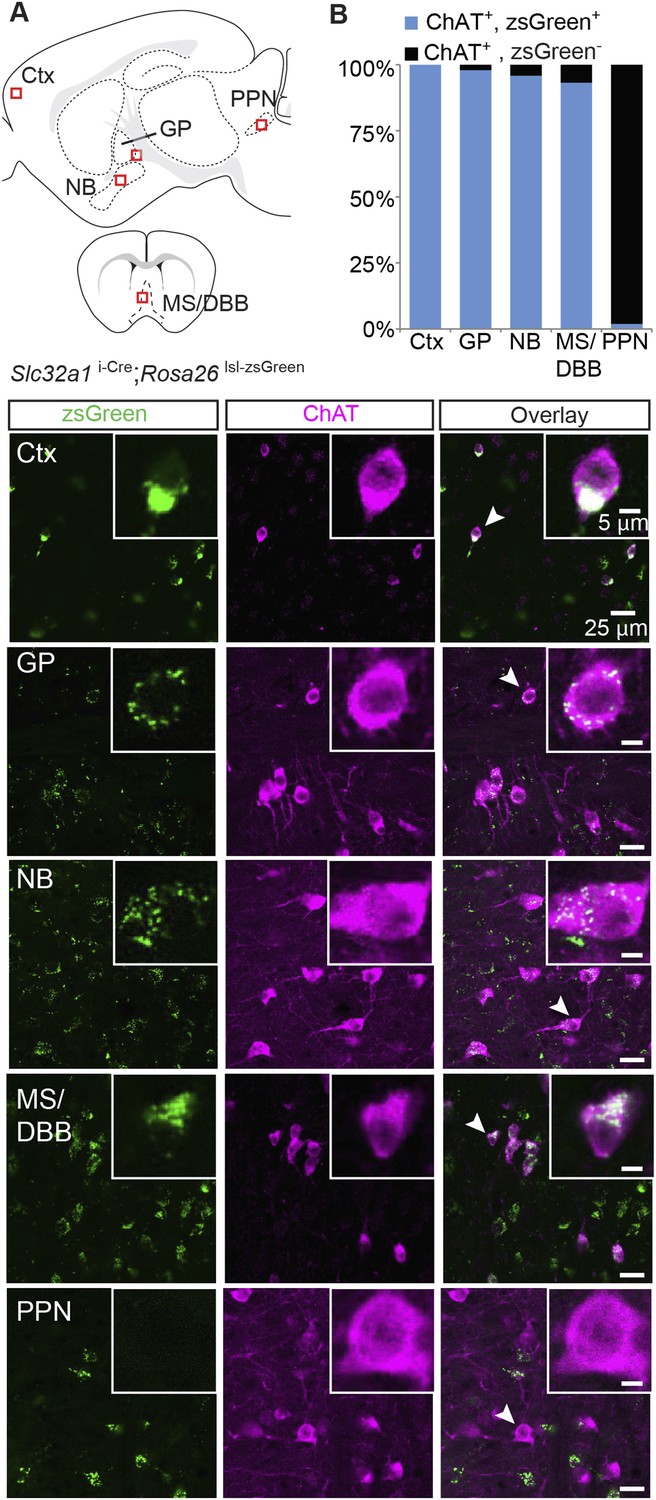
Immunopositive ChAT cells in the forebrain express Slc32a1.
(A) Top, sagittal and coronal schematic views of a mouse brain showing cholinergic regions of interest. Red boxes indicate approximate locations for magnified regions below. Bottom, example single-plane image from a confocal stack from sections of a Slc32a1i-Cre; Rosa26 lsl-zsGreen mouse immunostained for ChAT (magenta) and reporting Cre expression (green). Ctx, cortex; GP, globus pallidus externus; NB, nucleus basalis; MS/DBB, medial septum/diagonal band of broca; PPN, pedunculopontine nucleus. Insets show magnified view of individual neurons indicated by the white arrowhead. (B) Quantification of colocalization between cells expressing zsGreen Cre reporter and ChAT immunostain by brain region (zsGreen+/ChAT+, from 3 mice: Ctx, 628/628; GP, 238/243; NB, 598/624; MS/DBB, 560/601; PPN, 3/157).
Figure 3 with 1 supplement
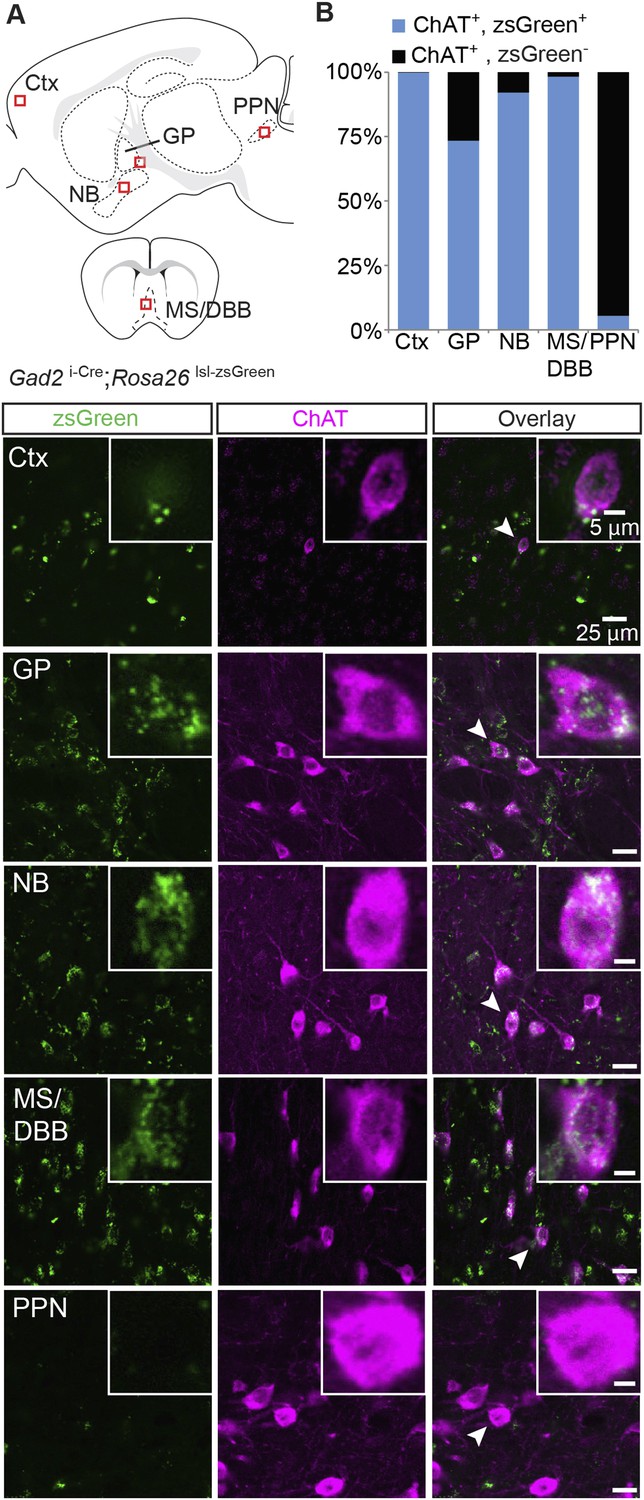
Immunopositive ChAT cells in the forebrain express Gad2.
(A) Top, sagittal and coronal schematic views of a mouse brain showing cholinergic regions of interest. Red boxes indicate approximate locations for magnified regions below. Bottom, example single-plane image from a confocal stack from sections of a Gad2 i-Cre; Rosa26 lsl-zsGreen mouse immunostained for ChAT (magenta) and reporting Cre expression (green). Ctx, cortex; GP, globus pallidus externus; NB, nucleus basalis; MS/DBB, medial septum/diagonal band of broca; PPN, pedunculopontine nucleus. Insets show magnified view of individual neurons indicated by the white arrowhead. (B) Quantification of colocalization between cells expressing zsGreen Cre reporter and ChAT immunostain by brain region (zsGreen+/ChAT+, from 4 mice: Ctx, 518/519; GP, 273/372; NB, 860/934;MS/DBB, 673/685; PPN, 6/110).
Figure 3—figure supplement 1

Immunopositive ChAT cells of the cortex but not major subcortical projections express Gad1.
(A) Top, sagittal and coronal schematic views of a mouse brain showing cholinergic regions of interest. Red boxes indicate approximate locations for magnified regions below. Bottom, example single-plane image from a confocal stack from sections of a Gad1GFP (green) mouse immunostained for ChAT (magenta). Ctx, cortex; GP, globus pallidus externus; NB, nucleus basalis; MS/DBB, medial septum/diagonal band of broca; PPN, pedunculopontine nucleus. Insets show magnified view of individual neurons indicated by the white arrowhead. (B) Quantification of colocalization between cells expressing GFP and ChAT immunostain by brain region (GFP+/ChAT+, from 4 mice: Ctx, 122/135; GP, 7/413; NB, 0/439;MS/DBB, 1/573; PPN, 12/246).
Figure 4
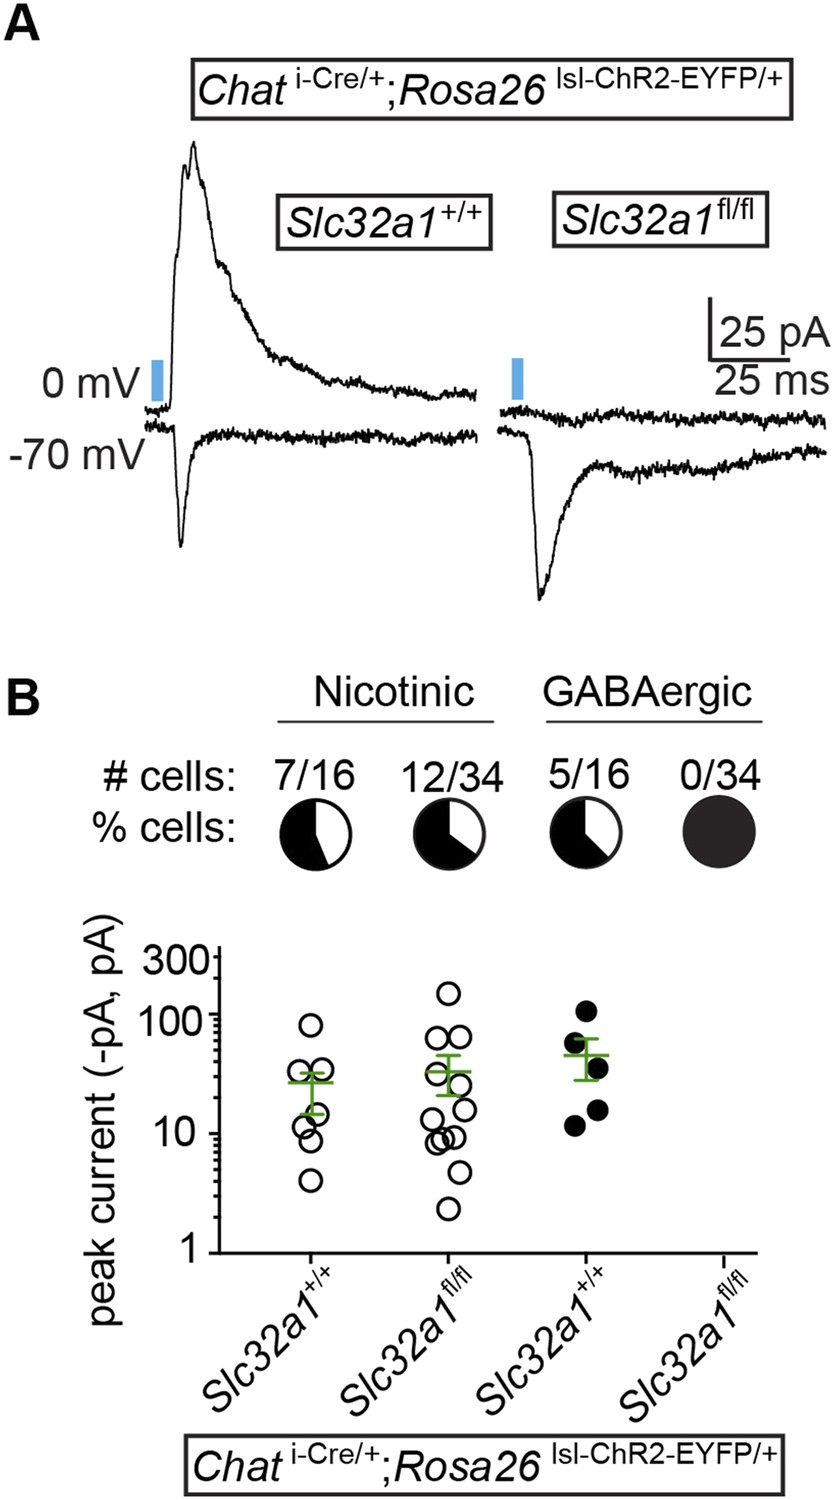
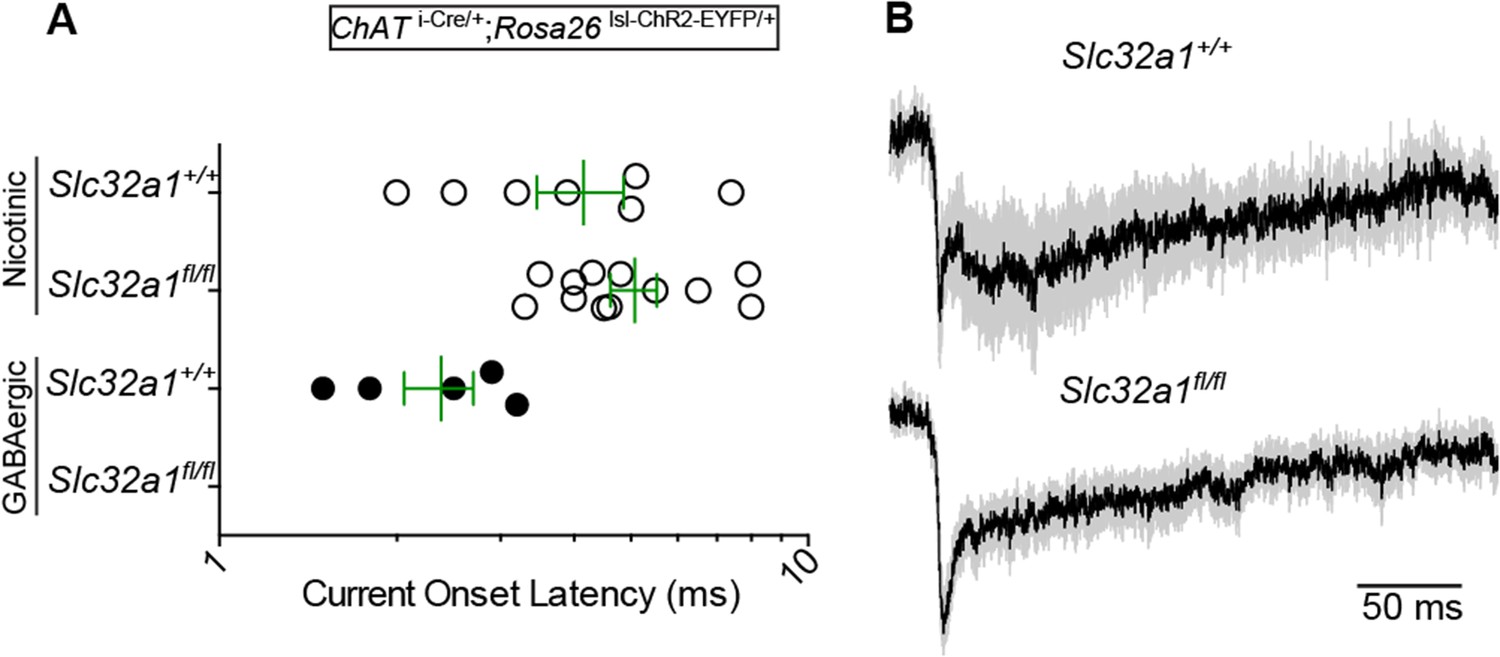
GABA release from cortical ChAT+ axons requires Slc32a1.
(A) Example light-evoked nEPSCs and IPSCs from four different layer 1 interneurons voltage-clamped at −70 or 0 mV from Chat i-Cre; Rosa26 lsl-ChR2-EYFP mice with wild-type cholinergic neurons (Slc32a1+/+) or conditional Slc32a1 knock-out (Slc32a1fl/fl). (B) Top, the number and proportion of layer 1 interneurons in which light-evoked nEPSCs or direct IPSCs were detected from Chat i-Cre; Rosa26 lsl-ChR2-EYFP mice with wild-type Slc32a1 alleles (Slc32a1+/+, from 2 mice) or following conditional Slc32a1 knock-out (Slc32a1fl/fl, from 4 mice). Bottom, PSC peaks for each condition. Means (±sem) are shown in green.
Author response image 1
Download links
A two-part list of links to download the article, or parts of the article, in various formats.
Downloads (link to download the article as PDF)
Open citations (links to open the citations from this article in various online reference manager services)
Cite this article (links to download the citations from this article in formats compatible with various reference manager tools)
Corelease of acetylcholine and GABA from cholinergic forebrain neurons
eLife 4:e06412.
https://doi.org/10.7554/eLife.06412


