Catastrophic chromosomal restructuring during genome elimination in plants
- University of California, Davis, United States
- Indian Institute of Science Education and Research, India
- Masaryk University, Czech Republic
- Howard Hughes Medical Institute, University of California, Davis, United States
Figures
Figure 1 with 1 supplement
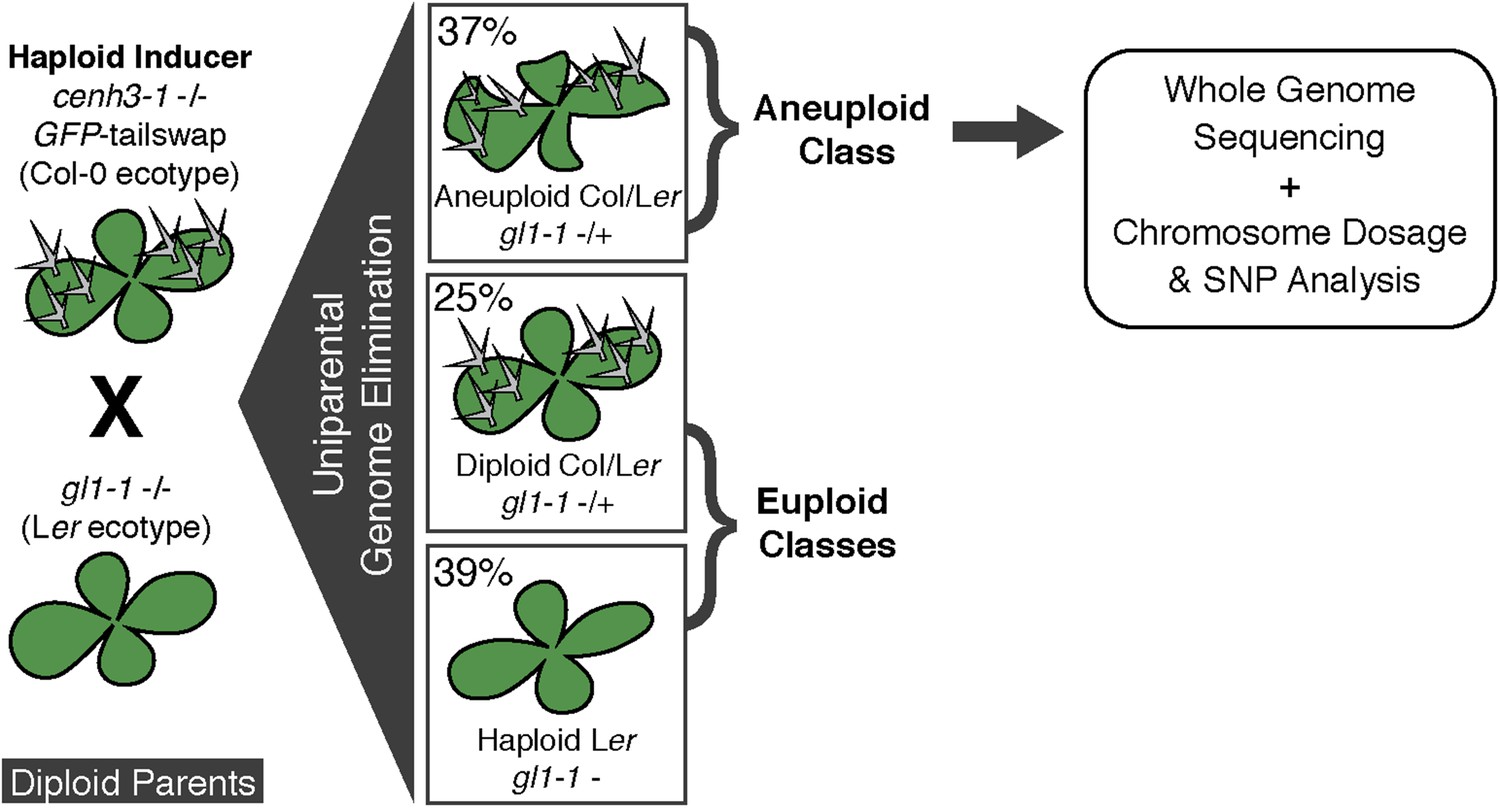
Ploidy types resulting from centromere-mediated uniparental genome elimination.
The altered CENH3 ‘GFP-tailswap’ strain was hybridized to the recessive glabrous1-1 mutant. Mean percentages of haploid, diploid and aneuploid progeny obtained from crosses to three independent GFP-tailswap lines are indicated, as determined after phenotypic characterization. Individuals belonging to the aneuploid class were sequenced and subjected to chromosome dosage and single nucleotide polymorphism (SNP) analysis as indicated by the arrow.
Figure 1—figure supplement 1
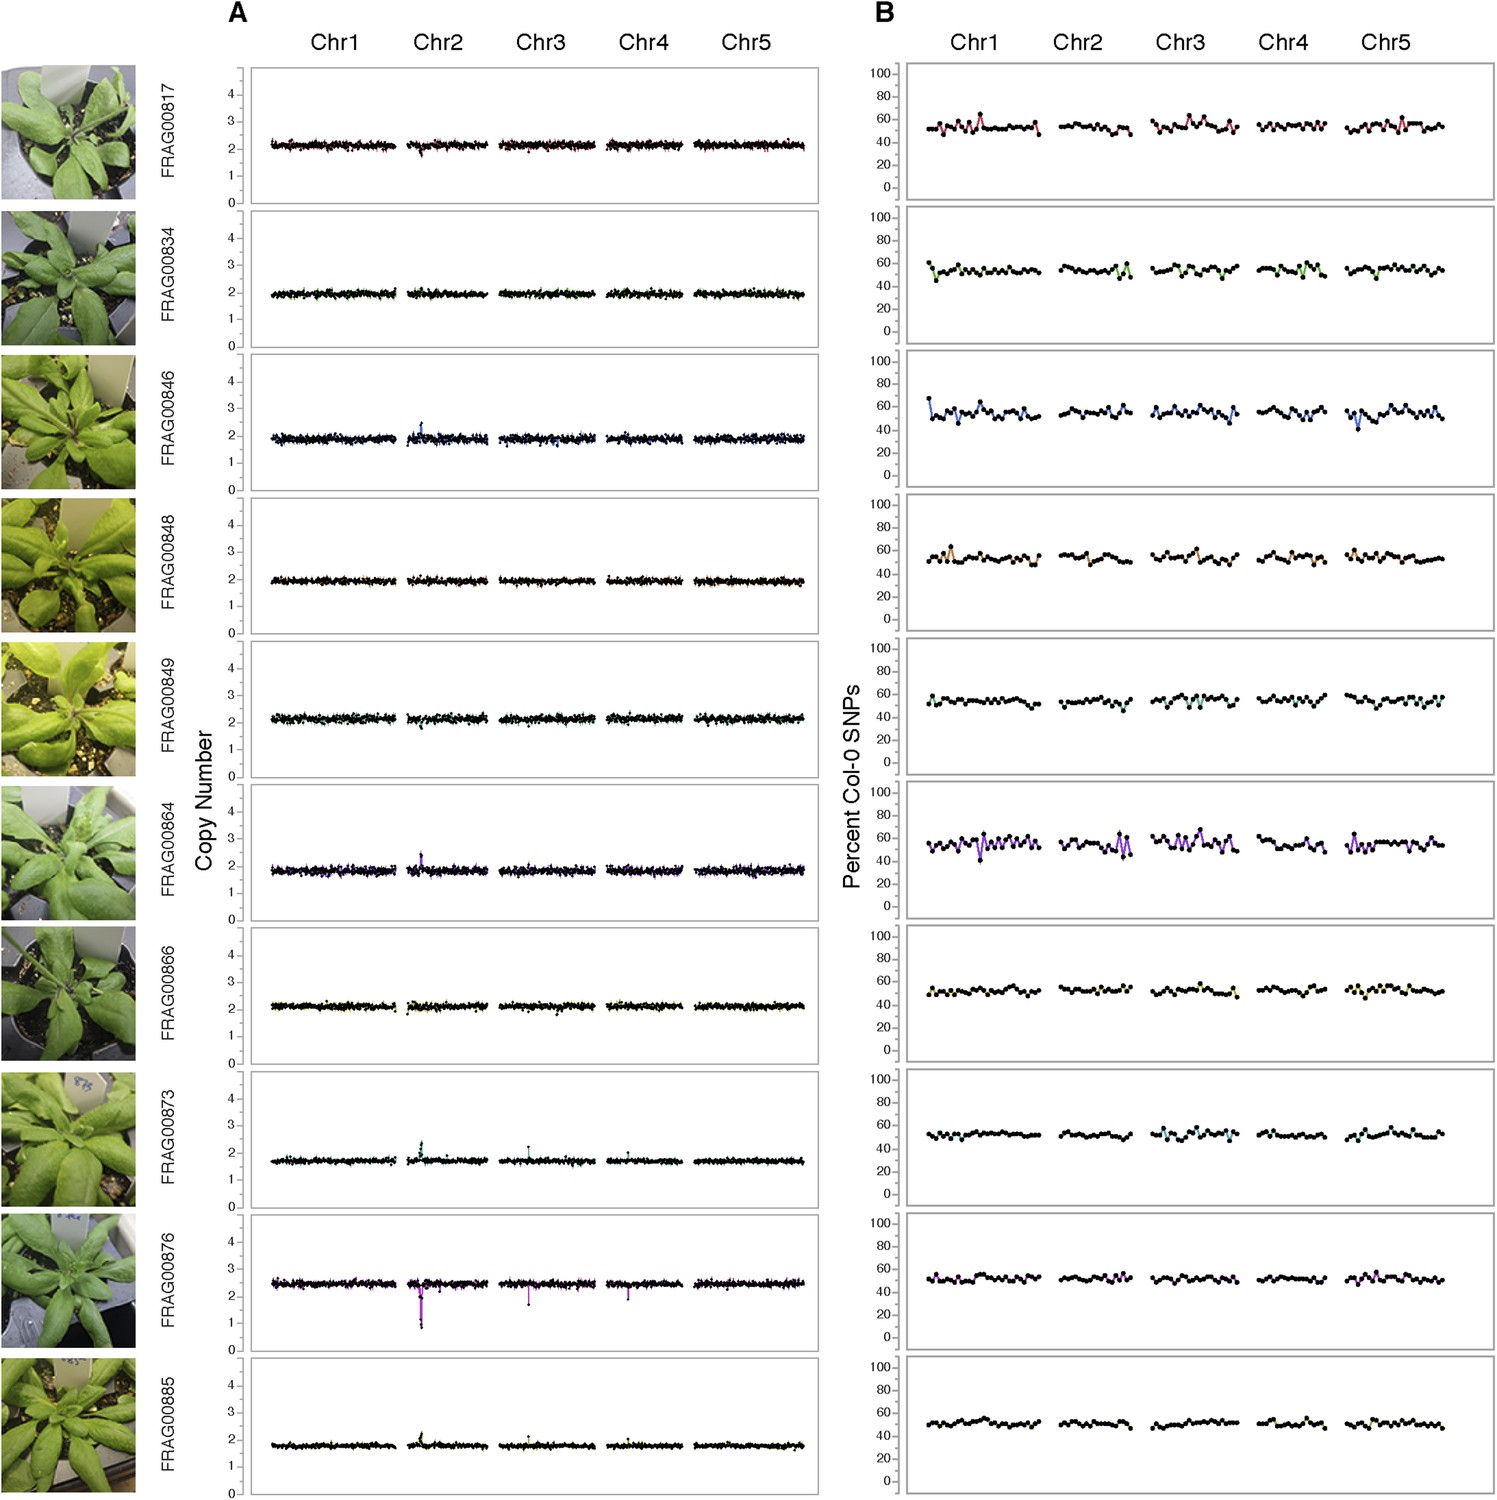
Dosage plots and SNP analysis of diploids from GFP-tailswap haploid induction crosses.
(A) Dosage plots from all five Arabidopsis chromosomes in consecutive non-overlapping 100 kbp bins. (B) The corresponding SNP plot for the % haploid inducer genome (Col-0) present in each sample.
Figure 2 with 4 supplements
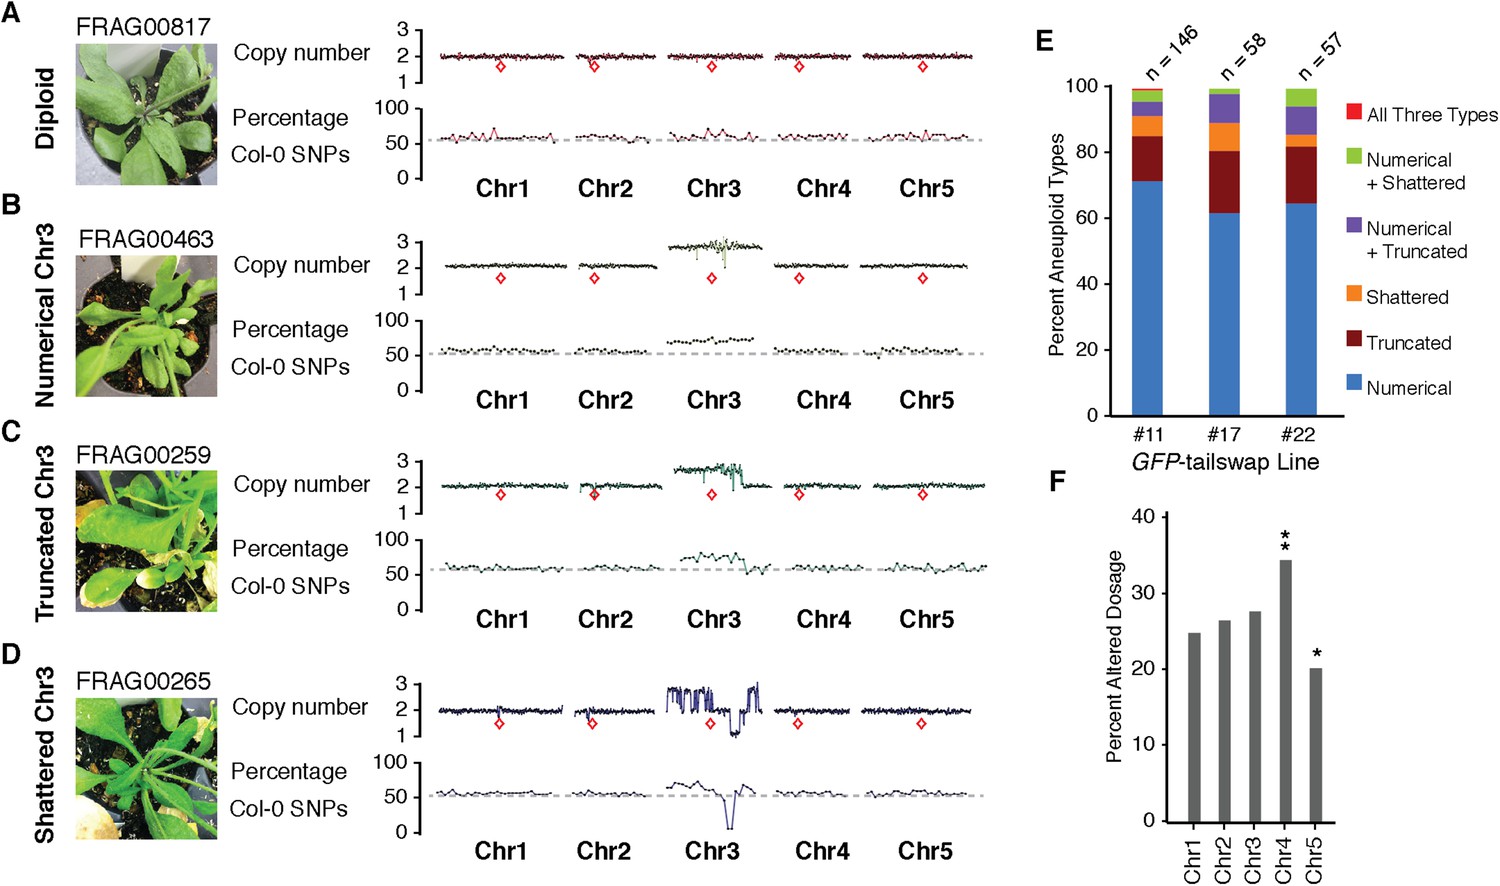
Characterization of the three distinct aneuploid types from GFP-tailswap haploid induction crosses.
(A–D) Dosage plots from all five Arabidopsis chromosomes in consecutive non-overlapping 100 kbp bins and the corresponding SNP plot for the % haploid inducer genome (Col-0) present in each sample. A diploid Col/Ler hybrid (A), an individual with primary Chr3 trisomy from the numerical aneuploid class (B), an individual with a truncated trisomic Chr3 (C) and an individual with shattered Chr3 (D) are shown here. Centromere positions are indicated by red diamonds. (E) Percentages of the different aneuploid types obtained from three different GFP-tailswap haploid inducer lines. (F) For each chromosome, the percentage of aneuploid individuals exhibiting altered dosage for that particular chromosome is plotted. All aneuploids characterized in this study are included. Chr4 is overrepresented (**Student's t-test, p < 0.01) while Chr5 is underrepresented (* Student's t-test, p < 0.05).
Figure 2—figure supplement 1
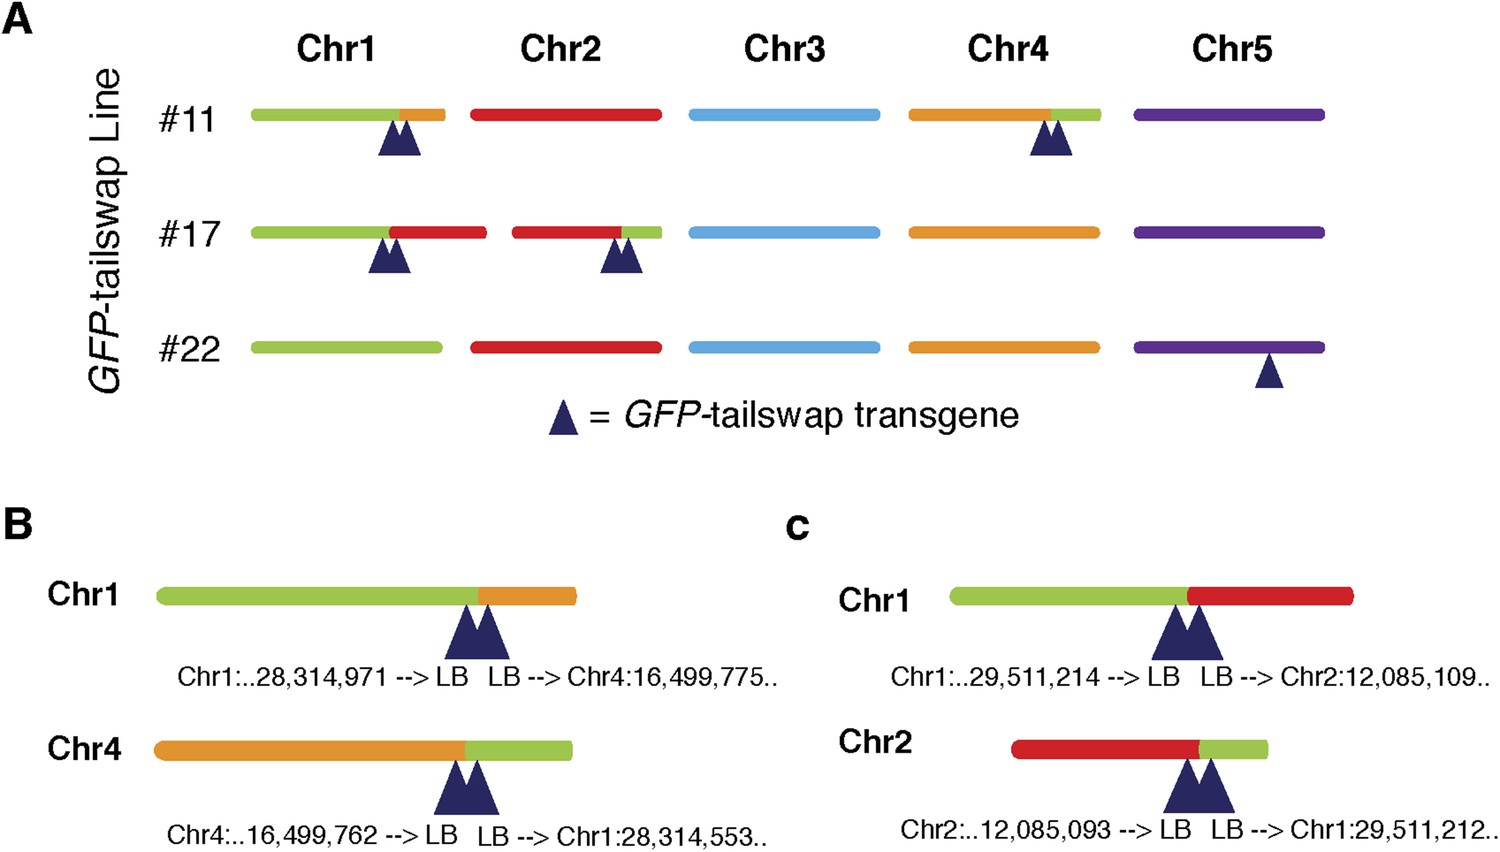
Copy number and T-DNA positions of the GFP-tailswap transgene in three independently derived transgenic lines.
(A) The three lines used in this study and the insertion sites for each GFP-tailswap transgene are shown. Lines #11 and #17 carry four copies of the transgene and the transformation event resulted in a reciprocal translocation of Chr1 and Chr4 for #11 and Chr1 and Chr2 for #17. Line #22 carries a single copy insertion on Chr5. (B, C) Exact positions of the insertion sites for line #11 (B) and line #17 (C). T-DNA left borders are denoted by ‘LB’.
Figure 2—figure supplement 2
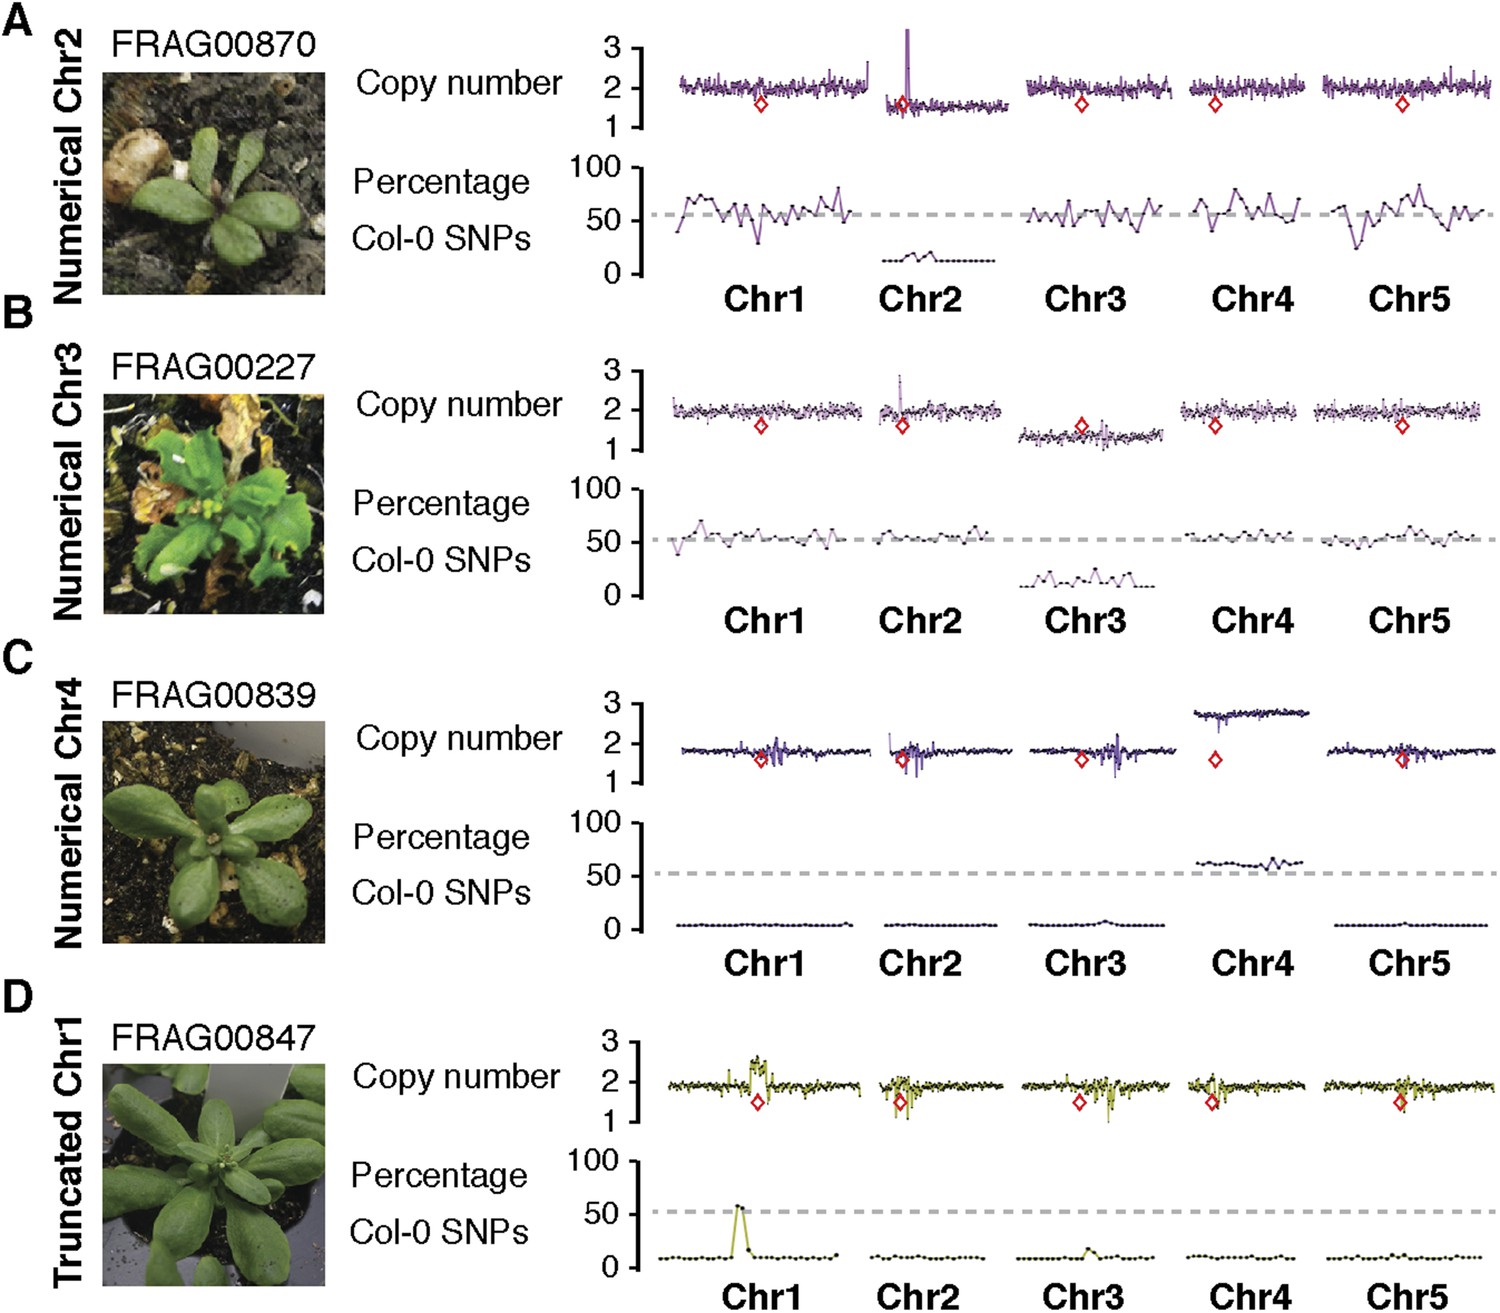
Dosage plots and SNP analysis of atypical aneuploids from GFP-tailswap haploid induction crosses.
(A–D). Dosage plots from all five Arabidopsis chromosomes in consecutive non-overlapping 100 kbp bins and the corresponding SNP plot for the % haploid inducer genome (Col-0) present in each sample. A monosomic Chr2 and Chr3 individual with 2n = 10 – 1 chromosomes (A, B), a disomic Chr4 individual with 2n = 5 + 1 chromosomes (C) and a haploid individual with a Chr1 minichromosome (truncated class) derived from the haploid inducer genome (D) are shown. The unusually high dosage spike around the centromere of Chr2 in FRA00870 (A) results from monosomy for Chr2. Ler sequences are mapped to the Col-0 genomic reference followed by normalization to our diploid control F1 hybrid Col/Ler. Euploid chromosome dosage plots for haploids with disomic chromosomes or minichromosomes (C, D) have the appearance of having a copy number of 2 only because euploid chromosome dosage was calculated with the value of 2 in this analysis. Centromere positions are indicated by red diamonds.
Figure 2—figure supplement 3
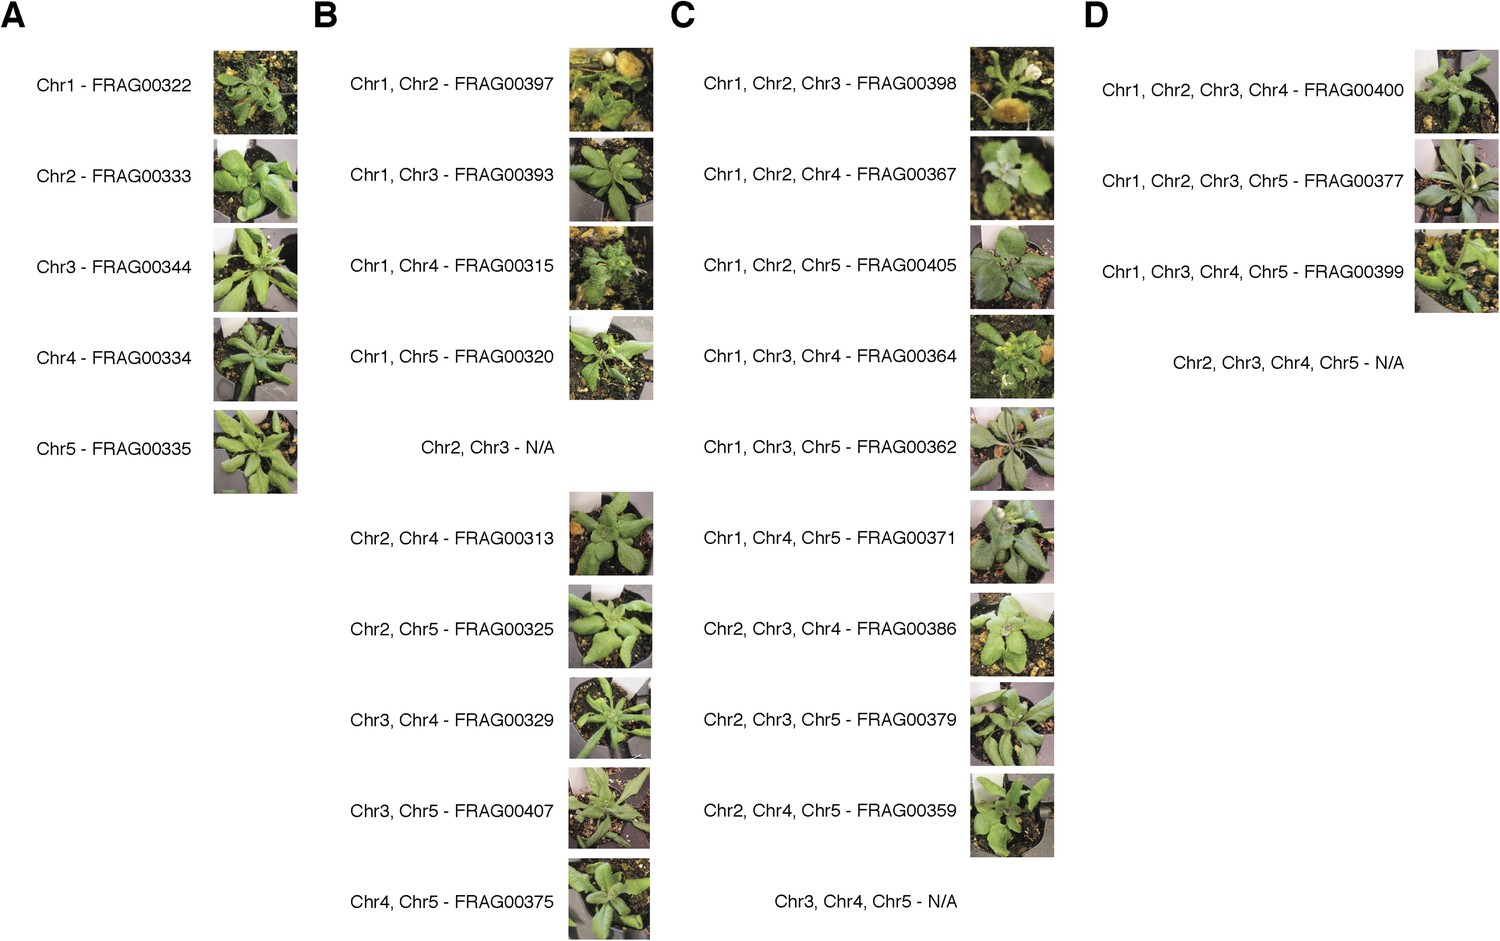
Diversity of primary trisomic aneuploids derived from a selfed triploid (Col-0 ecotype).
(A) Primary trisomics (2n = 10 + 1) for all five Arabidopsis chromosomes. (B–D) Higher order primary trisomics from our analysis. We observed (B) double primary trisomics (2n = 10 + 1 + 1), (C) triple primary trisomics (2n = 10 + 1 + 1 + 1) as well as (D) quadruple primary trisomics (2n = 10 + 1 + 1 + 1 + 1). ‘N/A’ indicates the karyotypes that were not observed in this population.
Figure 2—figure supplement 4

Representative dosage plots from 96 individuals from a selfed GFP-tailswap haploid inducer.
Representative dosage plot of diploid individuals (94/96 = 98%) showing a euploid dosage from all five Arabidopsis chromosomes. We detected two selfed individuals with numerical whole chromosome primary trisomies (2n + 1) for Chr2 and Chr3, which are shown here.
Figure 3
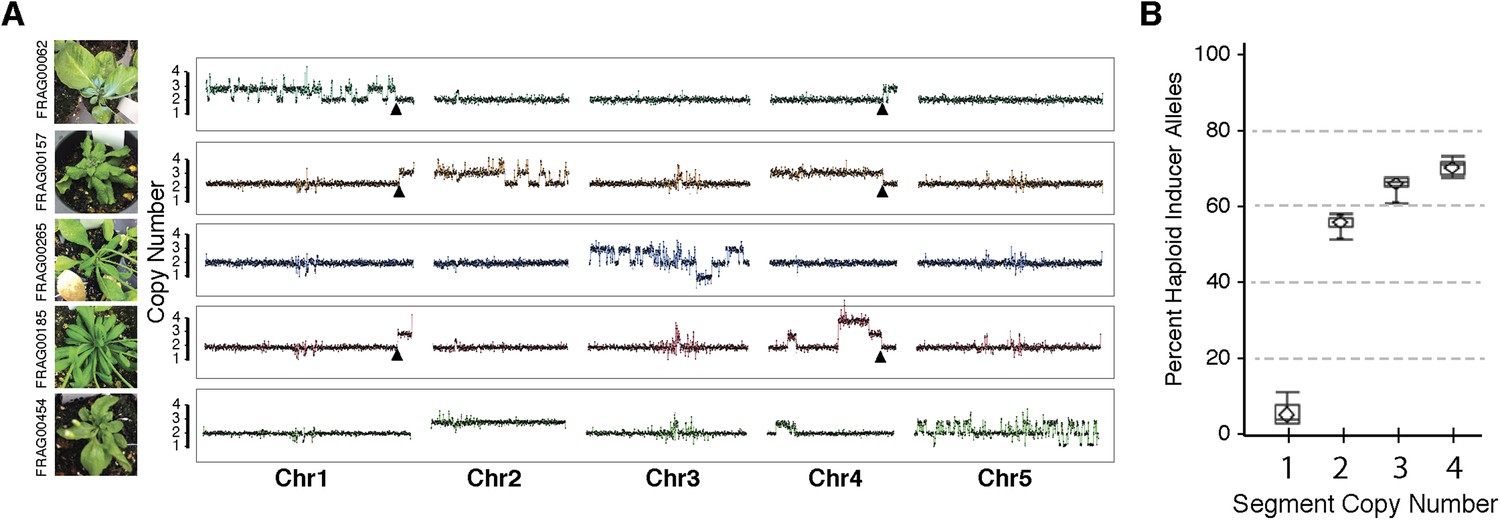
Shattered chromosomes are confined to a single chromosome originating from the haploid inducer.
(A) Chromosome dosage plots based on non-overlapping 25 kbp bins across each chromosome for five aneuploid individuals with shattered chromosomes. The GFP-tailswap transgene insertion event that resulted in a reciprocal translocation between Chr1 and Chr4 in one of the haploid inducer parent (GFP-tailswap #11) is indicated with black arrowheads. The translocation is only visible in individuals for which chromosomes 1 and 4 are not balanced with each other. Duplications (copy number 3), triplications (copy number 4) as well as deletions accompanied with loss of heterozygosity (copy number 1) were observed from dosage plots. (B) Box plots of the percentage of haploid inducer genome present at each copy number state, as determined by the SNP analysis. Mean and standard errors are shown.
Figure 4 with 2 supplements
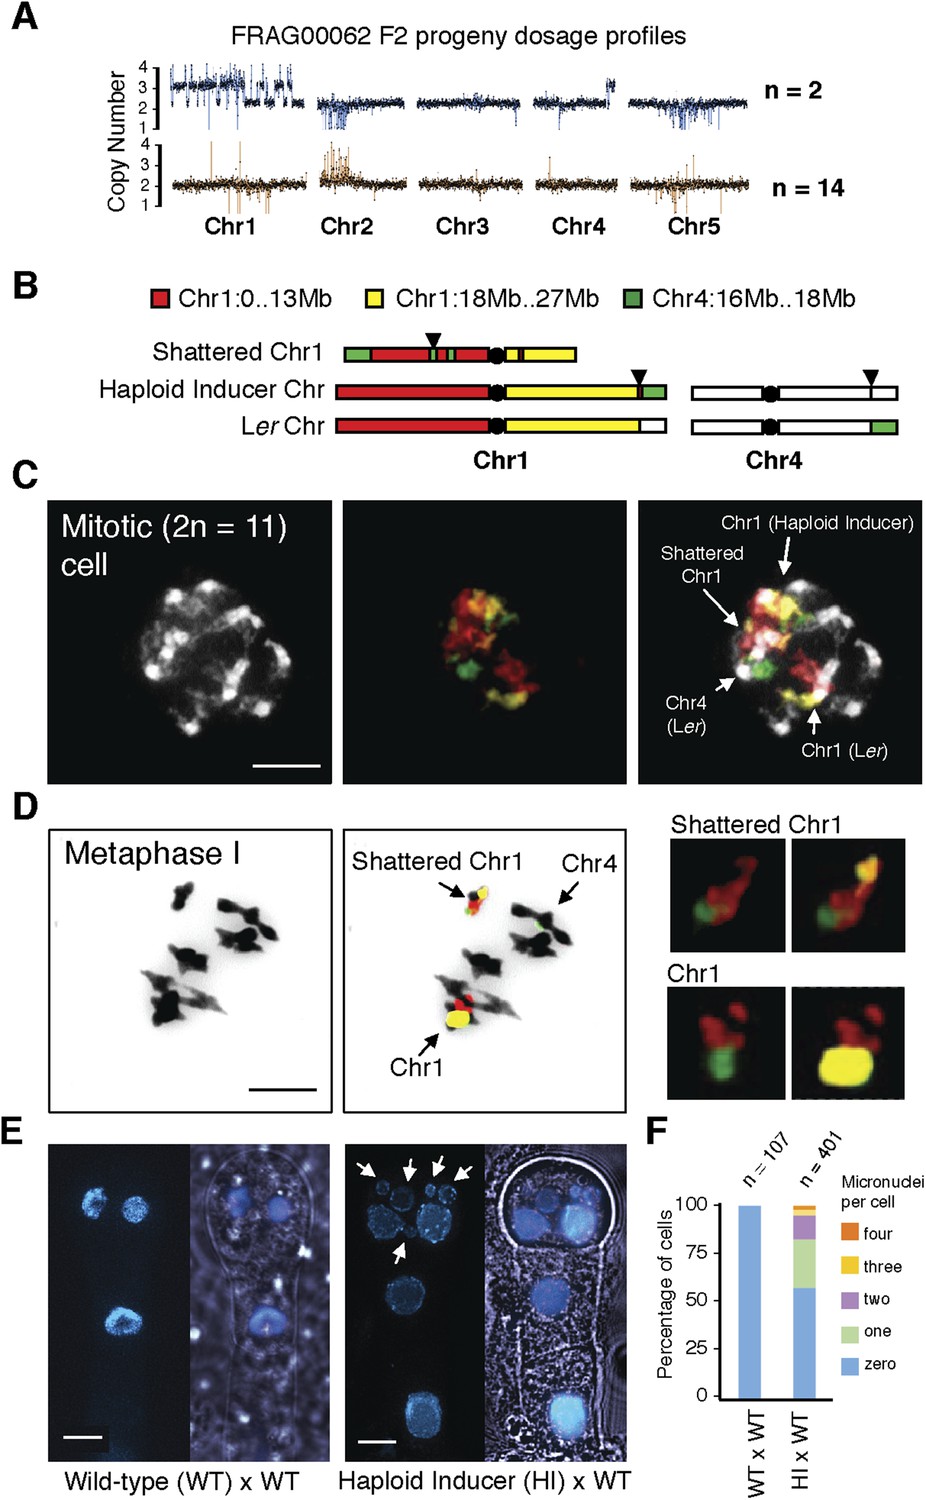
Stable inheritance and chromosome painting of a shattered aneuploid chromosome.
(A) Dosage analysis from 16 F2 individuals from a selfed FRAG00062 individual. Progeny individuals either inherited the shattered chromosome intact (n = 2) or appeared diploid (n = 14). (B) Cartoon of the different versions of chromosomes 1 and 4 expected to be present in FRAG00062. Chromosome painting probes and corresponding chromosome positions used for (C) and (D) are shown. Black triangles indicate the position of the reciprocal Chr1/Chr4 translocation present in the haploid inducer line, whereas black circles indicate centromere positions. (C) A mitotic cell from FRAG00062 with 11 chromosomes, including four painted chromosomes. Scale bar = 5 μm. (D) The shattered Chr1 from FRAG00062 remains unpaired at meiosis as shown here at Metaphase I. Enlargements of the shattered Chr1 and paired Chr1 are shown on the right. Scale bar = 5 μm. (E) Nuclei from a two-cell stage embryo from a wild-type cross (left panel) and from an embryo undergoing uniparental genome elimination (right panel). Nuclei are visualized using CFP-tagged histone H2B from the pollen parent superimposed with an image of the embryo visualized under light microscopy. Note the presence of micronuclei from the embryo undergoing genome elimination (right panel). Scale bar = 5 μm. (F) Percentage of micronuclei observed in wild-type crosses and genome elimination crosses. The different percentages of micronuclei per cell are indicated.
Figure 4—figure supplement 1
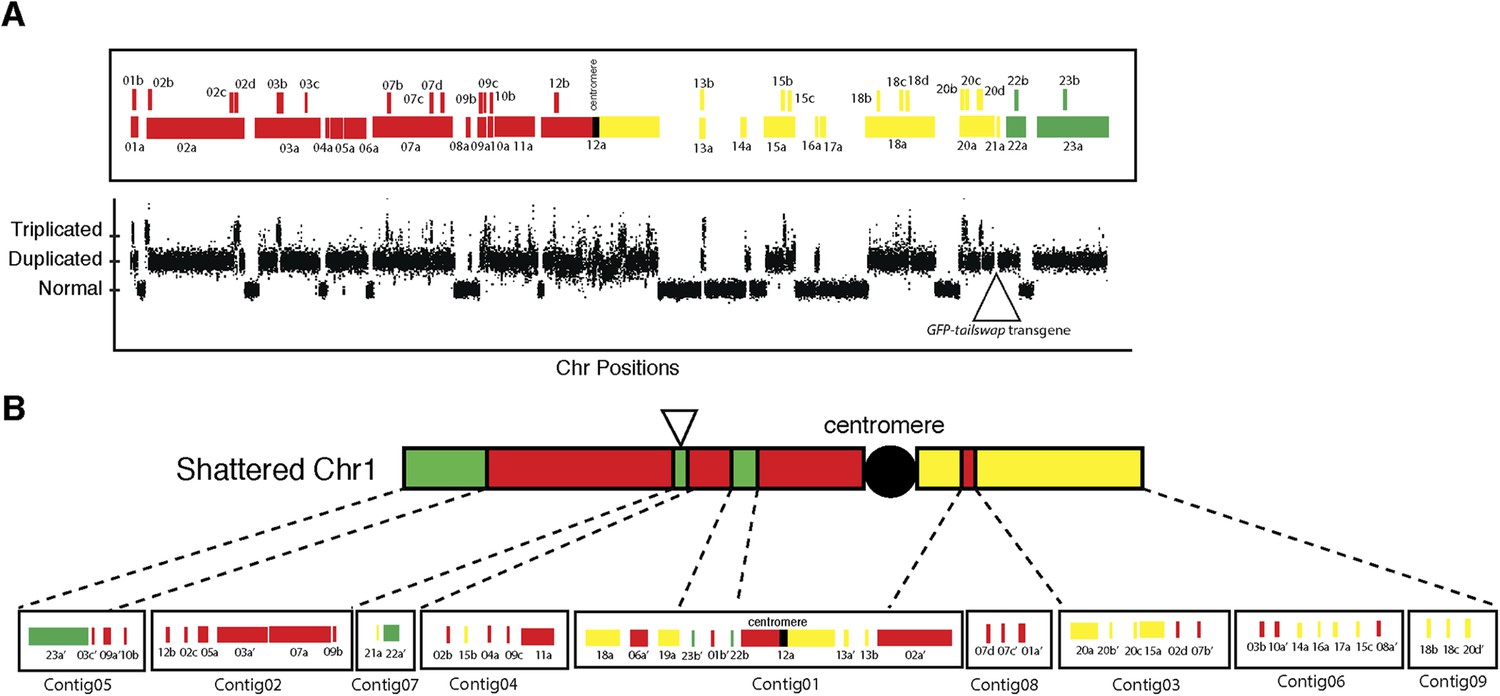
Analysis of duplicated and triplicated blocks from FRAG00062.
(A) Cartoon of duplicated and triplicated blocks on the shattered aneuploid chromosome from FRAG00062. (B) Rearranged pattern from DNA fluorescence in situ hybridization (FISH) with the corresponding de novo assembled contigs.
Figure 4—figure supplement 2
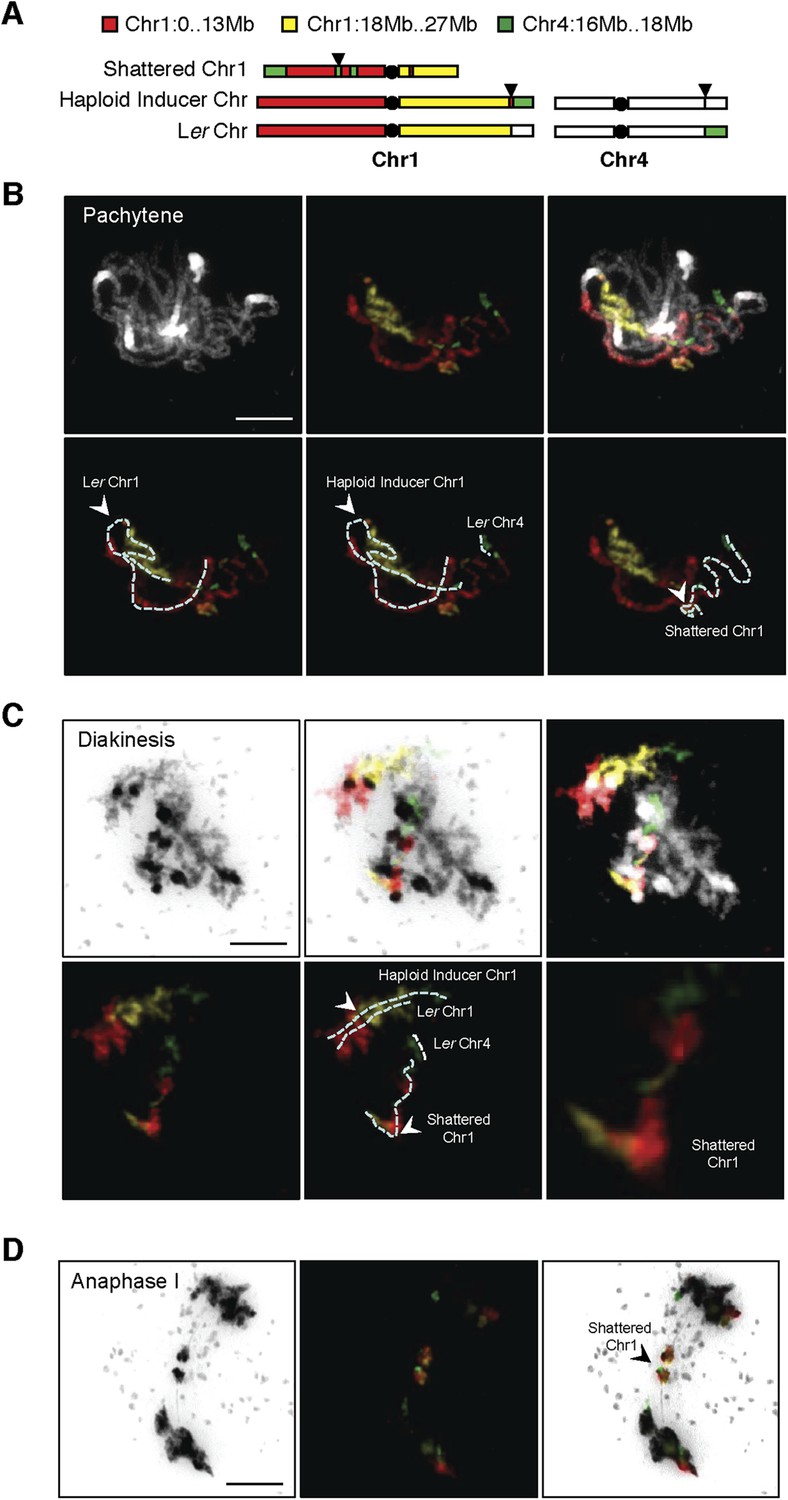
DNA FISH on the shattered aneuploid chromosome from FRAG00062.
(A) Cartoon of the regions used for chromosome painting experiments. (B–D) Meiotic spreads from male meiocytes with DNA painting probes shown in (A). Scale bars = 5 μm. The unpaired shattered chromosome is visible in Pachytene (B) and Diakinesis (C) and separate precociously at Anaphase I (D).
Figure 5 with 2 supplements
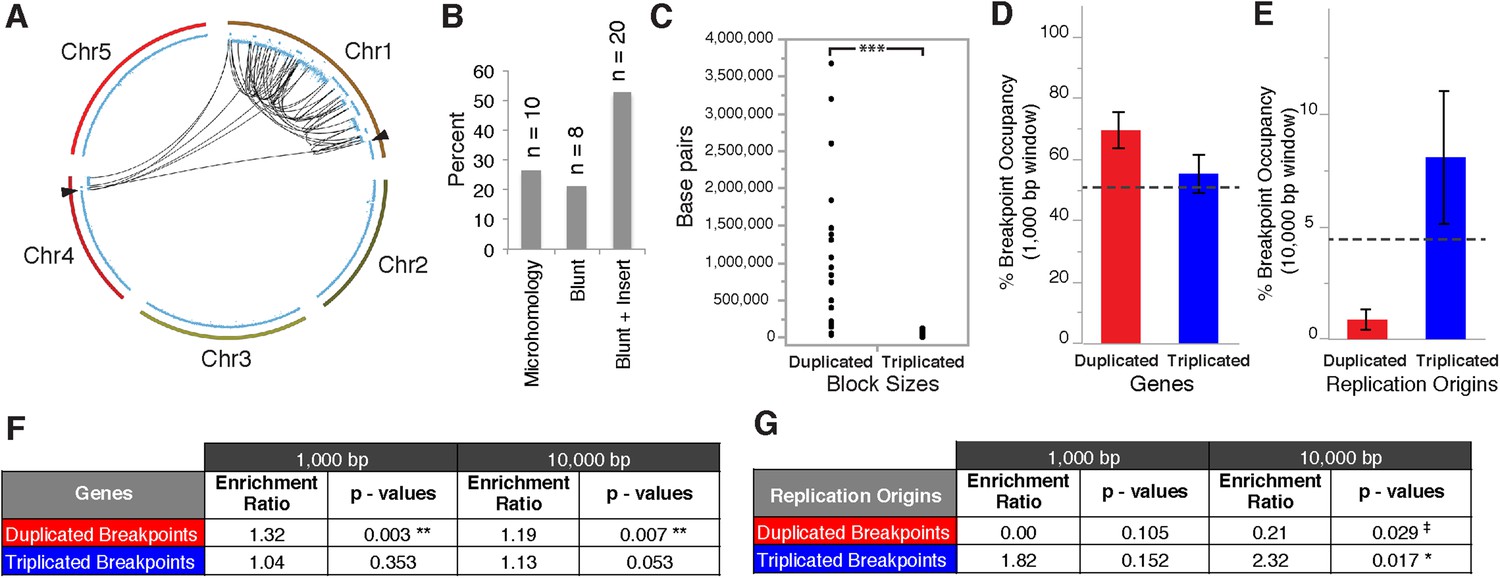
Breakpoint junctions and enriched features surrounding breakpoints of duplicated and triplicated blocks.
(A) Plot of all chromosomes and corresponding dosage plots (blue line) from FRAG00062. Black curves depict novel junctions identified from genomic reconstruction of the shattered haploid inducer Chr1. Black triangles indicate the reciprocal translocation between Chr1 and Chr4 from the haploid inducer genome. (B) Percentage of junctions with 2–15 bp of microhomology, blunt junctions or junctions with unidentified sequence insertion observed from FRAG00062. (C) Plot of duplicated (n = 23) and triplicated (n = 23) block sizes from FRAG00062. (*** Student's t-test p < 0.001). (D, E) Occupancy of genes and replication origins around breakpoints regions, calculated using windows of 1000 bp or 10,000 bp centered on each breakpoint. Dashed horizontal lines indicate the genome-wide occupancy of each feature. Error bars indicate standard error. (F, G) Enrichment ratio of genes and replication origins (See methods for description of enrichment ratio). Genes (F) are significantly enriched surrounding duplicated breakpoints regardless of window size (1000 or 10,000 bp, **p < 0.01). For windows of 10,000 bp, replication origins (G) are significantly enriched at triplicated breakpoints (*p < 0.05) while significantly under-represented (‡p < 0.05) at duplicated breakpoints.
Figure 5—figure supplement 1
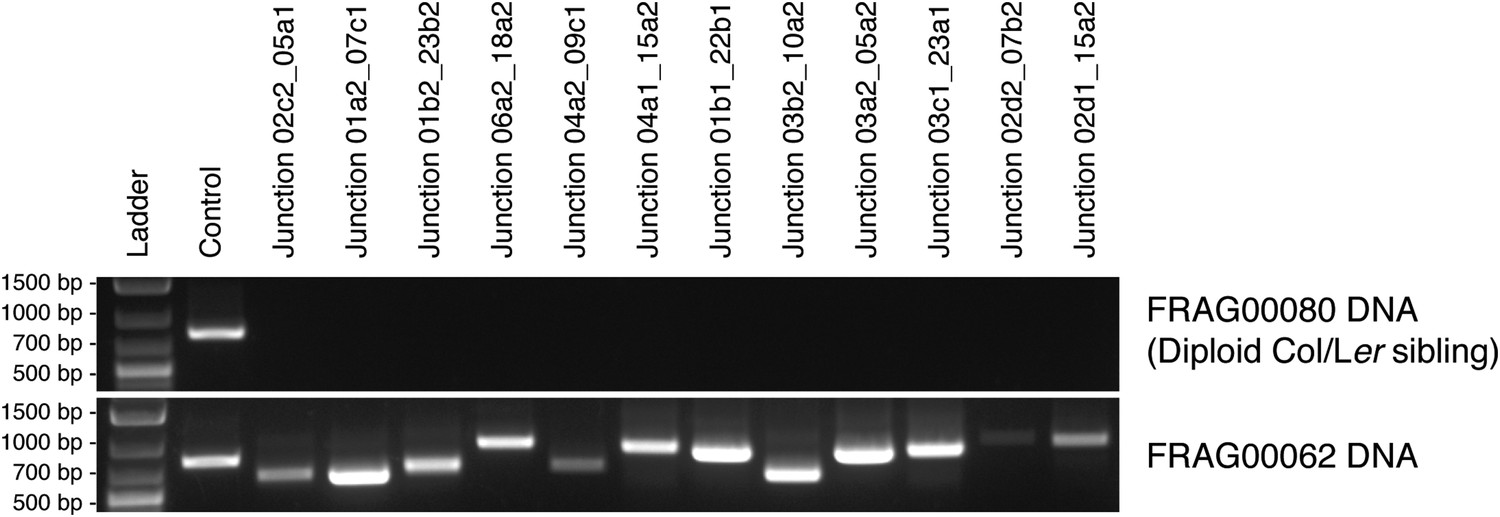
PCR confirmation of breakpoint junctions for FRAG00062.
DNA gel showing PCR assays performed using oligo pairs from a control region and from breakpoint junctions specific to FRAG00062 using DNA from a diploid sibling (top panel) or FRAG00062 (bottom panel).
Figure 5—figure supplement 2

Breakpoint junctions types from FRAG00062.
(A, B). Top: Junction sequence from direct sequencing of breakpoint junctions. Middle and bottom: Reference A. thaliana sequence. Sequences in common with the junction sequence are in blue and red. (+) denote sequences that align to the forward strand of the reference genome while (−) denote sequences that align to the reverse strand. Regions of microhomology are highlighted in yellow (A). Inserted sequence is highlighted in green (B). (C) Distribution of the sizes of microhomology tracts from breakpoints junctions. (D) Distribution of the sizes of unidentified inserted DNA sequences from breakpoint junctions grouped in 25 bp bins.
Figure 6
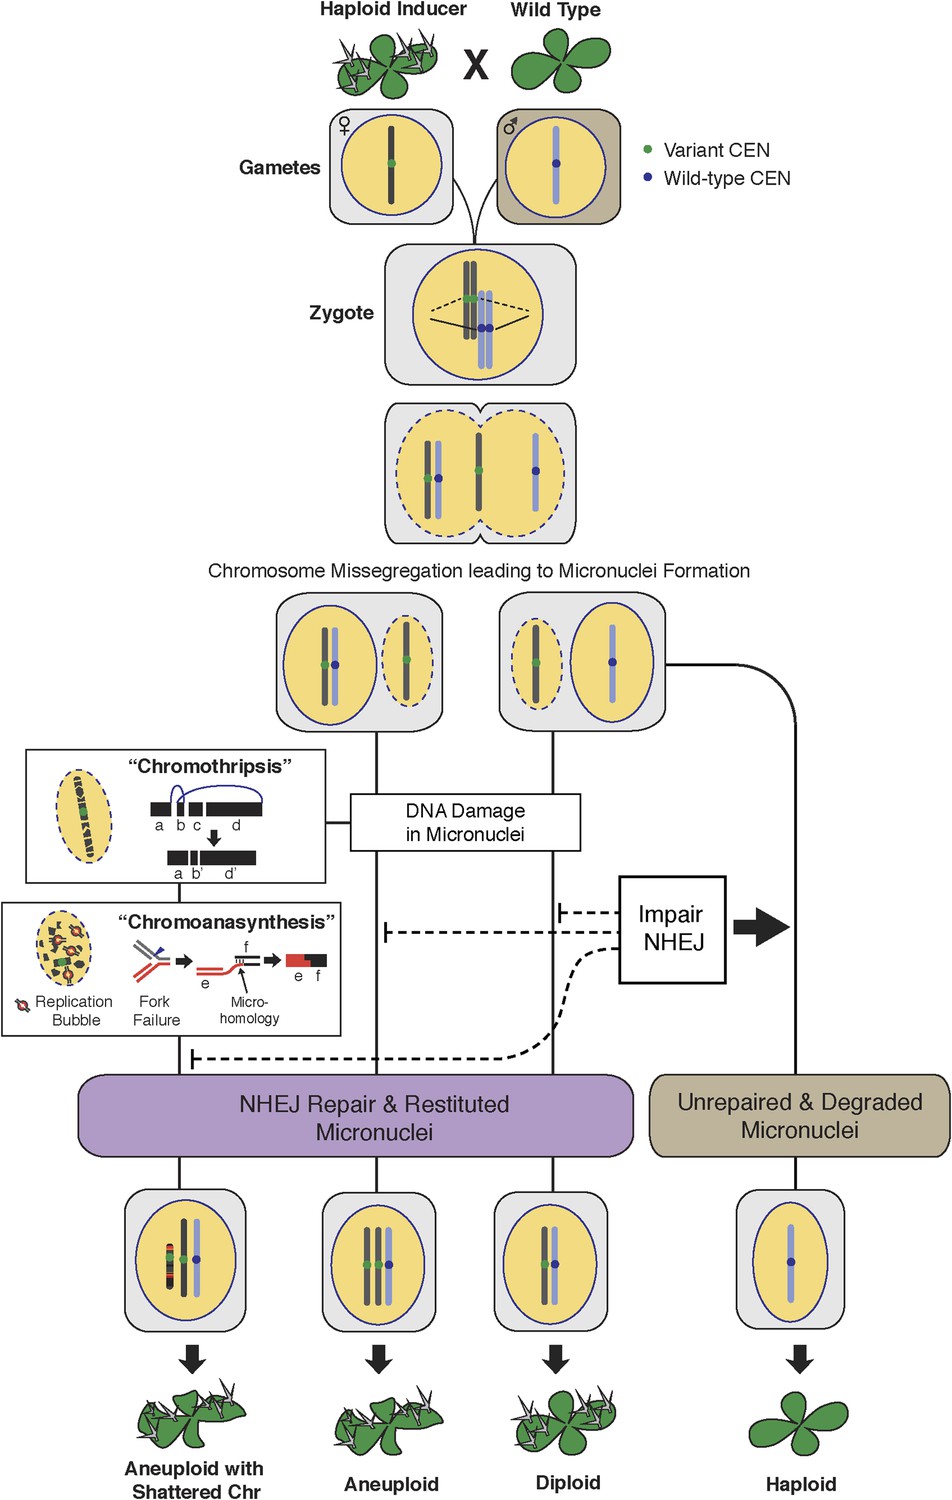
The process of genome elimination and connected models for chromosomal rearrangements.
Genome elimination ensues when a haploid inducer expressing a variant CENH3 protein mates with the wild type. In many cases, the chromosomes marked by the variant CENH3 missegregate in the embryo and are compartmentalized in micronuclei. DNA damage, NHEJ repair and restitution of the micronucleus to the euploid pole nucleus can result in aneuploidy or diploidy. Alternatively, shattered chromosomes result from chromothripsis and chromoanasynthesis. The former involves fragmentation and random ligation, the latter replication fork collapse and microhomology-mediated strand switching. As a consequence, the pulverized and reassembled chromosome forms a single unit and can be meiotically inherited. The schematics for chromothripsis and chromoanasynthesis are shown sequentially for convenience, but their order has not been determined. In addition, our results obtained using DNA ligase4-2 mutants suggest that the NHEJ pathway plays an important role in the repair of the haploid inducer chromosomes that contribute to diploid and aneuploid progeny, such that when NHEJ is inhibited, haploid induction frequency increased.
Figure 7
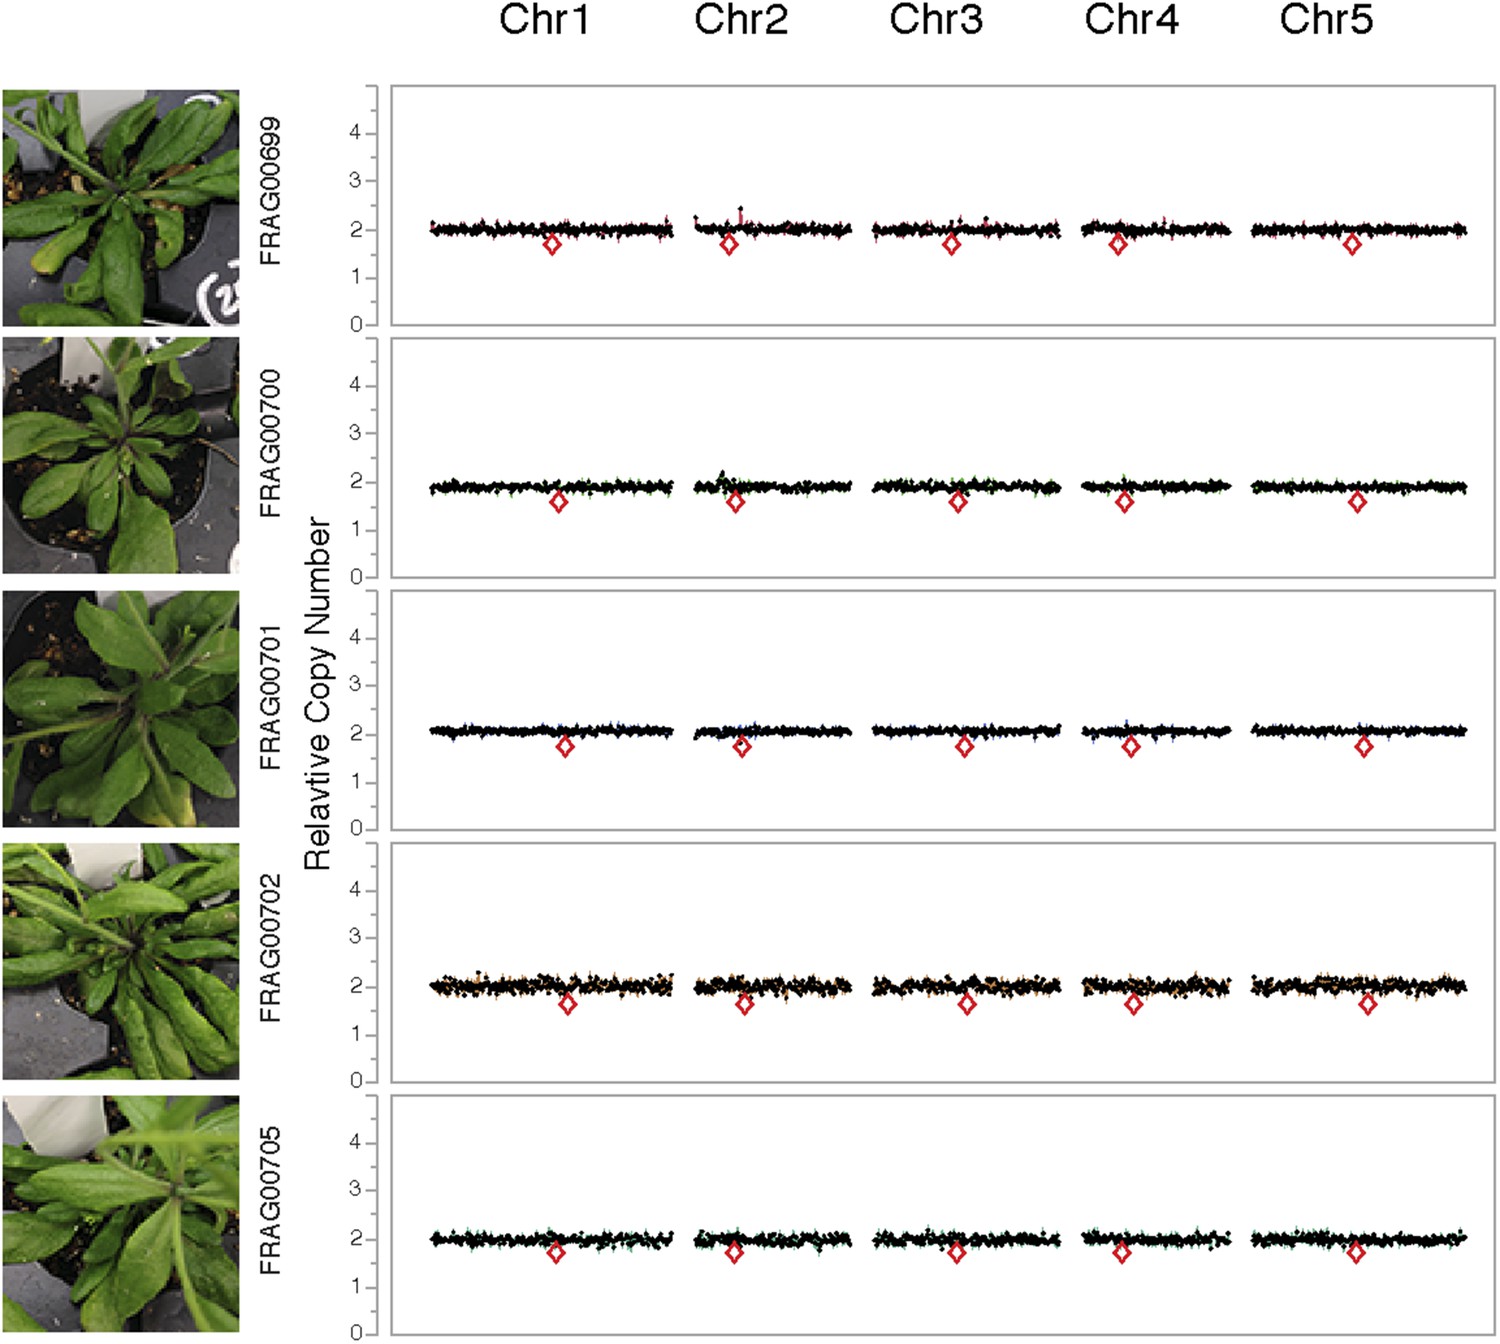
Dosage plots for lig4-2 haploids isolated from a haploid induction cross using diploid lig4-2 as the male donor.
Dosage plots of lig4-2 haploids based on 150 kbp non-overlapping bins across all five Arabidopsis chromosomes. Euploid chromosome dosage plots for lig4-2 haploids have the appearance of having a copy number of 2 only because euploid chromosome dosage was calculated with the value of 2 in this analysis. Centromere positions are indicated by red diamonds.
Tables
Table 1
Haploid induction frequency from genome elimination crosses using lig4-2 mutants
| Haploid Inducer ♀ | ♂ | Total | Aneuploid | Diploid | Haploid |
|---|---|---|---|---|---|
| GFP-tailswap | Ler gl1 | 606 | 33% | 28% | 39% |
| GFP-tailswap | lig4-2 | 148 | 8% | 9% | 83% * |
| lig4-2 GFP-tailswap | Ler gl1 | 173 | 29% | 31% | 40% |
| lig4-2 GFP-tailswap | lig4-2 | 159 | 14% | 5% | 81% * |
-
Haploid inducer lines or haploid inducer line with the lig4-2 mutation were crossed to wild-type Ler gl1 or lig4-2 mutant pollen (*Student's t-test, p < 0.001).
Additional files
-
Supplementary file 1
List of the aneuploid individuals from GFP-tailswap × Ler gl1-1 crosses used in this study. Unique identifiers (FRAG IDs) are listed for each individual, along with the GFP-tailswap parental lines as well as their corresponding aneuploid chromosome types. The final 16 columns indicate whether individuals exhibited the numerical, truncated or shattered aneuploid chromosome type, and which specific chromosomes displayed these features.
- https://doi.org/10.7554/eLife.06516.020
-
Supplementary file 2
List of aneuploid individuals obtained from selfed Col-0 triploids. Unique identifiers (FRAG IDs) are listed for each individual and indicate which specific chromosomes displayed the numerical aneuploid chromosome type.
- https://doi.org/10.7554/eLife.06516.021
-
Supplementary file 3
List of diploid and aneuploid individuals obtained from selfed GFP-tailswap. Unique identifiers (FRAG IDs) are listed for each individual and indicate which specific chromosomes displayed the numerical aneuploid chromosome type.
- https://doi.org/10.7554/eLife.06516.022
-
Supplementary file 4
Breakpoint junctions from FRAG00062. The positions and types of repair for each breakpoint junction are indicated, along with their orientation as well as possible outcomes for a novel gene product.
- https://doi.org/10.7554/eLife.06516.023
-
Supplementary file 5
Enrichment ratios of genomic features surrounding breakpoints from duplicated or triplicated blocks. The ratios of genomic features listed in column 1 are calculated using 1000 bp and 10,000 bp windows surrounding breakpoints from duplicated or triplicated blocks. Regions with enriched ratios has a value of > 1 while regions that are under-represented have values of < 1. Light orange boxes are indicated for p < 0.05 and light red boxes for p < 0.01.
- https://doi.org/10.7554/eLife.06516.024
-
Supplementary file 6
Single nucleotide polymorphisms between Col-0 and Ler. A list of SNPs from Col-0 and Ler used in this study and their chromosomal positions.
- https://doi.org/10.7554/eLife.06516.025
-
Supplementary file 7
BAC clones used for chromosome painting. Listing of the corresponding chromosome, BAC clone and associated GenBank accession used.
- https://doi.org/10.7554/eLife.06516.026
-
Supplementary file 8
Oligonucleotides sequences for analysis of breakpoint junctions from FRAG00062.
- https://doi.org/10.7554/eLife.06516.027
Download links
A two-part list of links to download the article, or parts of the article, in various formats.
Downloads (link to download the article as PDF)
Open citations (links to open the citations from this article in various online reference manager services)
Cite this article (links to download the citations from this article in formats compatible with various reference manager tools)
Catastrophic chromosomal restructuring during genome elimination in plants
eLife 4:e06516.
https://doi.org/10.7554/eLife.06516


