Compensatory induction of MYC expression by sustained CDK9 inhibition via a BRD4-dependent mechanism
- University of California, Berkeley, United States
- Xiamen University, China
- Novartis Institute for BioMedical Research, United States
Figures
Figure 1 with 1 supplement
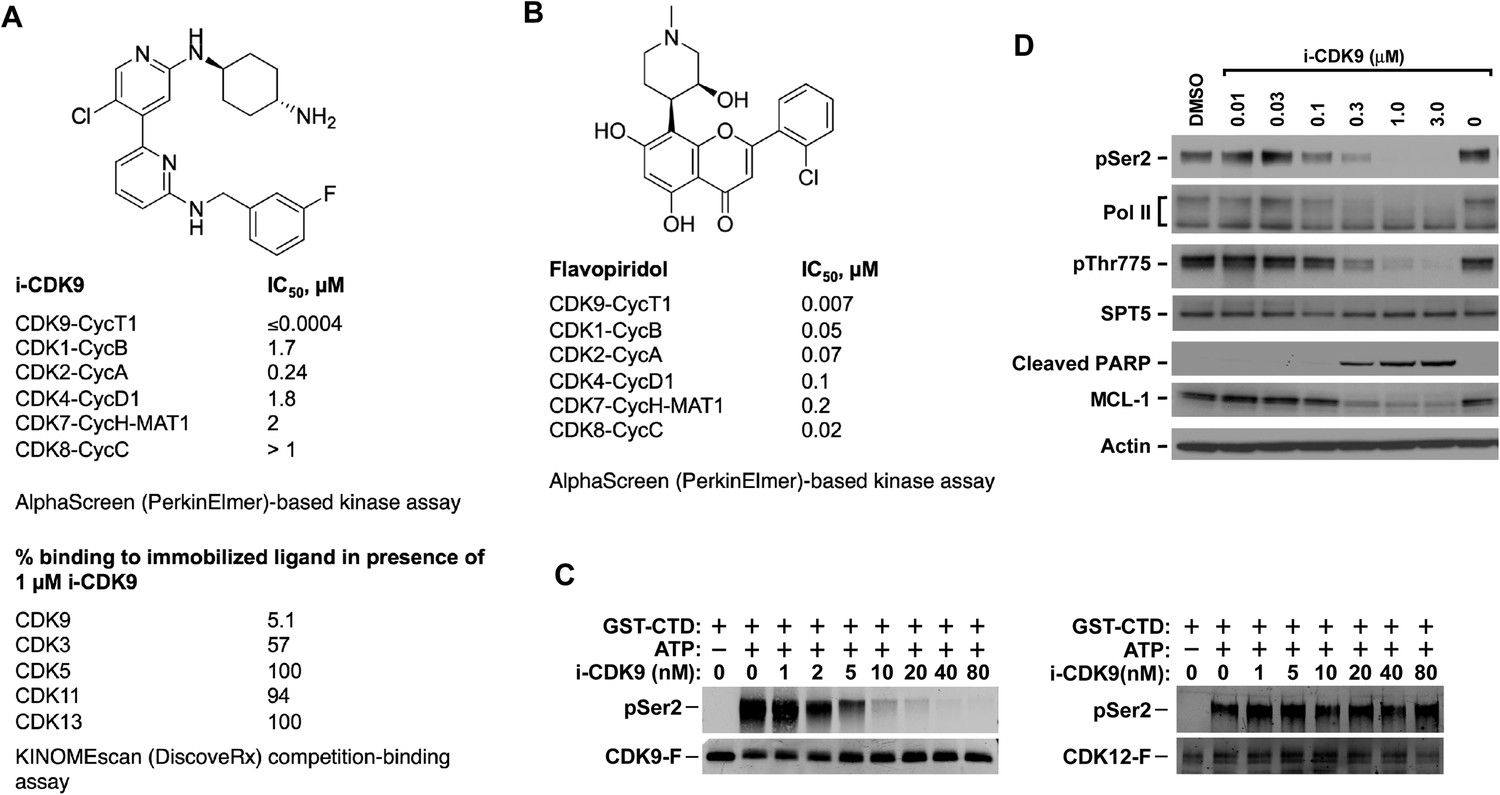
i-CDK9 is a potent and selective CDK9 inhibitor that elicits cellular responses indicative of P-TEFb inhibition.
(A and B) Structures and selectivity profiles of i-CDK9 (A) and falvopiridol (B). The numbers refer to the concentrations (µM) of the two compounds that resulted in 50% inhibition of the enzymatic activity of the indicated CDK–cyclin pairs in the AlphaScreen (PerkinElmer)-based kinase assay (A) or 50% inhibition of the bindings of the indicated CDKs to the immobilized ligands in the KINOMEscan platform (B). (C) In vitro kinase reactions containing affinity-purified CDK9-F-CycT or CDK12-F-CycK and GST-CTD as a substrate were conducted in the presence of the indicated concentrations of i-CDK9. pSer2 and the Flag-tagged kinase in each reaction were detected by Western blotting with anti-pSer2 and anti-Flag antibodies, respectively. (D) HeLa cells were treated for 8 hr with DMSO or the indicated concentrations of i-CDK9. Total cell lysates were examined by immunoblotting for the proteins labeled on the left.
-
Figure 1—source data 1
Selectivity profile of i-CDK9.
- https://doi.org/10.7554/eLife.06535.004
Figure 1—figure supplement 1
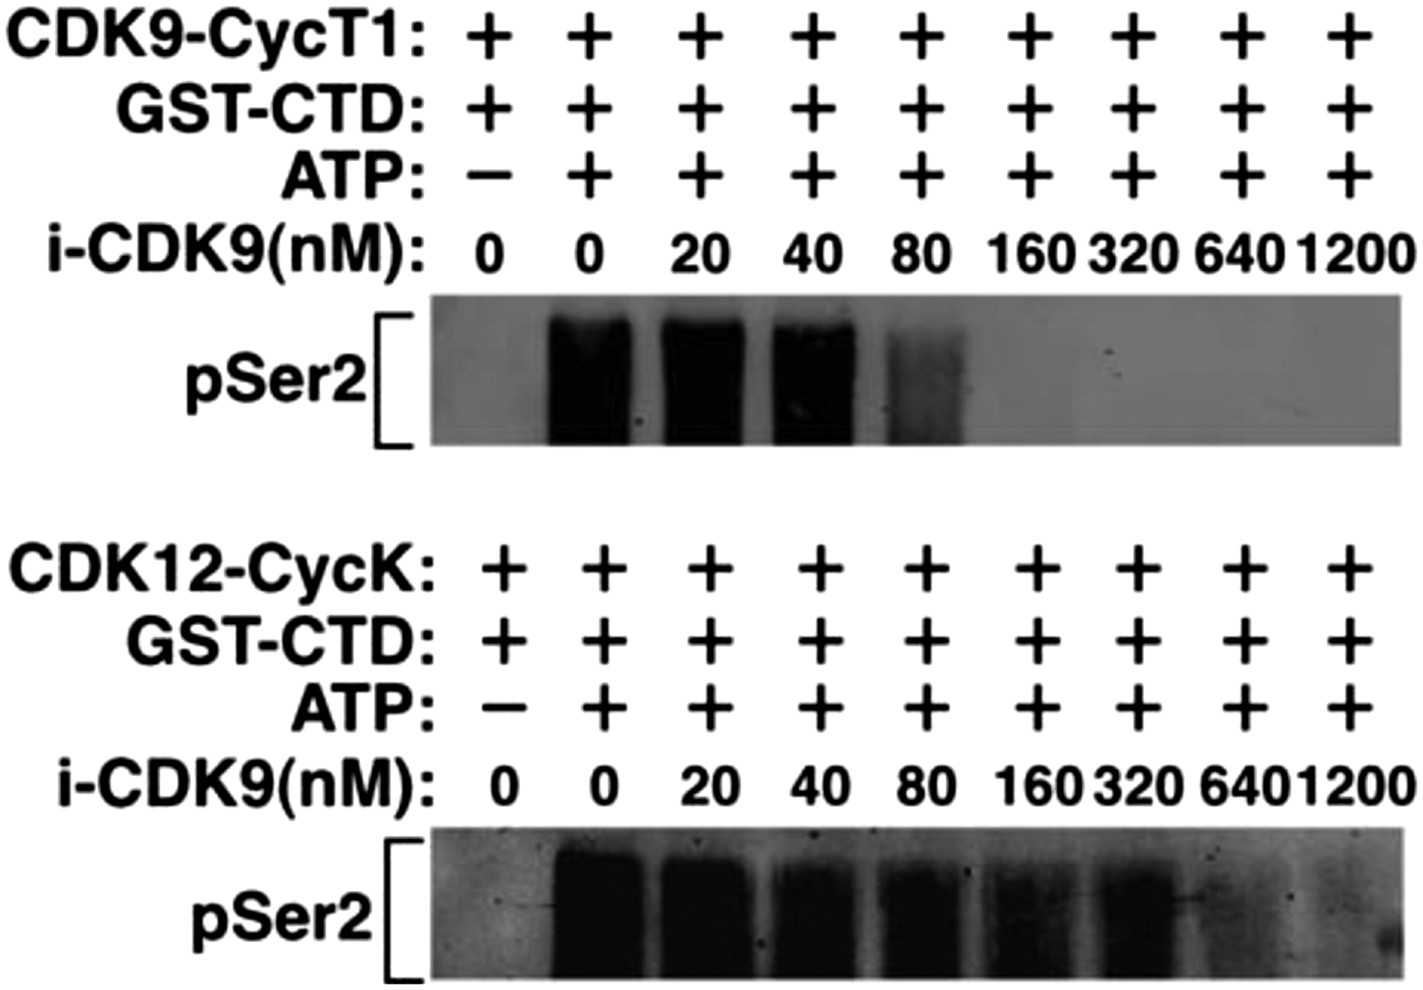
Recombinant CDK12-CycK is less sensitive to inhibition by i-CDK9.
https://doi.org/10.7554/eLife.06535.005
Figure 2

i-CDK9 causes widespread promoter-proximal pausing by Pol II and the biggest decrease in expression for genes involved in regulation of transcription and RNA metabolic process.
(A) Schematic diagram illustrating calculation of the Pol II traveling ratio (TR). (B) Distribution of Pol II-bound genes with a given TR as determined by ChIP-seq under the various conditions as indicated. The pie charts below describe the percentages of genes with 1.5-fold increase, 1.5-fold decrease, or no change in TR after exposure to i-CDK9 for 2 or 8 hr as compared to DMSO. (C) Occupancy of Pol II as revealed by ChIP-seq across 4 representative genes with increased TR after CDK9 inhibition. The read coverage is shown for the entire gene plus a margin on either side equal to 7% of the gene length. (D) Distribution of Pol II-bound genes with a given TR as determined by ChIP-seq. The genes are grouped by expression changes induced by i-CDK9. Up: the 138 genes that showed at least twofold increase in expression after exposure to i-CDK9 or 8 hr. Other: genes whose expression was either unaffected or affected less than twofold by i-CDK9. (E) Enrichment of GO biological processes by DAVID. Only top 4 gene sets are shown for top 500 genes with the biggest increase in TR at 8 hr treatment with i-CDK9 (top) and top 500 genes with the largest decrease in gene expression at 8 hr i-CDK9 treatment (bottom).
Figure 3 with 2 supplements
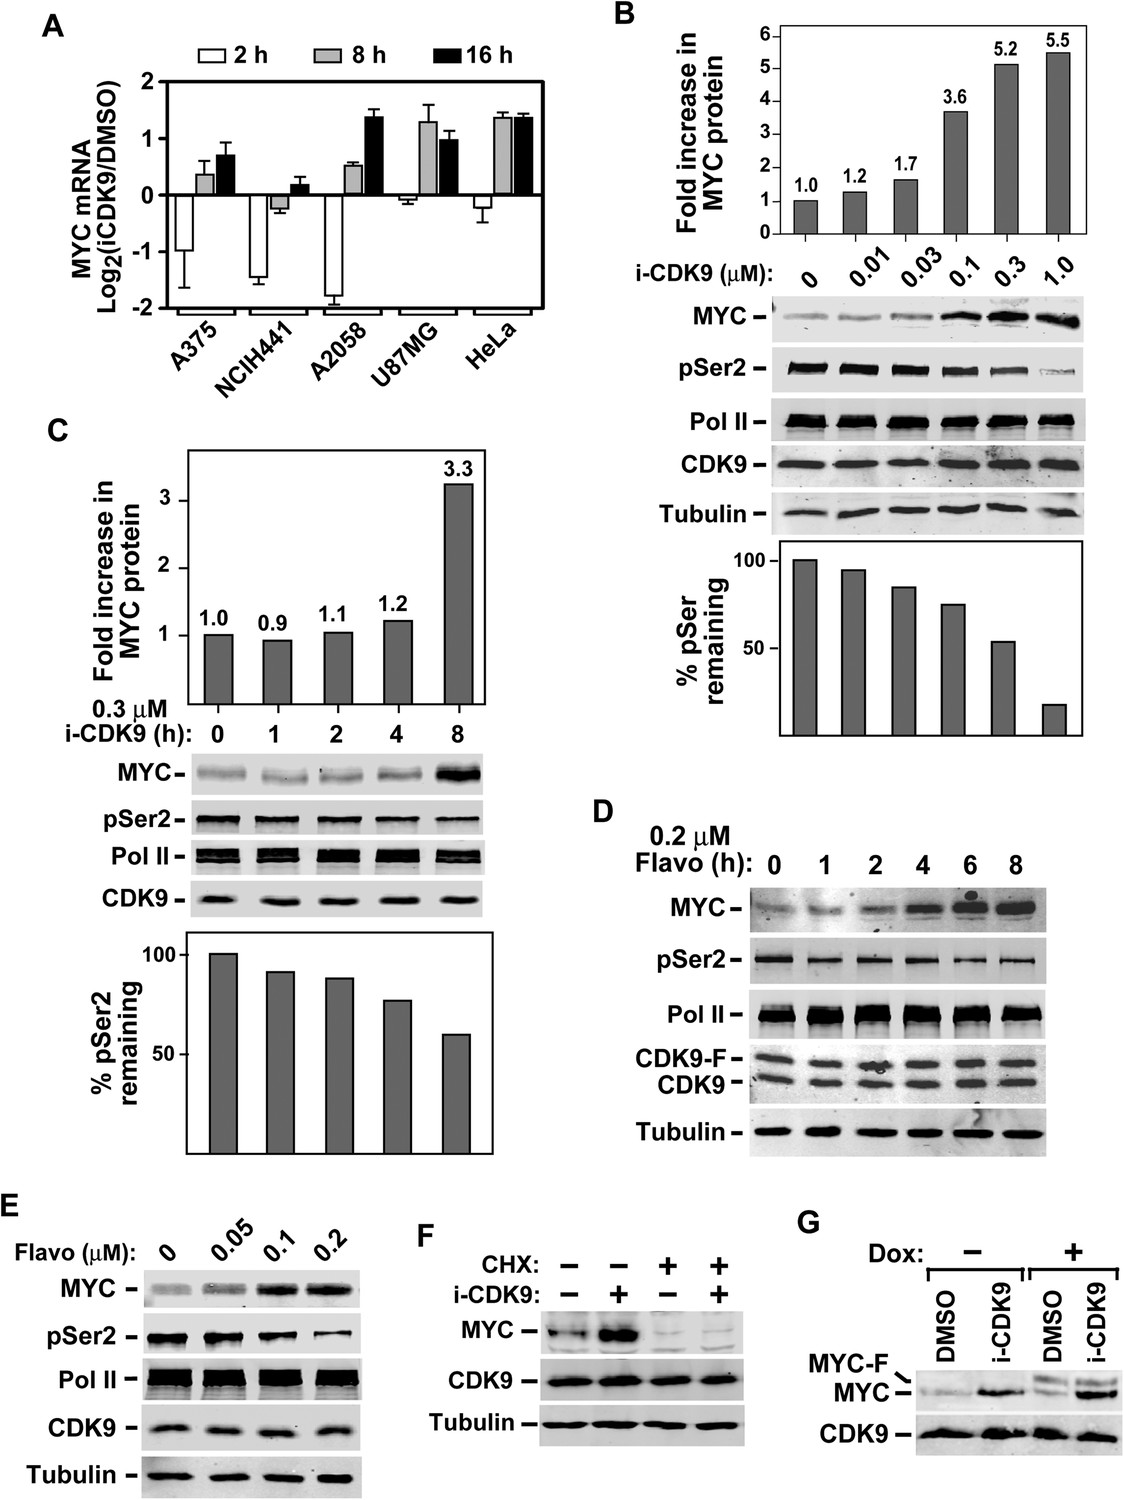
Induction of MYC mRNA production in response to sustained inhibition of CDK9 by i-CDK9 and the requirement of MYC's natural genomic structure in this process.
(A) The indicated tumor cell lines were treated with i-CDK9 (0.5 μM) for 2–16 hr and the MYC mRNA levels, which were divided by those in the DMSO-treated cells and averaged from three independent replicates of DNA microarray analysis, were shown as log2 values. (B) HeLa cells were treated with the indicated concentrations of i-CDK9 for 8 hr and the various proteins in the total cell lysates were detected by immunoblotting as indicated. Quantifications of the levels of MYC protein and Ser2-phosphoryalted Pol II (pSer2) in the lysates were shown above and below the immunoblots, respectively. (C) HeLa cells were treated with 0.3 µM i-CDK9 for the indicated number of hr and cell lysates were obtained and analyzed as in B. (D and E) HeLa cells were treated with either 0.3 µM flavopiridol for the indicated time periods (D) or 8 hr with the indicated concentrations of flavopiridol (E) and analyzed by immunoblotting as in B. (F) Cells were pretreated with (+) or without (−) cycloheximide (CHX) prior to incubation with i-CDK9. The levels of the indicated proteins were examined by immunoblotting. (G) A HeLa-based cell line containing the stably transfected, doxycycline (Dox)-inducible MYC-F-expressing plasmid driven by the CMV promoter was pretreated with (+) or without (−) Dox prior to incubation with i-CDK9 or DMSO. MYC and MYC-F expressed from the endogenous MYC locus and the transfected plasmid, respectively, were detected by immunoblotting.
Figure 3—figure supplement 1

Biphasic response of MYC mRNA production throughout the course of CDK9 inhibition by i-CDK9.
https://doi.org/10.7554/eLife.06535.008
Figure 3—Figure supplement 2
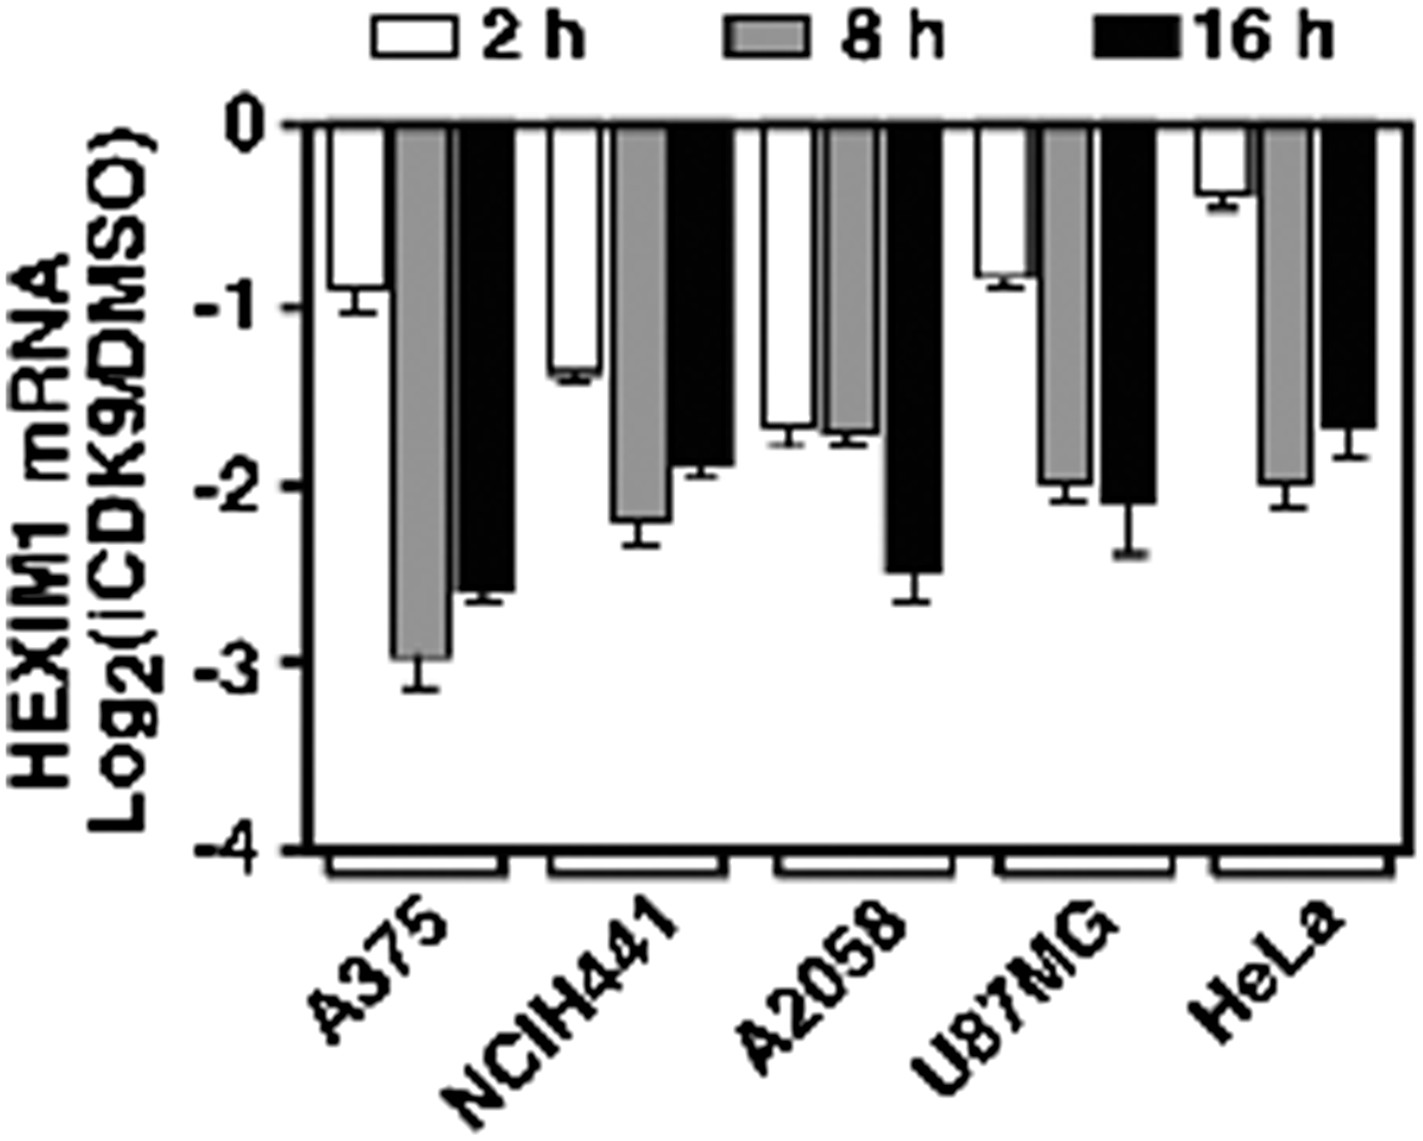
HEXIM1 expression is continuously suppressed throughout the entire course of i-CDK9 treatment of five different tumor cell lines.
https://doi.org/10.7554/eLife.06535.009
Figure 4 with 5 supplements
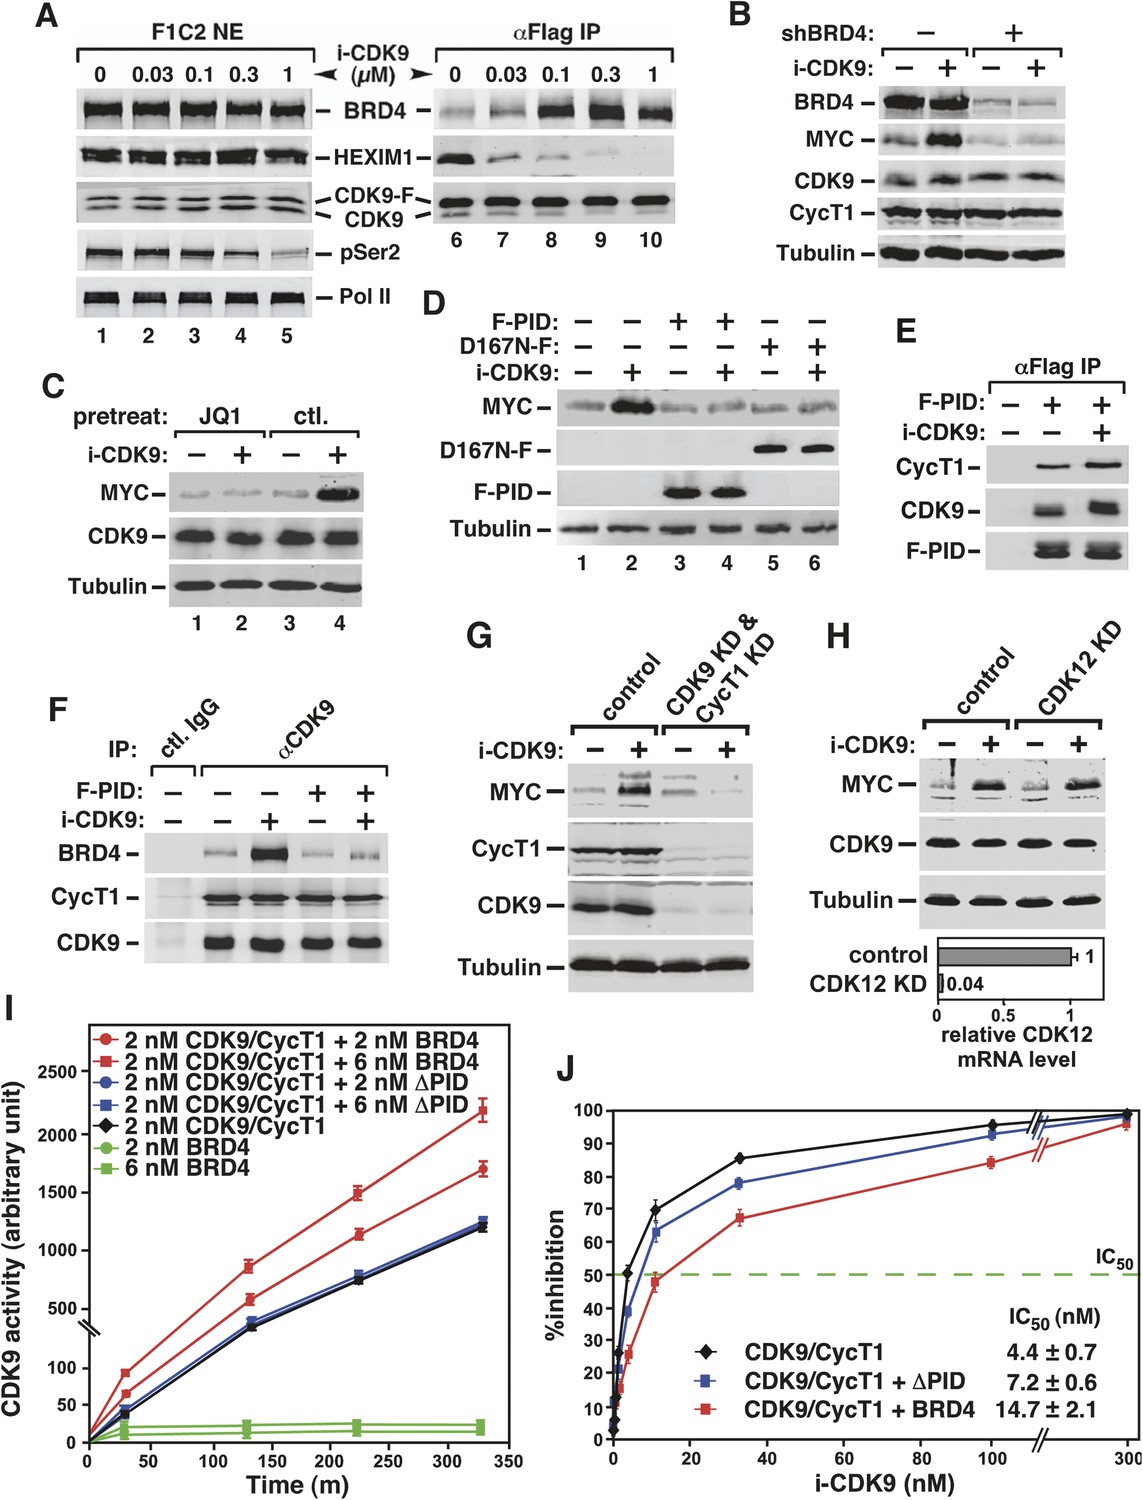
Activation of MYC transcription by i-CDK9 depends on induced transfer of kinase-active P-TEFb from 7SK snRNP to BRD4, binding of the BRD4-P-TEFb complex to acetylated MYC chromatin template, and BRD4-mediated increase in CDK9's catalytic activity and resistance to inhibition.
(A) The HeLa-based F1C2 cells stably expressing CDK9-F were incubated with the indicated concentrations of i-CDK9. Nuclear extracts (NE) and the anti-CDK9-F immunoprecipitates (IP) derived from NE were analyzed by immunoblotting to detect the indicated proteins. (B and C) Lysates of HeLa cells expressing the BRD4-specific shRNA (shBRD4; B) or pretreated with JQ1 or the control enantiomer (ctl.; C) were incubated with (+) or without (−) i-CDK9 and analyzed by immunoblotting for the indicated proteins. (D–H) Cells were first transfected with plasmids expressing F-PID (D, E and F), D167N-F (D), or shCycT1 (G) or transfected with siRNAs specific for CDK9 (G) or CDK12 (H) and then treated with i-CDK9 or DMSO (−). NE (D, G and H) and immunoprecipitates (IP) obtained from NE with anti-Flag mAb (E) or anti-CDK9 antibodies or rabbit total IgG (F) were examined by immunoblotting for the indicated proteins. The relative CDK12 mRNA levels were analyzed by qRT-PCR at the bottom in H, with the level in cells transfected with a control siRNA set to 1. (I and J) In vitro kinase reactions containing a synthetic Pol II CTD peptide (CDK7tide) as the substrate and CDK9-CycT1 (Invitrogen) as the kinase were conducted in the presence of the indicated amounts of WT or ∆PID BRD4. Phosphorylation of the peptide was measured over the indicated time periods and plotted in I, with the error bars representing mean ± SD from three independent experiments. The indicated amounts of i-CDK9 were added to the reactions in J, and its inhibition of CDK9 phosphorylation of the peptide was measured and plotted with the inhibitory IC50 shown.
Figure 4—figure supplement 1
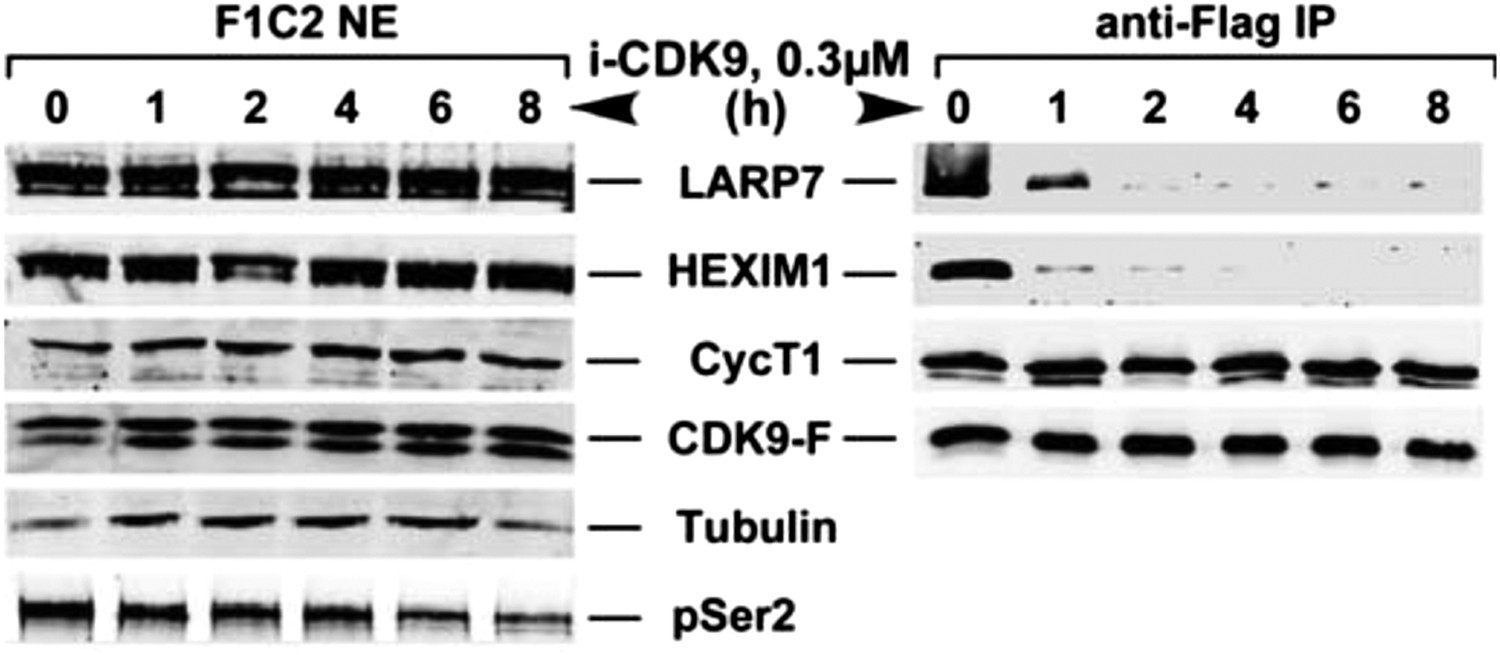
i-CDK9 (0.3 μM) induces disruption of 7SK snRNP at a time point much earlier than that required to cause about 50% reduction in global pSer2.
https://doi.org/10.7554/eLife.06535.011
Figure 4—figure supplement 2
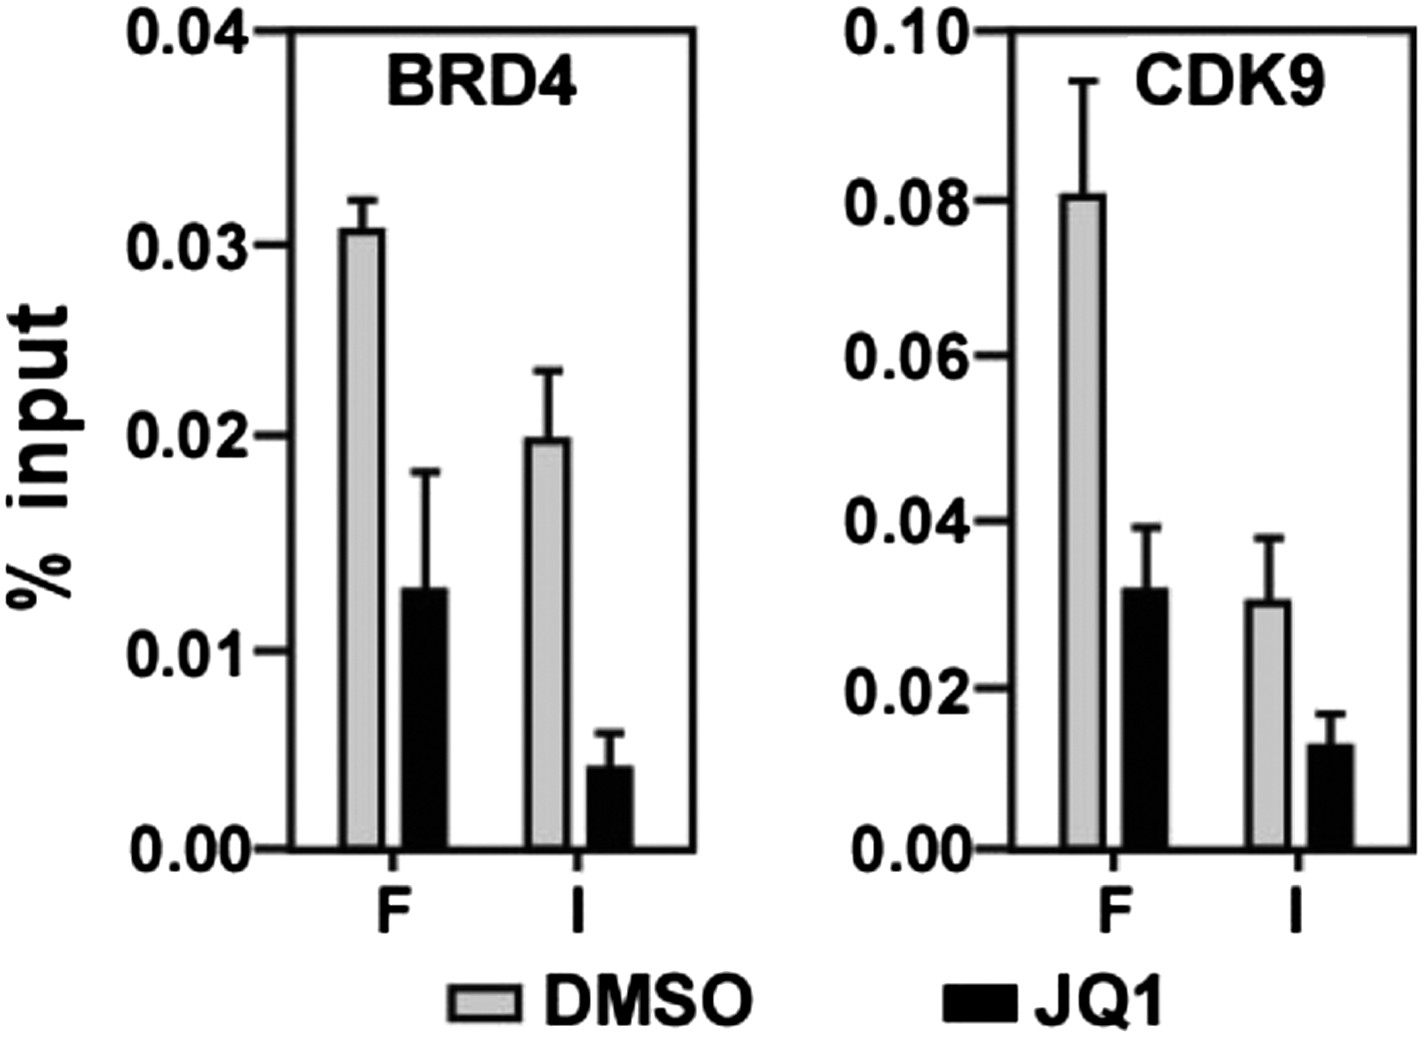
JQ1 decreases associations of both BRD4 and CDK9 with the MYC locus.
https://doi.org/10.7554/eLife.06535.012
Figure 4—figure supplement 3
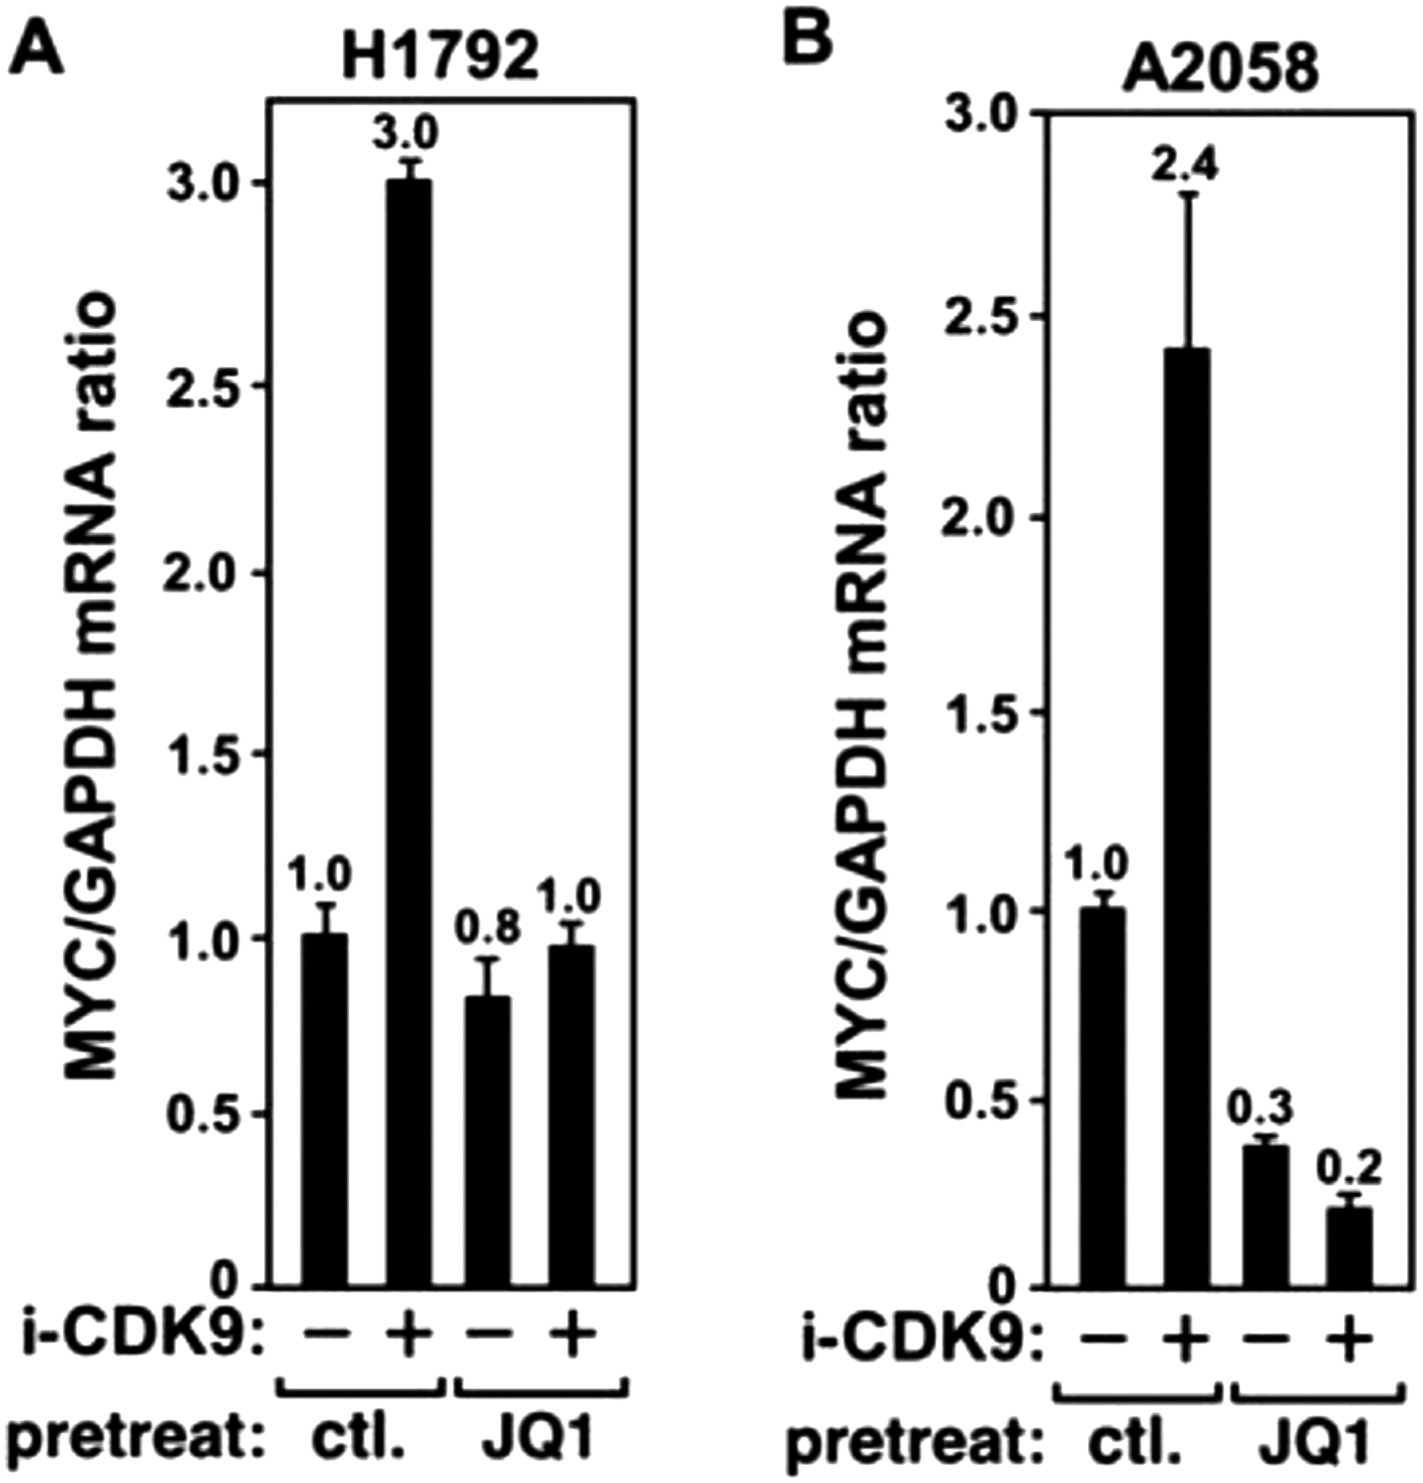
JQ1 blocks the i-CDK9-induced MYC expression in H1792 and A2058 cells.
https://doi.org/10.7554/eLife.06535.013
Figure 4—figure supplement 4
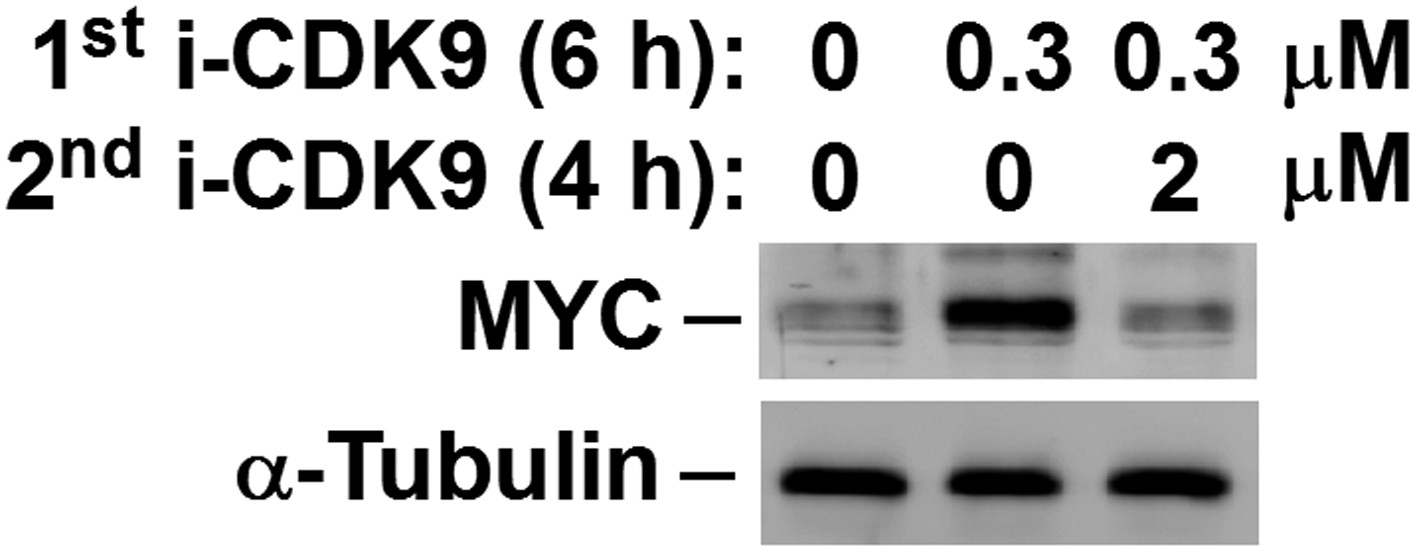
MYC induction by 0.3 μM i-CDK9 can be subsequently shut off by 2 μM of the drug.
https://doi.org/10.7554/eLife.06535.014
Figure 4—figure supplement 5
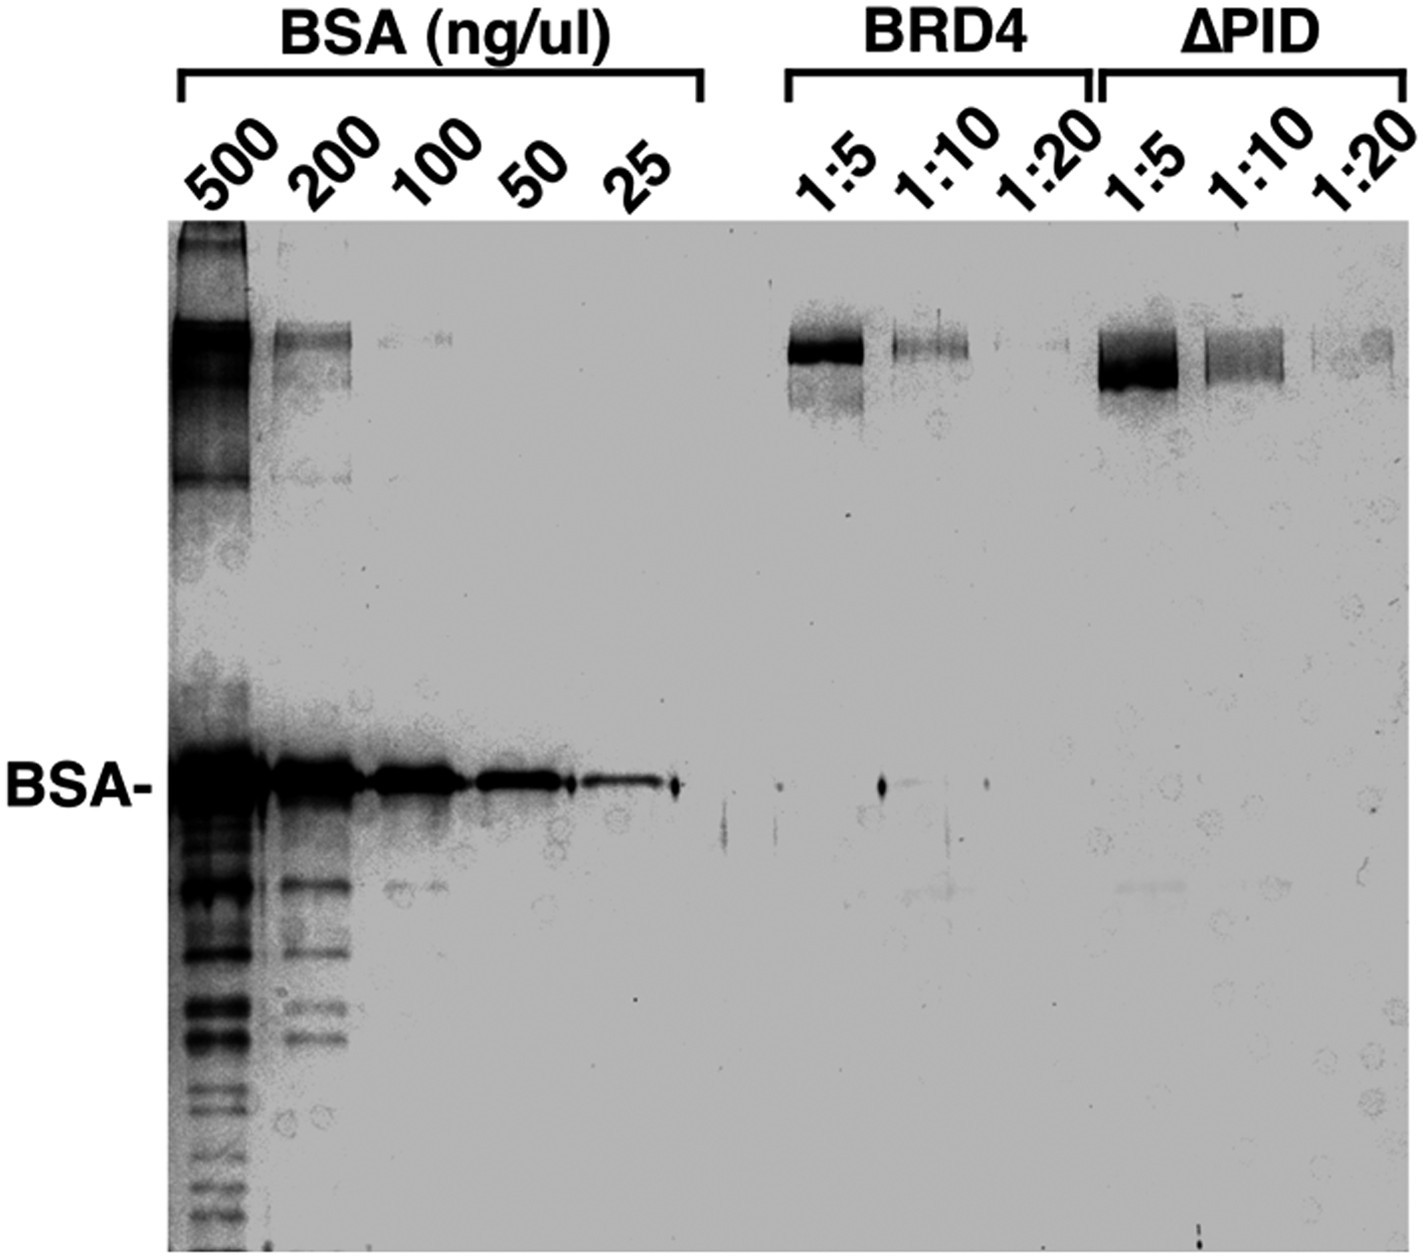
Examination of the purity and concentrations of WT and ∆PID BRD4 used in the CDK9 kinase assay.
https://doi.org/10.7554/eLife.06535.015
Figure 5 with 3 supplements
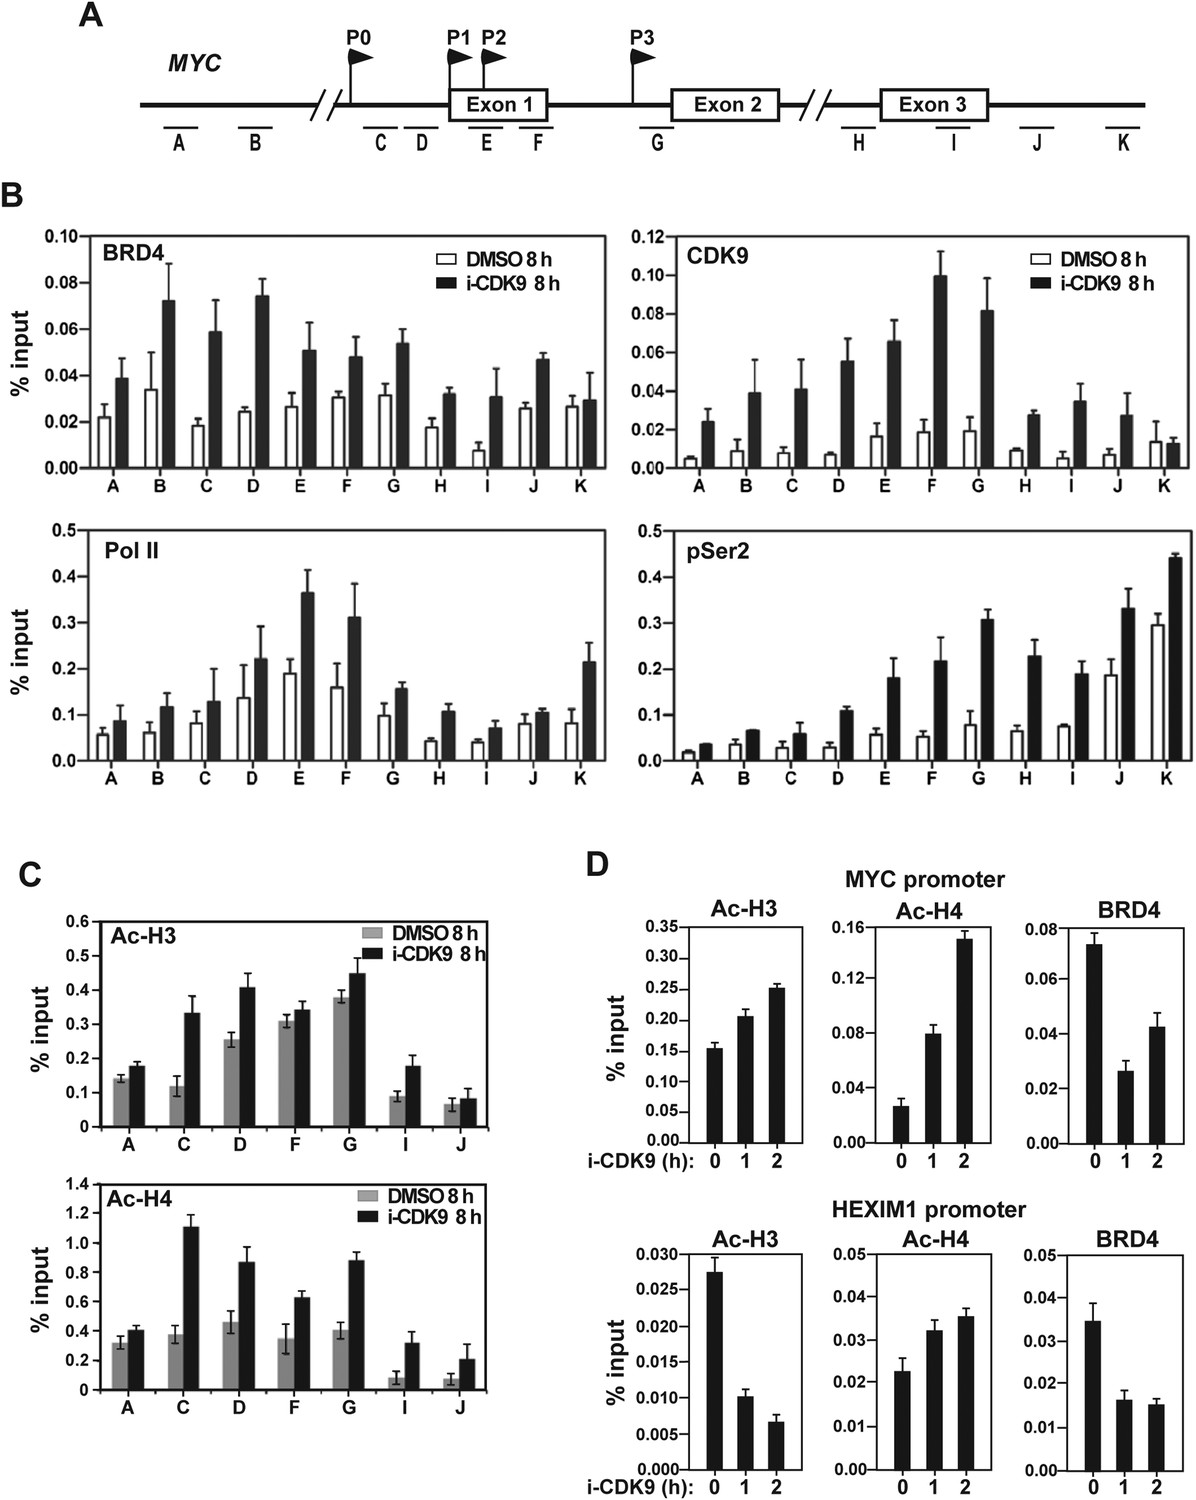
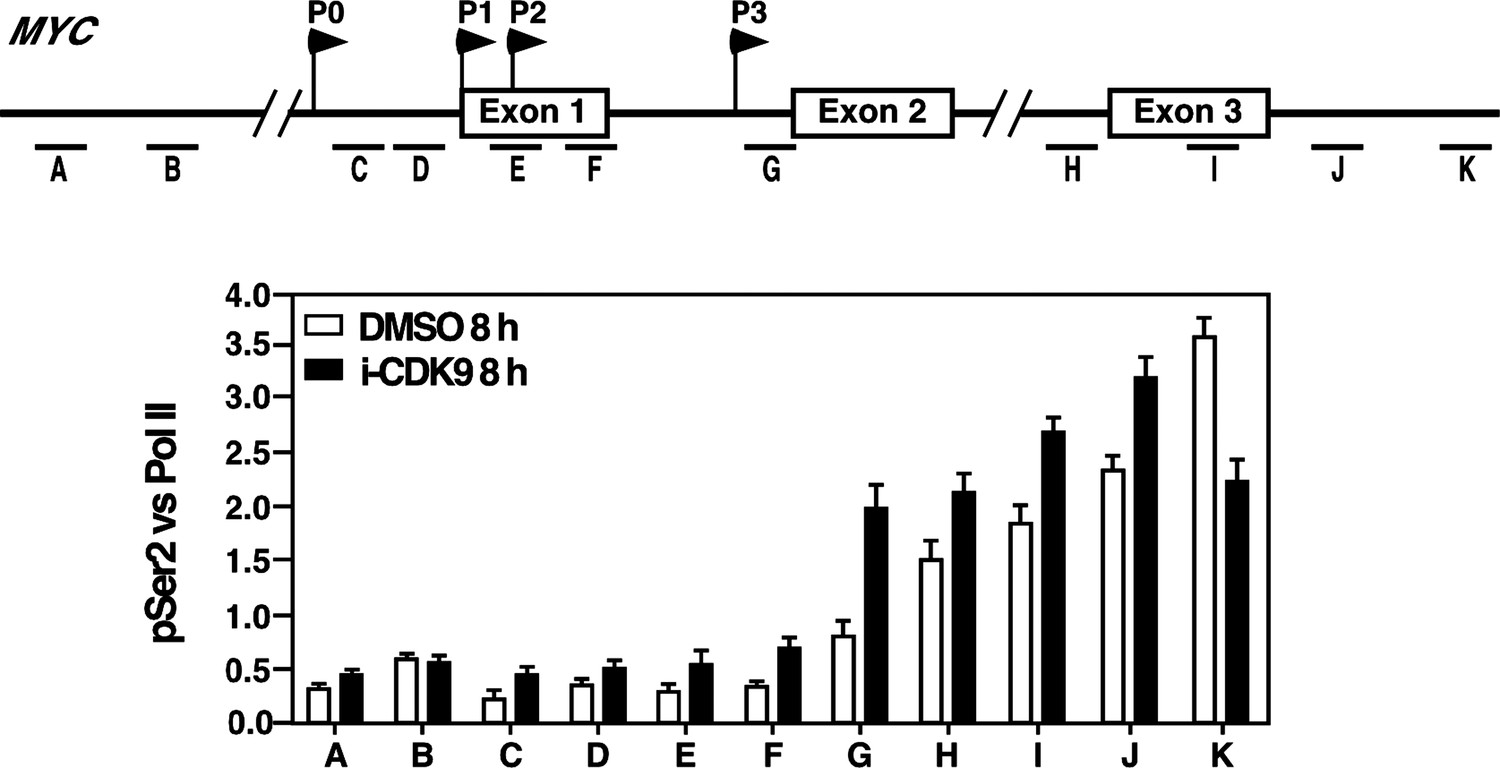
Treatment with i-CDK9 (0.3 μM for 8 hr) increases the levels of P-TEFb, BRD4, total Pol II, Pol II with pSer2 CTD and acetyl-H3/H4 at the MYC locus.
(A) Genomic structure of the MYC locus. Arrows indicate the positions and direction of the four MYC promoters P0 to P3. The small horizontal bars labeled with letters A to K mark the positions of 11 amplicons generated by quantitative PCR (qPCR) analysis of the ChIP DNA. (B and C) HeLa cells were treated with either i-CDK9 or DMSO and subjected to ChIP-qPCR analysis to determine the levels of the indicated factors bound to the MYC locus. The signals were normalized to those of input; and the error bars in all panels represent mean ± SD from three independent experiments. (D) HeLa cells were treated with 0.3 μM i-CDK9 for the indicated time periods and subjected to ChIP-qPCR analysis to determine the levels of the indicated factors bound to the MYC locus at position C and the HEXIM1 locus at position L (see Figure 5—figure supplement 2). The signals were normalized to those of input; and the error bars represent mean ± SD from three independent experiments.
Figure 5—figure supplement 1
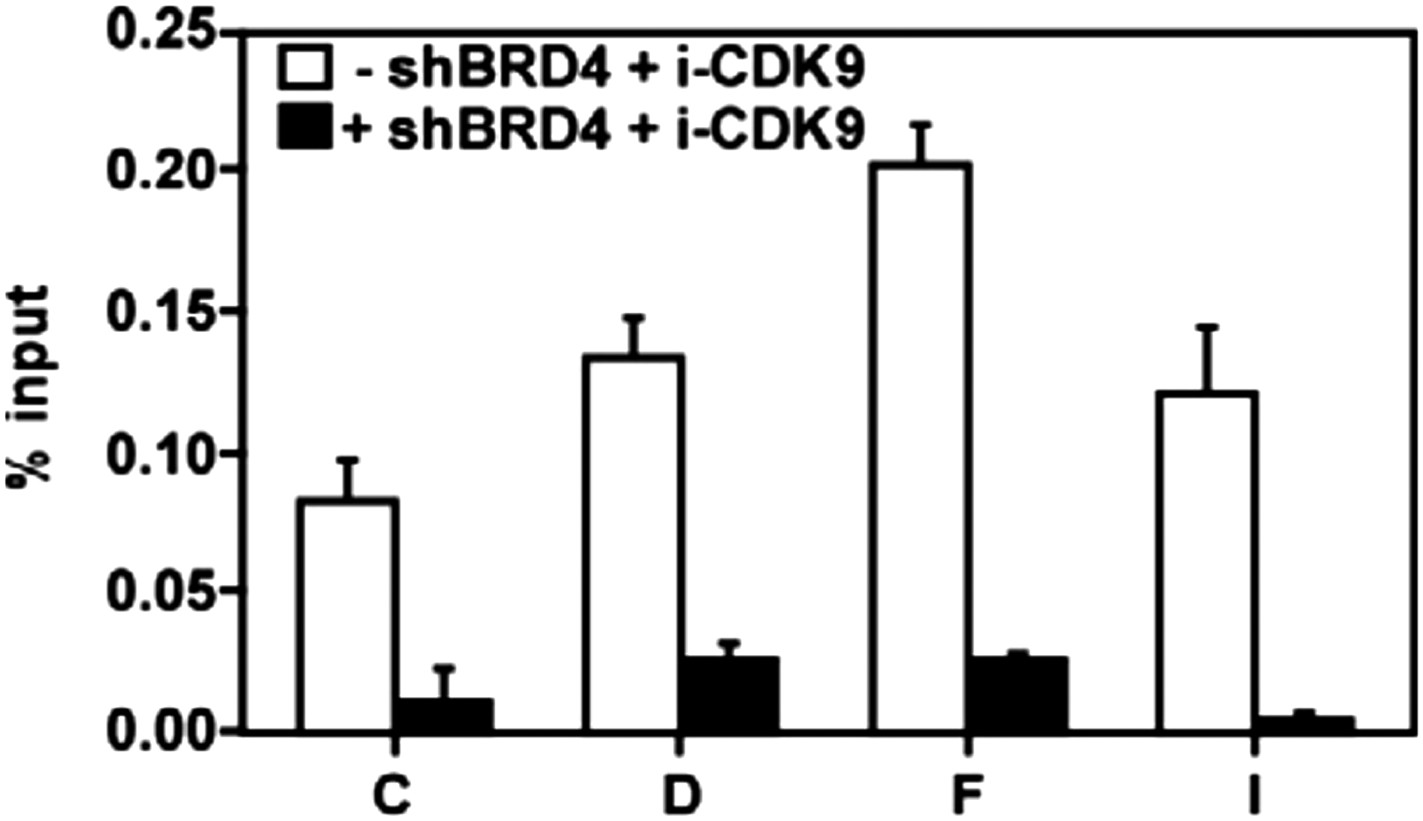
The i-CDK9-induced increase in CDK9's binding to the MYC locus is mostly BRD4-dependent.
https://doi.org/10.7554/eLife.06535.017
Figure 5—figure supplement 2
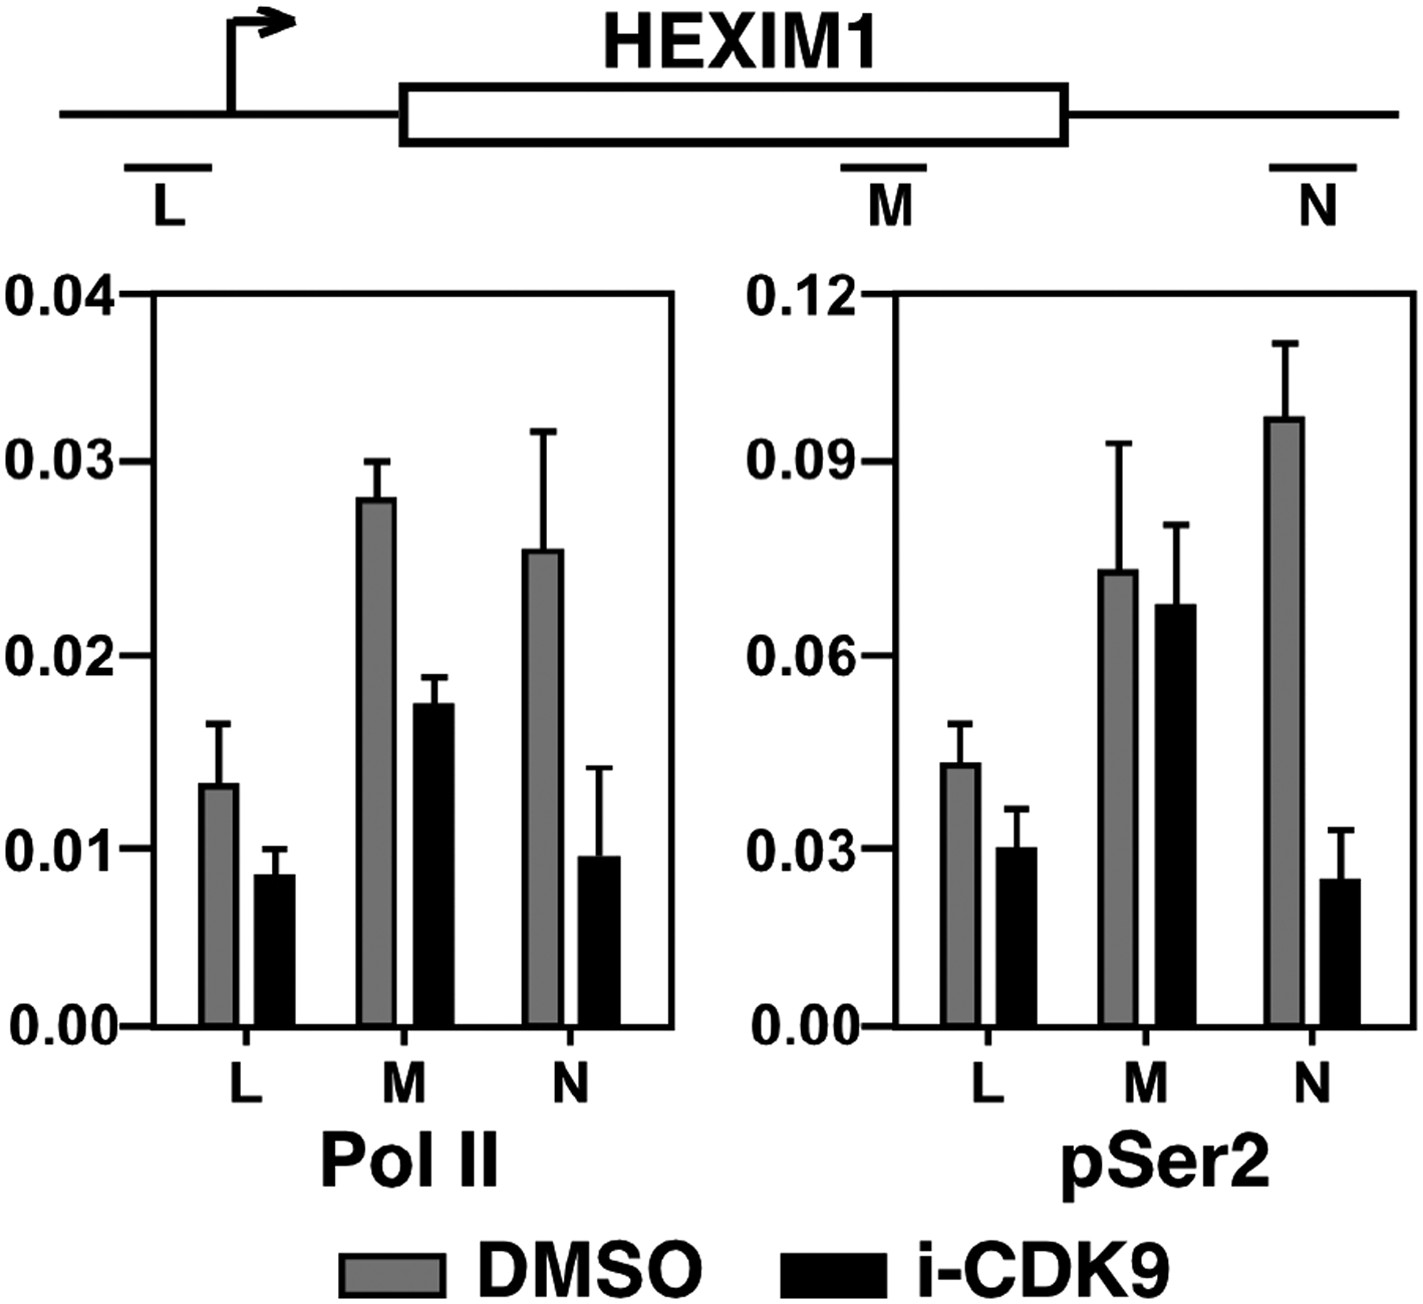
Treatment with i-CDK9 (0.3 μM for 8 hr) decreases the levels of both total Pol II and Pol II with pSer2 CTD at the HEXIM1 locus.
https://doi.org/10.7554/eLife.06535.018
Figure 5—figure supplement 3
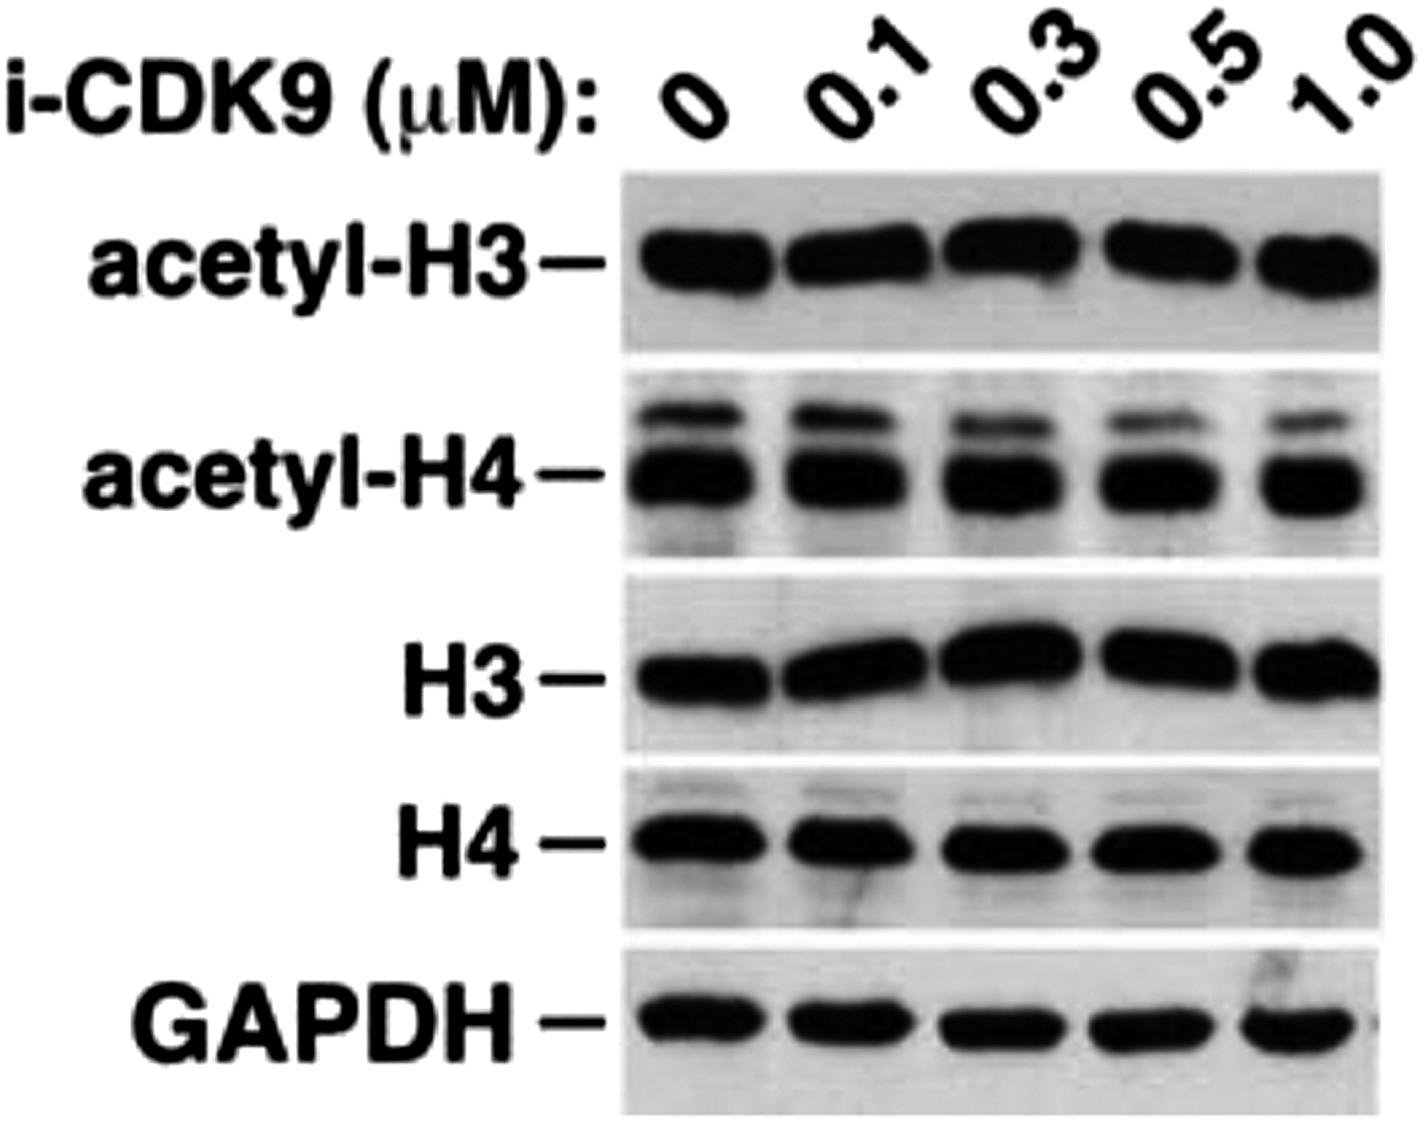
i-CDK9 does not affect the cellular levels of acetylated histones H3 and H4.
https://doi.org/10.7554/eLife.06535.019
Figure 6
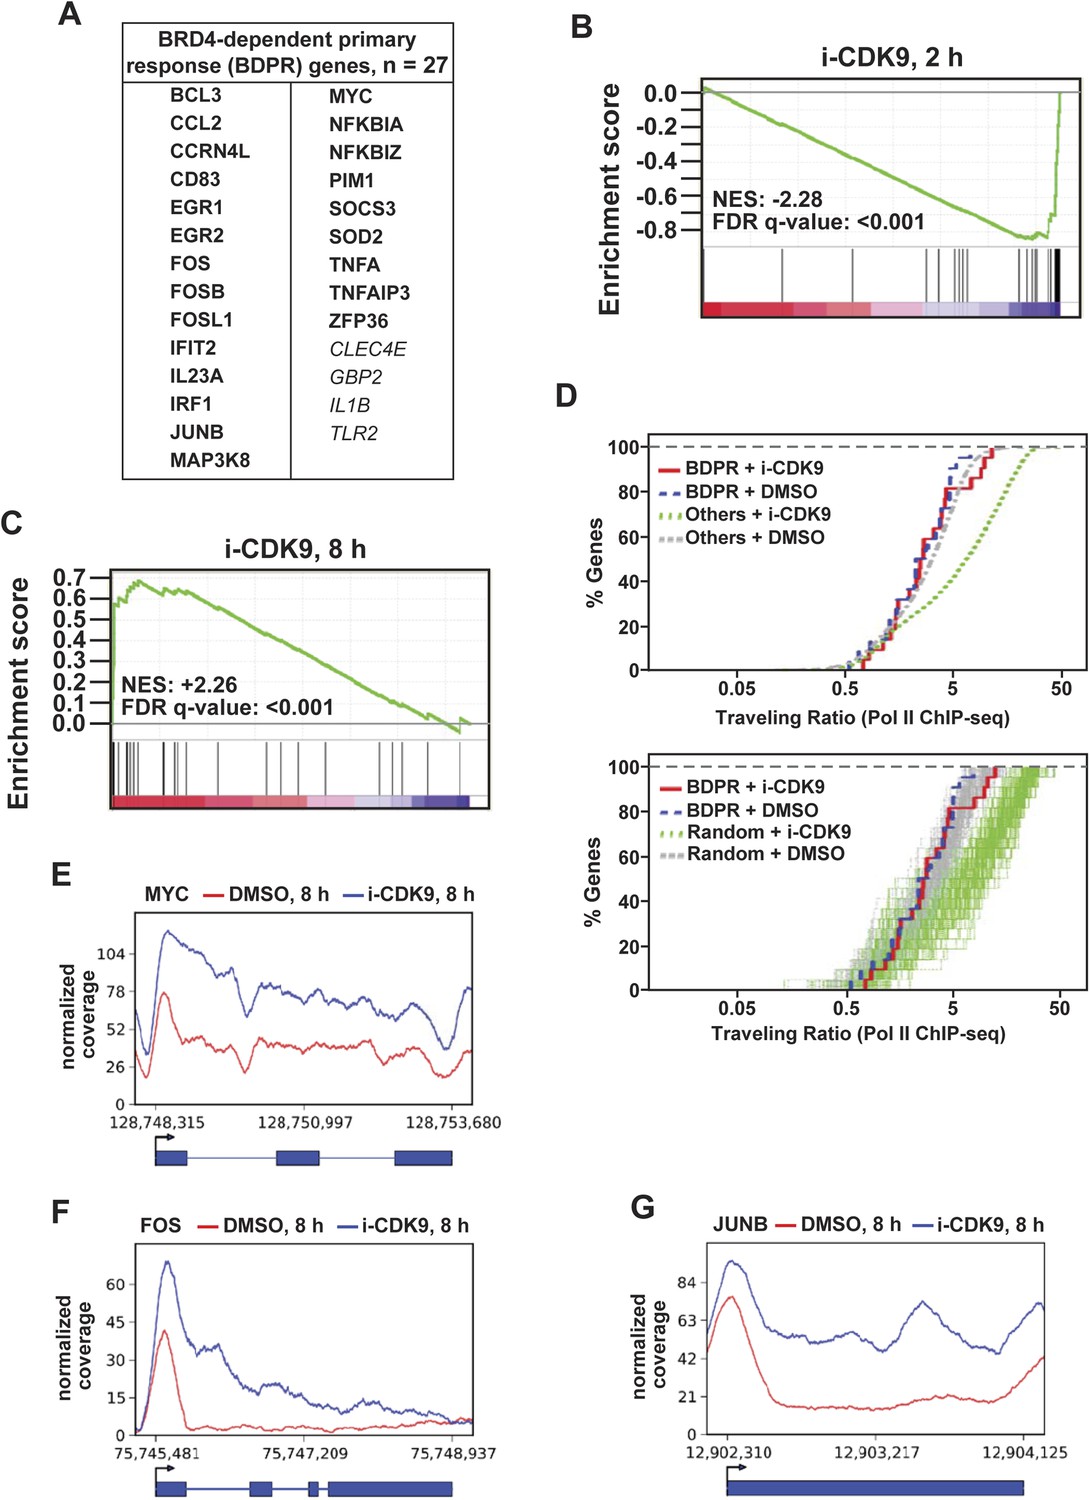
i-CDK9 affects the expression of other BRD4-dependent primary response genes similarly as it does to MYC.
(A) The list of 27 curated BRD4-dependent primary response (BDPR) genes identified in bone marrow-derived macrophages is displayed in alphabetical order. The 23 genes in bold face type had detectable Pol II signals in HeLa cells as revealed by ChIP-seq analysis. (B and C) GSEA results for the 27 BDPR genes at 2 hr (B) and 8 hr (C) post CDK9 inhibition. NES: Normalized Enrichment Score; FDR: False Discovery Rate. (D) Distribution of Pol II-bound genes with a given TR as determined by ChIP-seq. The genes are grouped by the indicated gene types and treatment conditions. The top panel compares the 23 BDPR genes to the remaining Pol II-bound genes in the genome, and the bottom compares the BDPR genes to 23 randomly selected genes. (E, F, G) Occupancy of Pol II across three representative BDPR genes as revealed by ChIP-seq. The read coverage is shown for the entire gene plus a margin on either side equal to 7% of the gene length.
Figure 7
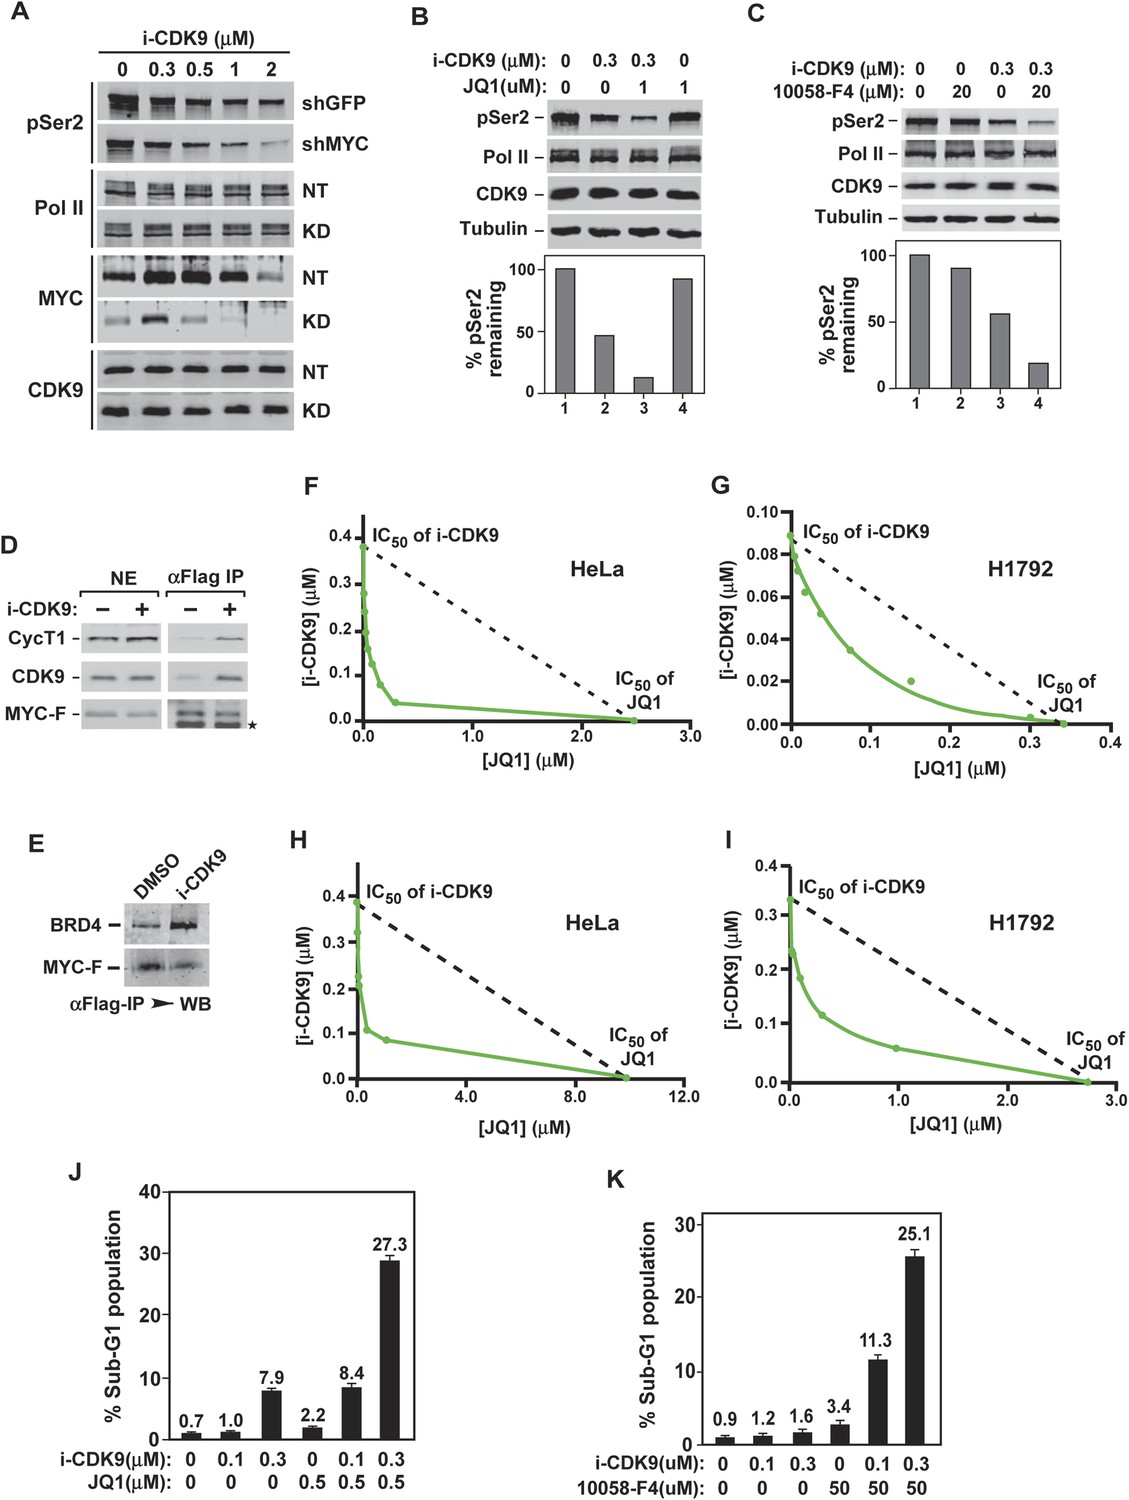
Simultaneous inhibition of CDK9 and MYC synergistically induces growth arrest and apoptosis of cancer cells due to the fact that MYC facilitates P-TEFb phosphorylation of Pol II CTD and increases binding to BRD4-P-TEFb upon CDK9 inhibition.
(A) Lysates of HeLa cells expressing the indicated shRNA and exposed to increasing concentrations of i-CDK9 were analyzed by immunoblotting for the indicated proteins. (B and C) Lysates of HeLa cells treated with the indicated drugs and their concentrations were analyzed by immunoblotting, with quantification of the pSer2 signals shown at the bottom. (D and E) Nuclear extracts (NE) of HeLa-based cells expressing MYC-F and untreated (−) or treated with i-CDK9 or DMSO were subjected to anti-Flag immunoprecipitation. The immunoprecipitates (IP) were examined by immunoblotting for the indicated proteins. (F, G, H, and I) HeLa (F and H) and H1792 (G and I) cells were incubated with JQ1 or i-CDK9 alone or together at various concentrations. The concentrations of each drug (IC50), either used as a single agent or in combination, that caused 50% of cells to show growth inhibition in Celltiter-Glo assay (F and G) or produce Caspase 3/7 (H and I) were plotted using the isobologram method. The dotted lines denote the IC50 values of i-CDK9 and JQ1 had the effects of the two compounds been simply additive. (J and K) HeLa cells were treated with the indicated concentrations of i-CDK9 plus JQ1 (J) or i-CDK9 plus 10,058-F4 (K) and measured by flow cytometry for propidium iodide (PI)-stained sub-G1 population. The error bars represent mean ± SD from three independent measurements.
Author response image 1
Author response image 2

Download links
A two-part list of links to download the article, or parts of the article, in various formats.
Downloads (link to download the article as PDF)
Open citations (links to open the citations from this article in various online reference manager services)
Cite this article (links to download the citations from this article in formats compatible with various reference manager tools)
Compensatory induction of MYC expression by sustained CDK9 inhibition via a BRD4-dependent mechanism
eLife 4:e06535.
https://doi.org/10.7554/eLife.06535


