In vivo dynamics of skeletal muscle Dystrophin in zebrafish embryos revealed by improved FRAP analysis
- King's College London, United Kingdom
- Centre de Biologie du Développement, France
- University of Surrey, United Kingdom
- Research unit Inserm, France
- Centre Scientifique de Monaco, Monaco
Figures
Figure 1
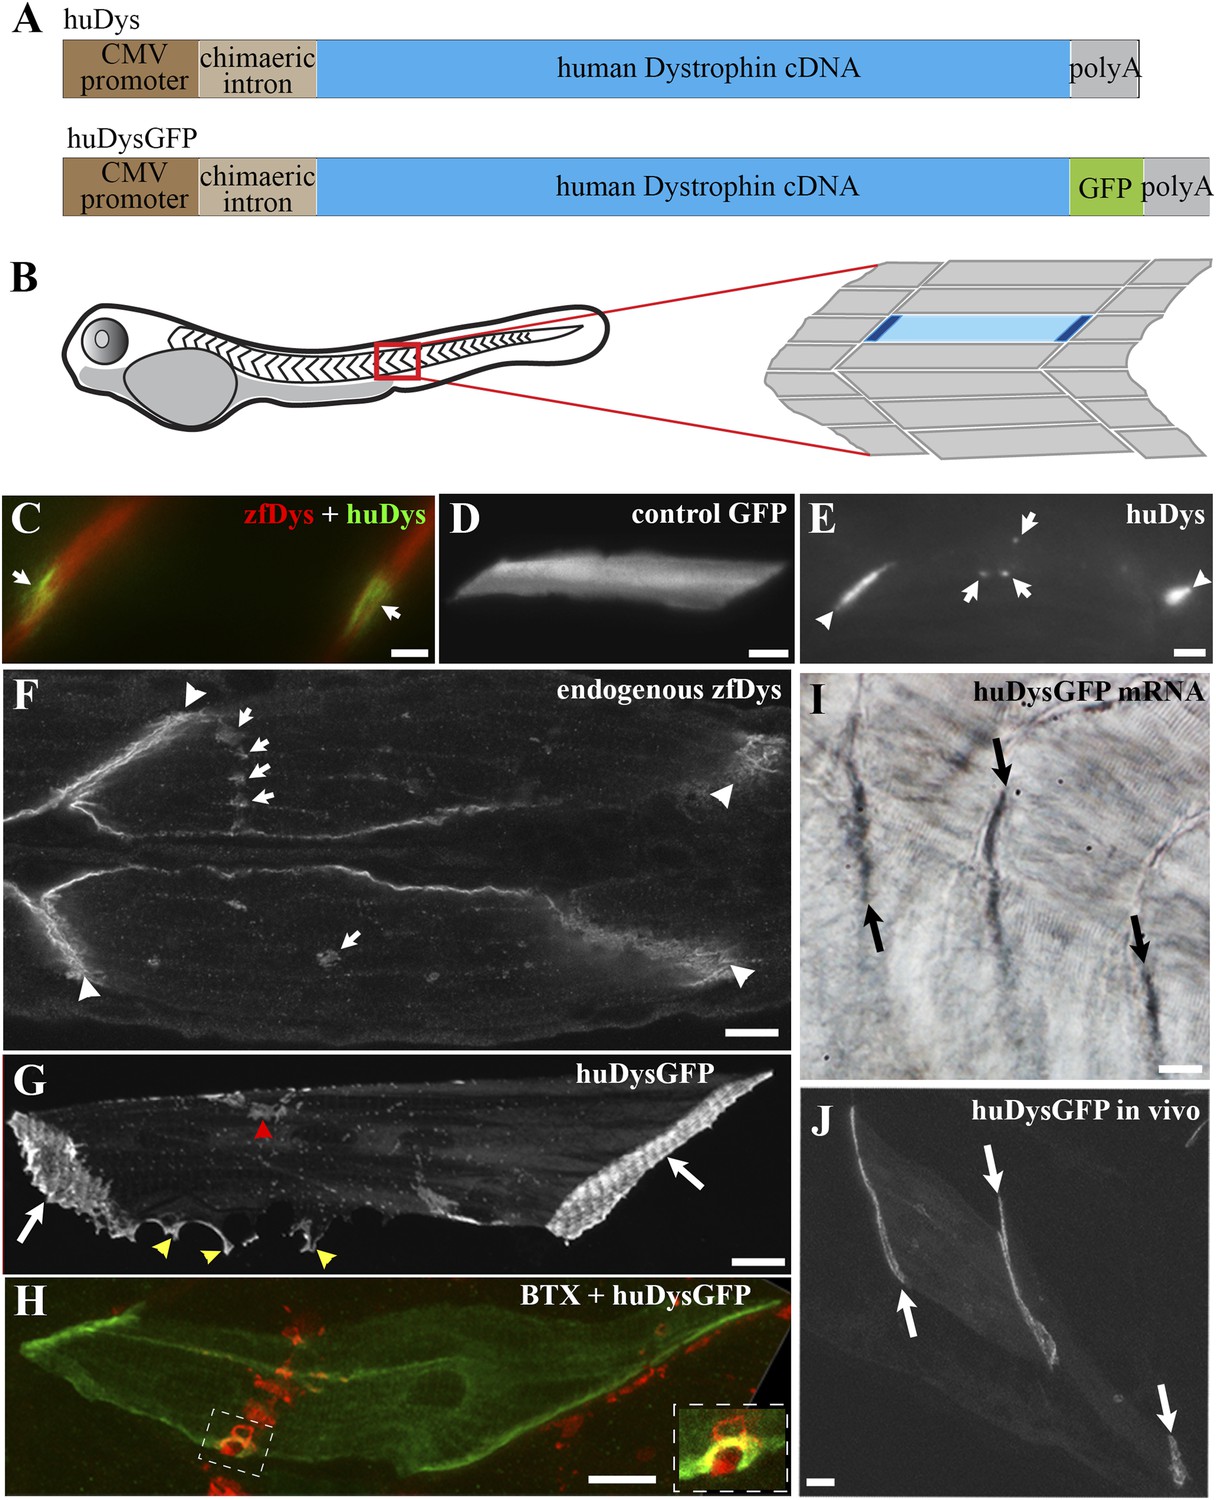
Human Dystrophin expression in the zebrafish embryo.
(A) Main features of the human Dystrophin expression constructs engineered for this study. (B) Schematic illustrating 2 dpf zebrafish embryo. Slow muscle fibres within the chevron-shaped somite, one magnified and highlighted in blue, are typically aligned anterior-posteriorly with their tips (dark blue) attaching at vertical somite borders. (C) Immunofluorescent detection of exogenous huDys (green, arrows) at fibre tips, co-localizing with endogenous zebrafish Dystrophin (zfDys, red) that accumulates at the tips of every muscle fibre, marking the somite border. (D) In vivo expression of control GFP shows accumulation in muscle fibre cytoplasm without enrichment at the fibre tips. (E) Immunodetection with antibody specifically recognizing human Dystrophin on whole mount 2 dpf embryo shows punctate accumulation of exogenous huDys (arrow) suggestive of localization at the NMJ, in addition to fibre tips (arrowheads). (F) Immunodetection on longitudinal cryostat sections of 2 dpf somitic muscle shows enrichment of endogenous zebrafish Dystrophin (zfDys) at NMJ (arrows). Note concentration of most zfDys at fibre tips (arrowheads). (G) Maximum intensity projection of a confocal stack showing accumulation of huDysGFP in a muscle fibre in vivo. Strong enrichment is noticeable at the tips (arrows), membrane protrusions (yellow arrowheads), and NMJ (red arrowheads). (H) Double immunofluorescent detection of GFP in a huDysGFP-expressing embryo (huDysGFP, green) and α-bungarotoxin (BTX, red) confirms co-localization at the NMJ (insert). (I, J) huDysGFP mRNA detected by in situ hybridization (arrows in I, Nomarski) localises at fibre tips like GFP fluorescence detected while in vivo (arrows in J; confocal maximum projection). Scale bars = 10 µm.
Figure 2
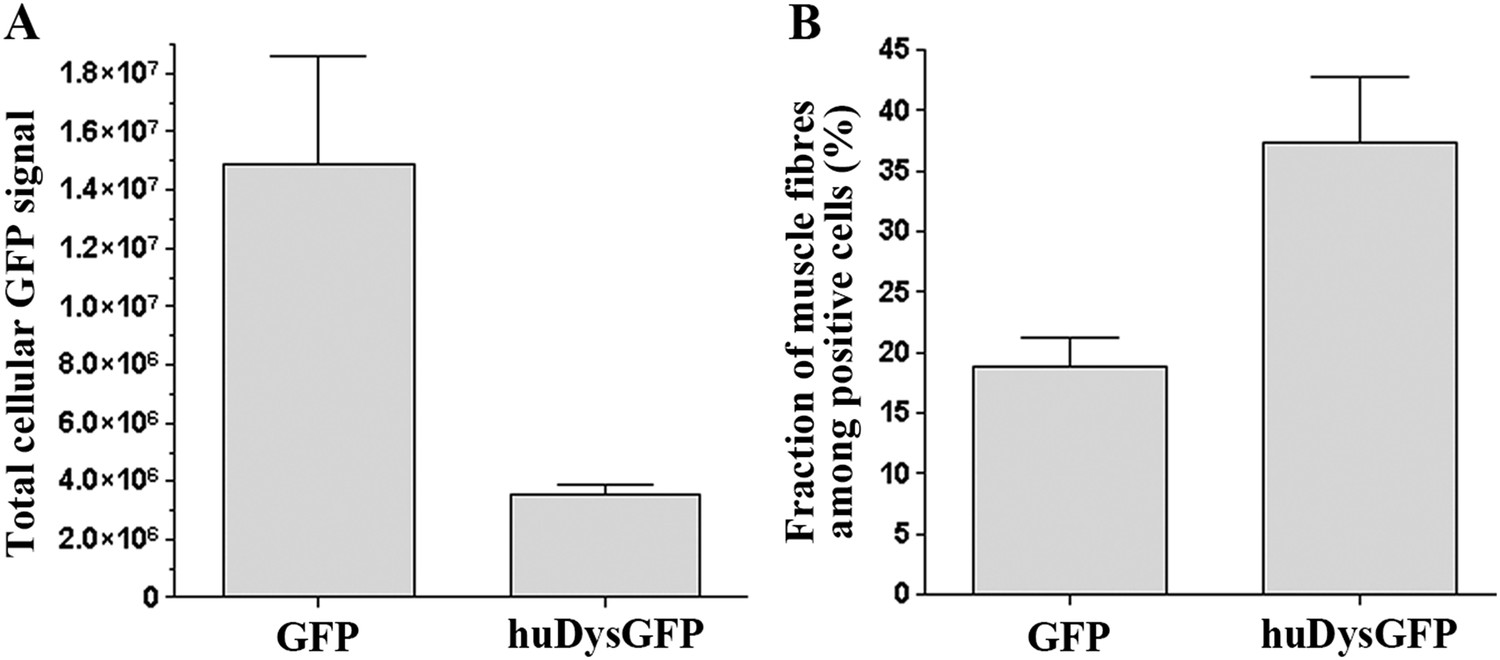
Comparison of huDysGFP and GFP expression in 2 dpf zebrafish embryos.
(A) Total cellular GFP signal (sum of pixel values) of sum projections made from confocal optical sections of individual muscle fibres expressing GFP or huDysGFP in vivo. NGFP = 10 fibres, NhuDysGFP = 32 fibres; p < 0. 0001. (B) Fraction of muscle fibres among positive cells in embryos expressing huDysGFP or GFP in vivo. NGFP = 1593 cells in 27 embryos, NhuDysGFP = 472 cells in 28 embryos; p = 0. 0032. Error bars show S.E.M.
Figure 3
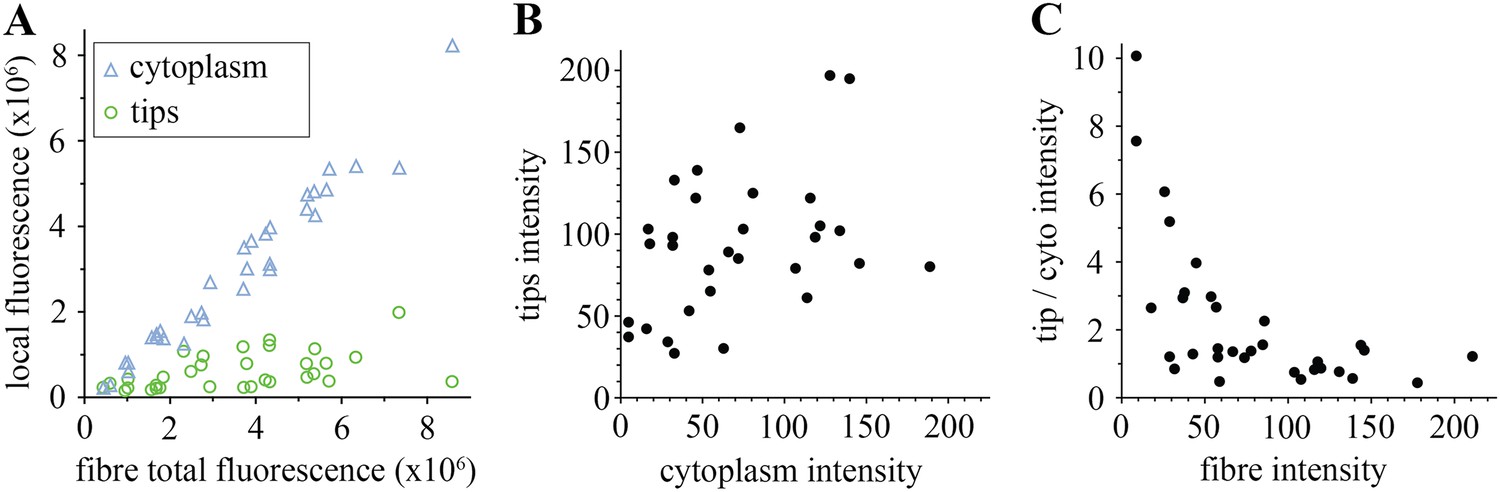
Comparison of tip and cytoplasm huDysGFP.
(A) Variation of the total fluorescence (as raw integrated density or sum of pixel values) at tips (green circles) and cytoplasm (blue triangles) over a population of 32 fibres expressing huDysGFP. (B) Mean voxel intensity at tips versus cytoplasm in sum projection of confocal z-stacks. The mean voxel intensity is calculated as the integrated density per pixel in the sum projections, therefore taking into account the fibre and tip size. (C) Ratio tip/cytoplasm voxel intensities shows an inverse correlation with the total fibre voxel intensity in sum projections of confocal z-stacks. p value = 0.0004, R2 = 0.3443, n = 32.
Figure 4
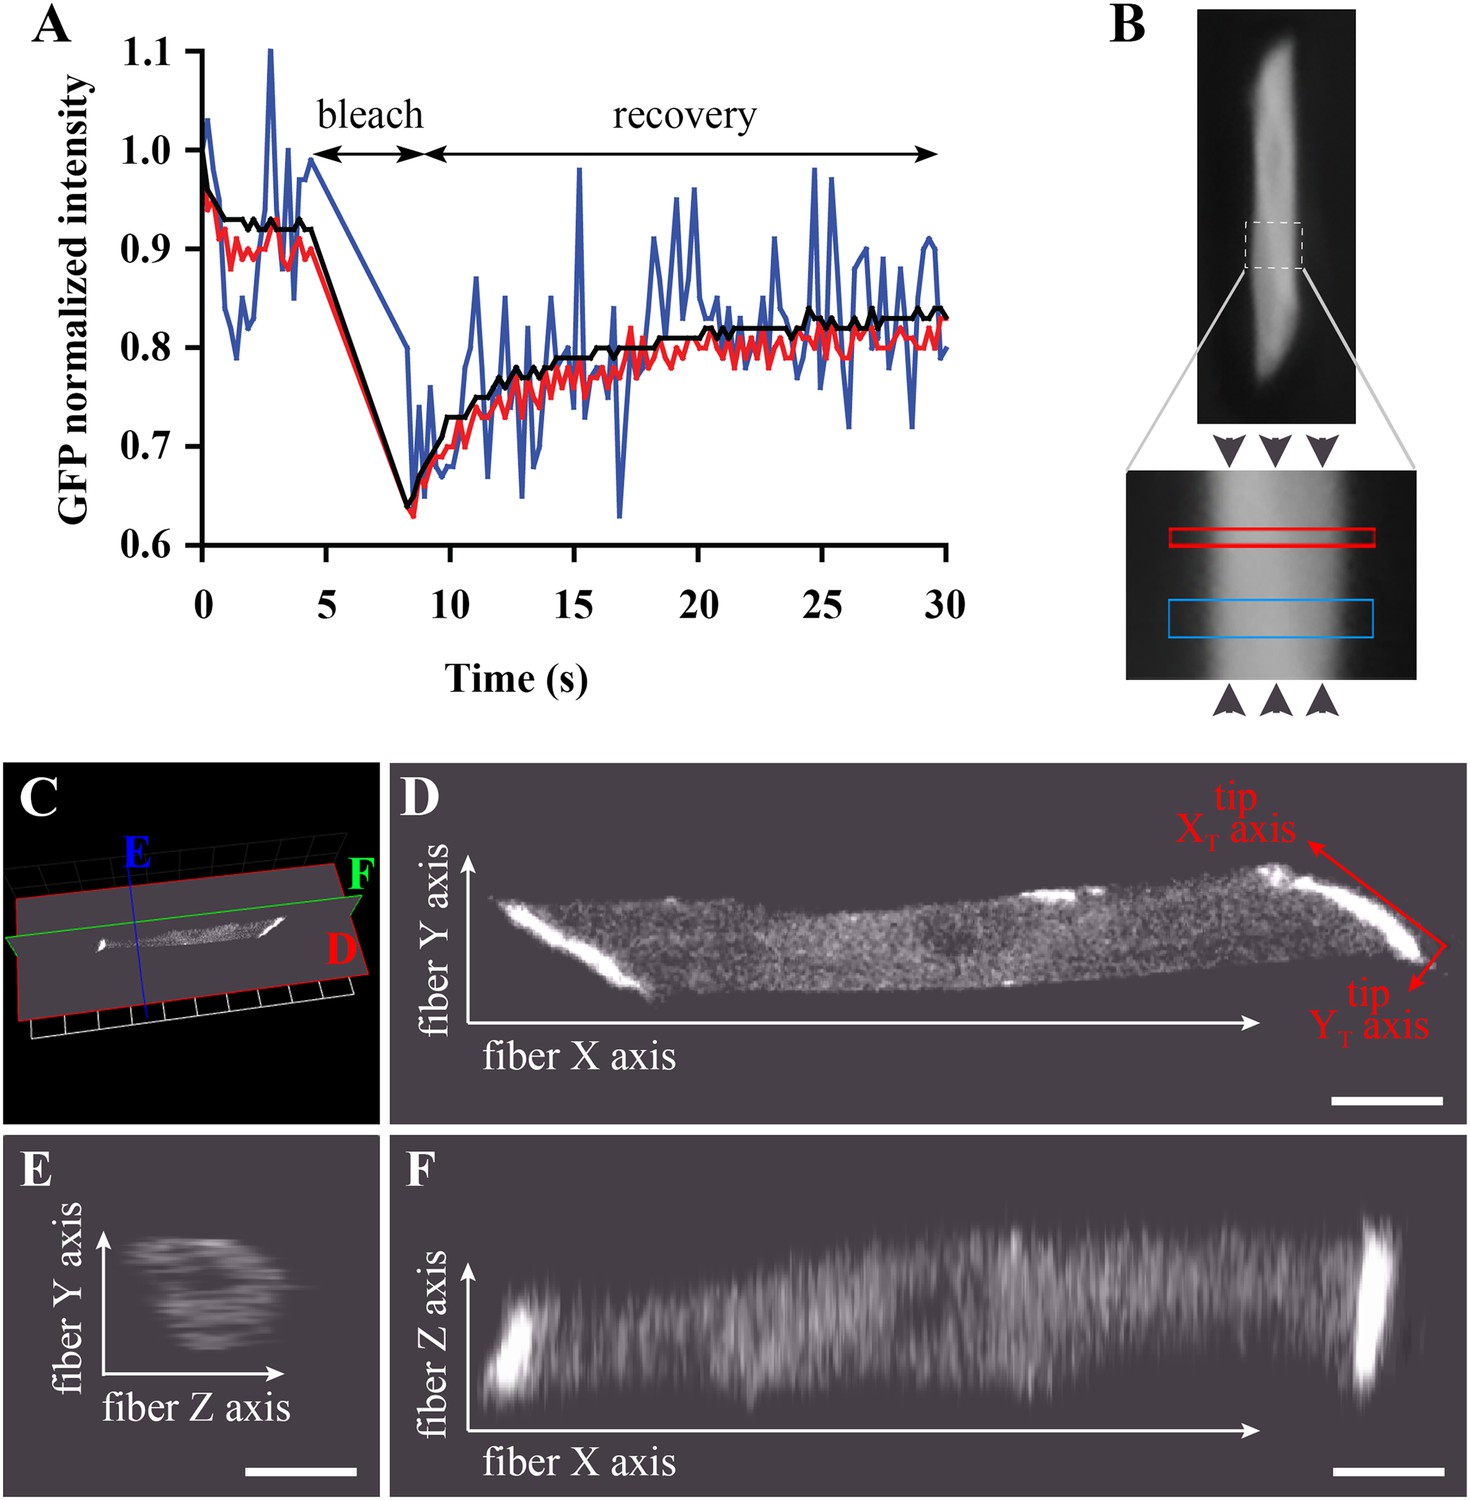
Bleaching areas: size optimization, orientation, and definition of Cartesian coordinates.
(A) Noise reduction in GFP FRAP curve for increasing areas: 1 (blue), 25 (red) and 256 (black) pixels. (B) To determine D along the X-axis (arrowheads) of individual muscle cells in the embryo, two large regions of different widths (narrow and wide; see Table 1) are bleached sequentially and separated by >1 min to ensure full recovery. (C) XYZ view from Volocity of a typical muscle fibre expressing huDysGFP in vivo. The cut planes shown correspond to panels D–F. (D) Muscle fibre imaged in the XY plane from a lateral position of the zebrafish embryo as embedded for FRAP. When referring to the fibre tips, we use a different set of axes: the long axis of the tip is the XT axis and the shorter is the YT axis. (E, F) YZ and XZ sections, respectively, through the muscle fibre, showing lower Z resolution. Scale bars = 10 µm.
Figure 5
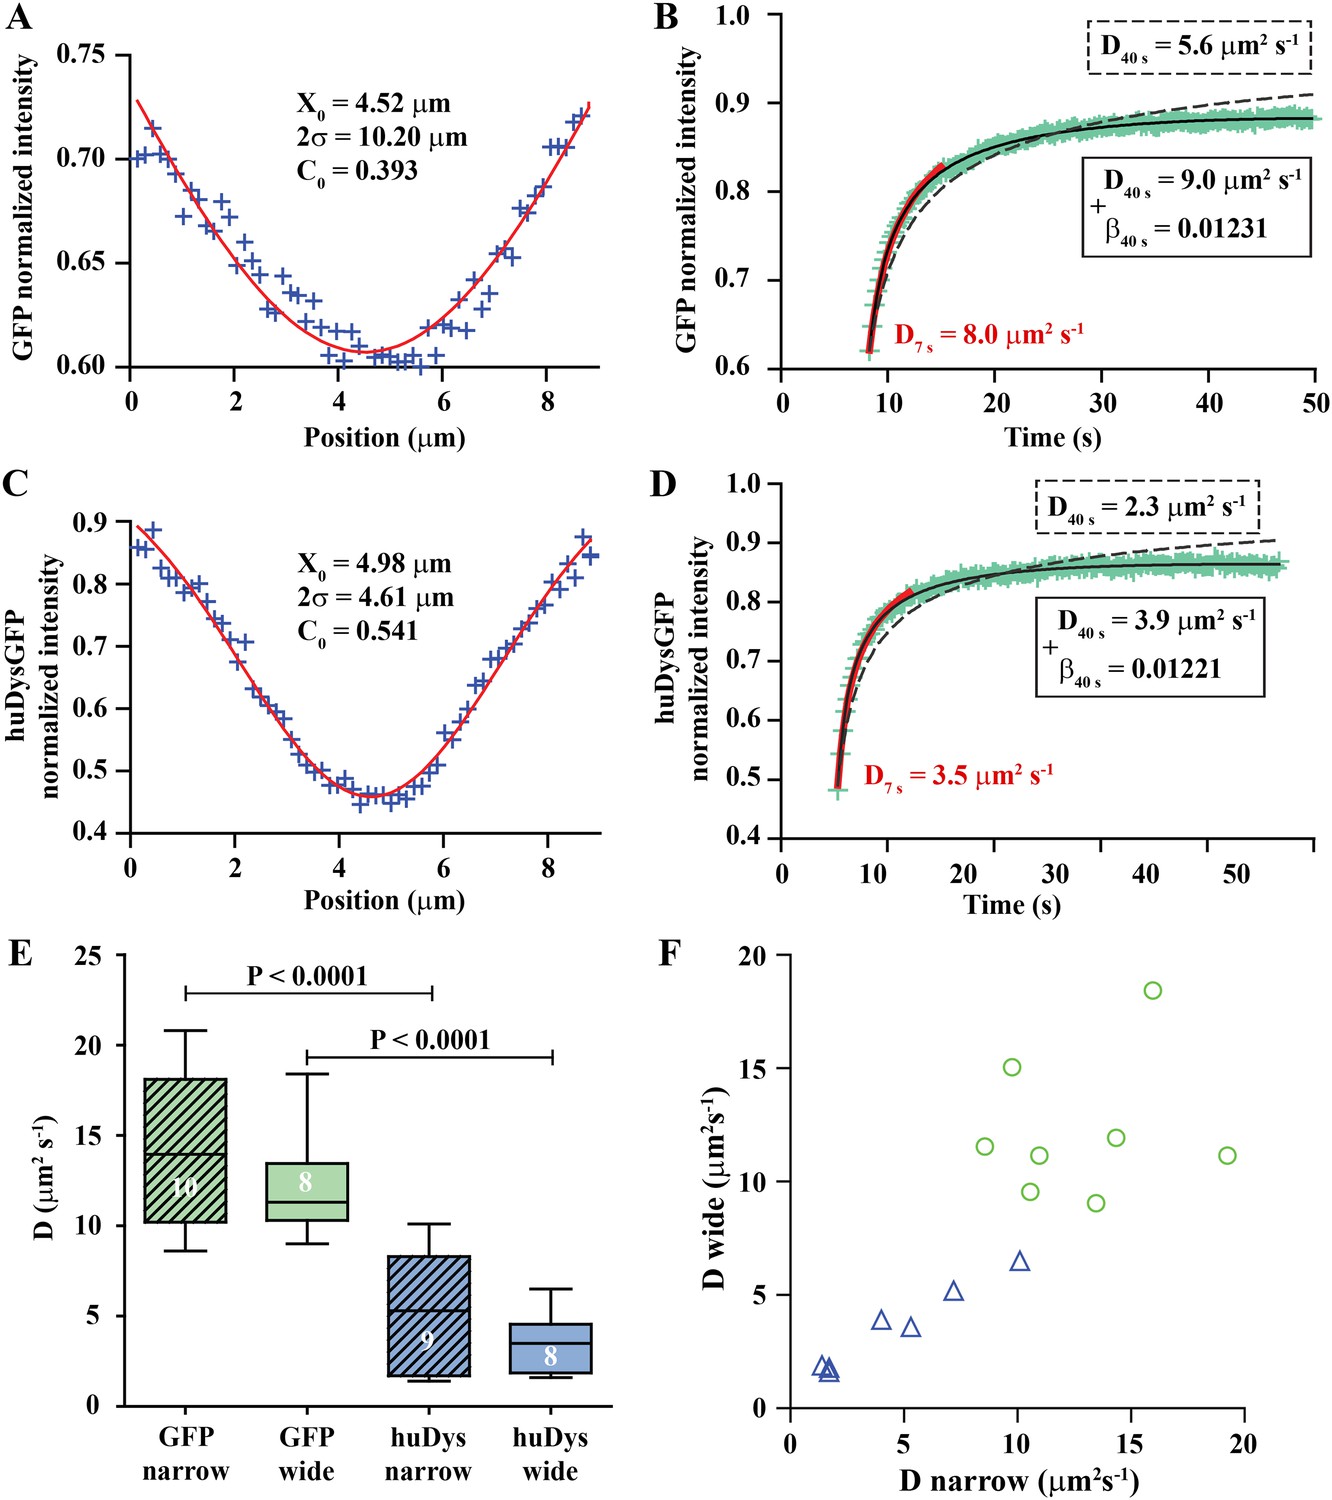
Analysis of cytoplasmic diffusion.
(A–D) FRAP experimental data and fitting curves. Normalized intensity profile along the X-axis of GFP (A) or huDysGFP (C) at the first time point after bleaching (blue crosses) and Gaussian fits (red curves). Recovery curves for GFP (B) and huDysGFP (D) along X-axis in which the cyan crosses show normalized fluorescence intensity in the bleached region. Curves are fits of the diffusion model to ∼7 s (red) or ∼40 s (two-parameters, solid black; one-parameter, dashed) post-bleach. (E) DGFP and DhuDysGFP obtained from two-parameter fits to ∼40 s of FRAP experimental data (see Table 1). Graph shows median, quartile, range, and n. Comparison was by two tailed t-test after test for normality. (F) Scatter plot of D values obtained for pairs of bleaching experiments performed in the same cell. For huDysGFP (triangles), the two D values measured in the same cell, in areas of different widths (narrow/wide), show a good correlation (triangles; Pearson R = 0.98). The triangles are not far from falling on a straight line of slope one. The small cell-to-cell variation in huDysGFP, relative to the variation between cells suggests that the mobility of huDysGFP genuinely varies from one fibre to another. For GFP, there is no definite trend visible, just scatter, presumably due to lower signal-to-noise with the more rapid diffusion of GFP. It is, therefore, not clear whether the mobility of GFP varies significantly from one fibre to another.
Figure 6
Analysis of bound Dystrophin.
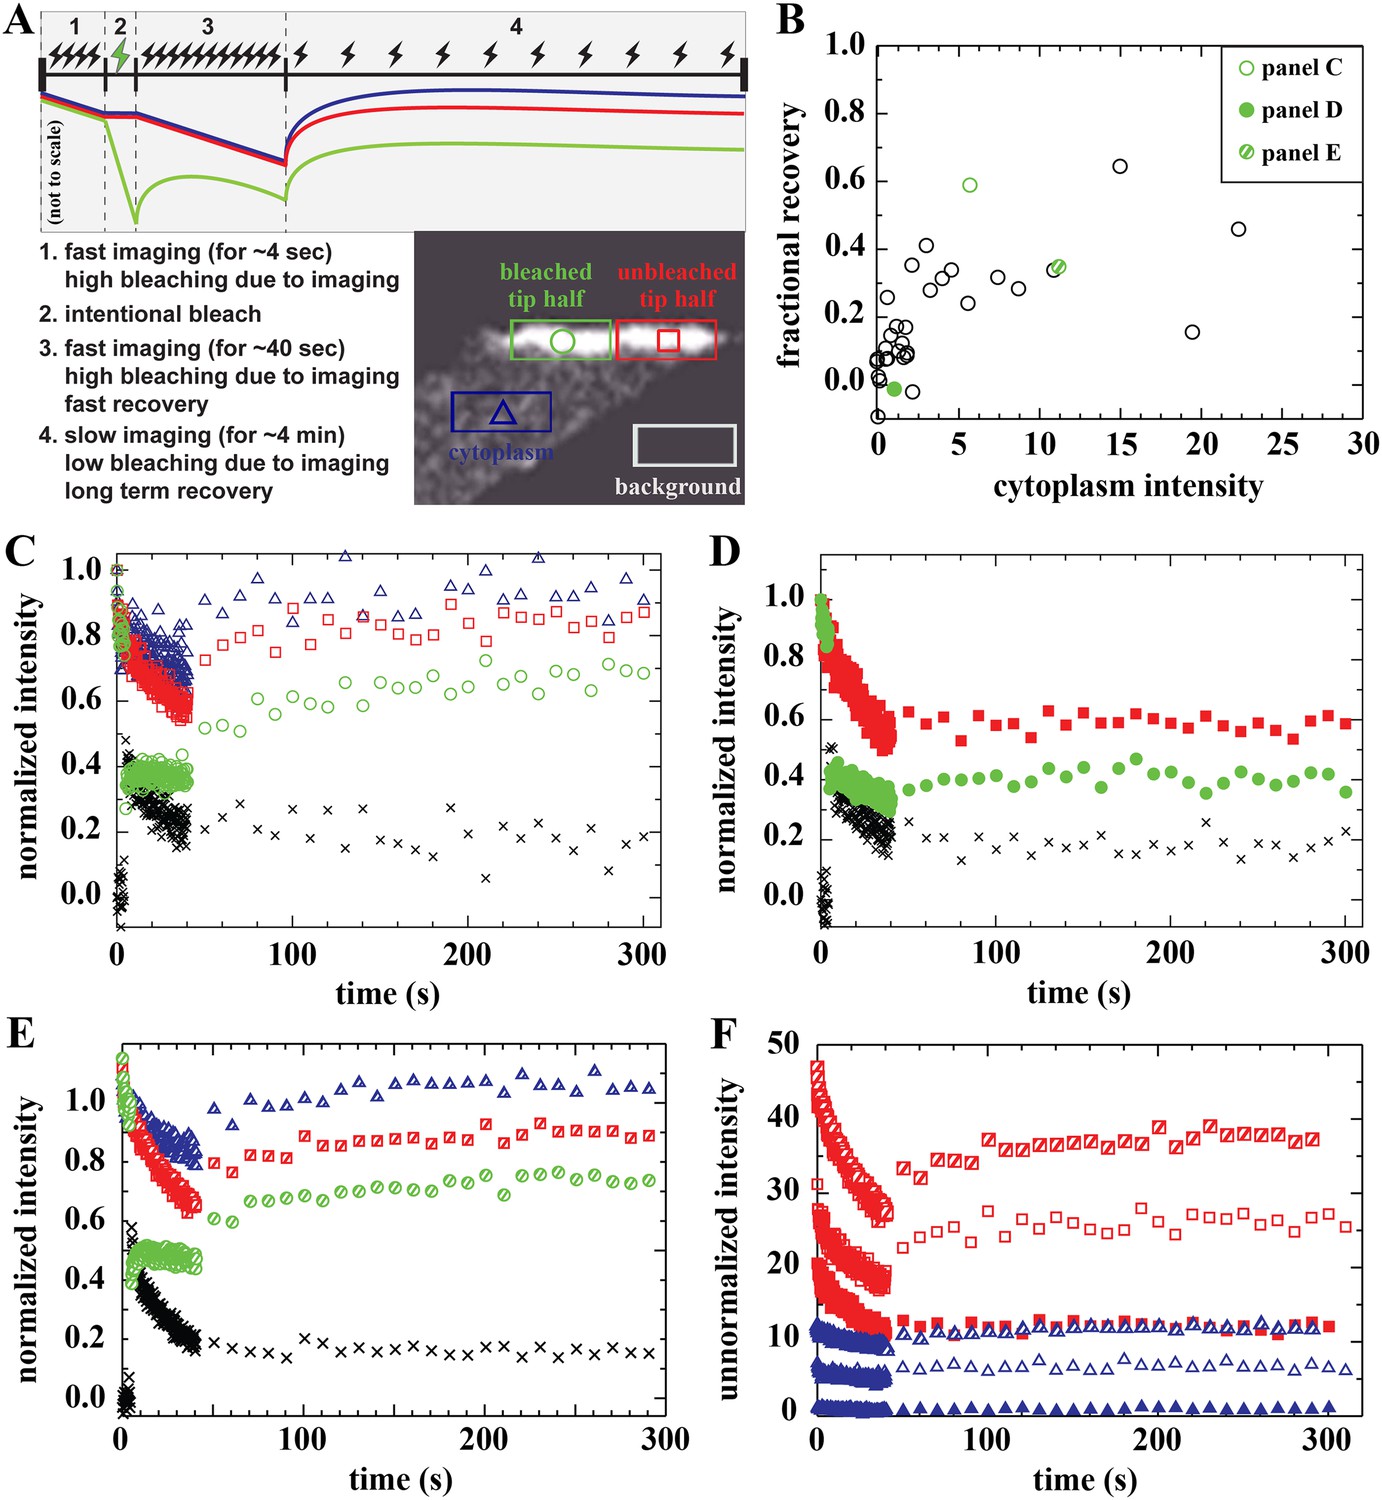
(A) FRAP protocol for tips and schematic FRAP curves showing effect of bleaching-due-to-imaging at high and low imaging frequency. Colour-coding of regions analysed in huDysGFP-expressing cell tips, correspond to traces in A–E. (B) Scatter plot of fractional recovery in tip pixels as a function of the cytoplasmic intensity. (C–E) Examples of normalized fluorescence curves, for tip FRAP recovery of three examples (indicated in B) of different tip recovery levels (C > E > D) and cytoplasmic intensity (E > C > D). Intensities in intentionally bleached region (green circles) are lower than in the unbleached tip region (red squares), yielding a difference (black crosses = red − green). Cytoplasm recovers almost fully (blue triangles). See Table 2 (C = tip7, D = tip27, E = tip32). (F) Examples of unnormalized fluorescence curves for unbleached tip (squares) and cytoplasm (triangles), in tips shown in C (open symbols), D (closed symbols), and E (hatched symbols). Note that absolute intensity recovery in tip is larger than in the cytoplasm, but higher cytoplasmic intensity does not result in higher tip recovery (C vs E).
Figure 7

Effect of dark state and lateral mobility on huDysGFP intensity recovery.
(A) To evaluate the recovery fraction due to dark state, huDysGFP was bleached in entire muscle fibres in vivo. Images shown were taken at t = 0 (top panel) and right after bleaching (middle panel); the red line defines the bleached region. Lower panel: plot of normalised fluorescence shows very low recovery after photobleaching (0.6%), presumably due to a shift from dark state to excitable huDysGFP. (B) FRAP tests for lateral mobility of bound huDysGFP. Top panel: initial image acquired from muscle fibre tip 7 showing the area to be bleached in green and the unbleached tip region in red. Middle and bottom panels: one-dimensional profiles along XT for an example of substantial recovery (middle panel, tip7) and little recovery (bottom panel, tip27). Profiles are shown at three time points: before deliberate bleaching (t = 0.93 s, black squares), just after bleaching (t = 5.3 s, orange triangles), and at the end of the experiment (t = 230 s, turquoise crosses). The intensity at each point is the average (background corrected) unnormalized intensity over the 20 pixel strip along the YT axis and averaged over 3 images, at the given time, plus the previous and next images.
Figure 8
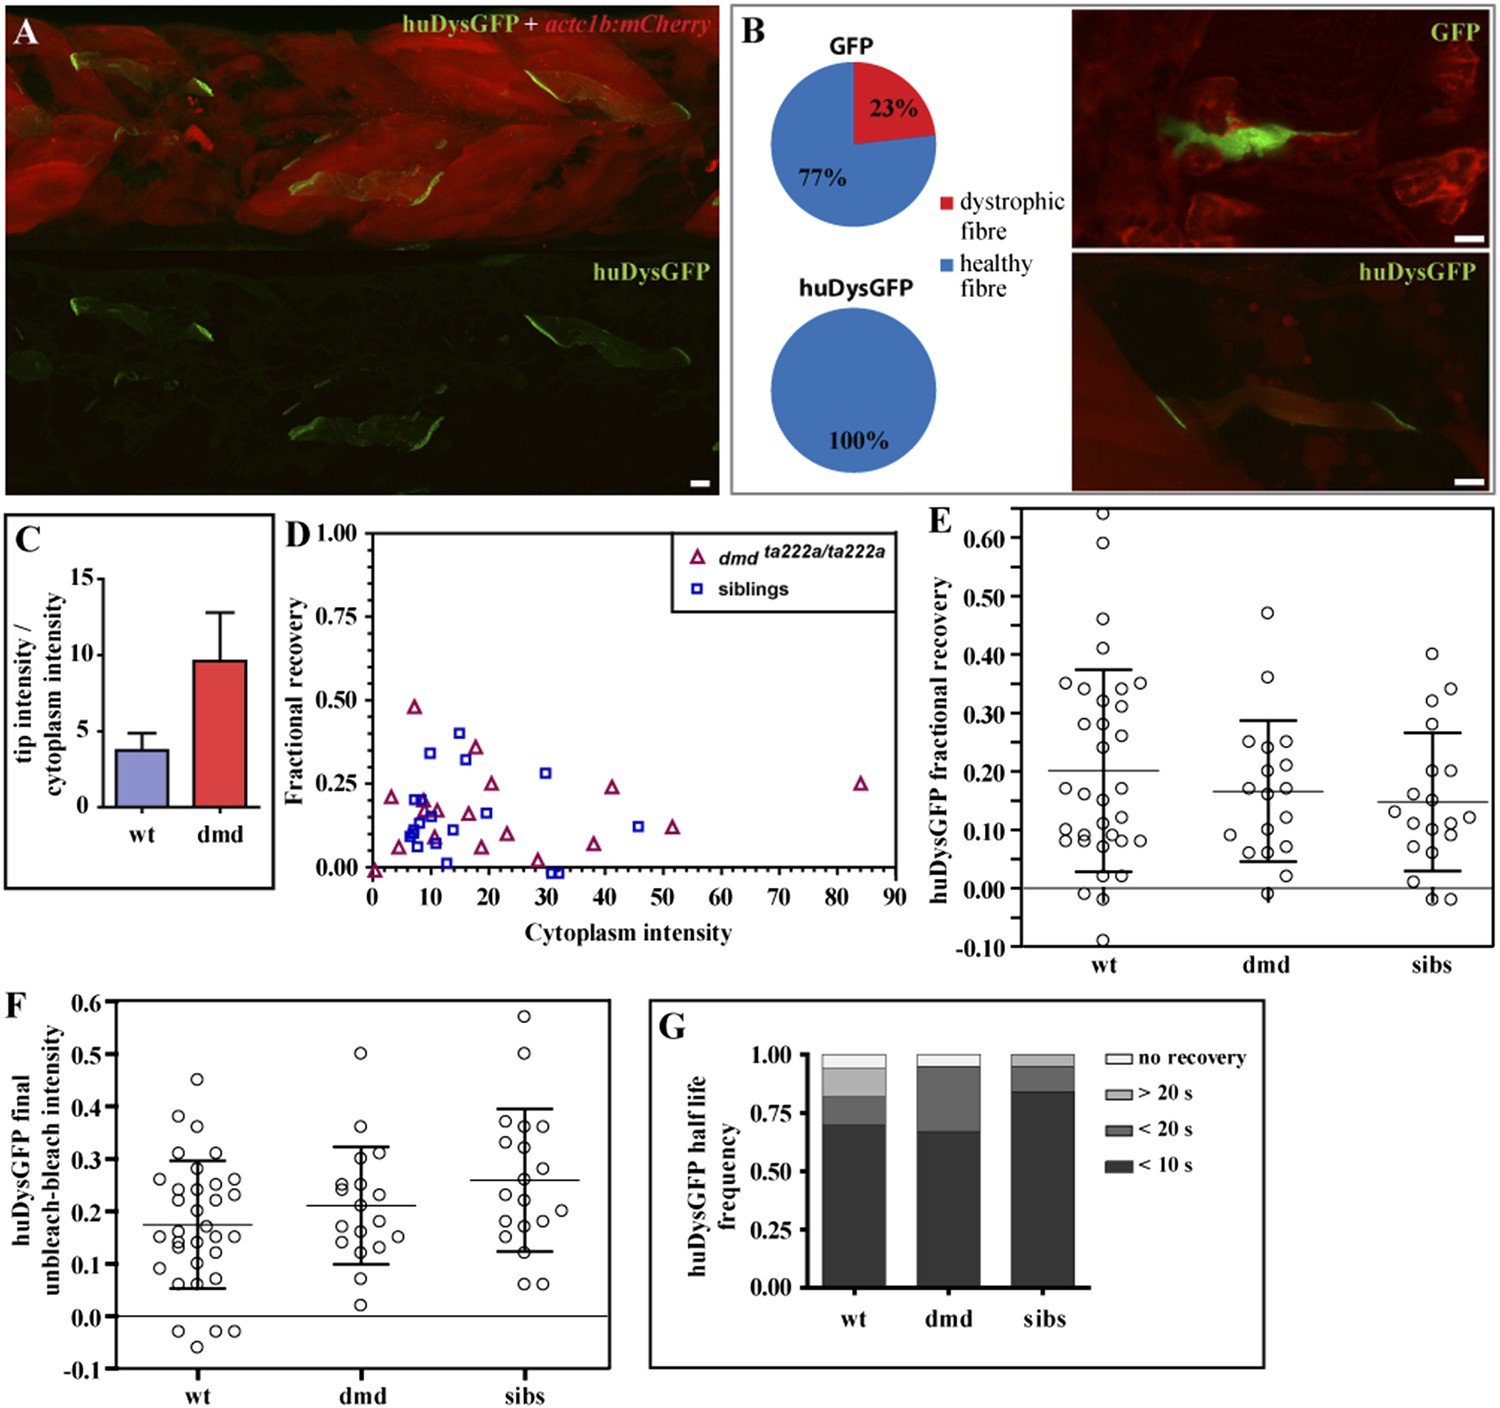
huDysGFP rescuing and binding dynamics in dmdta222a/ta222a embryos.
(A) 3 dpf dmdta222a/ta222a zebrafish embryo with typical dystrophic muscles as shown by actc1b:mCherry reporter (red) in vivo, with several healthy fibres expressing huDysGFP (green). (B) Control GFP mosaically expressed in dmdta222a/ta222a embryos is found in both healthy (77%) and dystrophic (23%) fibres (N = 56). Expression of huDysGFP fully rescues the dystrophic phenotype in dmdta222a/ta222a muscle fibres, as no cells expressing huDysGFP were found detached or unhealthy in any visible aspect (N = 56). p = 0.000126 in Chi-square test for significance between GFP and huDysGFP. GFP and huDysGFP-positive cells in regions of very dystrophic muscles in dmdta222a/ta222a zebrafish embryos are shown. The actc1b:mCherry reporter filling up the cytoplasm and huDysGFP expression at the tip suggest that the fibre structure is kept intact even without support from neighbouring cells, unlike the GFP-positive cell. (C) huDysGFP ratio tip intensity/cytoplasm intensity in wild-type (mean = 3.7 ± 1.1 s.e.m.; n = 33) and dmdta222a/ta222a (mean = 9.6 ± 3.2 s.e.m.; n = 13) zebrafish embryos. In the wild-type background, where huDysGFP competes with endogenous Dystrophin for available binding sites, the average ratio is 2.5 times lower than in the mutant background (p = 0.03), where huDysGFP can occupy all available sites. (D) Scatter plot of fractional recovery in bleached tip pixels as a function of the cytoplasmic intensity. (E) Comparative scatter plots, with mean and SD, of huDysGFP fractional recovery in bleached tip pixels in wild-type (wt), dmdta222a/ta222a (dmd) and their siblings (sibs). There were no statistically significant differences between groups as determined by one-way ANOVA [F(2,67) = 0.8628, ns]. (F) Comparative scatter plots, with mean and SD, of huDysGFP final unbleached tip minus bleached tip intensities in wild-type (wt), dmdta222a/ta222a (dmd) and their siblings (sibs). There were no statistically significant differences between groups as determined by one-way ANOVA [F(2,67) = 2.845, ns]. (G) huDysGFP fraction of cases showing no recovery, or 50% recovery at the first (<10 s), second (<20 s), or later (>20 s) time points, calculated from unbleached tip minus bleached tip intensities, in wild-type (wt), dmdta222a/ta222a (dmd) and their siblings (sibs). There were no statistically significant differences between groups as determined by one-way ANOVA [F(2,67) = 0.1521, ns]. Scale bars = 10 µm.
Figure 9
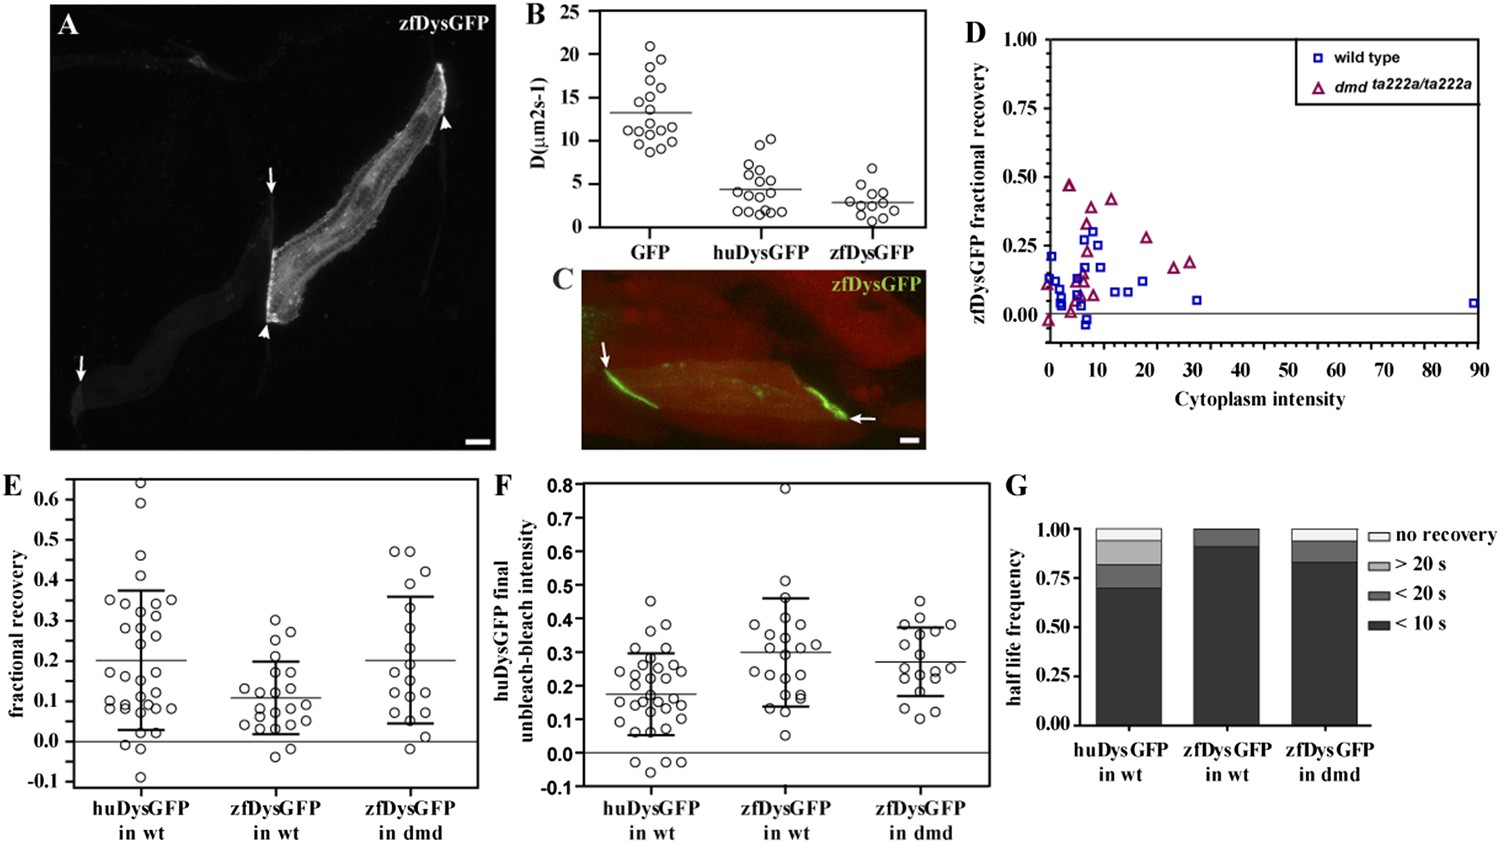
zfDysGFP dynamics in wild-type and dmdta222a/ta222a embryos.
(A) zfDysGFP variable intensity of expression in muscle fibres of 2 dpf wild-type embryo. Arrows point to low and arrowheads to high expressing tips. (B) Comparative scatter plots of DGFP, DhuDysGFP and DzfDysGFP. One-way ANOVA revealed a statistically significant difference between groups [F(2,44) = 57.08, p < 0.0001]. Tukey post-hoc test revealed that DhuDysGFP (4.4 ± 2.7 μms2s−1) and DzfDysGFP (2.9 ± 1.7 μms2s−1) are not statistically significant but are statistically significantly lower (p < 0.001) than DGFP (13.2 ± 3.7 μms2s−1). (C) A rescued zfDysGFP (green) fibre within a 2 dpf dmdta222a/ta222a zebrafish embryo with otherwise typical dystrophic muscles as shown by actc1b:mCherry (red, note extensive gaps in muscle) reporter in vivo. (D) Scatter plot of fractional recovery in bleached tip pixels as a function of the cytoplasmic intensity. (E) Comparative scatter plots, with mean and SD, of the fractional recovery in bleached tip pixels of huDysGFP in wild-type (wt) embryos, and zfDysGFP in wild-type and dmdta222a/ta222a (dmd) embryos. There were no statistically significant differences between groups as determined by one-way ANOVA [F(2,70) = 3.019, ns]. (F) Comparative scatter plots, with mean and SD, of final unbleached tip minus bleached tip intensities of huDysGFP in wild-type embryos, and zfDysGFP in wild-type and dmdta222a/ta222a embryos. One-way ANOVA revealed a statistically significant difference between groups [F(2,70) = 6.818, p = 0.002]. Tukey post-hoc test revealed that zfDysGFP in wild-type (0.3 ± 0.16, n = 22) and dmdta222a/ta222a embryos (0.3 ± 0.1, n = 18) are not statistically significant but huDysGFP (0.17 ± 0.12, n = 33) is statistically significantly lower than zfDysGFP in wild-type (p < 0.01) and in dmdta222a/ta222a embryos (p < 0.05). (G) Fraction of cases showing no recovery, or 50% recovery at the first (<10 s), second (<20 s), or later (>20 s) time points, calculated from unbleached tip minus bleached tip intensities, in huDysGFP in wild-type embryos, and zfDysGFP in wild-type and dmdta222a/ta222a embryos. There were no statistically significant differences between groups as determined by one-way ANOVA [F(2,70) = 1.405, ns]. Scale bars = 10 µm.
Figure 10
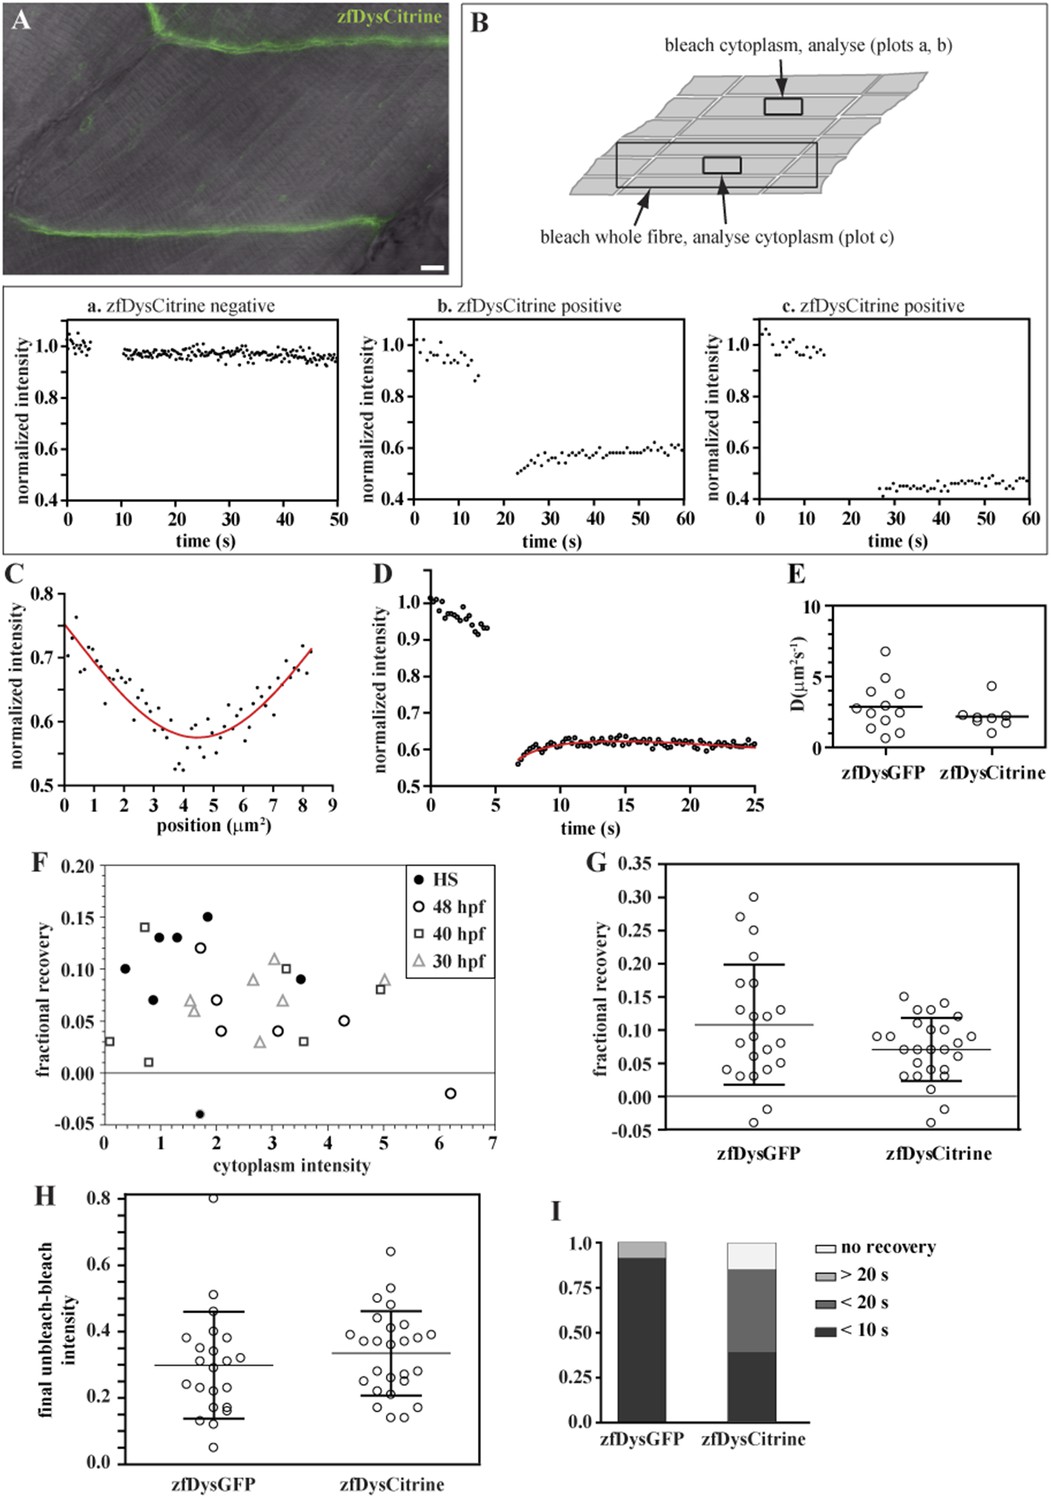
Endogenously driven zfDysCitrine dynamics.
(A) In vivo zfDysCitrine (green) expression in muscle fibres of 2 dpf Gt(dmd-citrine)ct90a embryo contrasted with transmitted light. (B) Schematics of zebrafish muscle fibres showing origin of scatter plots a, b, and c. Bleaching a region in the cytoplasm of Citrine-negative siblings (a) results in a flat curve of background fluorescence intensity, while the same experiment in Citrine-positive embryos (b) results in a significant drop in fluorescence followed by recovery. Bleaching a large region to include the entire fibre abolishes recovery (c), indicating that recovery from a citrine dark state makes a negligible contribution to recovery in (b). (C, D) Normalized FRAP experimental data and fitting curves of a zfDysCitrine fibre cytoplasm. (C) Normalized intensity profile along the X-axis at the first time point after bleaching (dots) and Gaussian fit (red line). (D) Recovery curves along X-axis (dots) and fit of the diffusion model to the post-bleach (red line). (E) Comparative scatter plots of DzfDysGFP and DzfDysCitrine. t test shows no statistically significant differences. (F) Scatter plot of fractional recovery in bleached tip pixels as a function of the cytoplasmic intensity, for zfDysCitrine embryos of different developmental stages. HS = heat-shocked embryos. (G) Comparative scatter plots, with mean and SD, of the fractional recovery in bleached tip pixels of zfDysGFP and zfDysCitrine. t test shows no statistically significant difference. (H) Comparative scatter plots, with mean and SD, of final unbleached tip minus bleached tip intensities of zfDysGFP and zfDysCitrine. t test shows no statistically significant differences. (I) Fraction of cases showing no recovery, or 50% recovery at the first (<10 s), second (<20 s), or later (>20 s) time points, calculated from unbleached tip minus bleached tip intensities, in zfDysGFP and zfDysCitrine. t test shows a statistically significant difference (p = 0.0016). Scale bar = 10 µm.
Figure 11

Model for Dystrophin membrane association.
Dystrophin is present in three states: cytoplasmic, bound mobile, and bound immobile. Switching between cytoplasmic and bound mobile (solid arrows) occurs at a rate of under a few seconds, limited by the diffusion rate. Immobile Dystrophin is stably bound for at least several minutes. Dashed arrows represent three possible routes to stable Dystrophin complex formation: (1) from a bound mobile Dystrophin intermediate, (2) by direct addition from the cytoplasmic pool, (3) by anchoring of nascent Dystrophin polypeptide chains from localized mRNA. These possibilities are not mutually exclusive.
Tables
Table 1
Diffusion constants, D, for GFP and Dystrophin in the cytoplasm obtained from fitting to FRAP experimental data
| Data set number (cell number) | Bleach width (pixels) | Final fitted time point | Fibre length (µm) | Bleach position (µm) | D (µm/s2) | β |
|---|---|---|---|---|---|---|
| GFP, standard fibre length | ||||||
| set 1 (cell 1) | 10 | 500 | 90.0 | 45.0 | 9.3 | 0.001753 |
| set 2 (cell 1) | 20 | 500 | 90.0 | 45.0 | 8.2 | 0.001572 |
| set 3 (cell 2) | 10 | 500 | 90.0 | 45.0 | 9.6 | 0.001502 |
| set 4 (cell 2) | 20 | 500 | 90.0 | 45.0 | 9.6 | 0.001483 |
| set 5 (cell 3) | 10 | 500 | 90.0 | 45.0 | 6.3 | 0.002618 |
| set 6 (cell 3) | 20 | 500 | 90.0 | 45.0 | 7.3 | 0.002503 |
| set 7 (cell 4) | 10 | 500 | 90.0 | 45.0 | 10.2 | 0.001980 |
| set 8 (cell 4) | 20 | 500 | 90.0 | 45.0 | 12.8 | 0.001181 |
| set 9 (cell 5) | 10 | 500 | 90.0 | 45.0 | 12.4 | 0.002358 |
| set 10 (cell 5) | 20 | 500 | 90.0 | 45.0 | 10.2 | 0.000961 |
| set 1 (cell 1) | 10 | 200 | 90.0 | 45.0 | 11.0 | 0.002259 |
| set 2 (cell 1) | 20 | 200 | 90.0 | 45.0 | 11.1 | 0.002861 |
| set 3 (cell 2) | 10 | 200 | 90.0 | 45.0 | 10.6 | 0.001721 |
| set 4 (cell 2) | 20 | 200 | 90.0 | 45.0 | 9.5 | 0.001418 |
| set 5 (cell 3) | 10 | 200 | 90.0 | 45.0 | 8.6 | 0.003959 |
| set 6 (cell 3) | 20 | 200 | 90.0 | 45.0 | 11.5 | 0.004743 |
| set 7 (cell 4) | 10 | 200 | 90.0 | 45.0 | 9.8 | 0.001765 |
| set 8 (cell 4) | 20 | 200 | 90.0 | 45.0 | 15.0 | 0.002000 |
| set 9 (cell 5) | 10 | 200 | 90.0 | 45.0 | 14.4 | 0.002998 |
| set 10 (cell 5) | 20 | 200 | 90.0 | 45.0 | 11.9 | 0.001895 |
| set 11 (cell 6) | 10 | 200 | 90.0 | 45.0 | 16.0 | 0.001196 |
| set 12 (cell 6) | 20 | 200 | 90.0 | 45.0 | 18.4 | 0.002364 |
| set 1 (cell 1) | 10 | 50 | 90.0 | 45.0 | 10.1 | 0.000000 |
| set 2 (cell 1) | 20 | 50 | 90.0 | 45.0 | 9.8 | 0.000000 |
| set 3 (cell 2) | 10 | 50 | 90.0 | 45.0 | 9.4 | 0.000000 |
| set 4 (cell 2) | 20 | 50 | 90.0 | 45.0 | 8.3 | 0.000000 |
| set 5 (cell 3) | 10 | 50 | 90.0 | 45.0 | 7.6 | 0.000000 |
| set 6 (cell 3) | 20 | 50 | 90.0 | 45.0 | 9.9 | 0.000000 |
| set 7 (cell 4) | 10 | 50 | 90.0 | 45.0 | 9.0 | 0.000000 |
| set 8 (cell 4) | 20 | 50 | 90.0 | 45.0 | 13.8 | 0.000000 |
| set 9 (cell 5) | 10 | 50 | 90.0 | 45.0 | 11.5 | 0.000000 |
| set 10 (cell 5) | 20 | 50 | 90.0 | 45.0 | 11.7 | 0.000000 |
| set 11 (cell 6) | 10 | 50 | 90.0 | 45.0 | 15.2 | 0.000000 |
| set 12 (cell 6) | 20 | 50 | 90.0 | 45.0 | 14.5 | 0.000000 |
| GFP, comparing measured and standard fibre length | ||||||
| set 13 (cell 7) | 8 | 200 | 82.0 | 41.0 | 13.3 | 0.001050 |
| set 14 (cell 7) | 32 | 200 | 82.0 | 41.0 | 8.9 | 0.001208 |
| set 15 (cell 8) | 8 | 200 | 79.0 | 40.0 | 18.5 | 0.001700 |
| set 16 (cell 8) | 32 | 200 | 79.0 | 40.0 | 10.8 | 0.002270 |
| set 17 (cell 9) | 8 | 200 | 83.0 | 30.0 | 19.8 | 0.000616 |
| set 18 (cell 10) | 8 | 200 | 102.0 | 44.0 | 17.1 | 0.001177 |
| set 13 (cell 7) | 8 | 200 | 90.0 | 45.0 | 13.5 | 0.001084 |
| set 14 (cell 7) | 32 | 200 | 90.0 | 45.0 | 9.0 | 0.001231 |
| set 15 (cell 8) | 8 | 200 | 90.0 | 45.0 | 19.3 | 0.001828 |
| set 16 (cell 8) | 32 | 200 | 90.0 | 45.0 | 11.1 | 0.002377 |
| set 17 (cell 9) | 8 | 200 | 90.0 | 45.0 | 20.8 | 0.000828 |
| set 18 (cell 10) | 8 | 200 | 90.0 | 45.0 | 16.9 | 0.001144 |
| set 13 (cell 7) | 8 | 50 | 90.0 | 45.0 | 10.9 | 0.000000 |
| set 14 (cell 7) | 32 | 50 | 90.0 | 45.0 | 8.0 | 0.000000 |
| set 15 (cell 8) | 8 | 50 | 90.0 | 45.0 | 12.9 | 0.000000 |
| set 16 (cell 8) | 32 | 50 | 90.0 | 45.0 | 9.0 | 0.000000 |
| set 17 (cell 9) | 8 | 50 | 90.0 | 45.0 | 18.5 | 0.000000 |
| set 18 (cell 10) | 8 | 50 | 90.0 | 45.0 | 15.2 | 0.000000 |
| huDysGFP, standard fibre length | ||||||
| set 19 (cell 11) | 8 | 200 | 90.0 | 45.0 | 10.1 | 0.005649 |
| set 20 (cell 11) | 16 | 200 | 90.0 | 45.0 | 6.5 | 0.005012 |
| set 21 (cell 12) | 8 | 200 | 90.0 | 45.0 | 7.2 | 0.002094 |
| set 22 (cell 12) | 16 | 200 | 90.0 | 45.0 | 5.2 | 0.001708 |
| set 23 (cell 13) | 8 | 200 | 90.0 | 45.0 | 1.7 | 0.003047 |
| set 24 (cell 13) | 16 | 200 | 90.0 | 45.0 | 1.8 | 0.001818 |
| set 25 (cell 14) | 8 | 200 | 90.0 | 45.0 | 9.4 | 0.008203 |
| set 26 (cell 15) | 8 | 200 | 90.0 | 45.0 | 6.0 | 0.004196 |
| set 27 (cell 16) | 4 | 200 | 90.0 | 45.0 | 1.4 | 0.001003 |
| set 28 (cell 16) | 10 | 200 | 90.0 | 45.0 | 1.9 | 0.000966 |
| set 19 (cell 11) | 8 | 50 | 90.0 | 45.0 | 8.7 | 0.000000 |
| set 20 (cell 11) | 16 | 50 | 90.0 | 45.0 | 5.2 | 0.000000 |
| set 21 (cell 12) | 8 | 50 | 90.0 | 45.0 | 6.4 | 0.000000 |
| set 22 (cell 12) | 16 | 50 | 90.0 | 45.0 | 4.9 | 0.000000 |
| set 23 (cell 13) | 8 | 50 | 90.0 | 45.0 | 1.5 | 0.000000 |
| set 24 (cell 13) | 16 | 50 | 90.0 | 45.0 | 1.7 | 0.000000 |
| set 25 (cell 14) | 8 | 50 | 90.0 | 45.0 | 7.7 | 0.000000 |
| set 26 (cell 15) | 8 | 50 | 90.0 | 45.0 | 5.1 | 0.000000 |
| set 27 (cell 16) | 4 | 50 | 90.0 | 45.0 | 1.3 | 0.000000 |
| set 28 (cell 16) | 10 | 50 | 90.0 | 45.0 | 1.8 | 0.000000 |
| huDysGFP, comparing measured and standard fibre length | ||||||
| set 29 (cell 17) | 4 | 200 | 130.0 | 62.0 | 1.7 | 0.001319 |
| set 30 (cell 17) | 10 | 200 | 130.0 | 62.0 | 1.6 | 0.001140 |
| set 31 (cell 18) | 4 | 200 | 124.0 | 49.0 | 4.0 | 0.000757 |
| set 32 (cell 18) | 10 | 200 | 124.0 | 49.0 | 3.9 | 0.001221 |
| set 33 (cell 19) | 4 | 200 | 106.0 | 51.0 | 5.3 | 0.001332 |
| set 34 (cell 19) | 10 | 200 | 106.0 | 51.0 | 3.6 | 0.001408 |
| set 35 (cell 20) | 10 | 200 | 112.0 | 31.0 | 3.4 | 0.004444 |
| set 29 (cell 17) | 4 | 200 | 90.0 | 45.0 | 1.7 | 0.001319 |
| set 30 (cell 17) | 10 | 200 | 90.0 | 45.0 | 1.6 | 0.001140 |
| set 31 (cell 18) | 4 | 200 | 90.0 | 45.0 | 4.0 | 0.000757 |
| set 32 (cell 18) | 10 | 200 | 90.0 | 45.0 | 3.9 | 0.001221 |
| set 33 (cell 19) | 4 | 200 | 90.0 | 45.0 | 5.3 | 0.001332 |
| set 34 (cell 19) | 10 | 200 | 90.0 | 45.0 | 3.6 | 0.001408 |
| set 35 (cell 20) | 10 | 200 | 90.0 | 45.0 | 3.4 | 0.004447 |
| set 29 (cell 17) | 4 | 50 | 90.0 | 45.0 | 1.4 | 0.000000 |
| set 30 (cell 17) | 10 | 50 | 90.0 | 45.0 | 1.6 | 0.000000 |
| set 31 (cell 18) | 4 | 50 | 90.0 | 45.0 | 3.6 | 0.000000 |
| set 32 (cell 18) | 10 | 50 | 90.0 | 45.0 | 3.5 | 0.000000 |
| set 33 (cell 19) | 4 | 50 | 90.0 | 45.0 | 4.0 | 0.000000 |
| set 34 (cell 19) | 10 | 50 | 90.0 | 45.0 | 3.5 | 0.000000 |
| set 35 (cell 20) | 10 | 50 | 90.0 | 45.0 | 3.1 | 0.000000 |
-
Diffusion is measured along the X (long) axis of the fibre. For most cells, two different size regions were bleached per fibre. The width of the bleached region in pixels is indicated for each data set (one pixel is 0.147 μm wide). Intentional bleaching was performed between time points 20 and 21. Two-parameter, D and β, fits were performed to long acquisition times, either to time points 21 to 200 (∼40 s) or time points 21 to 500 (∼110 s). One-parameter fits were also performed to only the initial recovery curve (points 21 to 50, or ∼7 s). For the latter fits, bleaching during imaging is too small to fit β, so we fix β = 0. Results of fits to FRAP curves for GFP and huDysGFP are presented for a model using either the actual fibre length and bleach position or with the standard length of 90 μm and a bleach position at 45 μm. Note that in most GFP cases, the difference between the fitted D values for standard and actual lengths and bleach positions is less than 1 μm2/s. This is smaller than our estimate of the uncertainties in these D values, which is several μm2/s. For huDysGFP, there was no difference within two significant figures. Due to the smaller diffusion constants of huDysGFP, varying the cell length within these limits makes no difference to the values of D. During a ∼30-s experiment, the bleached profile is not affected by a fibre tip ∼45 μm away, for values of D typical of huDysGFP. Values of D in the main text are obtained using all D values obtained for two-parameter fits to data to point 200, using model cells with the standard cell length and bleach position.
Table 2
Analysis of FRAP data on the tips of huDysGFP-expressing cells in wild-type embryos
| Tip number (cell number) | Cytoplasm intensity | Fractional recovery | Final normalized unbleached-bleached intensities | Unbleached-cytoplasm 50% recovery |
|---|---|---|---|---|
| 1 (cell 1) | 5.80 | 0.24 | 0.14 | <10 s |
| 2 (cell 1) | 4.58 | 0.34 | 0.23 | <10 s |
| 3 (cell 2) | 21.58 | 0.16 | 0.25 | no recovery |
| 4 (cell 2) | 21.90 | 0.46 | −0.06 | <20 s |
| 5 (cell 3) | 8.68 | 0.28 | 0.22 | <10 s |
| 6 (cell 3) | 4.04 | 0.31 | 0.14 | <10 s |
| 7 (cell 4) | 5.94 | 0.59 | 0.06 | <10 s |
| 8 (cell 4) | 15.03 | 0.64 | 0.09 | <10 s |
| 9 (cell 5) | 0.80 | 0.08 | 0.31 | no recovery |
| 10 (cell 5) | 1.81 | 0.17 | 0.36 | <10 s |
| 11 (cell 6) | 0.47 | 0.11 | −0.03 | <10 s |
| 12 (cell 7) | −0.08 | 0.07 | 0.38 | <10 s |
| 13 (cell 7) | 0.02 | 0.08 | 0.17 | <10 s |
| 14 (cell 8) | 0.50 | 0.08 | 0.13 | <10 s |
| 15 (cell 8) | 2.02 | 0.09 | −0.03 | <10 s |
| 16 (cell 9) | 2.22 | −0.02 | 0.10 | <10 s |
| 17 (cell 10) | 0.73 | 0.26 | 0.24 | <30 s |
| 18 (cell 11) | 1.26 | 0.10 | 0.31 | <10 s |
| 19 (cell 12) | 2.31 | 0.35 | 0.07 | <30 s |
| 20 (cell 12) | 1.63 | 0.08 | 0.20 | <10 s |
| 21 (cell 13) | 3.18 | 0.41 | 0.06 | <10 s |
| 22 (cell 14) | 0.07 | 0.02 | 0.24 | <10 s |
| 23 (cell 15) | 0.93 | 0.15 | 0.15 | <10 s |
| 24 (cell 16) | 0.15 | −0.09 | 0.16 | <30 s |
| 25 (cell 17) | 11.29 | 0.34 | 0.26 | >30 s |
| 26 (cell 17) | 7.88 | 0.32 | −0.03 | <20 s |
| 27 (cell 18) | 1.06 | −0.01 | 0.26 | <10 s |
| 28 (cell 19) | 2.05 | 0.09 | 0.22 | <20 s |
| 29 (cell 20) | 0.99 | 0.17 | 0.15 | <10 s |
| 30 (cell 21) | 0.15 | 0.02 | 0.45 | <10 s |
| 31 (cell 22) | 1.52 | 0.12 | 0.28 | <20 s |
| 32 (cell 22) | 11.86 | 0.35 | 0.15 | <10 s |
| 33 (cell 23) | 3.26 | 0.28 | 0.12 | <10 s |
-
Cytoplasm intensity is the background-subtracted intensity on an 8-bit scale. It is calculated in a rectangular region of a few hundred pixels inside the cell but away from the tip and is averaged over images 4 to 20 (the last one before bleaching). Fractional recovery is the ratio RT/IT, where, RT is the intensity recovery in the tip, and IT is the average pre-bleach intensity in the bleached region. RT is the average intensity in the bleached region in the final time point (200), minus that in the first point after bleaching (21), and IT is averaged over images 4 to 20. Final normalised unbleached minus bleached intensities is the difference between the average normalized intensities in the unbleached and bleached regions, derived from the average of the final 20 time points (181–200). Unbleached minus cytoplasm 50% recovery evaluates if at least 50% of the final recovery of unbleached minus cytoplasm curves was rapidly attained, at the first (<10 s), second (<20 s), or later time points after switching from fast to slow acquisition rates. Note that both tips of some fibres were analysed.
Table 3
Analysis of FRAP data on the tips of huDysGFP-expressing cells in dmdta222a/ta222a embryos and siblings
| Tip number | Embryo genotype | Cytoplasm intensity | Fractional recovery | Final normalized unbleached-bleached intensities | Unbleached-cytoplasm 50% recovery |
|---|---|---|---|---|---|
| 1 | dmdta222a/ta222a | 51.56 | 0.12 | 0.18 | <10 s |
| 2 | dmdta222a/ta222a | 23.12 | 0.10 | 0.31 | <10 s |
| 3 | dmdta222a/ta222a | 38.04 | 0.07 | 0.25 | no recovery |
| 4 | dmdta222a/ta222a | 83.99 | 0.25 | 0.02 | <10 s |
| 5 | dmdta222a/ta222a | 4.46 | 0.06 | 0.30 | <10 s |
| 6 | dmdta222a/ta222a | 0.34 | −0.01 | 0.21 | <10 s |
| 7 | dmdta222a/ta222a | 3.16 | 0.21 | 0.17 | <20 s |
| 8 | dmdta222a/ta222a | 16.49 | 0.16 | 0.24 | <10 s |
| 9 | dmdta222a/ta222a | 18.67 | 0.06 | 0.07 | <10 s |
| 10 | dmdta222a/ta222a | 8.73 | 0.20 | 0.25 | <10 s |
| 11 | dmdta222a/ta222a | 7.12 | 0.47 | 0.12 | <20 s |
| 12 | dmdta222a/ta222a | 11.06 | 0.17 | 0.15 | <20 s |
| 13 | dmdta222a/ta222a | 10.65 | 0.09 | 0.23 | <10 s |
| 14 | dmdta222a/ta222a | 28.41 | 0.02 | 0.13 | <20 s |
| 15 | dmdta222a/ta222a | 8.91 | 0.17 | 0.14 | <10 s |
| 16 | dmdta222a/ta222a | 41.16 | 0.24 | 0.16 | <10 s |
| 17 | dmdta222a/ta222a | 17.71 | 0.36 | 0.50 | <20 s |
| 18 | dmdta222a/ta222a | 20.43 | 0.25 | 0.36 | <10 s |
| 19 | sibling | 30.85 | −0.02 | 0.20 | <10 s |
| 20 | sibling | 45.81 | 0.12 | 0.17 | <30 s |
| 21 | sibling | 13.89 | 0.11 | 0.23 | <10 s |
| 22 | sibling | 7.05 | 0.10 | 0.33 | <10 s |
| 23 | sibling | 12.78 | 0.01 | 0.32 | <10 s |
| 24 | sibling | 6.48 | 0.09 | 0.26 | <10 s |
| 25 | sibling | 10.95 | 0.07 | 0.28 | <10 s |
| 26 | sibling | 8.35 | 0.20 | 0.22 | <10 s |
| 27 | sibling | 10.14 | 0.15 | 0.15 | <10 s |
| 28 | sibling | 7.15 | 0.11 | 0.50 | <10 s |
| 29 | sibling | 7.77 | 0.06 | 0.57 | <10 s |
| 30 | sibling | 19.64 | 0.16 | 0.18 | <10 s |
| 31 | sibling | 16.08 | 0.32 | 0.36 | <10 s |
| 32 | sibling | 8.11 | 0.13 | 0.37 | <10 s |
| 33 | sibling | 7.30 | 0.20 | 0.36 | <10 s |
| 34 | sibling | 14.99 | 0.40 | 0.06 | <20 s |
| 35 | sibling | 29.82 | 0.28 | 0.06 | <20 s |
| 36 | sibling | 9.95 | 0.34 | 0.18 | <10 s |
| 37 | sibling | 32.10 | −0.02 | 0.12 | <10 s |
-
See Table 2 for detailed information.
Table 4
Analysis of FRAP data on the tips of zfDysGFP-expressing cells in wild-type and dmdta222a/ta222a embryos
| Tip number (cell number) | Embryo genotype | Cytoplasm intensity | Fractional recovery | Final normalized unbleached-bleached intensities | Unbleached-cytoplasm 50% recovery |
|---|---|---|---|---|---|
| 1 (cell 1) | wild type | 14.59 | 0.08 | 0.46 | <10 s |
| 2 (cell 2) | wild type | 5.06 | 0.07 | 0.24 | <10 s |
| 3 (cell 3) | wild type | 9.44 | 0.17 | 0.12 | <20 s |
| 4 (cell 4) | wild type | 6.51 | 0.17 | 0.38 | <10 s |
| 5 (cell 4) | wild type | 8.02 | 0.30 | 0.05 | <10 s |
| 6 (cell 5) | wild type | 79.28 | 0.04 | 0.22 | <10 s |
| 7 (cell 6) | wild type | 1.78 | 0.09 | 0.51 | <20 s |
| 8 (cell 6) | wild type | 1.01 | 0.12 | 0.38 | <10 s |
| 9 (cell 7) | wild type | 0.28 | 0.21 | 0.13 | <10 s |
| 10 (cell 8) | wild type | 27.46 | 0.05 | 0.16 | <10 s |
| 11 (cell 9) | wild type | 12.13 | 0.08 | 0.17 | <10 s |
| 12 (cell 9) | wild type | 17.34 | 0.12 | 0.40 | <10 s |
| 13 (cell 10) | wild type | 5.09 | 0.13 | 0.23 | <10 s |
| 14 (cell 10) | wild type | 2.14 | 0.03 | 0.34 | <10 s |
| 15 (cell 11) | wild type | −0.13 | 0.13 | 0.80 | <10 s |
| 16 (cell 12) | wild type | 2.09 | 0.06 | 0.17 | <10 s |
| 17 (cell 12) | wild type | 1.94 | 0.04 | 0.31 | <10 s |
| 18 (cell 13) | wild type | 5.80 | 0.03 | 0.29 | <10 s |
| 19 (cell 13) | wild type | 6.65 | −0.04 | 0.32 | <10 s |
| 20 (cell 14) | wild type | 6.42 | 0.27 | 0.31 | <10 s |
| 21 (cell 14) | wild type | 6.87 | −0.02 | 0.35 | <10 s |
| 22 (cell 15) | wild type | 8.96 | 0.25 | 0.23 | <10 s |
| 23 (cell 16) | dmdta222a/ta222a | 11.40 | 0.42 | 0.25 | <10 s |
| 24 (cell 17) | dmdta222a/ta222a | 4.70 | 0.05 | 0.35 | <10 s |
| 25 (cell 17) | dmdta222a/ta222a | 3.81 | 0.01 | 0.40 | <10 s |
| 26 (cell 18) | dmdta222a/ta222a | 6.77 | 0.33 | 0.12 | <10 s |
| 27 (cell 19) | dmdta222a/ta222a | −0.38 | −0.02 | 0.36 | <10 s |
| 28 (cell 19) | dmdta222a/ta222a | −0.60 | 0.11 | 0.32 | <10 s |
| 29 (cell 20) | dmdta222a/ta222a | 4.86 | 0.12 | 0.38 | <10 s |
| 30 (cell 21) | dmdta222a/ta222a | 3.45 | 0.47 | 0.24 | <10 s |
| 31 (cell 21) | dmdta222a/ta222a | 3.60 | 0.47 | 0.25 | <10 s |
| 32 (cell 22) | dmdta222a/ta222a | 7.60 | 0.39 | 0.10 | <10 s |
| 33 (cell 23) | dmdta222a/ta222a | 26.07 | 0.19 | 0.18 | <10 s |
| 34 (cell 24) | dmdta222a/ta222a | 6.08 | 0.15 | 0.45 | <10 s |
| 35 (cell 24) | dmdta222a/ta222a | 8.03 | 0.07 | 0.38 | no recovery |
| 36 (cell 25) | dmdta222a/ta222a | 17.93 | 0.28 | 0.22 | <10 s |
| 37 (cell 26) | dmdta222a/ta222a | 6.21 | 0.12 | 0.23 | <10 s |
| 38 (cell 27) | dmdta222a/ta222a | 5.62 | 0.07 | 0.13 | <20 s |
| 39 (cell 28) | dmdta222a/ta222a | 6.88 | 0.23 | 0.22 | <10 s |
| 40 (cell 29) | dmdta222a/ta222a | 23.05 | 0.17 | 0.29 | <20 s |
-
See Table 2 for detailed information.
Table 5
Analysis of FRAP data on the tips of ZfDysCitrine expressing cells in Gt(dmd-Citrine)ct90a embryos
| Tip number | Set | Cytoplasm intensity | Fractional recovery | Final normalized unbleached-bleached intensities | Unbleached-cytoplasm 50% recovery |
|---|---|---|---|---|---|
| 1 | heat shock | 1.71 | −0.04 | 0.37 | <20 s |
| 2 | heat shock | 1.85 | 0.15 | 0.14 | <20 s |
| 3 | heat shock | 0.37 | 0.10 | 0.39 | <20 s |
| 4 | heat shock | 3.52 | 0.09 | 0.14 | <30 s |
| 5 | heat shock | 0.98 | 0.13 | 0.17 | <20 s |
| 6 | heat shock | 0.87 | 0.07 | 0.21 | <20 s |
| 7 | heat shock | 1.30 | 0.13 | 0.17 | <10 s |
| 8 | 48 hpf | 4.30 | 0.05 | 0.36 | <10 s |
| 9 | 48 hpf | 3.11 | 0.04 | 0.37 | <10 s |
| 10 | 48 hpf | 1.72 | 0.12 | 0.53 | <20 s |
| 11 | 48 hpf | 2.09 | 0.04 | 0.39 | <20 s |
| 12 | 48 hpf | 2.01 | 0.07 | 0.42 | <10 s |
| 13 | 48 hpf | 6.21 | −0.02 | 0.41 | <10 s |
| 14 | 40 hpf | 3.26 | 0.10 | 0.27 | <20 s |
| 15 | 40 hpf | 0.72 | 0.14 | 0.25 | <30 s |
| 16 | 40 hpf | 3.57 | 0.03 | 0.26 | <20 s |
| 17 | 40 hpf | 4.95 | 0.08 | 0.22 | <20 s |
| 18 | 40 hpf | 0.79 | 0.01 | 0.25 | <10 s |
| 19 | 40 hpf | 0.09 | 0.03 | 0.28 | <20 s |
| 20 | 30 hpf | 1.53 | 0.07 | 0.38 | <10 s |
| 21 | 30 hpf | 1.60 | 0.06 | 0.48 | <60 s |
| 22 | 30 hpf | 5.02 | 0.09 | 0.50 | <20 s |
| 23 | 30 hpf | 2.66 | 0.09 | 0.64 | <40 s |
| 24 | 30 hpf | 3.04 | 0.11 | 0.44 | <10 s |
| 25 | 30 hpf | 3.19 | 0.07 | 0.37 | <10 s |
| 26 | 30 hpf | 2.78 | 0.03 | 0.28 | <10 s |
-
In embryos subjected to heat shock (tips 1–7), individual fibres could be selected for FRAP, at 48 hpf, and background levels are taken into account, contrary to the remaining cases (tips 8–26). See Table 2 for detailed information.
Download links
A two-part list of links to download the article, or parts of the article, in various formats.
Downloads (link to download the article as PDF)
Open citations (links to open the citations from this article in various online reference manager services)
Cite this article (links to download the citations from this article in formats compatible with various reference manager tools)
In vivo dynamics of skeletal muscle Dystrophin in zebrafish embryos revealed by improved FRAP analysis
eLife 4:e06541.
https://doi.org/10.7554/eLife.06541


