Spectrin regulates Hippo signaling by modulating cortical actomyosin activity
- Howard Hughes Medical Institute, Johns Hopkins University School of Medicine, United States
Figures
Figure 1 with 2 supplements
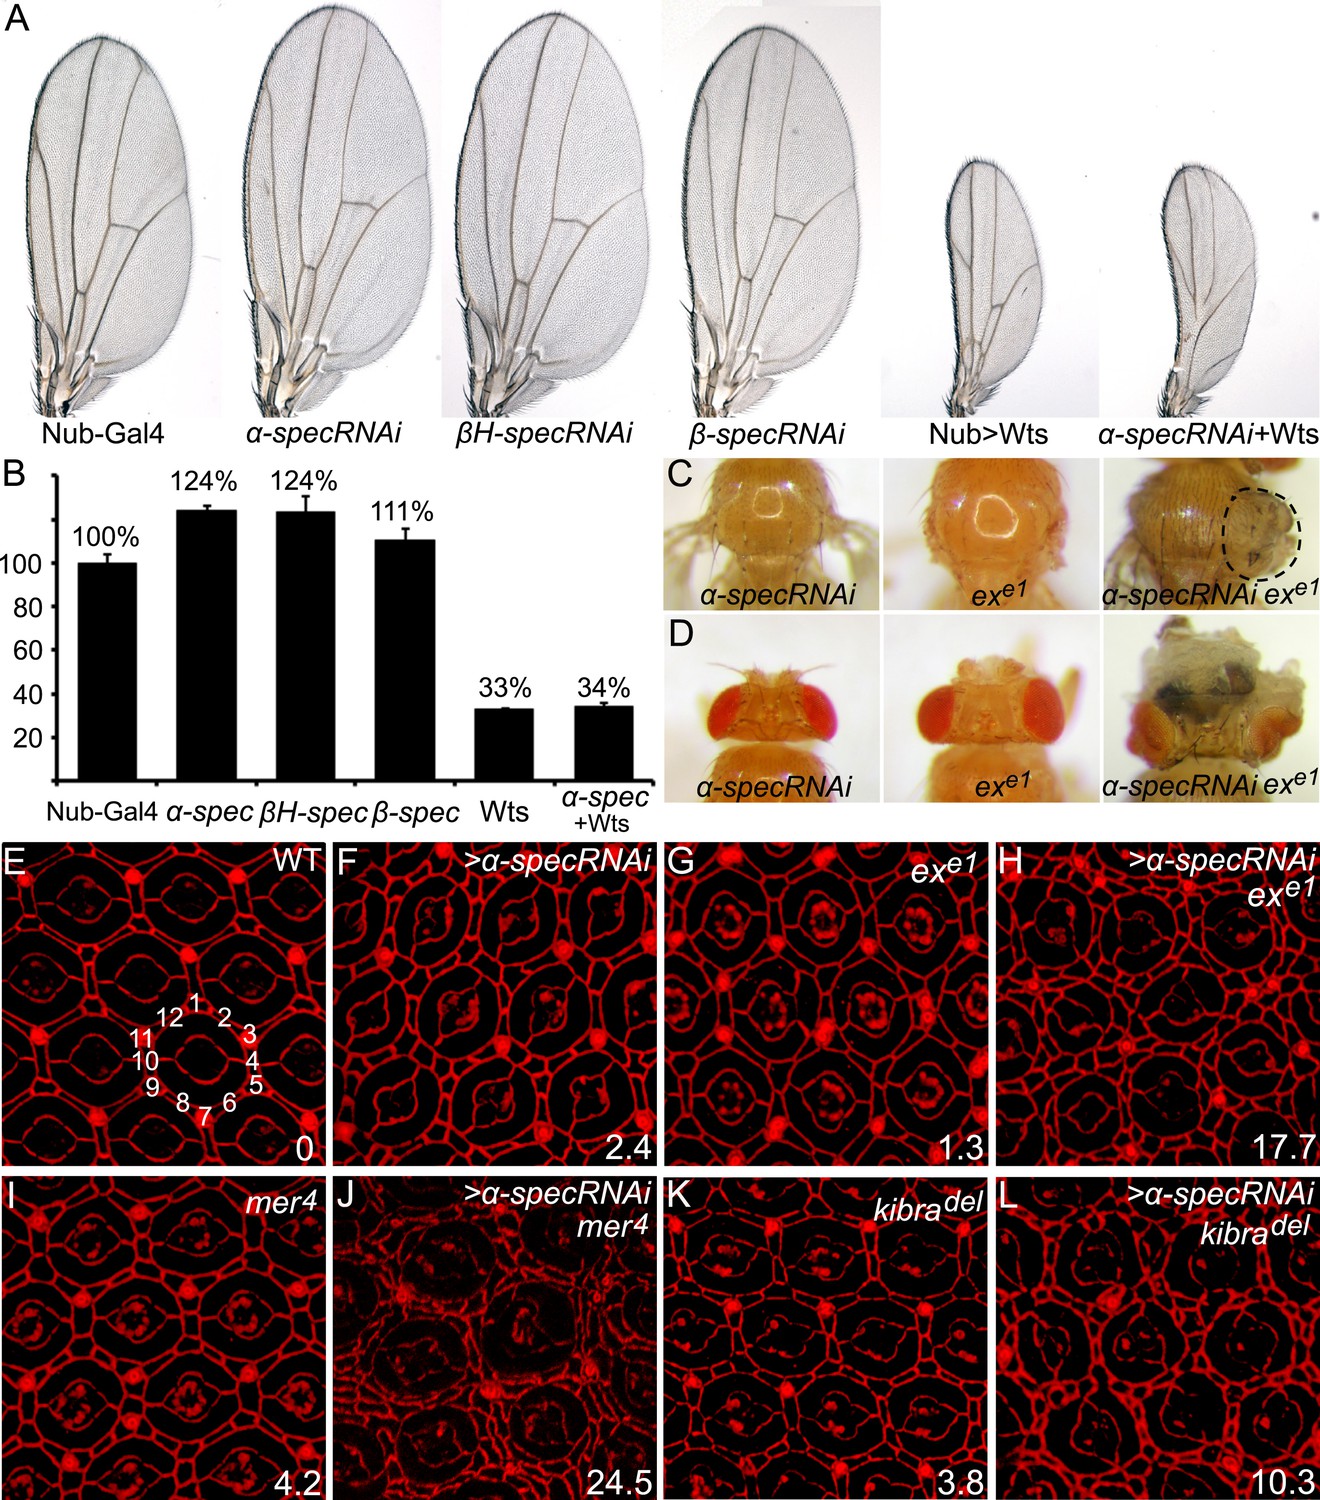
Spectrins function synergistically with upstream regulators of Hippo signaling to control tissue growth.
(A–B) RNAi transgene against each of the three spectrin genes and UAS-wts were expressed separately or in combination in the wing tissue by nub-Gal4. Representative adult wings are shown. The graph in B shows quantification of wing size relative to nub-Gal4/+ control (mean ± SEM, n = 15). (C–D) MARCM clones with α-spec RNAi, exe1 mutation or their combination were produced in the notum (C) or in the eye tissues (D). Note the massive overgrowth (circled area) only in flies containing ex mutant clones with α-spec RNAi. (E–L) Pupal eye discs of the indicated genotypes were stained for DE-cad. Twenty ommatidial clusters of each genotype were used for counting interommatidial cells, and the number on the lower right of each panel indicates the number of extra cells per cluster (ECPC).
Figure 1—figure supplement 1
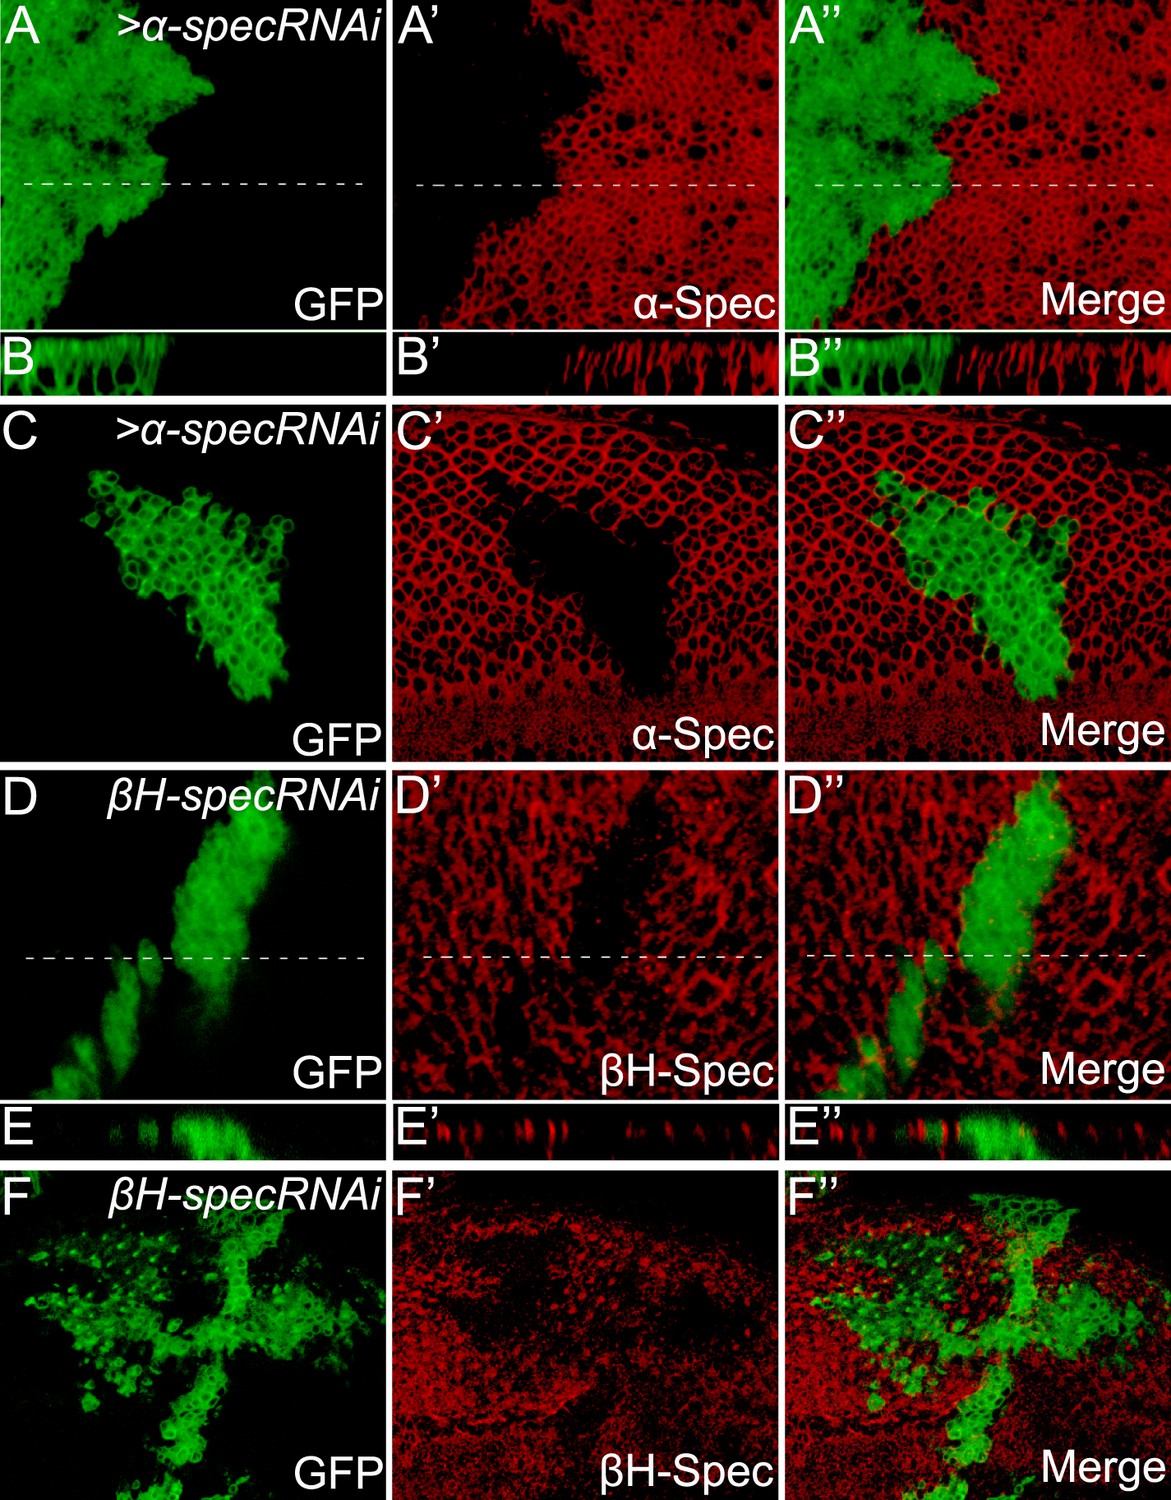
Analysis of α-Spec and βH-Spec localization and RNAi knockdown efficiency in imaginal disc epithelial cells.
(A–C″) Third instar wing disc (A–B″) or eye disc (C–C″) containing GFP-positive MARCM clones with a-spec RNAi was stained for α-Spec protein (red). (B–B″) Shows a vertical section through the wing disc in A–A″, in which the position of the vertical section is indicated by a dotted line. Note the absence of α-Spec staining in the GFP-positive clones, demonstrating the specificity of the α-Spec antibody. Also note the presence of α-Spec signal along the entire apical basal axis of the plasma membrane (B–B″, apical to the top). (D–F″) Third instar wing disc (D–E″) or eye disc (F–F″) containing GFP-positive MARCM clones with βH-spec RNAi was stained for βH-Spec protein (red). (E–E″) Shows a vertical section through the wing disc in D–D″. Note the localization of βH-Spec in the apical membrane (E–E″, apical to the top).
Figure 1—figure supplement 2
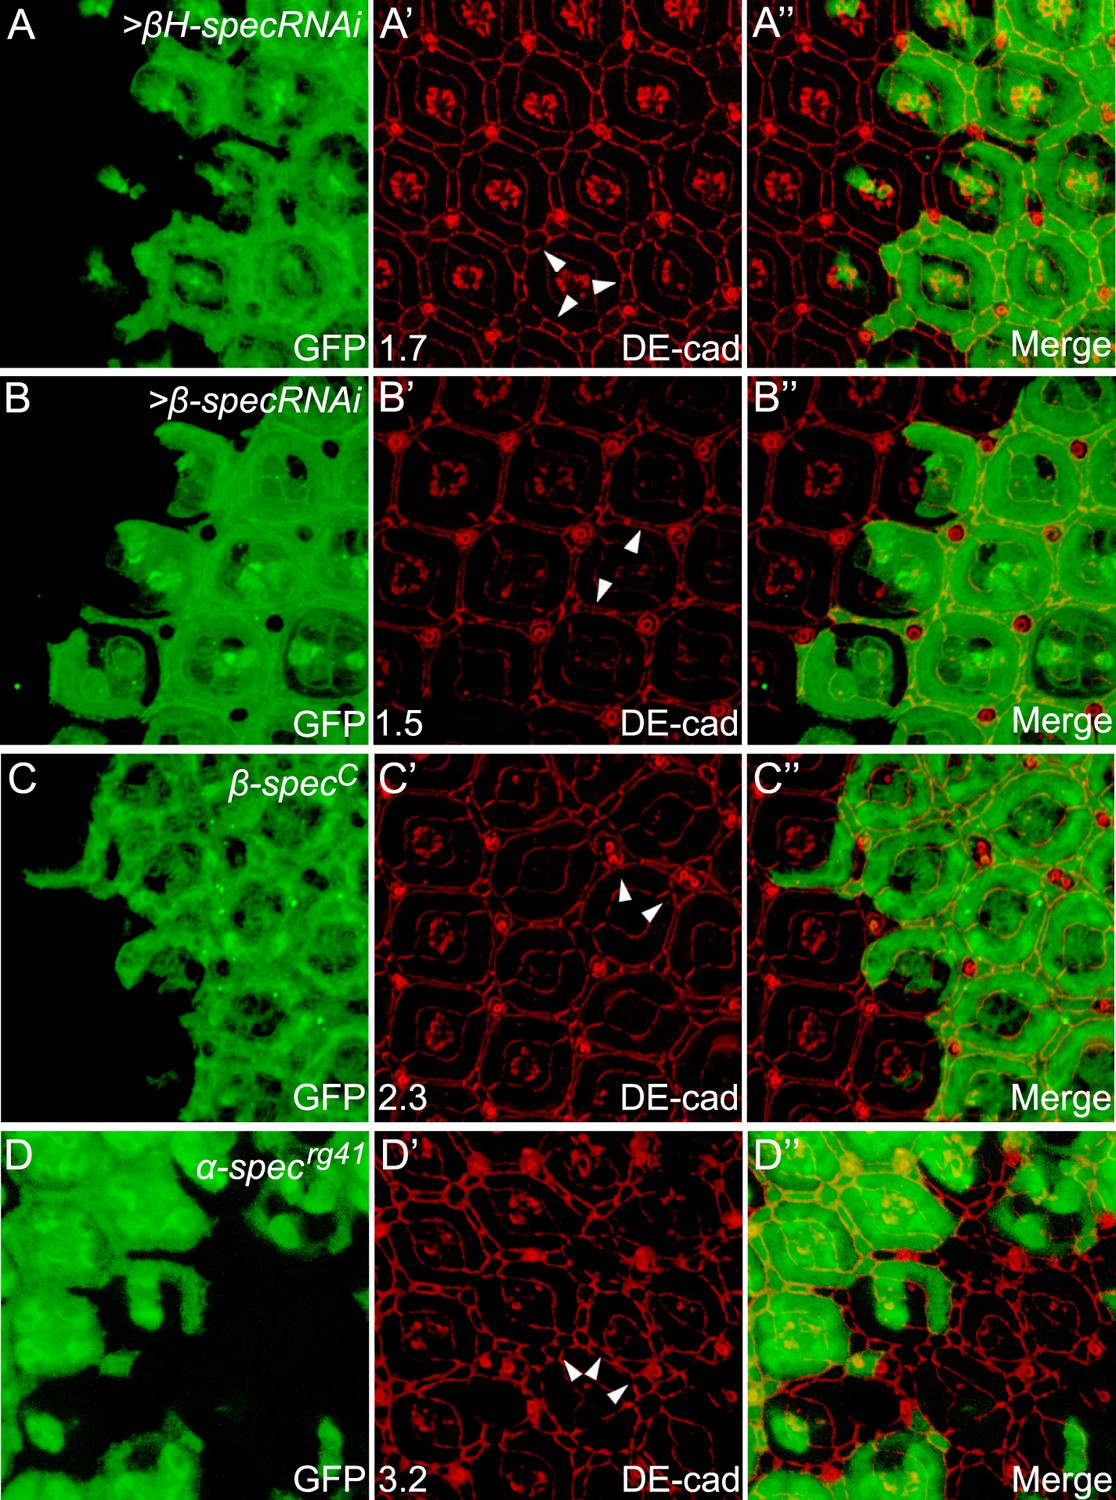
RNAi of βH-spec or β-spec, or a null allele of α-spec or β-spec, phenocopies the overgrowth phenotype of α-spec RNAi in pupal retina.
(A–B″) Pupal eye discs containing GFP-positive MARCM clones with βH-spec RNAi (A–A″) or β-spec RNAi (B–B″) were stained for DE-cad (red). The number on the lower left of A′ and B′ indicates the average number of extra cells per cluster (ECPC) quantified from 20 mutant ommatidia. Representative extra interommatidial cells are indicated by arrowheads. (C–C″) Similar to A–B″ except that GFP-positive MARCM clones with a null allele of β-spec (β-specC) was analyzed. Note the increased number of interommatidial cells. (D–D″) A pupal eye disc containing GFP-negative clones with α-specrg41 mutation were stained for DE-cad (red). The number on the lower left of D′ indicates the average number of ECPC quantified from 20 mutant ommatidia. Representative extra interommatidial cells are indicated by arrowheads.
Figure 2 with 2 supplements

α-Spec regulates the expression of Hippo target genes.
(A–C′) Pupal eye discs containing GFP-positive MARCM clones with α-spec RNAi were stained for Ex (red, in A–B′) or ex-lacZ (red, in C–C′). B–B′ shows a vertical section through the eye disc in A–A′, in which the position of the vertical section is indicated by a straight dotted line. Note the elevated Ex level (A and B) or LacZ level (C) in clones with α-spec RNAi. (D–D‴) A third instar wing disc containing GFP-negative α-specrg41 mutant clones was stained for Yki protein. Note the increased nuclear Yki signal in many α-specrg41 mutant cells. (E–G′) Third instar eye discs containing GFP-positive MARCM clones of the indicated genotypes were stained for Diap1 expression. Note the normal expression of Diap1 in clones with α-spec RNAi (E–E′) or kibradel mutant (F–F′), and the elevated Diap1 levels in kibradel mutant clones with α-spec RNAi (G–G′). (H–J′) Stage 10 egg chambers containing GFP-negative exe1 mutant clones (H–H′), GFP-positive MARCM clones with α-spec RNAi (I–I′) or GFP-positive exe1 mutant clones with α-spec RNAi (J–J′) were stained for Cut expression. Cut expression and multilayering of follicle cells were observed only in the exe1 mutant clones with α-spec RNAi (J–J′).
Figure 2—figure supplement 1
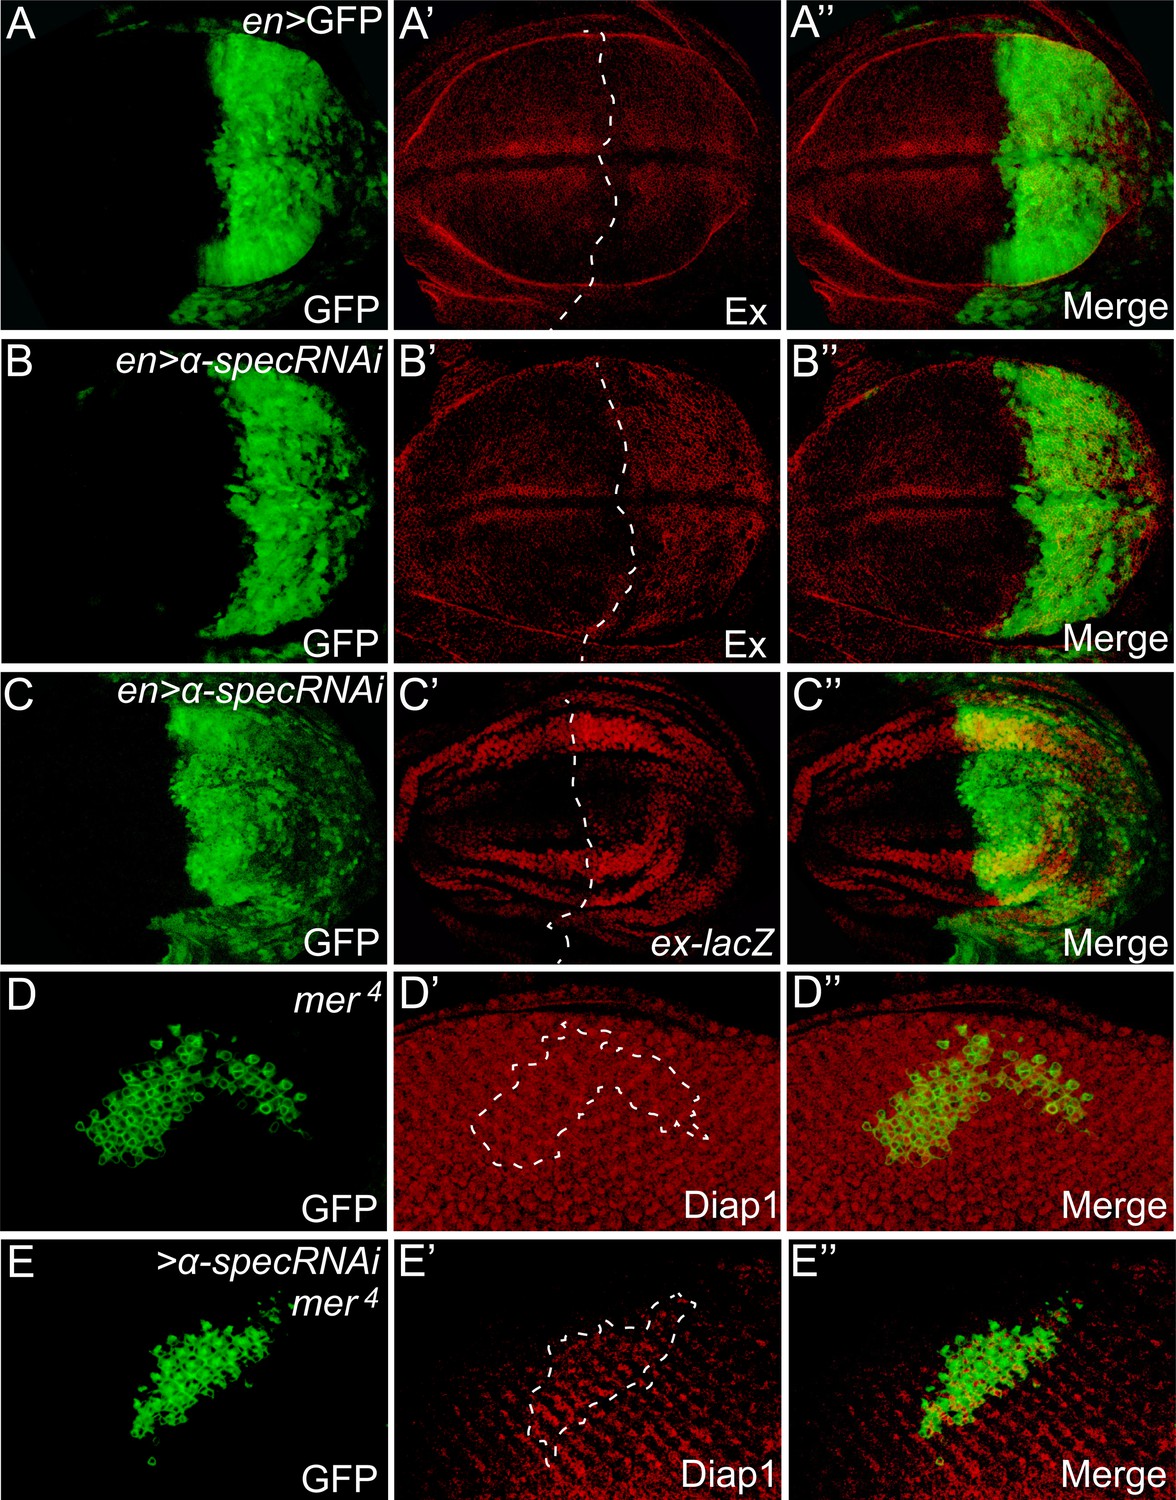
α-Spec regulates the expression of Hippo target genes.
(A–C″) Third instar wing discs expressing GFP or α-spec RNAi in the posterior compartment with engrailed (en)-Gal4 were stained for Ex (A–B″) or ex-lacZ (C–C″). Dashed lines indicate anterior-posterior compartment boundary, with posterior compartment oriented to the right. Note the normal expression of Ex in the posterior compartment with GFP expression (A′), and the elevated expression of Ex (B′) or ex-lacZ (C′) in the posterior compartment with α-spec RNAi. (D–E″) Third instar eye discs containing GFP-positive MARCM clones of the indicated genotypes were stained for Diap1 expression. Note the normal expression of Diap1 in mer4 mutant clones (D′), and the elevated Diap1 expression in mer4 mutant clones with α-spec RNAi (E′).
Figure 2—figure supplement 2
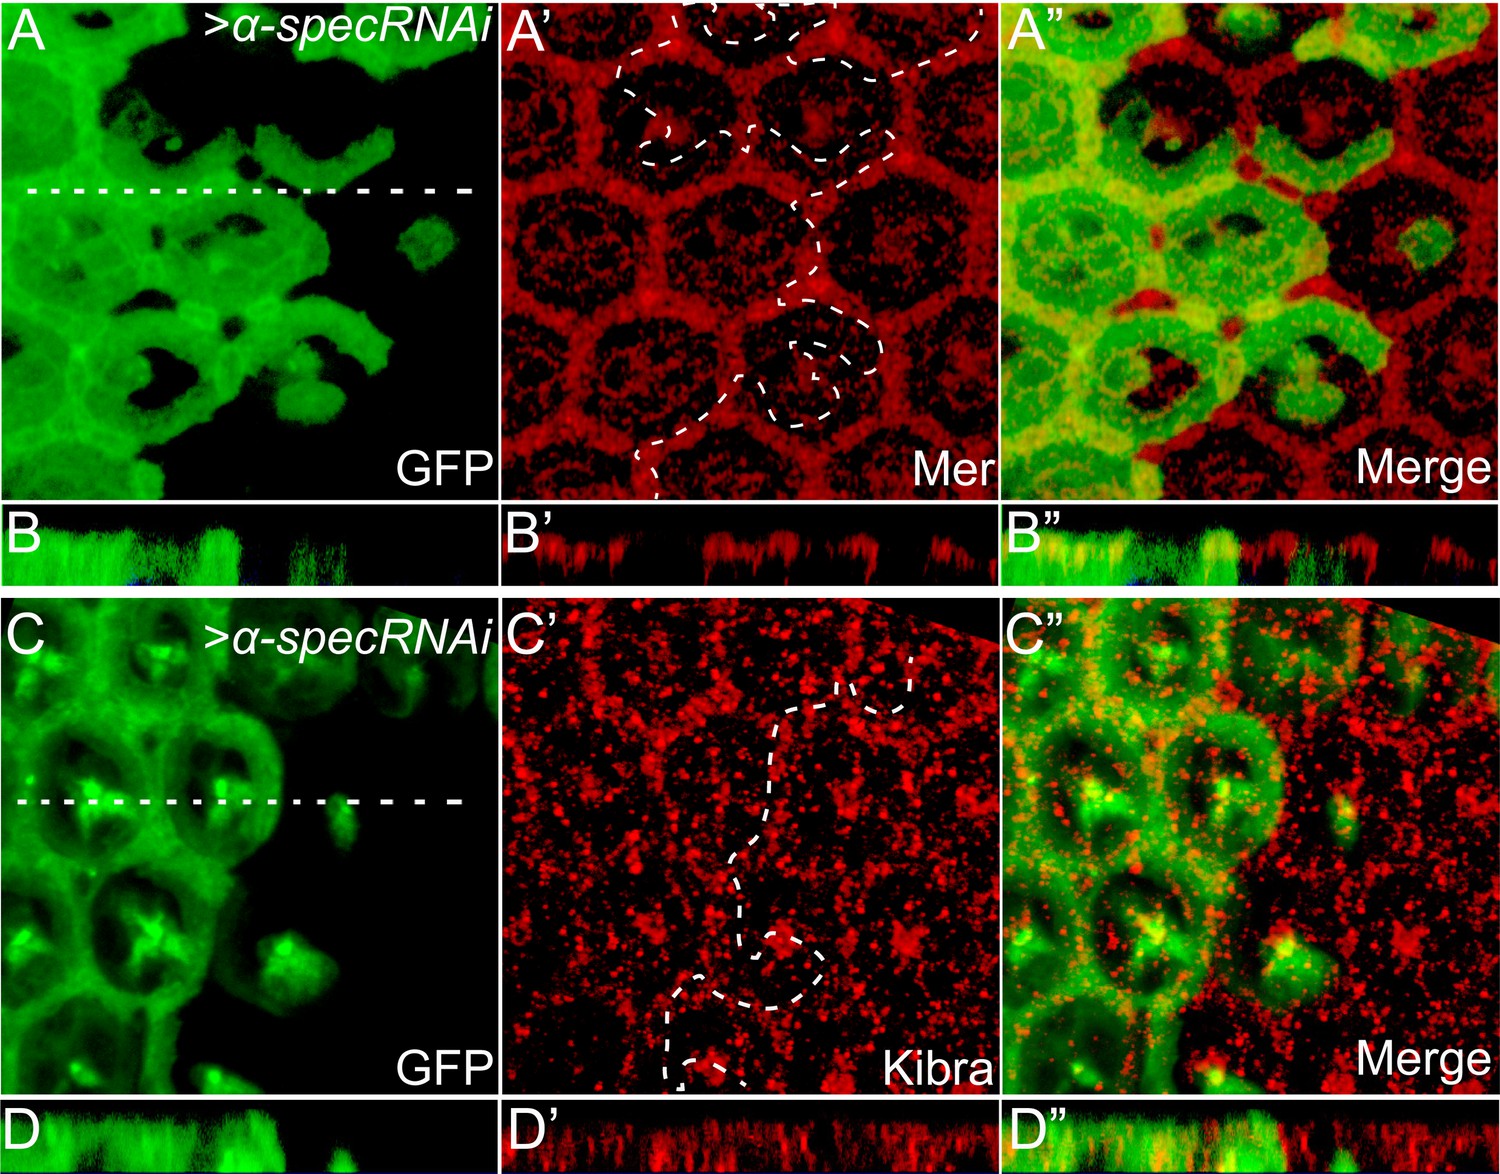
Loss of α-Spec does not affect the subcellular localization of Mer or Kibra.
(A–B″) A pupal eye disc containing GFP-positive MARCM clones with α-spec RNAi was stained for Mer (red). (B–B″) shows a vertical section through the eye disc in A–A′, in which the position of the vertical section is indicated by a straight dotted line. Note the similar subcellular localization of Mer in α-spec RNAi clones compared to the neighboring wild-type cells. (C–D″) Similar to A–B″ except that the eye disc was stained for Kibra (red). Note the similar subcellular localization of Kibra in α-spec RNAi clones compared to the neighboring wild-type cells.
Figure 3
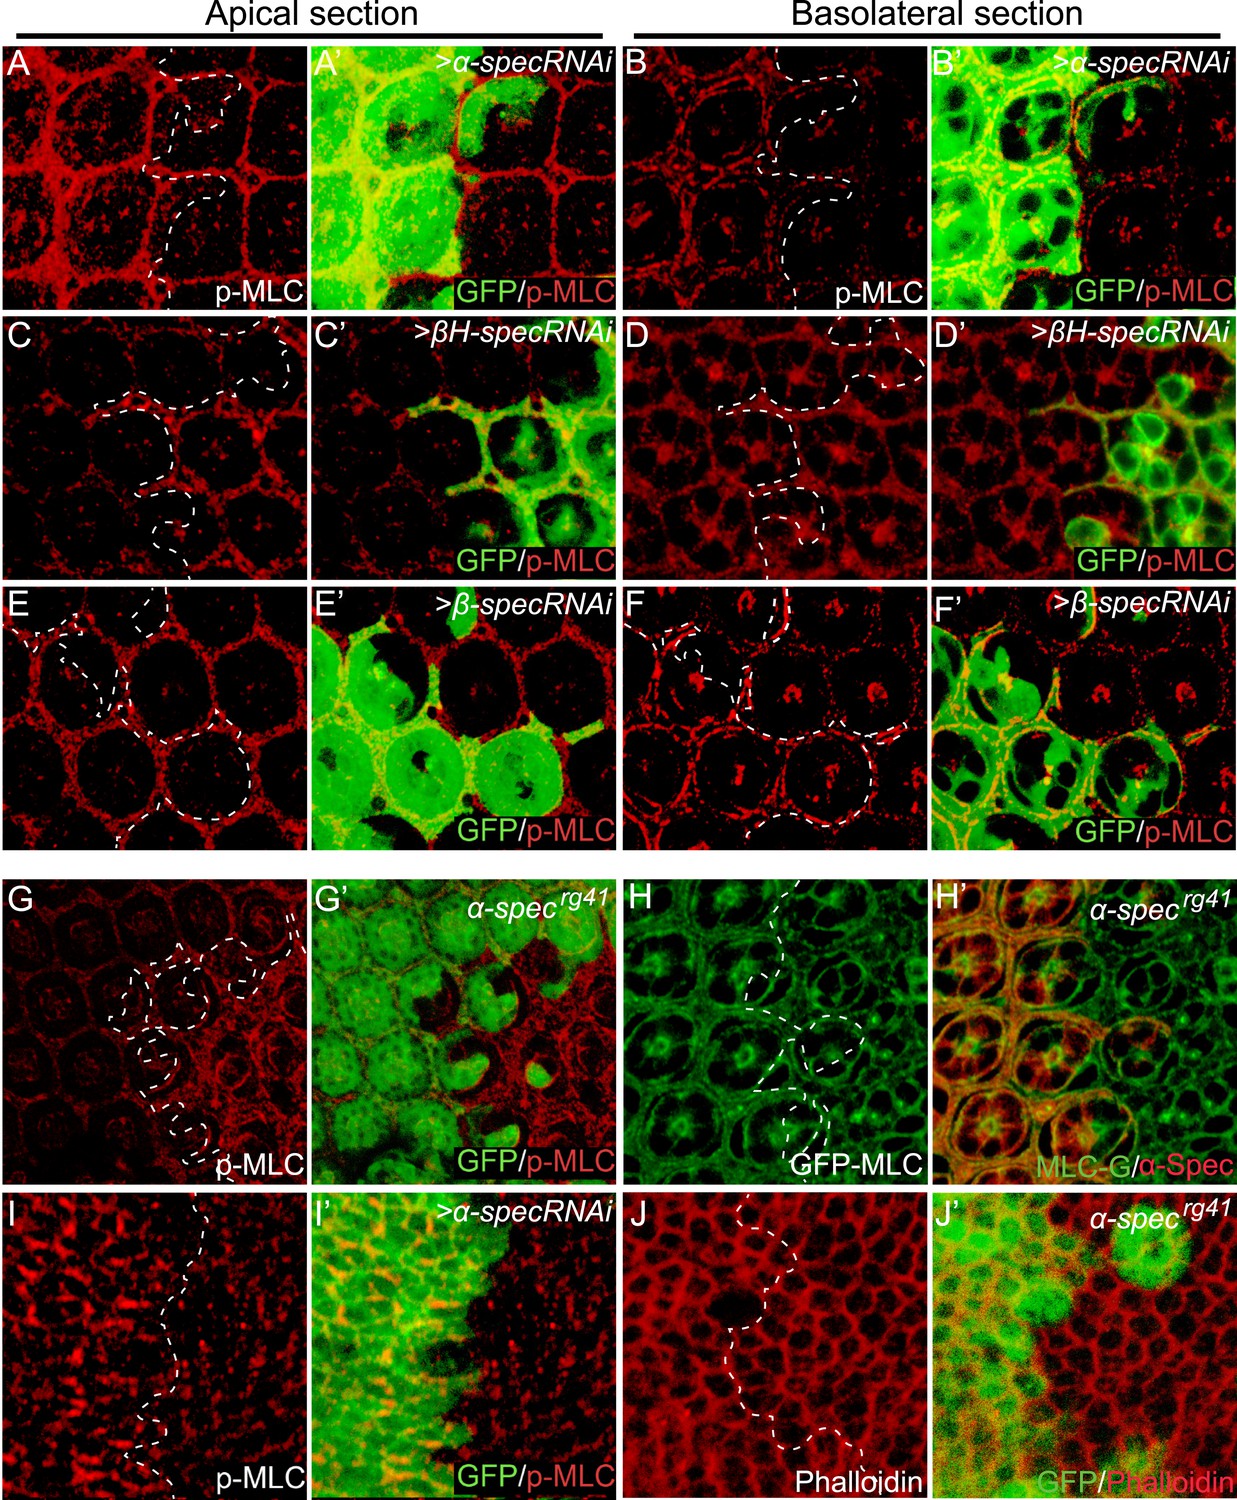
Loss of spectrin promotes the phosphorylation and activation of MLC.
(A–F′) Pupal eye discs containing GFP-positive MARCM clones with α-spec, βH-spec, or β-spec RNAi were stained for phospho-MLC (p-MLC, red). For each imaginal disc, both apical section (A–A′, C–C′ and E–E′) and basolateral confocal section (B–B′, D–D′ and F–F′) were shown. Note the increase of p-MLC in both apical and basolateral sections of the α-spec mutant cells (A–A′ and B–B′), the increase of p-MLC only in the apical section of βH-spec mutant cells (C–C′ and D–D′), and the increase of p-MLC only in the basolateral section of the β-spec mutant cells (E–E′ and F–F′). (G–G′) A pupal eye disc containing GFP-negative α-specrg41 mutant clones stained for p-MLC. Note significant increase of p-MLC level in the mutant clone. (H–H′) A pupal eye disc containing GFP-negative α-specrg41 mutant clones was stained for α-Spec (red) and Sqh-GFP (green). Note the similar levels of Sqh-GFP expression inside and outside the α-specrg41 mutant clones. (I–I′) A Third instar wing disc containing GFP-positive MARCM clones with α-spec RNAi was stained for p-MLC. Note significant increase of p-MLC level in clones with α-spec RNAi. (J–J′) A Third instar wing disc containing GFP-negative α-specrg41 mutant clones was stained for F-actin using phalloidin (red). Note the similar actin cytoskeleton organization in α-specrg41 mutant clones.
Figure 4
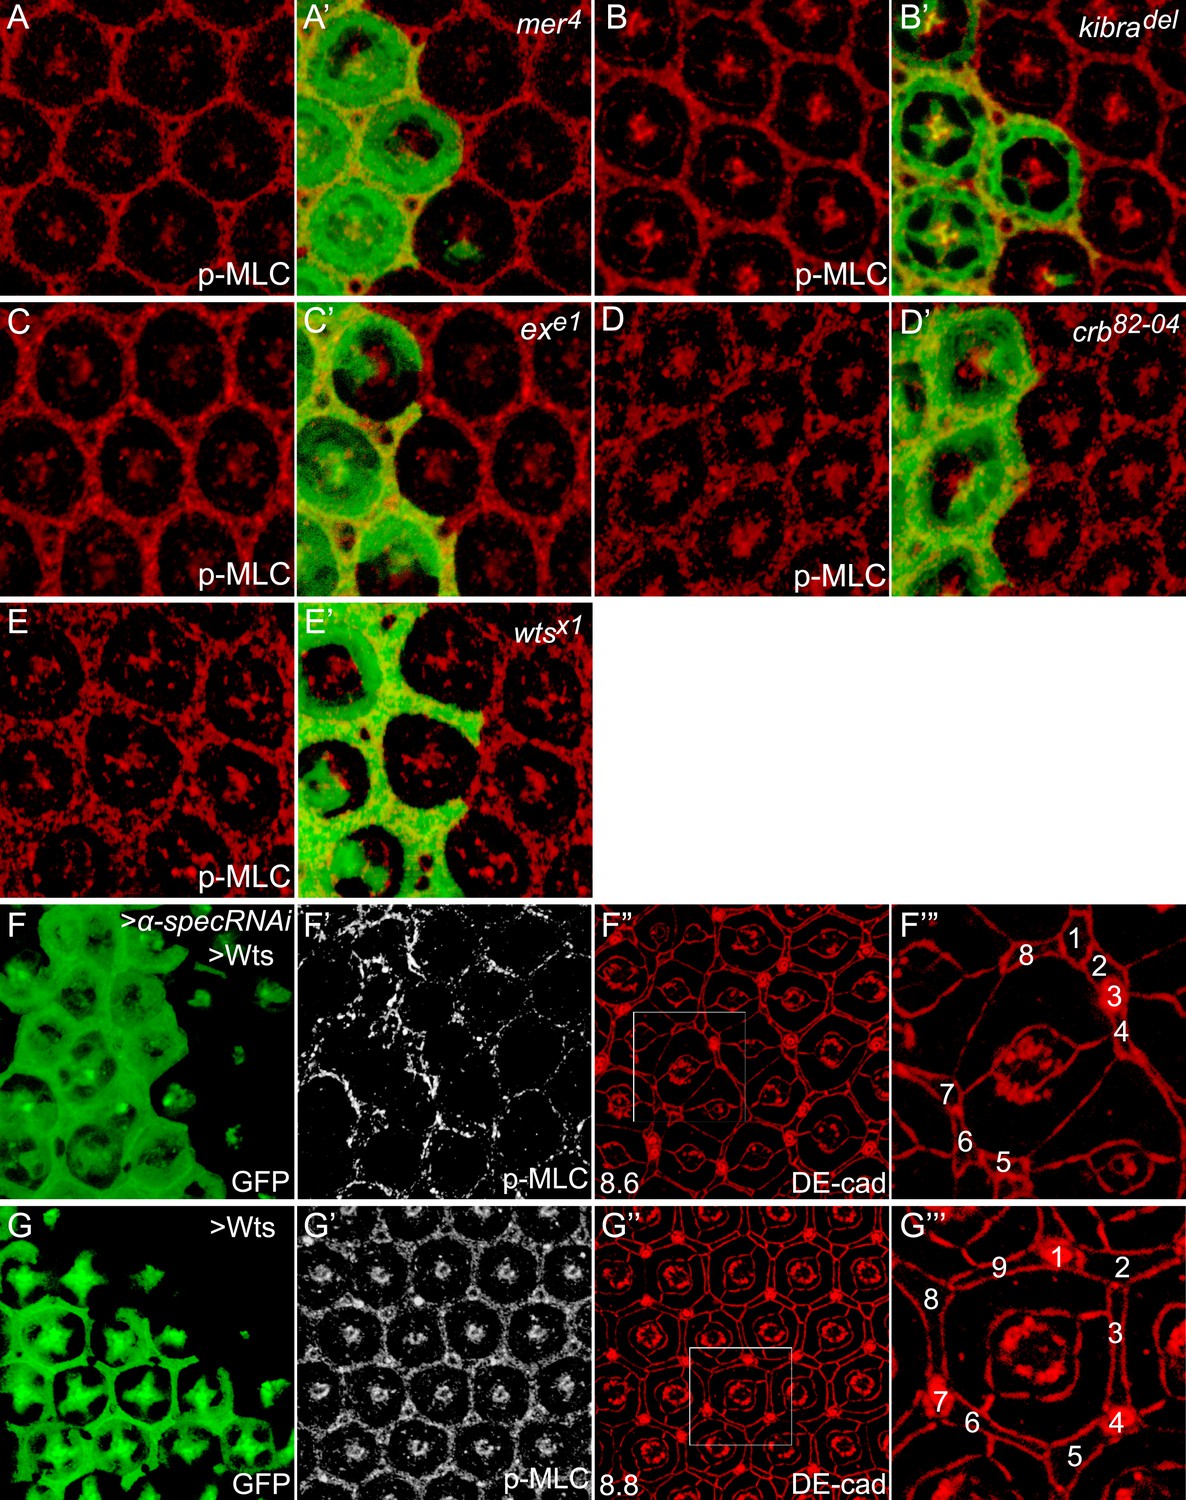
Canonical upstream tumor suppressors of the Hippo pathway do not regulate p-MLC activity.
(A–E′) Pupal eye discs containing GFP-positive MARCM clones of the indicated mutations were stained for p-MLC. Note the similar levels of p-MLC inside and outside the mutant clones. (F–F‴) A pupal eye disc containing GFP-positive MARCM clones with α-spec RNAi and Wts overexpression, showing upregulation of p-MLC (F′) and decreased number of interommatidial cells (F″; the number in the lower left represents the average number of interommatidial cells surrounding each unit eye calculated from 20 mutant ommatidia). The magnified view of a representative ommatidium in F″ (boxed area) is shown in F‴, with all the interommatidial cells marked by different numbers. Wild-type eyes have an average of 12 interommatidial cells surrounding each unit eye (Carthew, 2007) (see also Figure 1E). (G–G‴) Similar to F–F‴ except that MARCM clones with Wts overexpression were analyzed. The magnified view of a representative ommatidium in G″ (boxed area) is shown in G‴. Note the similar level of p-MLC (G′) in the clones compared to the neighboring wild-type tissues. Also note the decreased interommatidial cell number compared to wild-type eyes.
Figure 5 with 1 supplement
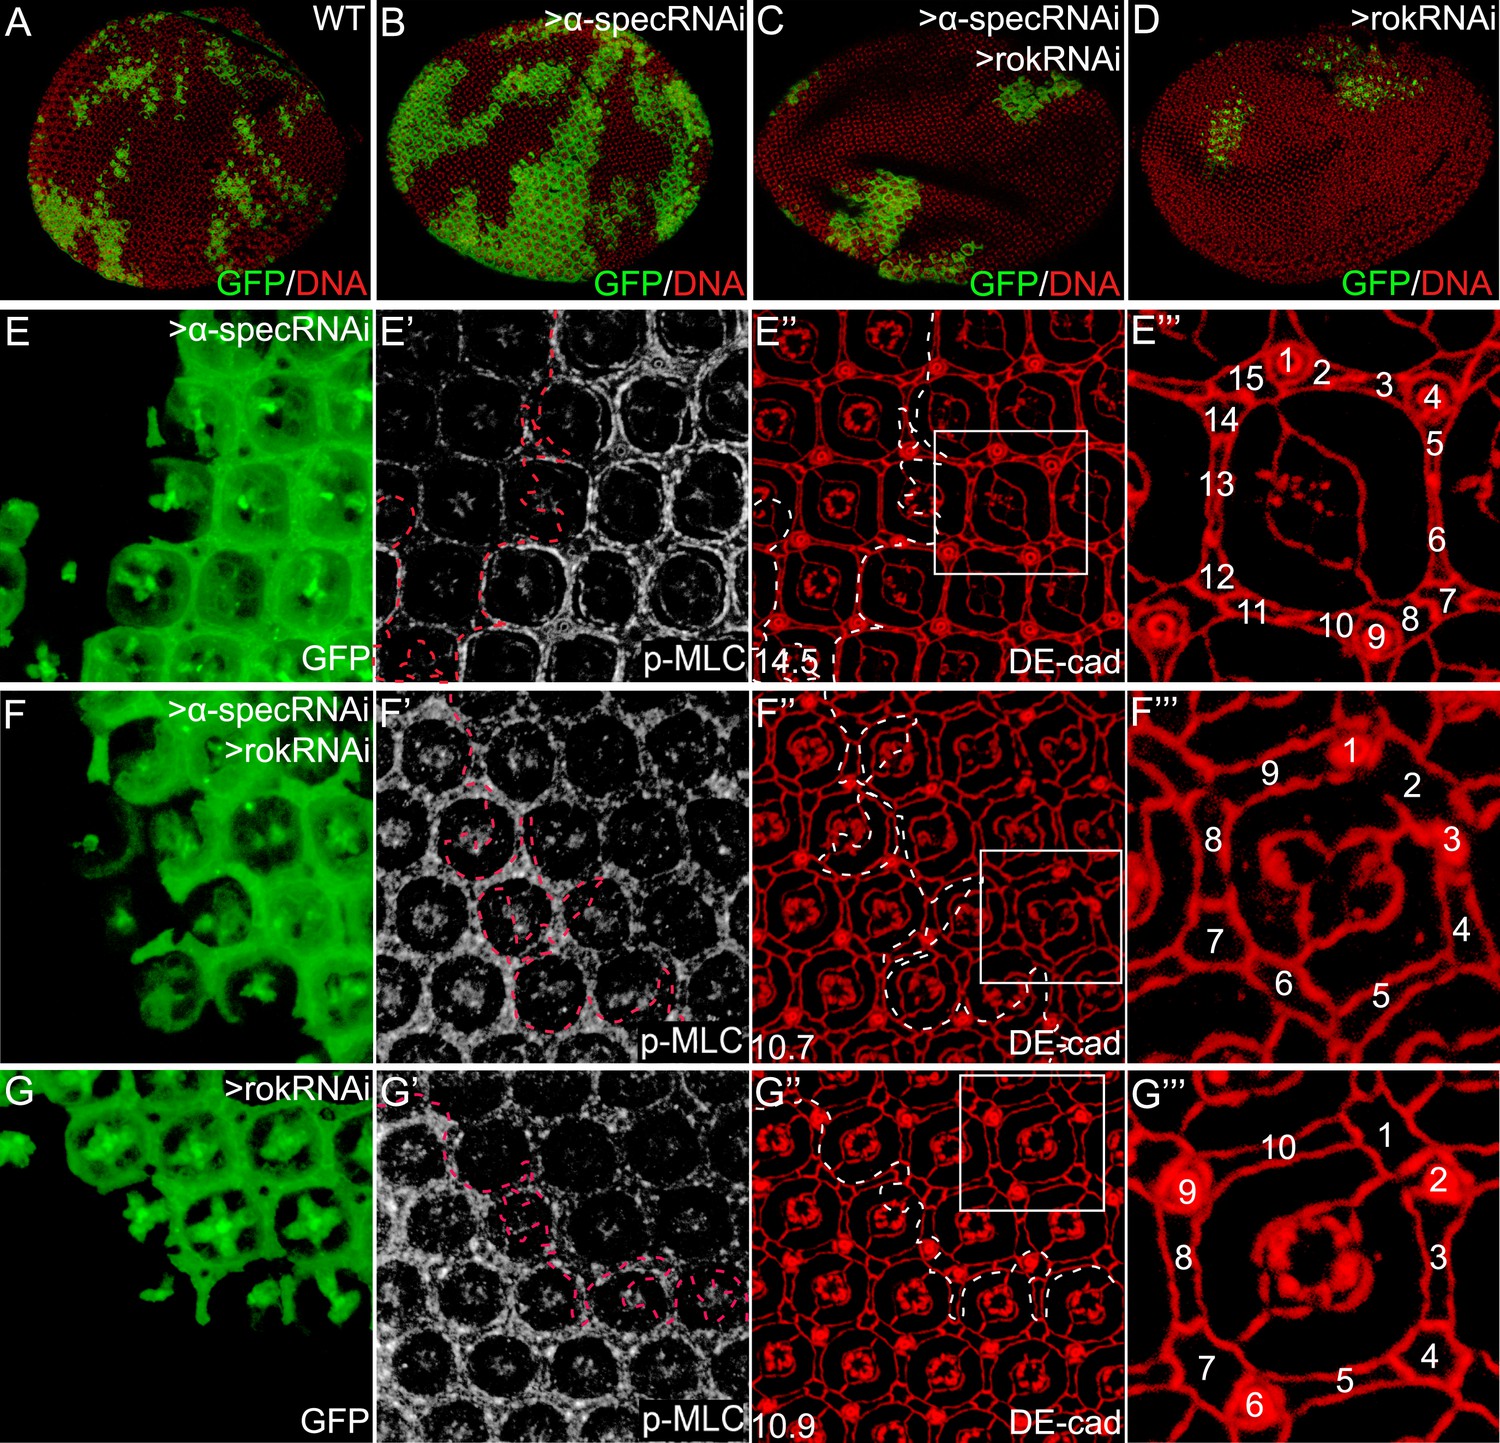
Inhibition of MLC activation suppresses the α-spec-deficient phenotypes.
(A–D) Pupal eye discs containing GFP-positive MARCM clones of the indicated genotypes. Note the increased clone size resulting from α-spec RNAi (compare the relative representation of GFP-positive tissues in the whole eye between B and A). Also note the decreased representation of the GFP-positive clones resulting from rok RNAi (D) or α-spec rok RNAi (C). (E–E‴) A pupal eye disc containing GFP-positive MARCM clones with α-spec RNAi, showing upregulation of p-MLC (E′) and increased number of interommatidial cells (E″; the number in the lower left represents the average number of interommatidial cells surrounding each unit eye calculated from 20 mutant ommatidia). The magnified view of a representative ommatidium in E″ (boxed area) is shown in E‴, with all the interommatidial cells marked by different numbers. (F–F‴) Similar to E–E‴ except that MARCM clones with α-spec and rok double RNAi were analyzed. Note the decrease of p-MLC (F′) and interommatidial cell number (F″–F‴) in the clones compared to the neighboring wild-type tissues. Wild-type eyes have an average of 12 interommatidial cells surrounding each unit eye (Carthew, 2007) (see also Figure 1E). (G–G‴) Similar to E–E‴ except that MARCM clones with rok RNAi were analyzed. Note the decrease of p-MLC (G′) and interommatidial cell number (G″–G‴) in the clones compared to the neighboring wild-type tissues.
Figure 5—figure supplement 1
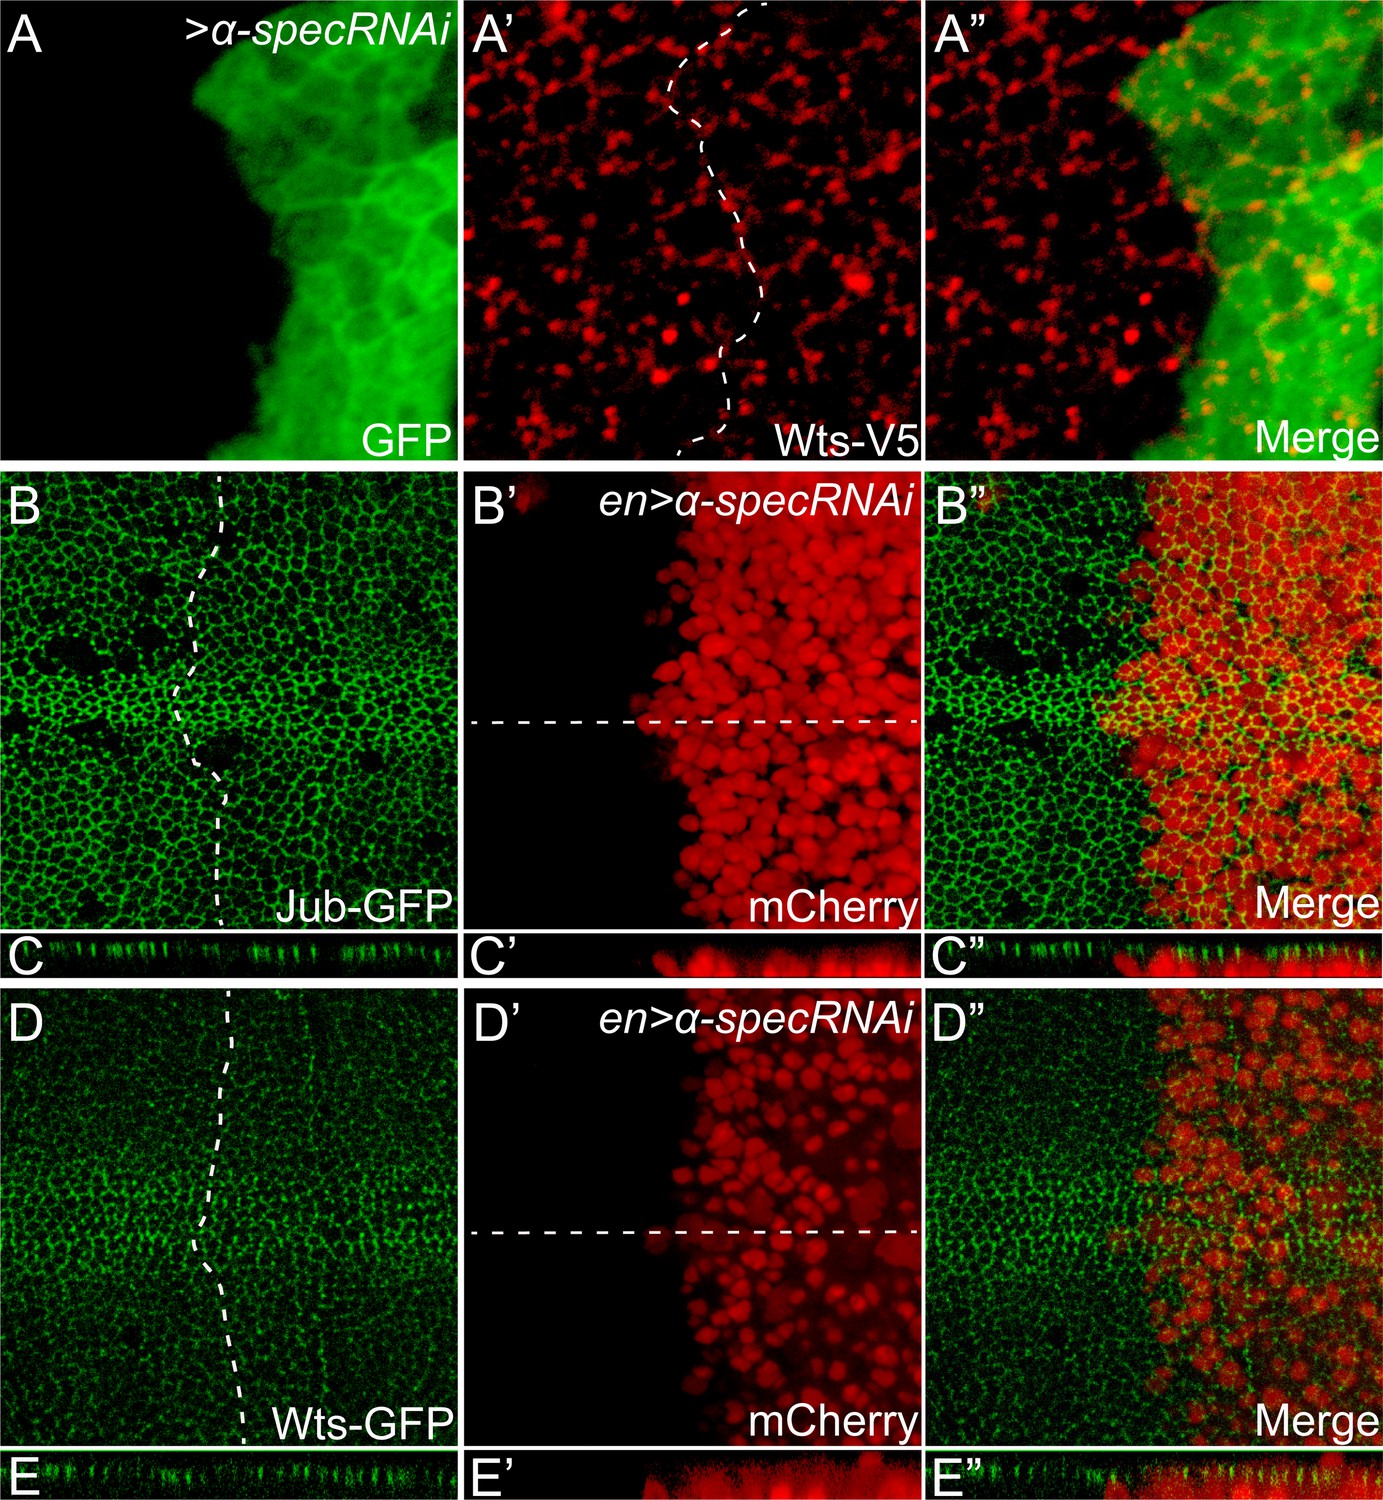
Loss of α-Spec does not affect the subcellular localization of Jub or Wts.
(A–A″) A third instar wing disc containing GFP-positive MARCM clones with α-spec RNAi was stained for Wts-V5 (red). Note the similar level and localization of Wts-V5 inside and outside the mutant clones. (B–E″) Third instar wing discs expressing α-spec RNAi in the posterior compartment with en-Gal4 were visualized for Jub-GFP (B and C) or Wts-GFP (D and E). The posterior compartments were marked by en-Gal4 driven mCherry expression (B′, C′, D′ and E′). Dashed lines in B and D indicate anterior-posterior compartment boundary, with posterior compartment oriented to the right. C–C″ and E–E″ show vertical sections through the wing discs in B–B″ and D–D″, respectively, in which the position of the vertical section is indicated by a straight dotted line. Note similar level and localization of Jub-GFP or Wts-GFP in the anterior and the posterior compartment of the wing discs.
Figure 6
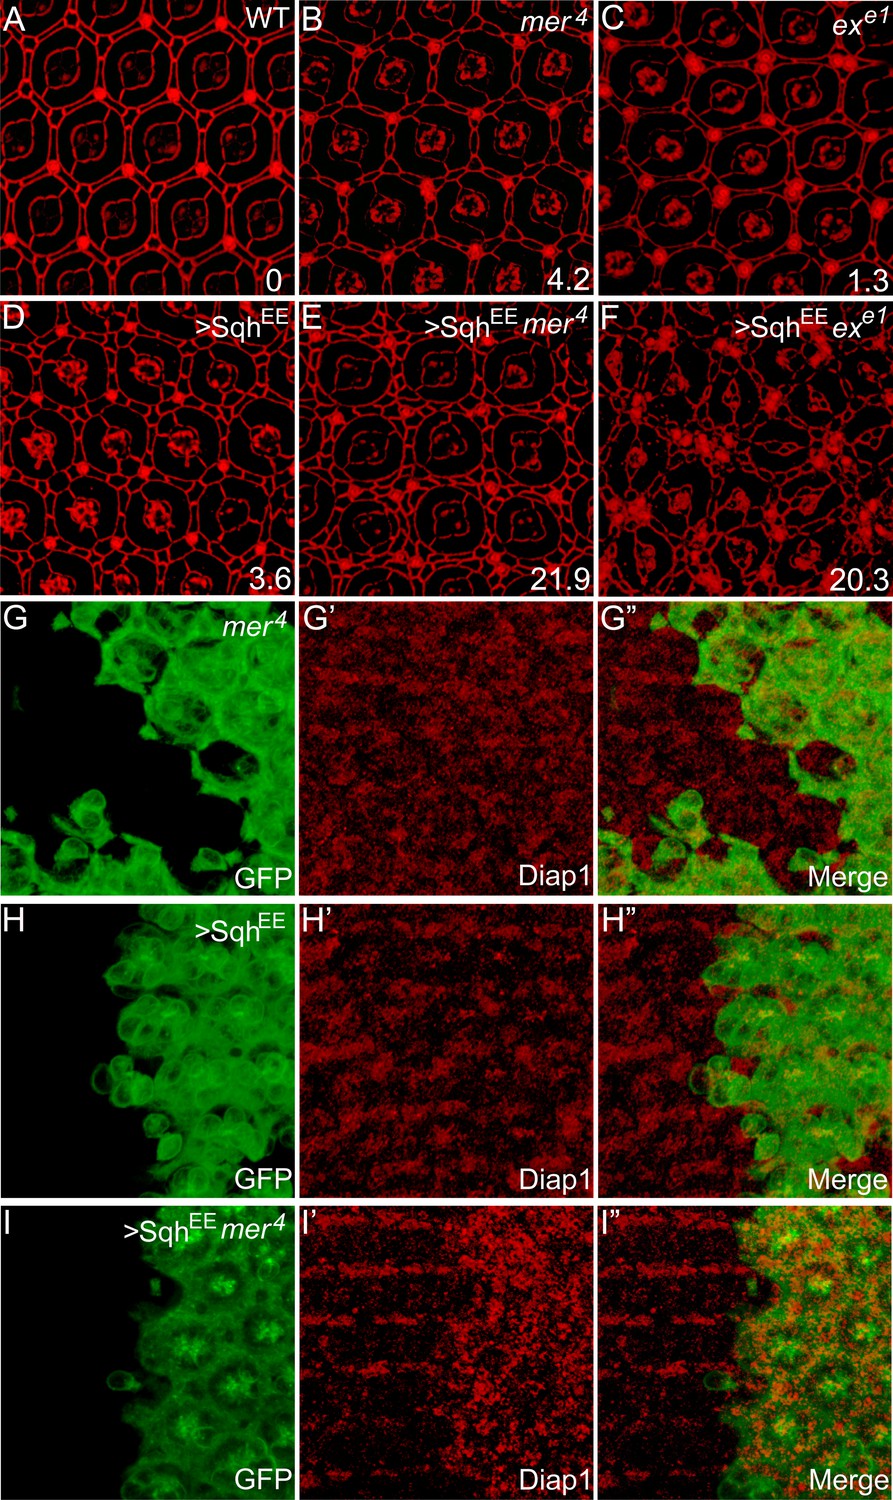
Myosin II-regulated cytoskeletal tension functions in parallel with the canonical upstream tumor suppressors to regulate Hippo signaling.
(A–F) The synergistic effect of myosin II activation and loss of Ex or Mer on interommatidial cell number. Pupal eye discs of the indicated genotype were stained for DE-cad. 20 ommatidial clusters of each genotype were used for counting interommatidial cells, and the number on the lower right of each panel indicates the average number of ECPC. Note the dramatic increase of ECPC in E and F. (G–I″) The synergistic effect of myosin II activation and loss of Mer on Hippo target gene expression. Pupal eye discs containing GFP-positive MARCM clones of the indicated genotypes were stained for Diap1 expression. Note the normal expression of Diap1 in mer4 mutant clones (G′) or SqhEE-overexpressing clones (H′), and the elevated Diap1 levels in mer4 mutant clones with SqhEE overexpression (I′).
Figure 7
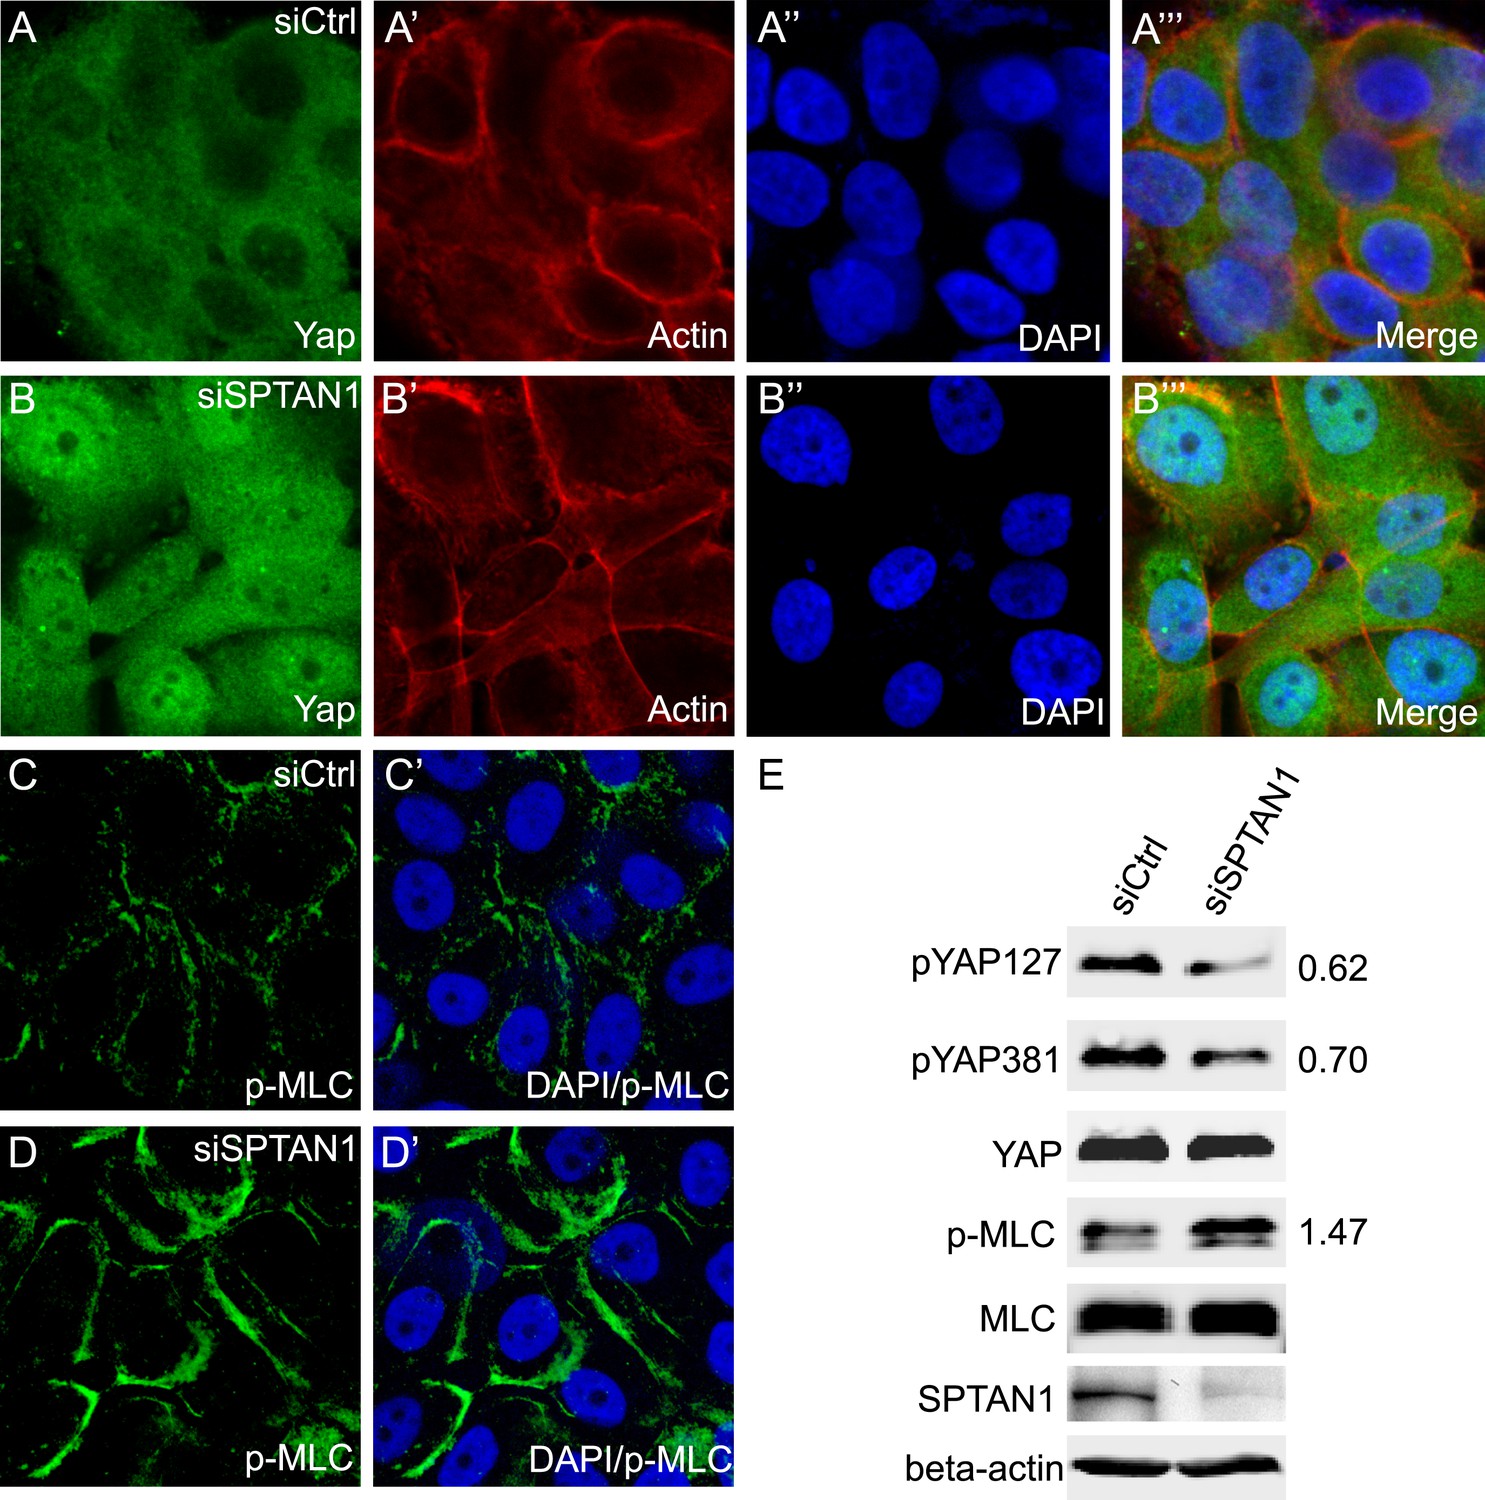
Loss of SPTAN1 results in decreased YAP phosphorylation, increased YAP nuclear localization, and increased cortical p-MLC level in MCF10A cells.
(A–B‴) Confluent cultures of MCF10A cells treated with control RNAi or SPTAN1 RNAi were stained for YAP (green), actin (red) and the nuclear dye DAPI (blue). Note the increased nuclear YAP signal in cells with SPTAN1 RNAi. (C–D′) Confluent cultures of MCF10A cells treated with control RNAi or SPTAN1 RNAi were stained for p-MLC (green) and DAPI (blue). Note the increased cortical p-MLC signal in cells with SPTAN1 RNAi. (E) Western blot analysis of cells from A–D′. Quantification of p-YAP to total YAP ratio (or p-MLC to total MLC ratio) in the SPTAN1 RNAi cells, normalized to that in the control RNAi cells, is shown to the right. Note the decreased YAP S127 and S381 phosphorylation and increased p-MLC level in cells with SPTAN1 RNAi.
Download links
A two-part list of links to download the article, or parts of the article, in various formats.
Downloads (link to download the article as PDF)
Open citations (links to open the citations from this article in various online reference manager services)
Cite this article (links to download the citations from this article in formats compatible with various reference manager tools)
Spectrin regulates Hippo signaling by modulating cortical actomyosin activity
eLife 4:e06567.
https://doi.org/10.7554/eLife.06567


