Glycosylphosphatidylinositol-anchored proteins as chaperones and co-receptors for FERONIA receptor kinase signaling in Arabidopsis
- University of Massachusetts, United States
- National Chung Hsing University, Taiwan
Figures
Figure 1 with 1 supplement
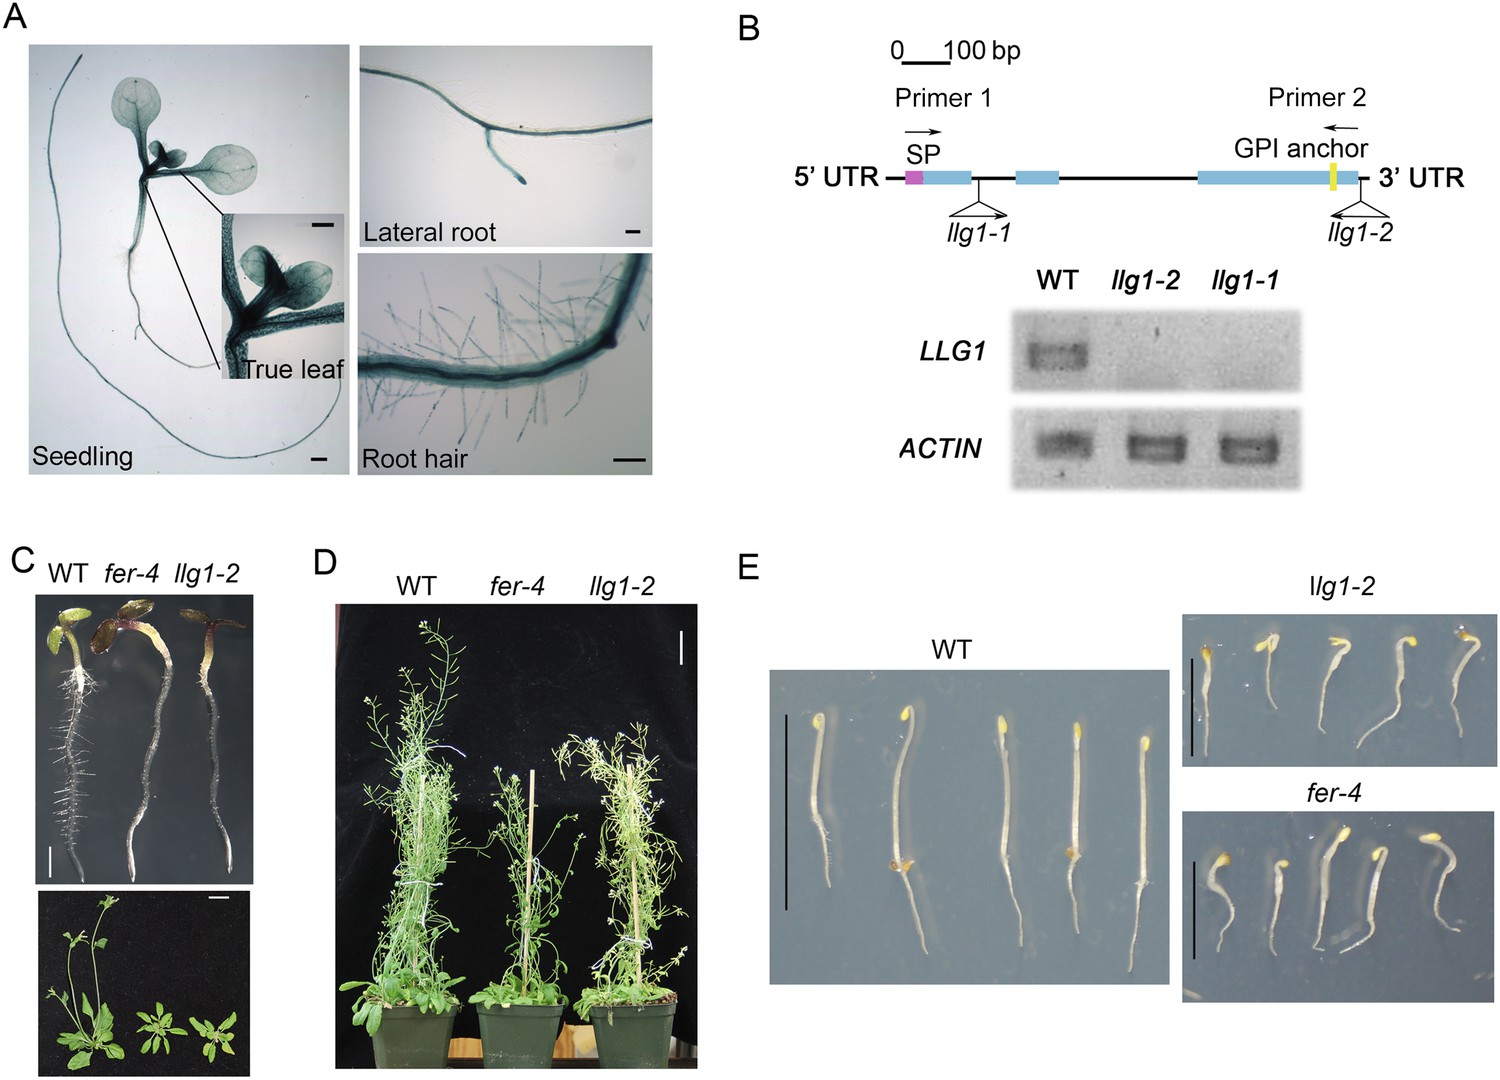
llg1 and fer mutants have similar growth and developmental phenotypes.
(A) pLLG1::GUS expression pattern in 10-day-old seedlings. (B) T-DNA insertion map for llg1-1 and llg1-2 (upper). RT-PCR analysis (using primers 1 and 2) indicates both mutants are nulls (lower). (C–E) Growth comparison between wild type (WT), llg1 and fer plants. Four-day-old light-grown (C upper), 25-day-old (C lower), and flowering plants (D), and 3-day-old dark-grown seedlings (E). Scale bars: 1 mm (A); 2 mm (C upper); 3 cm (C lower, D); 1 cm (WT), 0.5 cm (llg1-2, fer-4) (E). See additional data in Figure 1—figure supplement 1.
Figure 1—figure supplement 1

Additional characterization of llg1 mutants.
(A) pLLG1::GUS expression in a flower. (B) llg1-1 and llg1-2 have an identical phenotype. (C) Three-day-old dark-grown seedlings. WT: wild type. Scale bars: 0.5 mm (A); 1 mm (B); 1 cm (C).
Figure 2 with 2 supplements
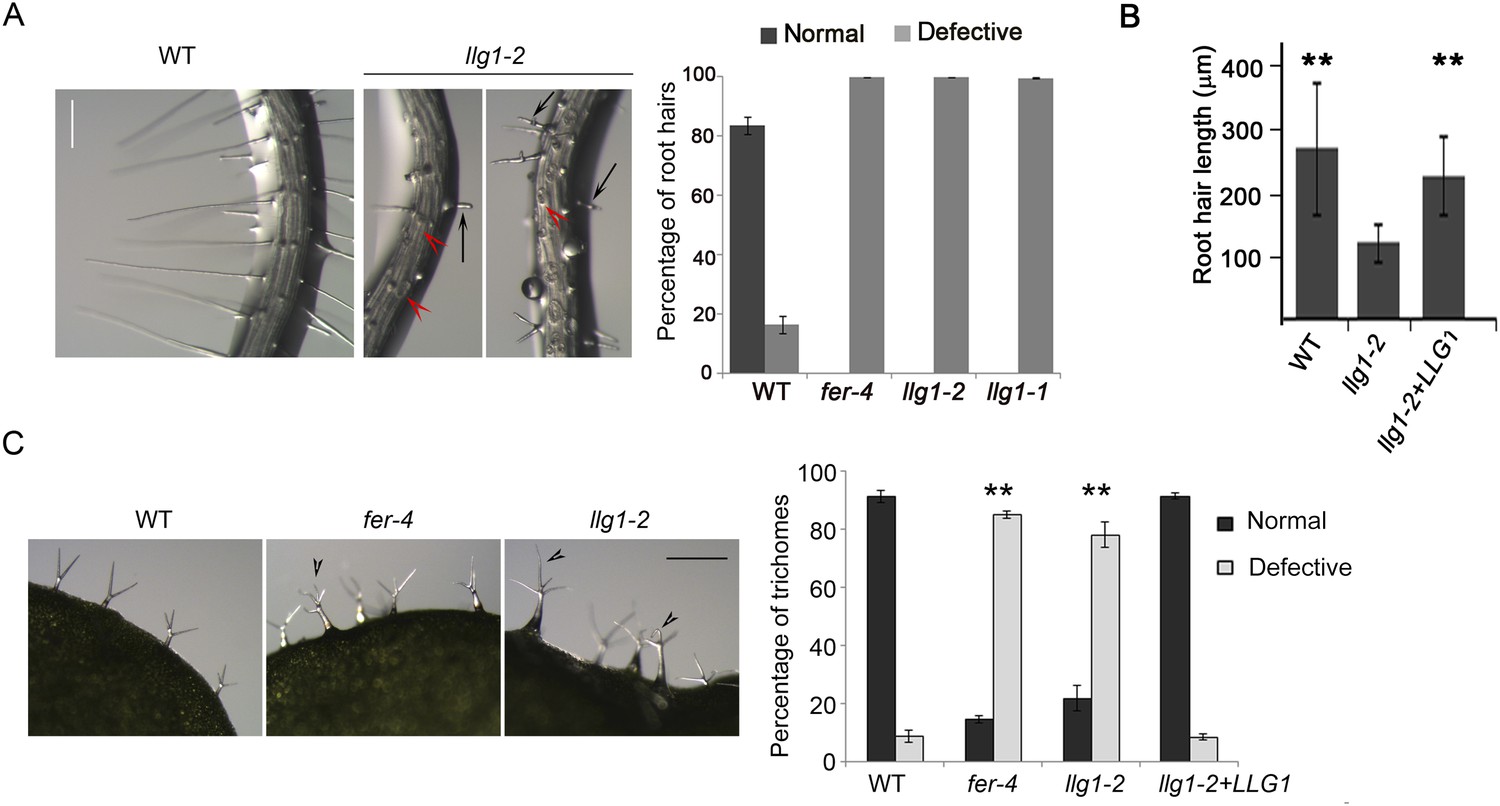
Root hair and trichome defects in llg1 are indistinguishable from fer.
(A) Root hair phenotypes (4-day-old seedlings). Defective root hairs in llg1 include short hairs (black arrows) and those that collapsed upon emergence (red arrowheads). Histogram data: average ± SD (n≥1000 root hairs). (B) Root hair length comparison. Data: average root hair lengths ± SEM (n=14 four-day-old seedling roots, between 50 and 100 root hairs were measured per root). Root hair lengths for llg1-2 were obtained from short root hairs with measurable lengths and did not include collapsed root hairs, which had no measurable lengths; thus the data shown for llg1-2 are an under-representation of the severity of its root hair defects. (C) Trichome phenotypes. Arrowheads indicate abnormal trichomes (curly and/or more than three branches). Data: average ± SD (n≥400 trichomes from 3-week-old plants). **p<10−2 to <10−4, highly significant differences from control, as determined by the Student's t-test here and for the rest of the results. Scale bars: 100 μm (A), 0.5 mm (C). Additional data are shown in Figure 2—figure supplement 1 and Figure 2—figure supplement 2.
Figure 2—figure supplement 1
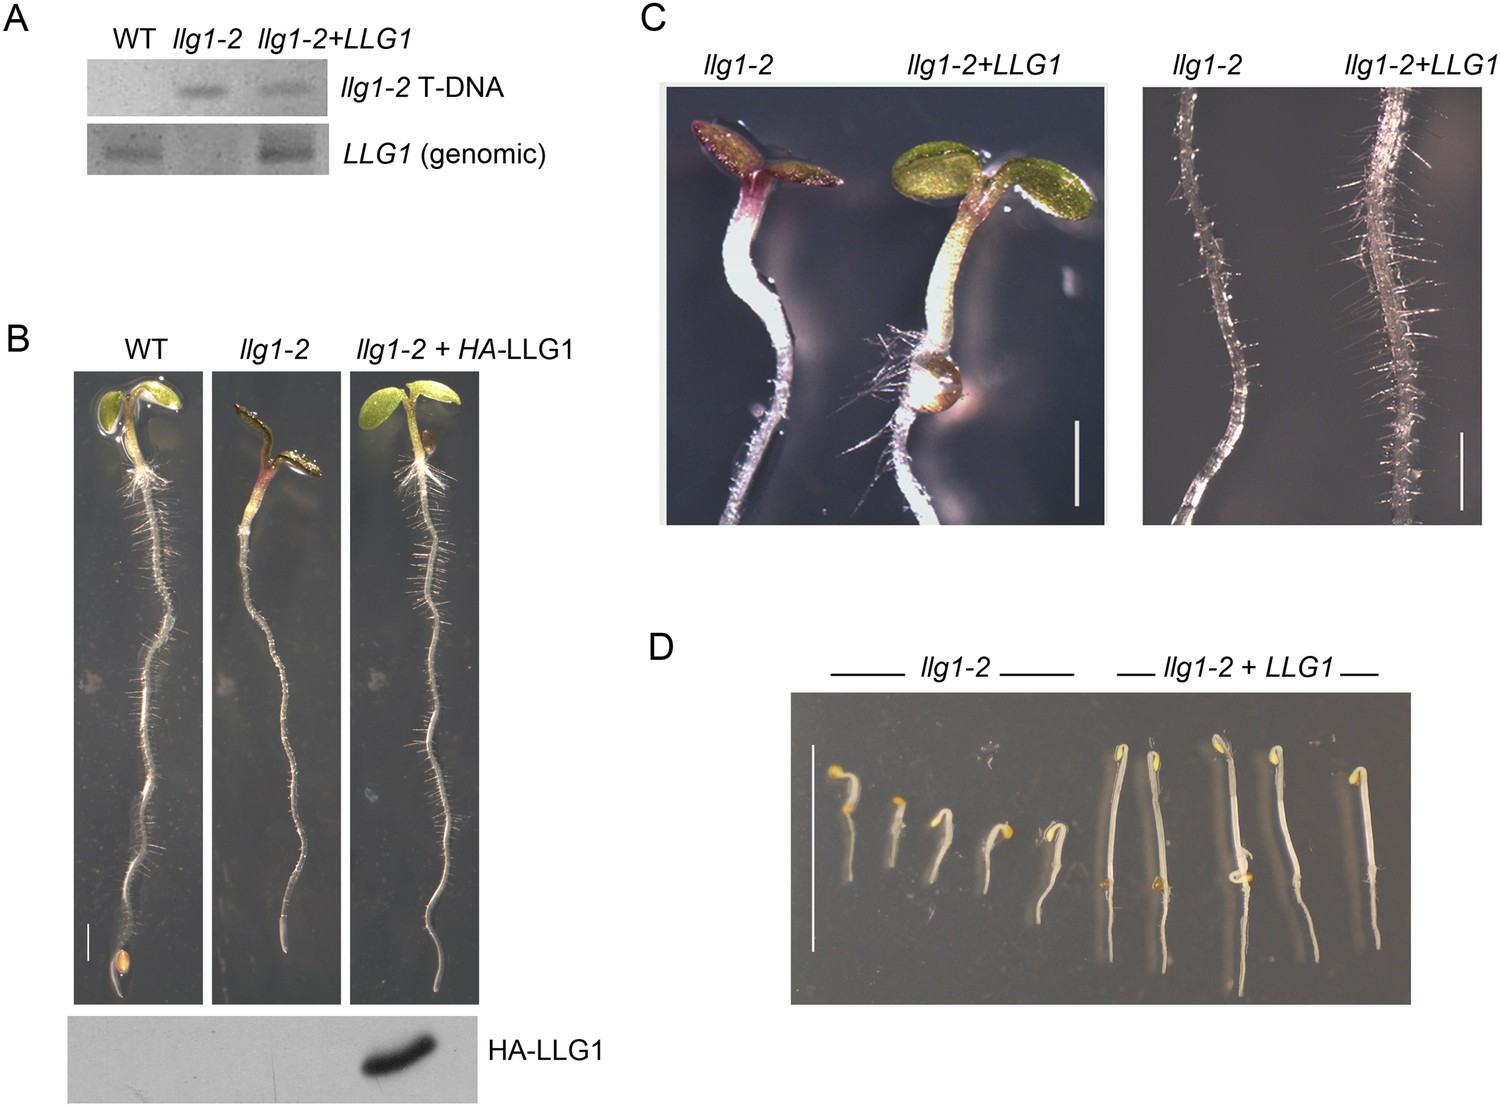
LLG1 complements llg1-2.
(A) Genomic DNA PCR analysis confirming the presence of the mutagenic T-DNA insert in llg1-2 and in genomic LLG1-complemented llg1-2 (upper panel), and the presence of a genomic LLG1 fragment in wild type (WT) and complemented llg1-2 (lower panel). (B–D) LLG1-complemented llg1-2 phenotypes. (B) Four-day-old WT, llg1-2, and HA-LLG1-complemented llg1-2 seedlings; lower panel shows immunoblot detection of HA-LLG1 protein. (C) Light-grown 4-day-old seedlings and root hairs. (D) LLG1-complemented llg1-2 (3 days old) etiolation phenotype in the dark. Scale bars: 2 mm (B), 0.2 mm (C), 1 cm (D).
Figure 2—figure supplement 2
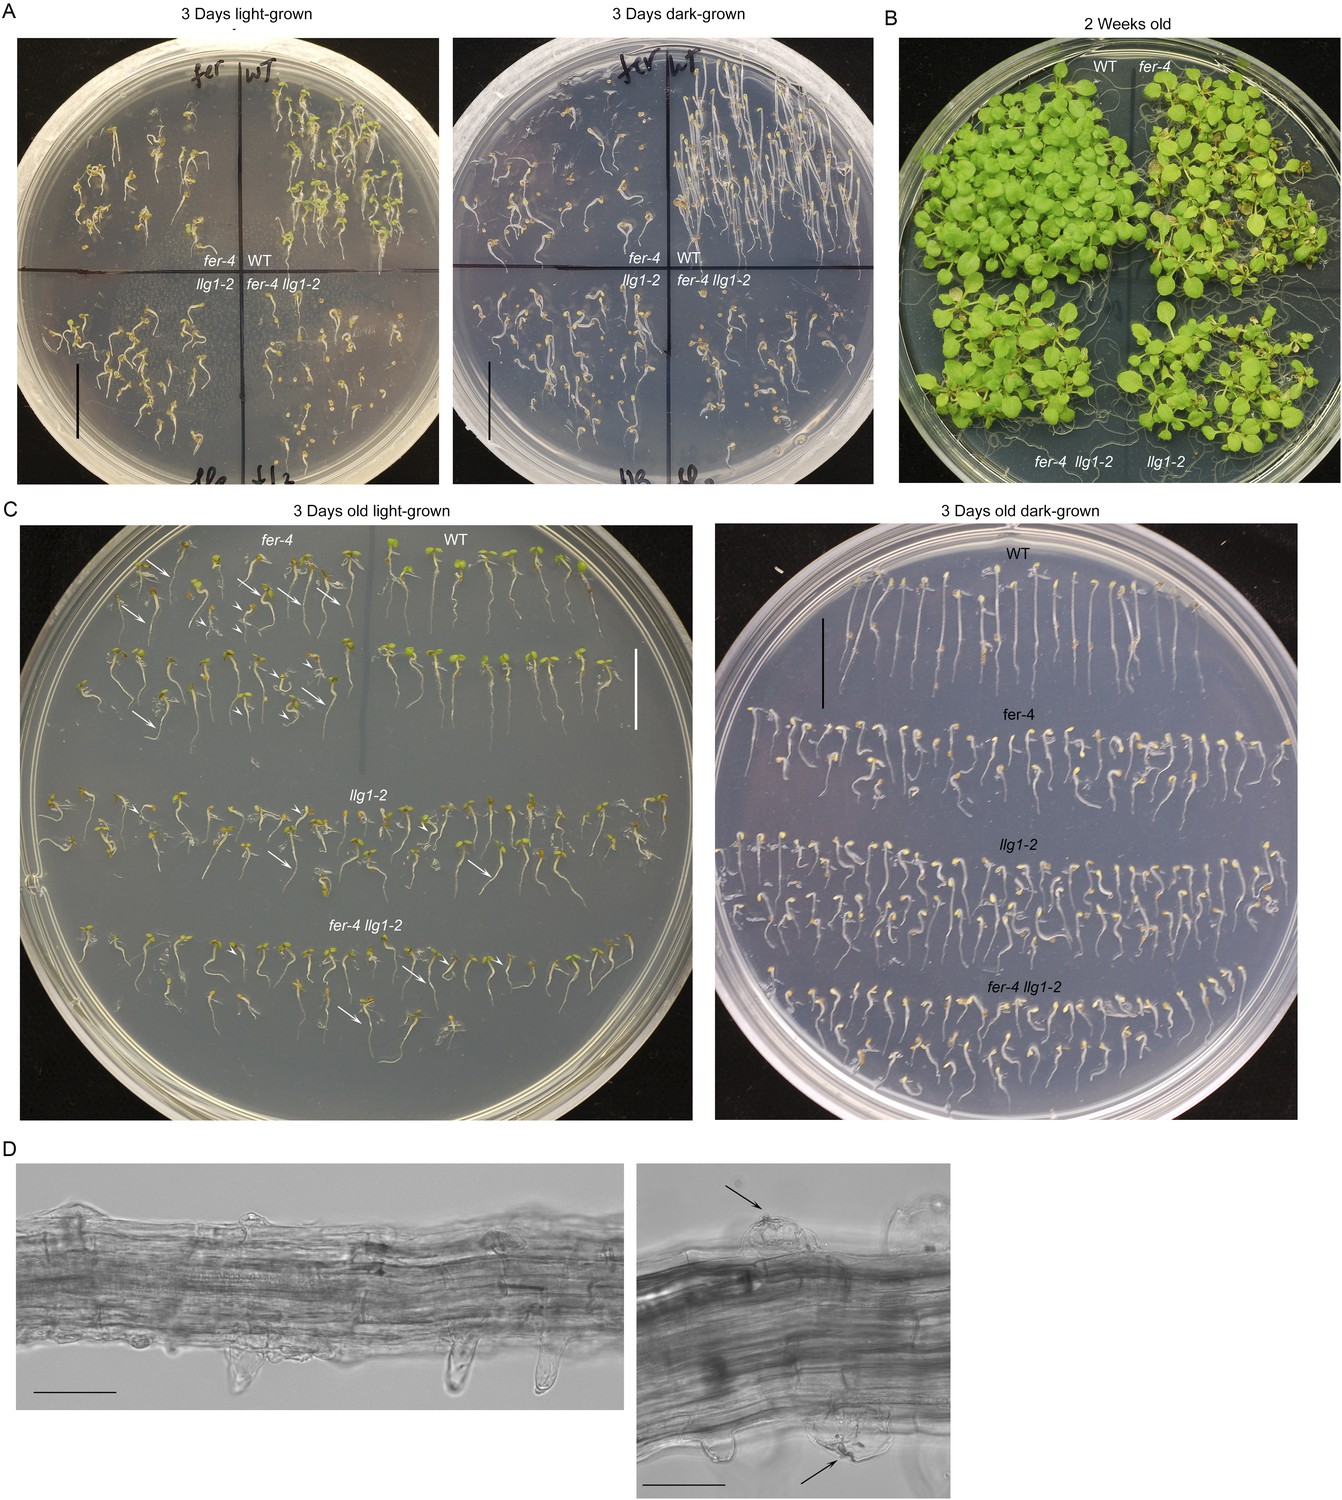
Phenotypes in fer-4 llg1-2 double mutant are comparable to fer-4 and llg1-2 single mutants.
(A–B) Light- and dark-grown fer-4 llg1-2 were compared with wild type (WT) and its single mutant parents. (C) Three-day-old seedlings from representative cultures as shown in (A) to highlight heterogeneity in mutant seedling sizes (arrows and arrowheads point to longer and shorter seedlings, respectively). (D) Root hair defects in fer-4 llg1-2. Arrows indicate collapsed hairs. Scale bar: 1 cm (A, C); 20 μm (left), 10 μm (right).
Figure 3
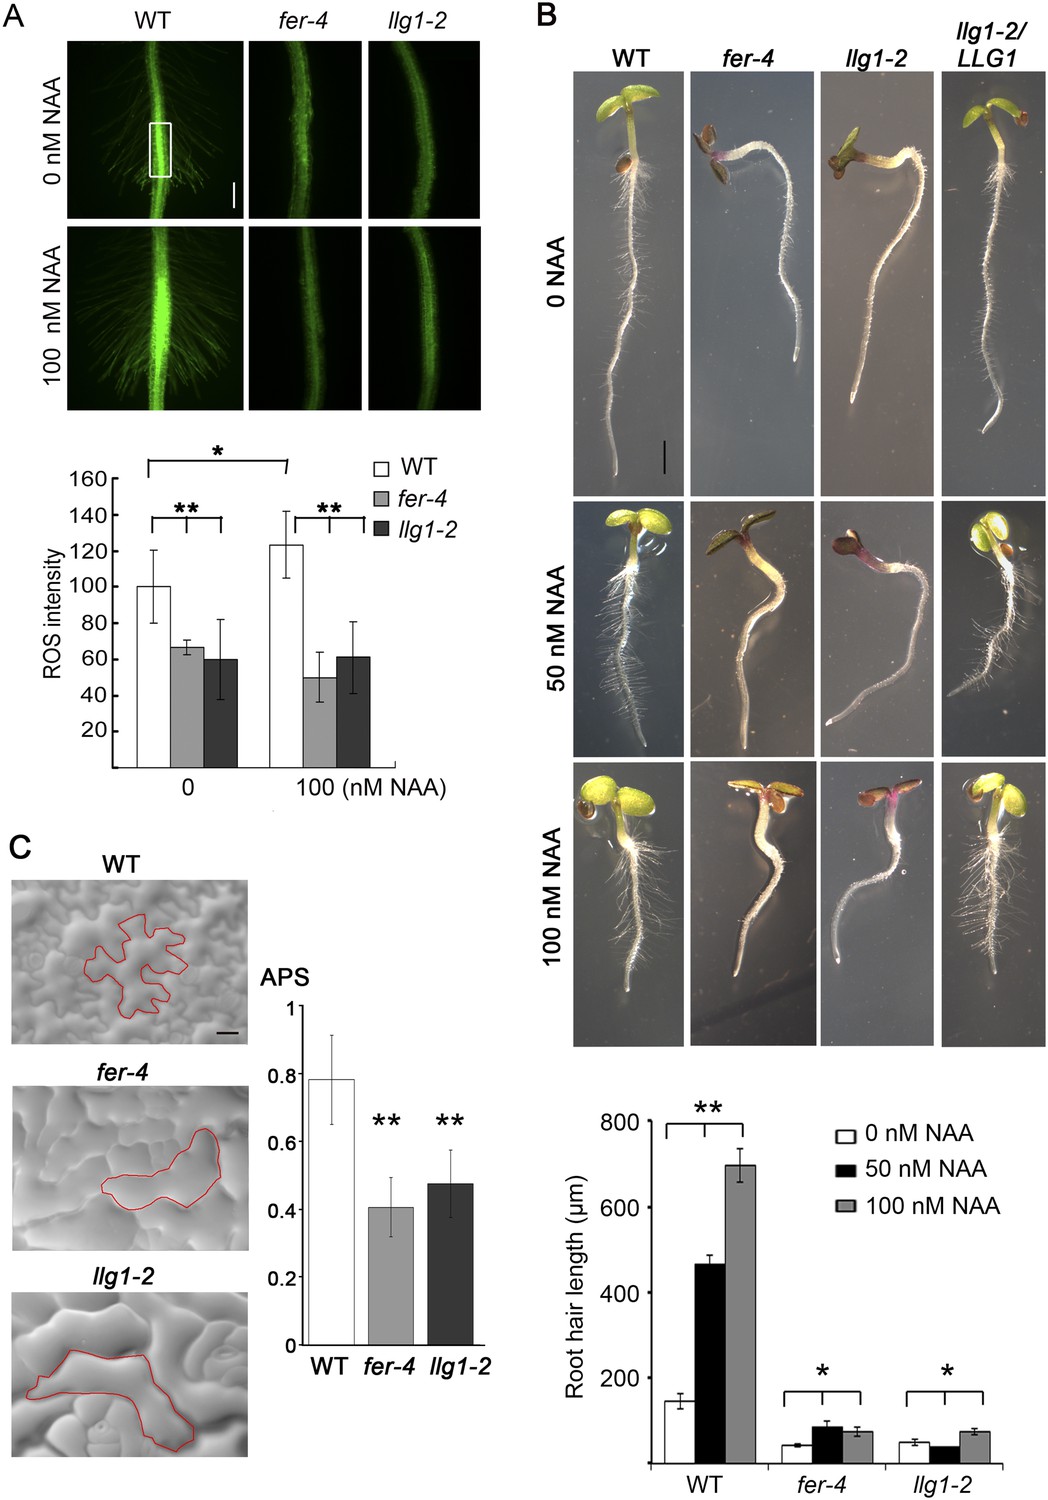
LLG1 controls auxin and RAC/ROP-regulated phenotypes.
(A) Reactive oxygen species (ROS) accumulation and auxin-stimulated ROS production in roots. The histogram shows ROS intensity measured in identical region of interests in similar root regions (boxed area) as described (Duan et al., 2010). Data: averages ± SD (n=8–15 roots). The 100 nM auxin (NAA) data for wild type (WT) root were an underestimation as some auxin-stimulated ROS signals had saturated detection sensitivity. (B) Auxin-regulated root hair growth response. Data: averages ± SEM (n=triplicate samplings of five 4-day-old seedling roots, 100 root hairs from each root). Auxin stimulated wild type root hair lengths significantly and was dose-dependent; its effect on llg1-2 and fer-4 root hairs was negligible or barely reached significance. (C) Epidermal pavement cells from 6-day-old seedlings. Average polarity score (APS) was determined as described (Le et al., 2006; Sorek et al., 2011). Data: averages ± SD (n=20 cells). *p<0.05, **p<10−2, significant and highly significant differences, respectively, from control. Scale bars: 100 μm (A); 2 mm (B); 50 μm (C).
Figure 4 with 2 supplements
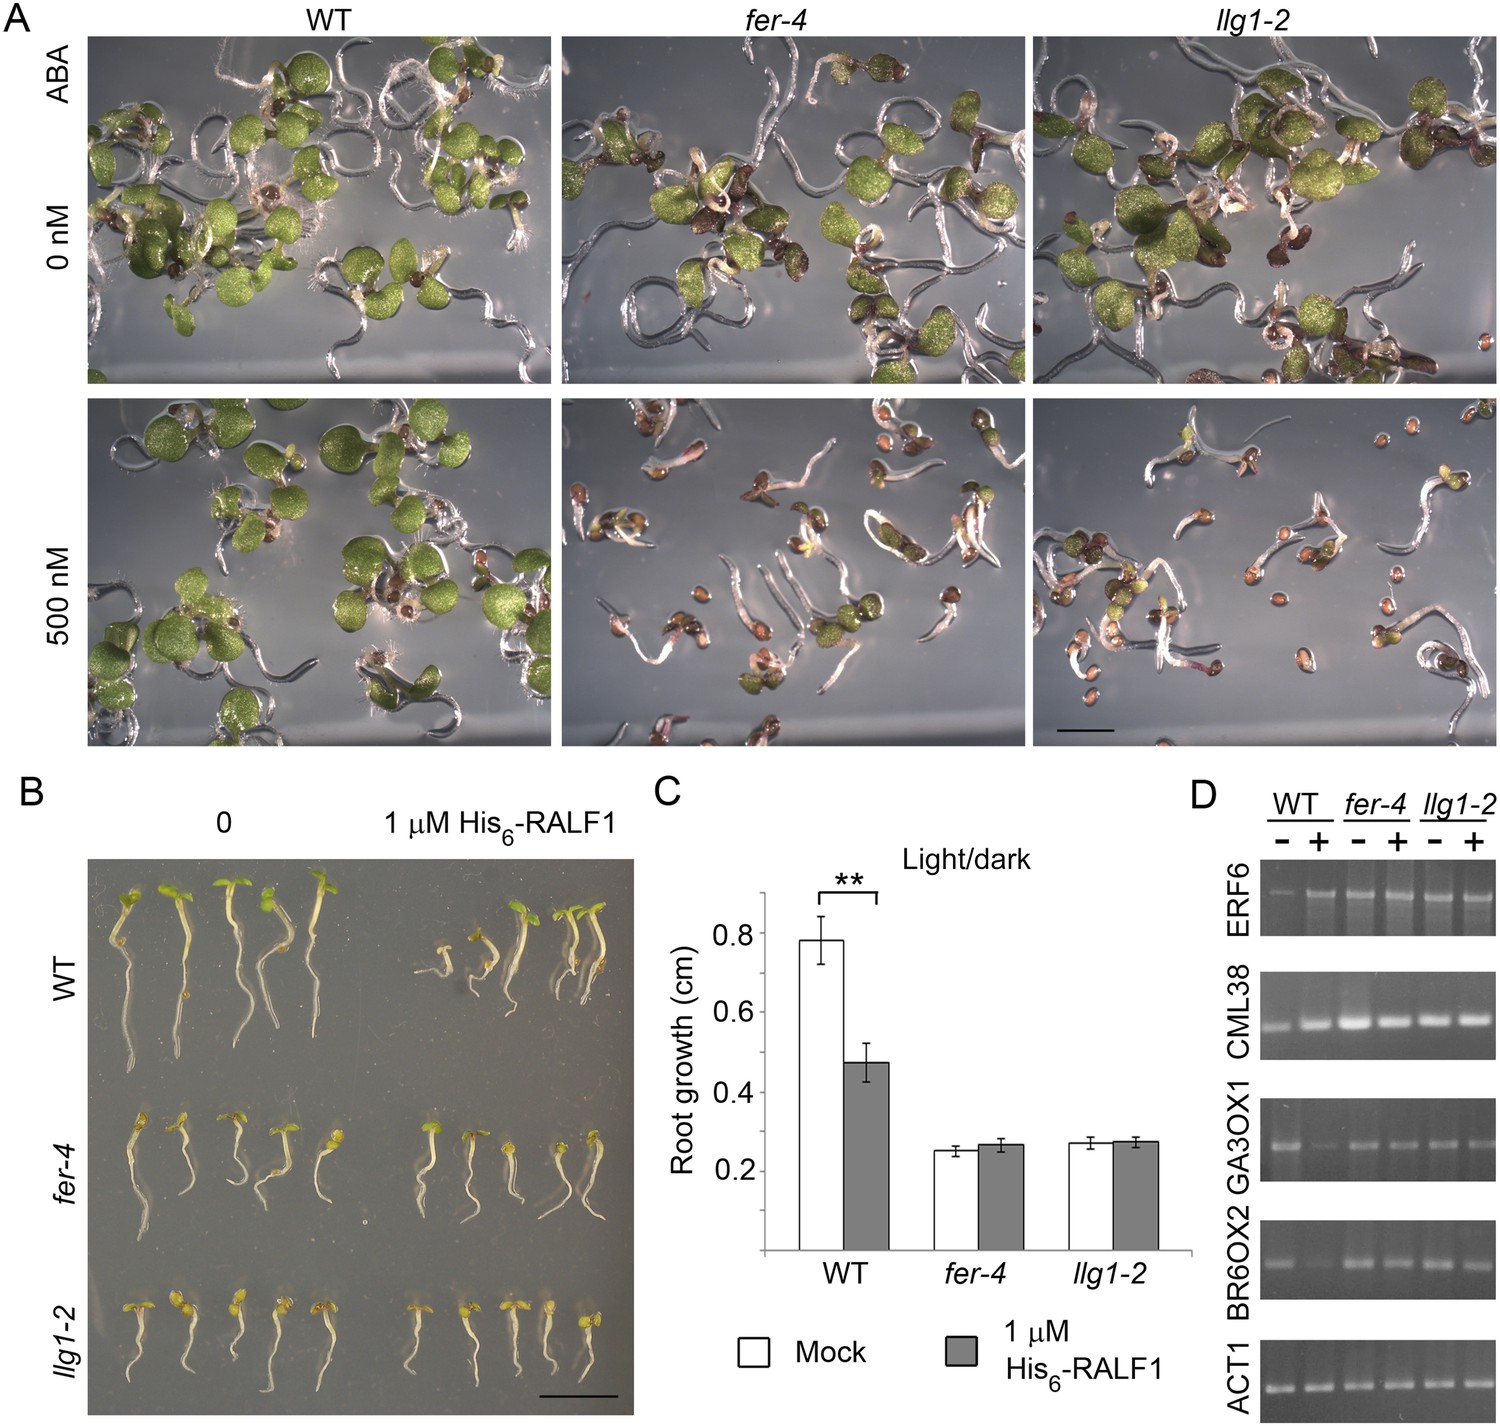
llg1-2 and fer-4 show similar responses to abscisic acid and RALF1.
(A) Five-day-old seedlings with or without (ABA) treatment. (B–D) RALF1 treatments. (B) Seedlings after 2 days of mock (0) or RALF1 treatment. (C) Comparison of root elongation during 2 days of RALF1 treatment. Data: average ± SEM (n=3 replicate experiments); **p<10−2, significant difference. Scale bars: 2 mm (A); 5 mm (B). (D) RT-PCR analysis of RALF1-regulated genes in mock (−) and 1 μM RALF1 (+) treated seedlings. Target genes analyzed were a subset of RALF-regulated genes (Haruta et al., 2014). ACT1: actin 1, as control; BR6OX2: brassinosteroid-6-oxidase 2; GA3OX1: gibberellin-3-oxidase 1; CML38: camoldulin-like 38; ERF6: ethylene response factor 6; WT: wild type. Figure 4—figure supplement 1 and Figure 4—figure supplement 2 show additional ABA and RALF1 treatment data.
Figure 4—figure supplement 1
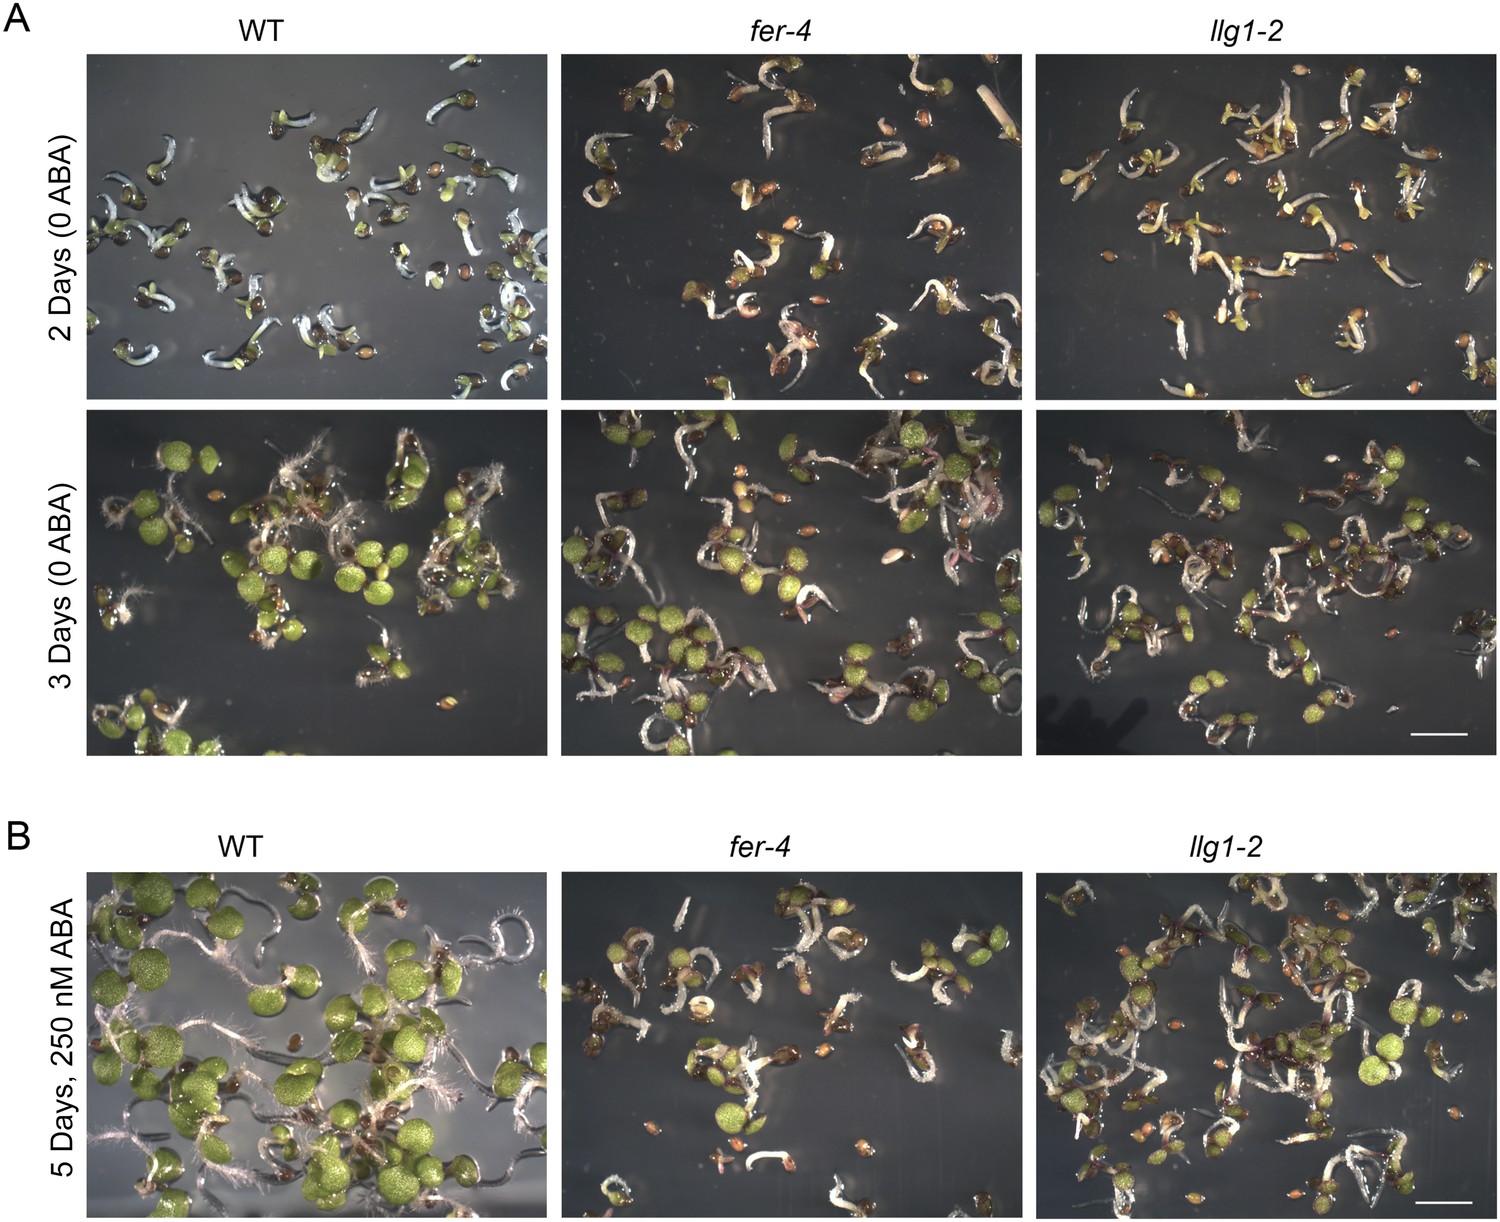
Abscisic acid (ABA) treatment.
(A) Two- and three-day-old seedlings under control conditions. (B) Five-day-old fer-4 and llg1-2 seedlings displayed hypersensitivity to the hormone relative to wild type. WT: wild type. Scale bars: 2 mm.
Figure 4—figure supplement 2
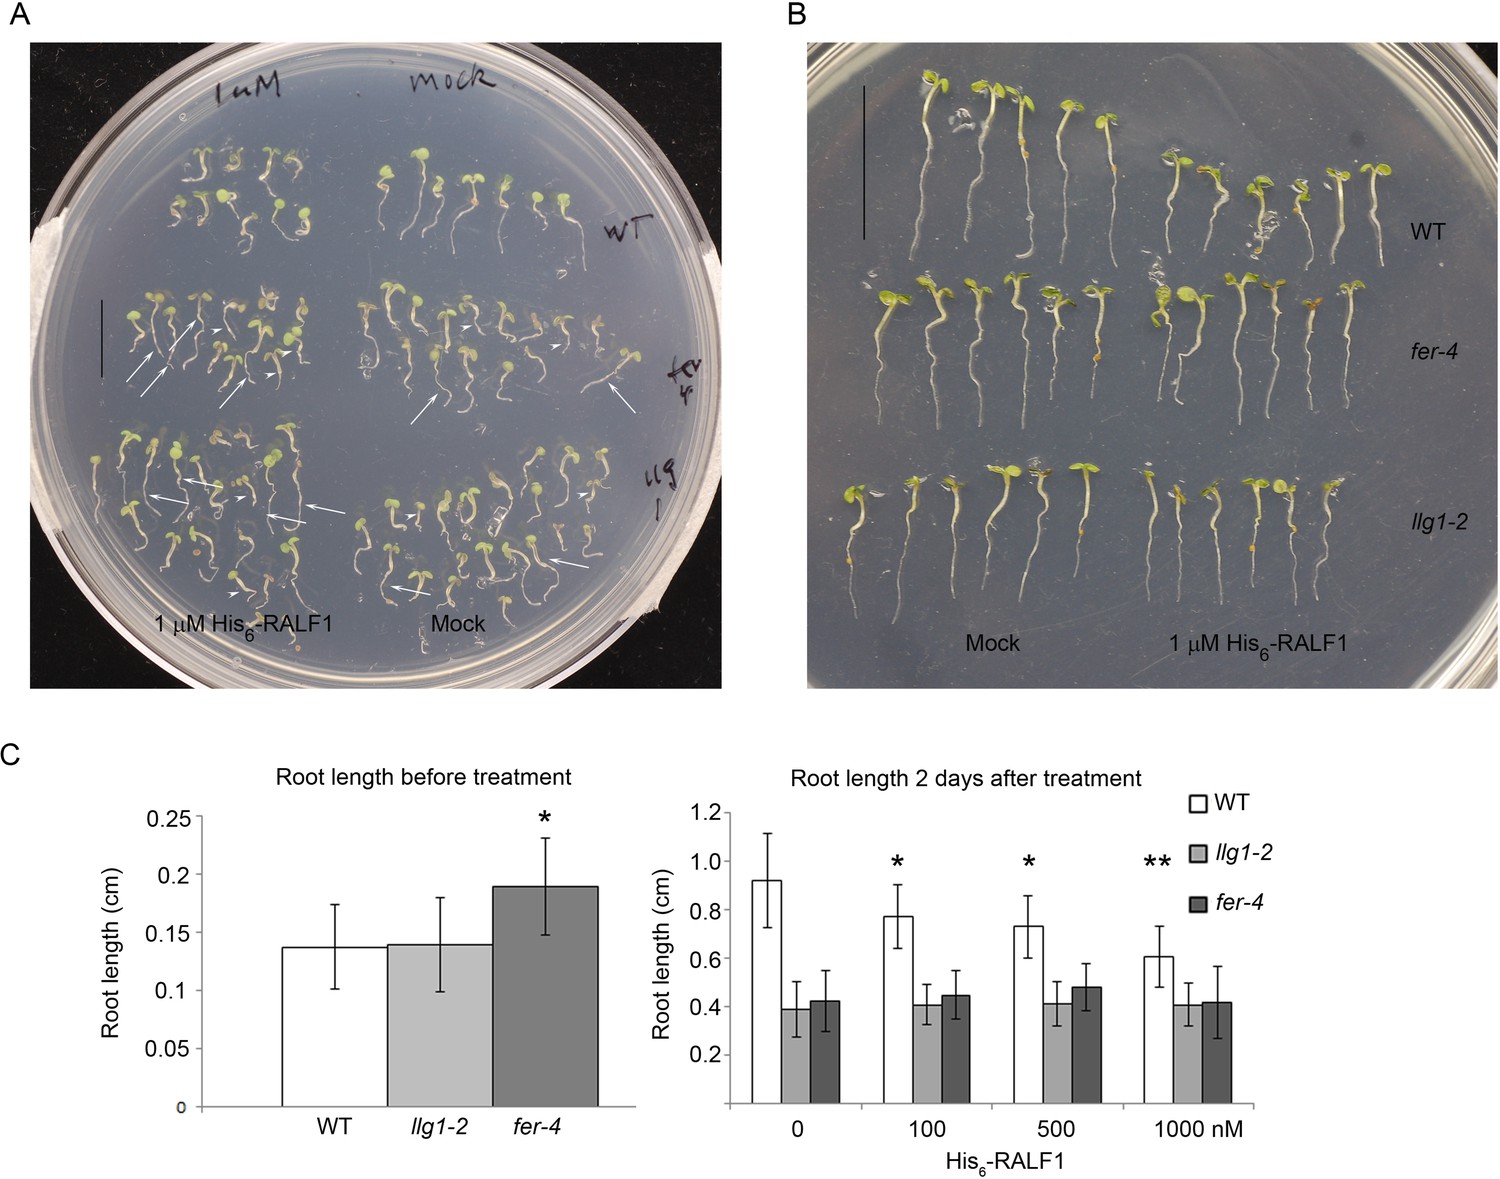
RALF treatment.
(A) Random sampling of seedlings after 2 days of RALF1 (1 μM His6-RALF1) and mock treatment. Arrows and arrowheads point to representative longer and shorter seedlings, respectively, among mutant populations. (B) Representative wild type (WT) and longer fer-4 and llg1-2 seedlings after 2 days of RALF1 treatment. (C) Root length comparison before (left histogram) and after 2 days (right histogram) of RALF1 treatment. Data: averages ± SD (n=100–120 seedlings for each of the before-treatment samples (left); n=25–30 seedlings per after-treatment sample). The actual root growth during the 2 days of RALF1 treatment is shown in Figure 4B. *p<0.05, **p<0.01, significant differences from corresponding controls.
Figure 5 with 1 supplement
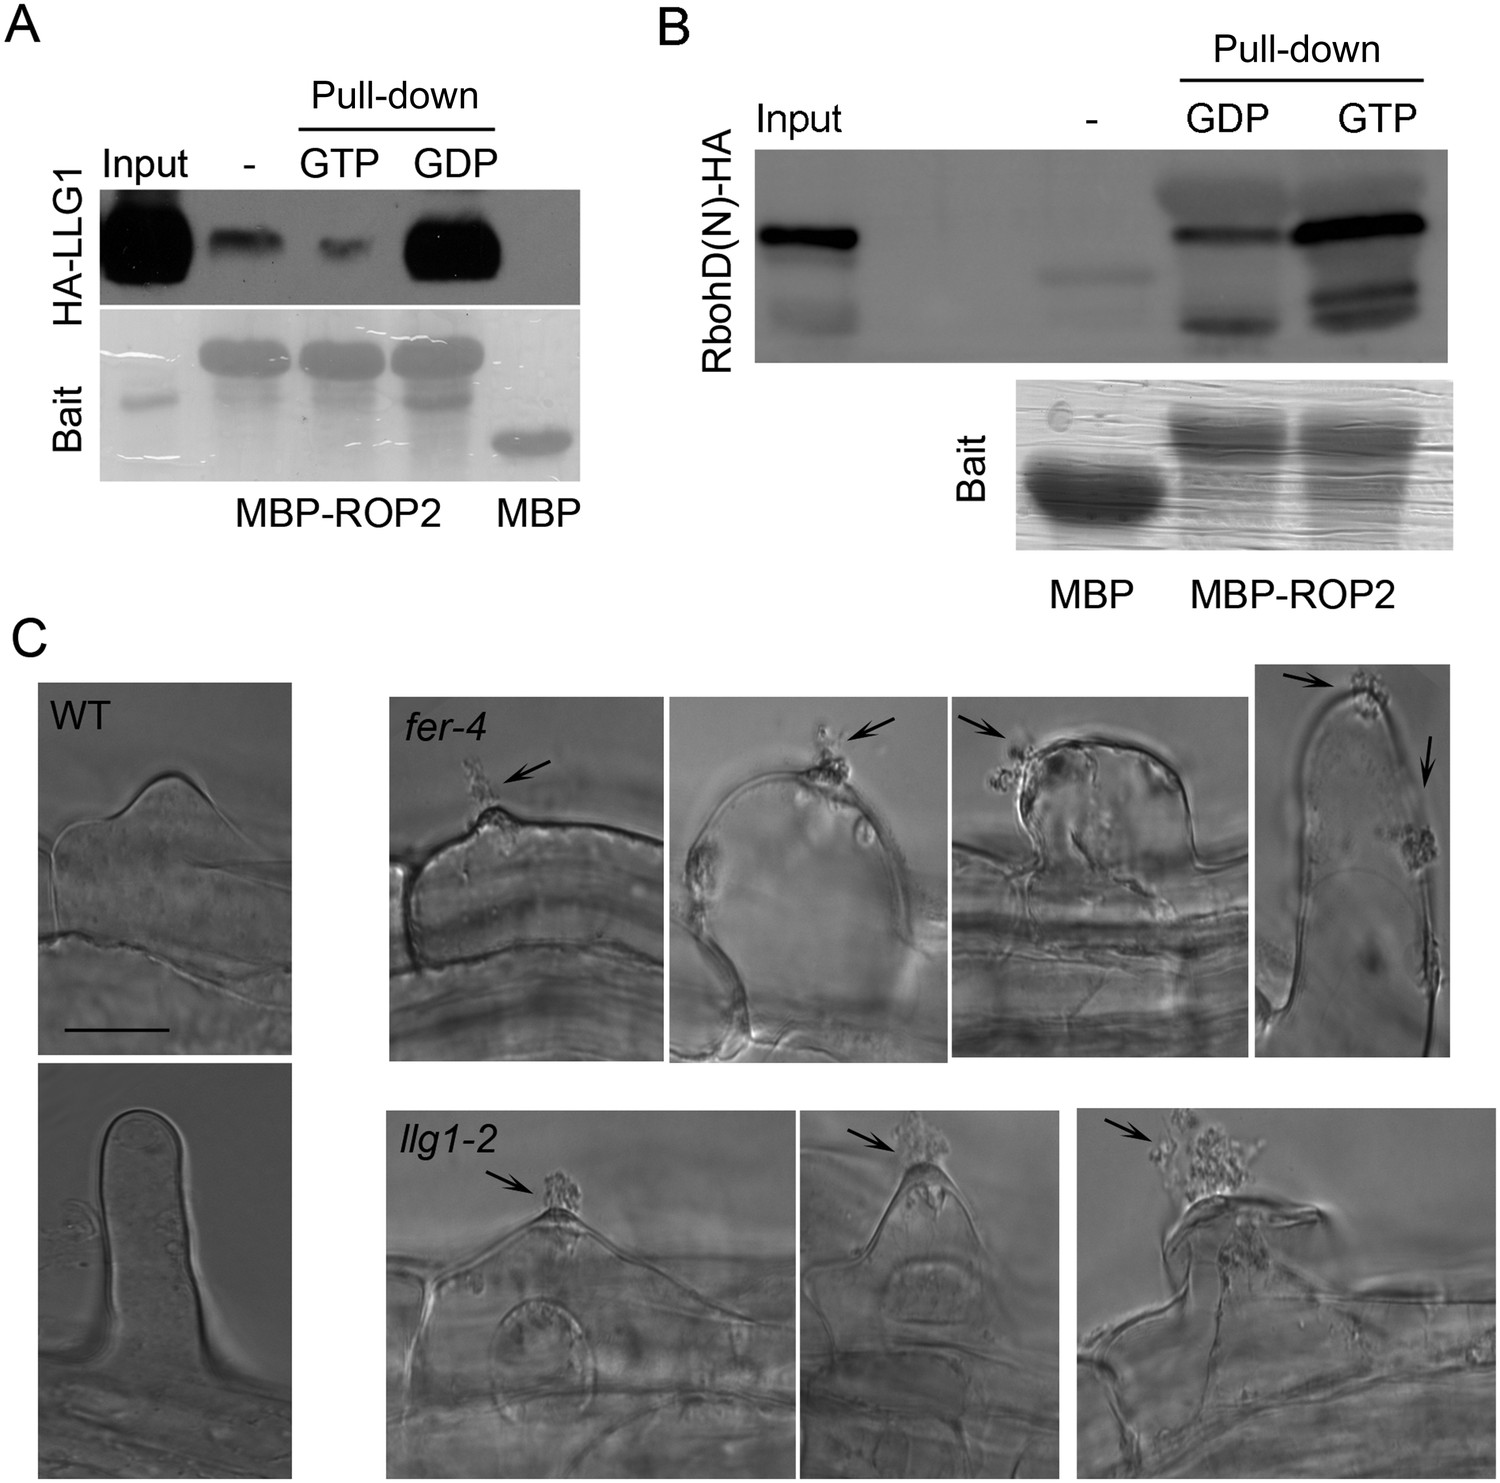
LLG1 and FER function in a RAC/ROP signaling complex and control reactive oxygen species (ROS)-mediated cell wall integrity.
(A) ROP2-MBP pull-down of LLG1 is GDP-enhanced. Figure 5—figure supplement 1 shows similar guanine nucleotide-dependent pull-down of LRE. (B) ROP2-MBP pull-down of RbohD(N) is GTP-enhanced. RbohD(N) is the N-terminal fragment (see Supplementary file 1) analogous to that of OsRbohB, a rice OsRac1 effector (Wong et al., 2007). Pulled-down proteins were detected by anti-HA antibody. Lower panels show comparable bait usage. (C) Emerging and elongating root hairs. Arrows indicate cytoplasmic discharge. Many fer-4 and llg1-2 root hairs were leaking cytoplasm (arrows) prior to collapse. A large amount of cytoplasmic mass could be seen deposited outside hairs that already appeared flaccid (llg1-2, right panel). WT: wild type. Scale bar: 10 μm.
Figure 5—figure supplement 1
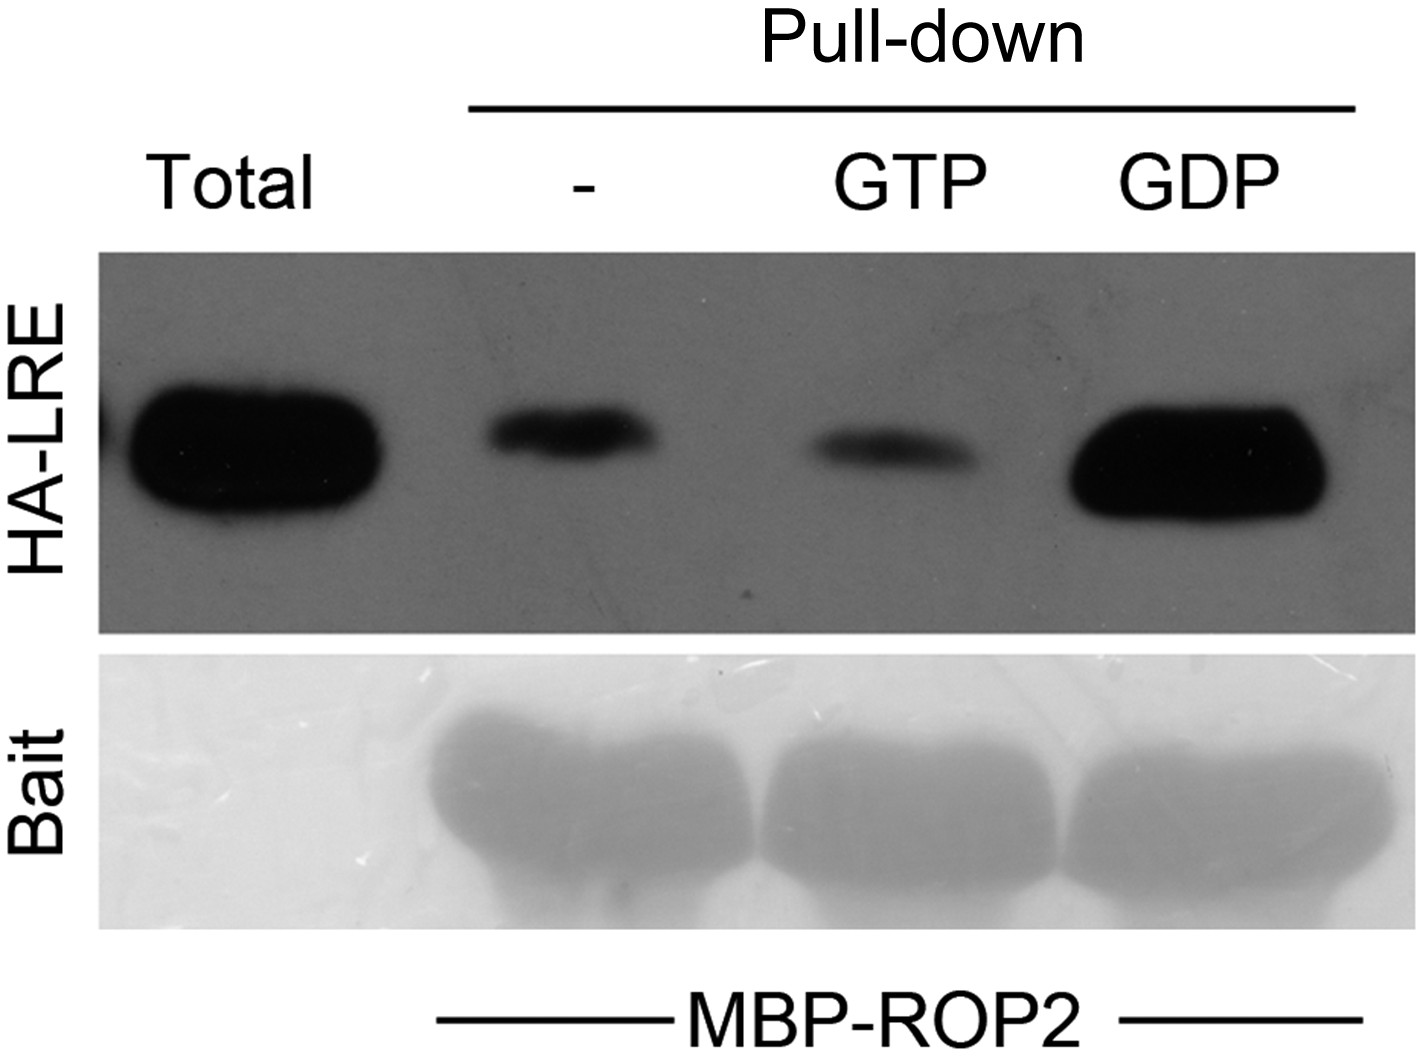
Guanine nucleotide-dependent pull-down of LRE by MBP-ROP2.
https://doi.org/10.7554/eLife.06587.013
Figure 6 with 2 supplements
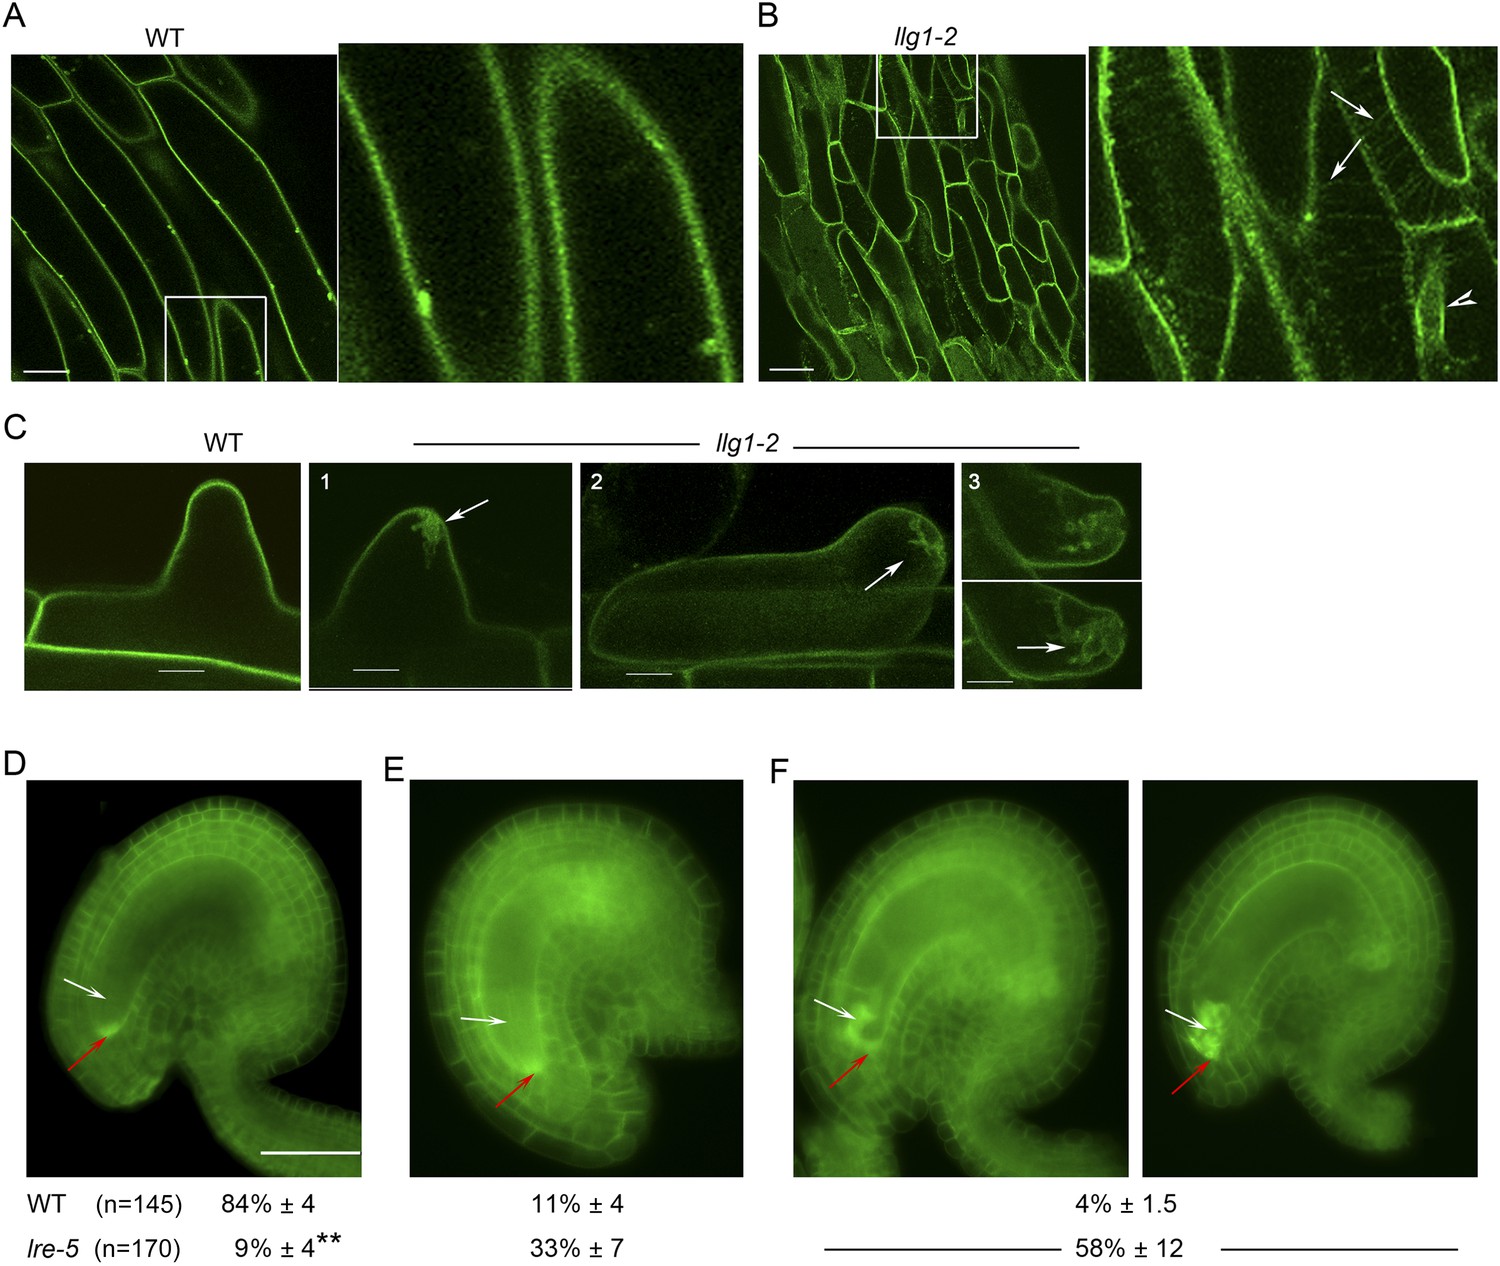
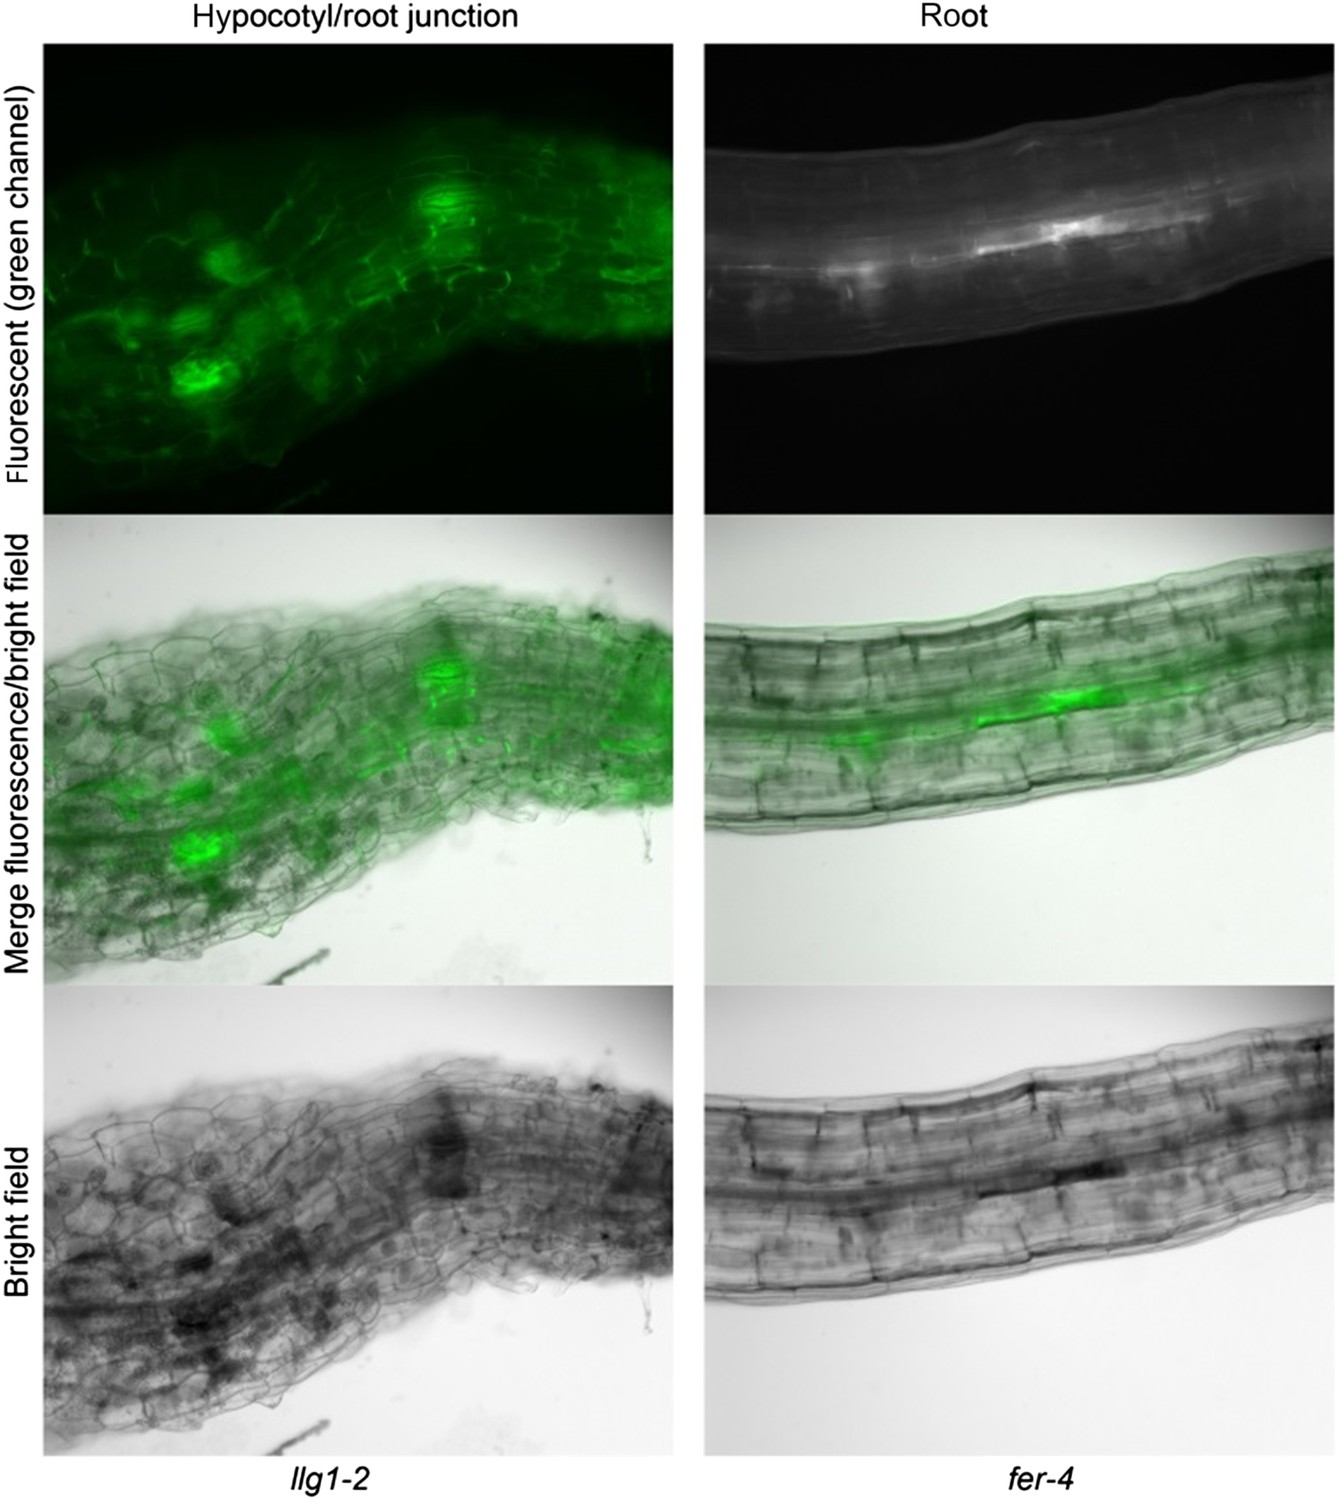
LLG1 and LRE are important for FER cell membrane localization.
(A, B) pFER-expressed FER-GFP localization in 5-day-old wild type (WT) and llg1-2 seedling hypocotyl. Boxed areas are magnified (4×) to highlight FER-GFP-labeled reticulate arrays (arrows) and perinuclear region (arrowhead) in llg1-2, which are absent from wild type. Figure 6—figure supplement 1A,B shows root samples. (C) Emerging root hairs. Arrows indicate intracellular FER-GFP. Figure 6—figure supplement 1C,D shows colocalization with ER-Tracker. (D–F) FER-GFP localization in ovules. (D) Normal FER-GFP localization in ovules, predominantly seen in wild type ovules. (E) lre-5 ovules with moderate FER-GFP mislocalization; filiform apparatus and synergid cell signal quantification is shown in Figure 6—figure supplement 2. (F) lre-5 ovules with severe FER-GFP mislocalization; the signal retained in the synergid cells sometimes appeared patchy (right image; see also Figure 6—figure supplement 2A). (A–C) Single optical sections; (D–F) wide-field images. Scale bars: 25 μm (A, B); 5 μm (C); 50 μm (D).
Figure 6—figure supplement 1
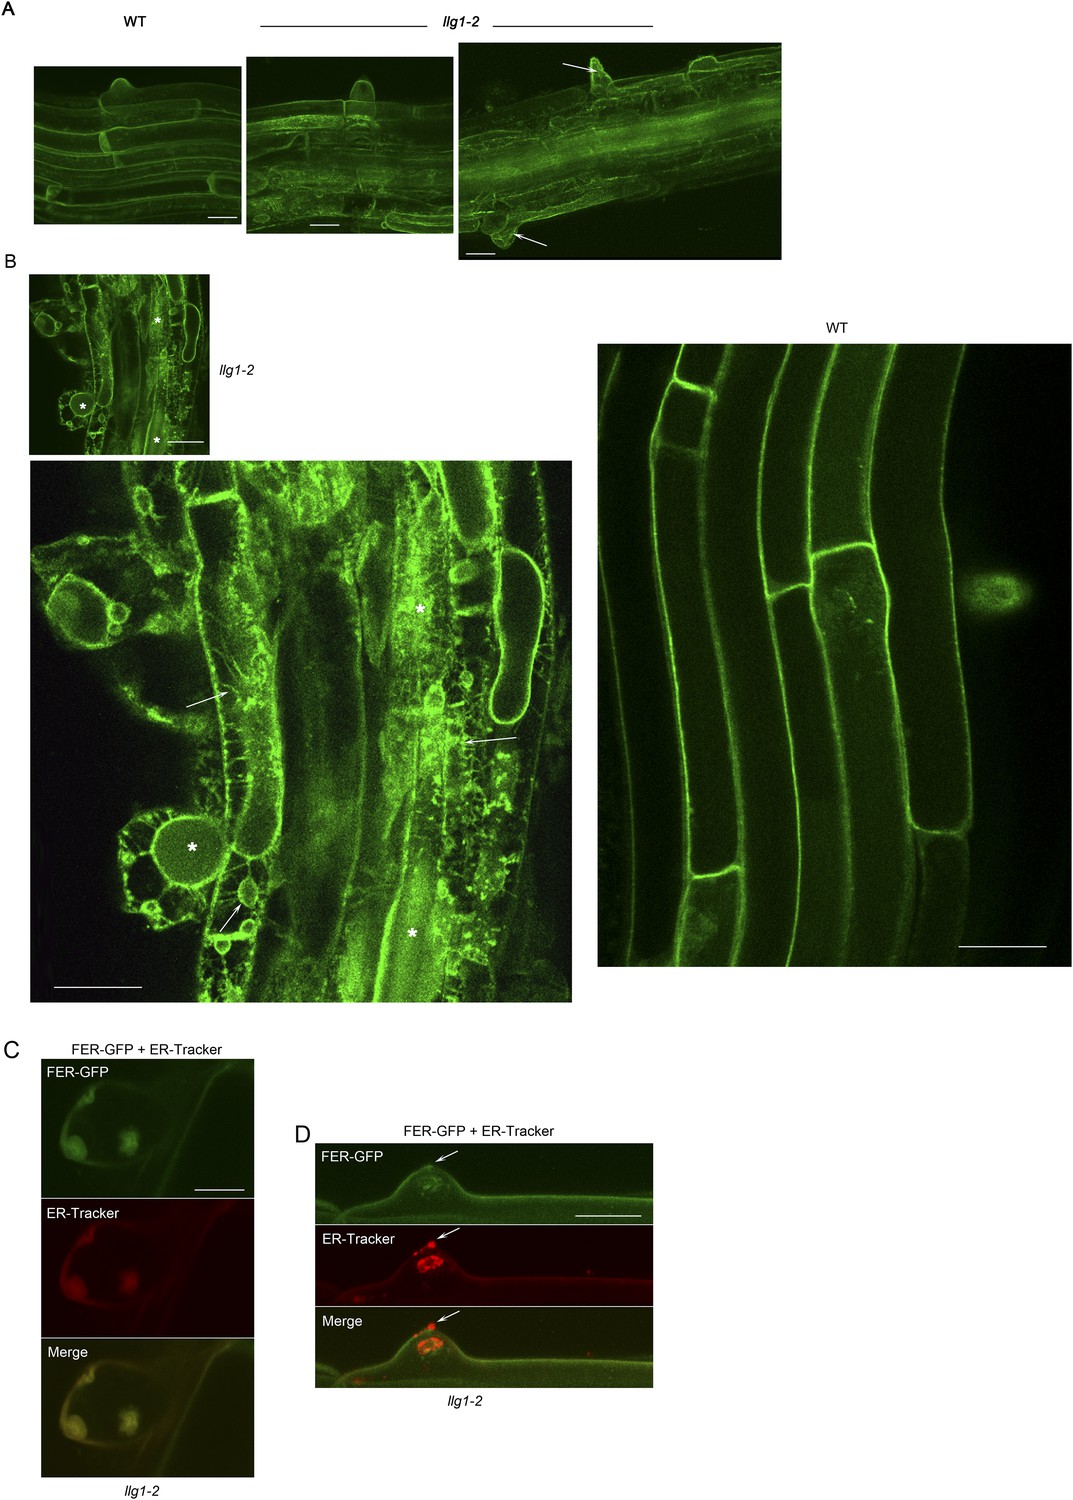
FER-GFP localization in llg1-2 roots.
(A) Intracellular FER-GFP signal was pronounced in llg1-2 roots, particularly in epidermal cells with emerging root hair cells. (B) FER-GFP in llg1-2 and wild type (WT) roots. A magnified view of llg1-2 (3×, lower image) highlights FER-GFP-labeled ER-reminiscent reticulate arrays not seen in WT. *, dull auto-green fluorescent patches are prevalent in llg1-2 and fer-4. This and defective cell surfaces (Daniel Kita, PhD dissertation, UMass) rendered fluorescence imaging in mutant tissues challenging. (C, D) FER-GFP colocalized with ER-Tracker Red-stained membrane patches in a defective root hair that was either growth-arrested during emergence or just prior to rupture (C) and one that was already leaking cytoplasm (arrows) but not yet collapsed (D). (A) Maximum projections of confocal stacks; (C–D) single confocal sections. Scale bars: 10 μm (A, C, D); 20 μm (B).
Figure 6—figure supplement 2
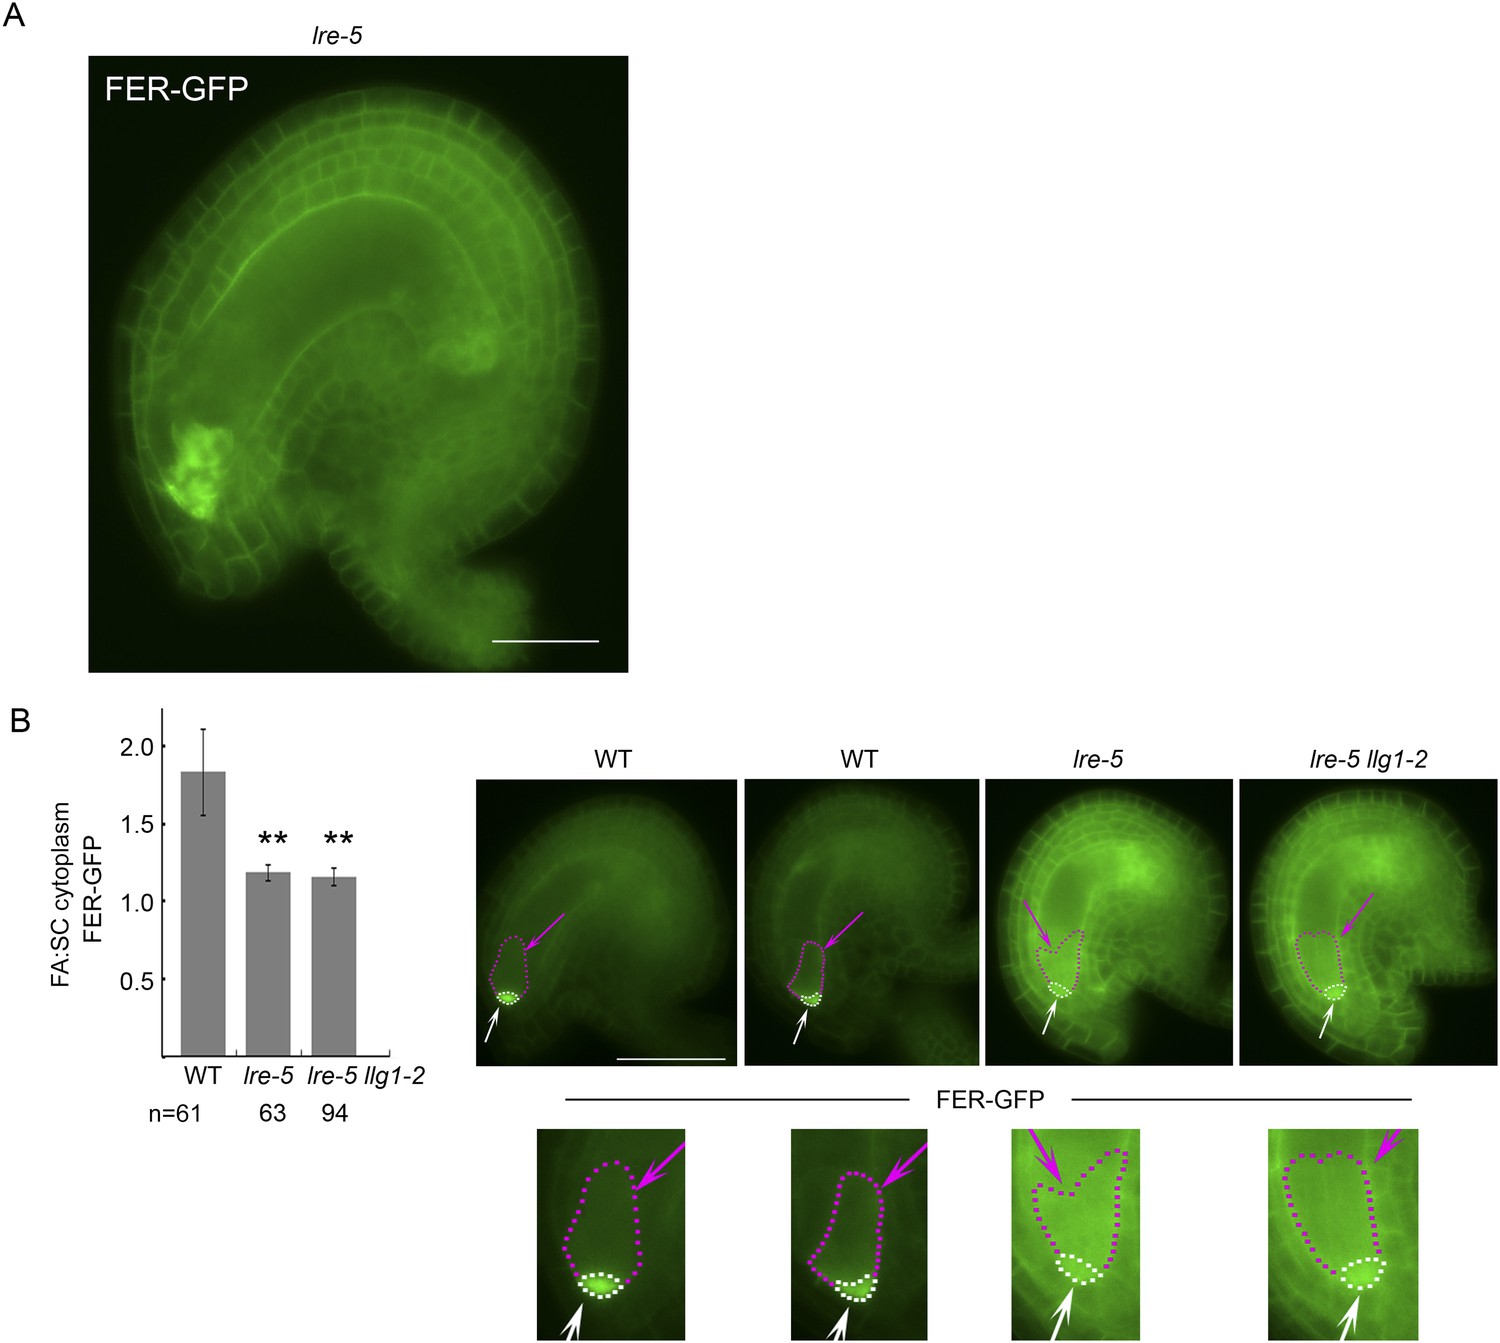
Distribution of filiform apparatus and synergid cell (SC) cytoplasmic FER-GFP signal in wild type and lre-5 ovules.
(A) FER-GFP retained in lre-5 female gametophyte appeared as cytoplasmic patches; a magnified view from Figure 6F. (B) Quantification of FER-GFP signal distribution. Signal intensities in regions of interest in the filiform apparatus (FA) region (white arrows and outlined by white dots) and synergid cell region (pink arrows and outlined by pink dots) in wild type (WT) and mutant ovules with moderate FER-GFP localization defects were measured (see also Figure 5E). The histogram shows their average FA:SC cytoplasmic signal ratios ± SEM (n=total number of ovules measured from 5 (wild type), 3 (lre-5), and 4 (lre5 llg1-2) pistils). **p<10−2, significantly different from wild type. Data also show that llg1-2 did not augment the phenotype of lre-5, consistent with LLG1 having little functional contribution in ovules. Scale bar: 25 μm (A), 50 μm (B).
Figure 7 with 2 supplements
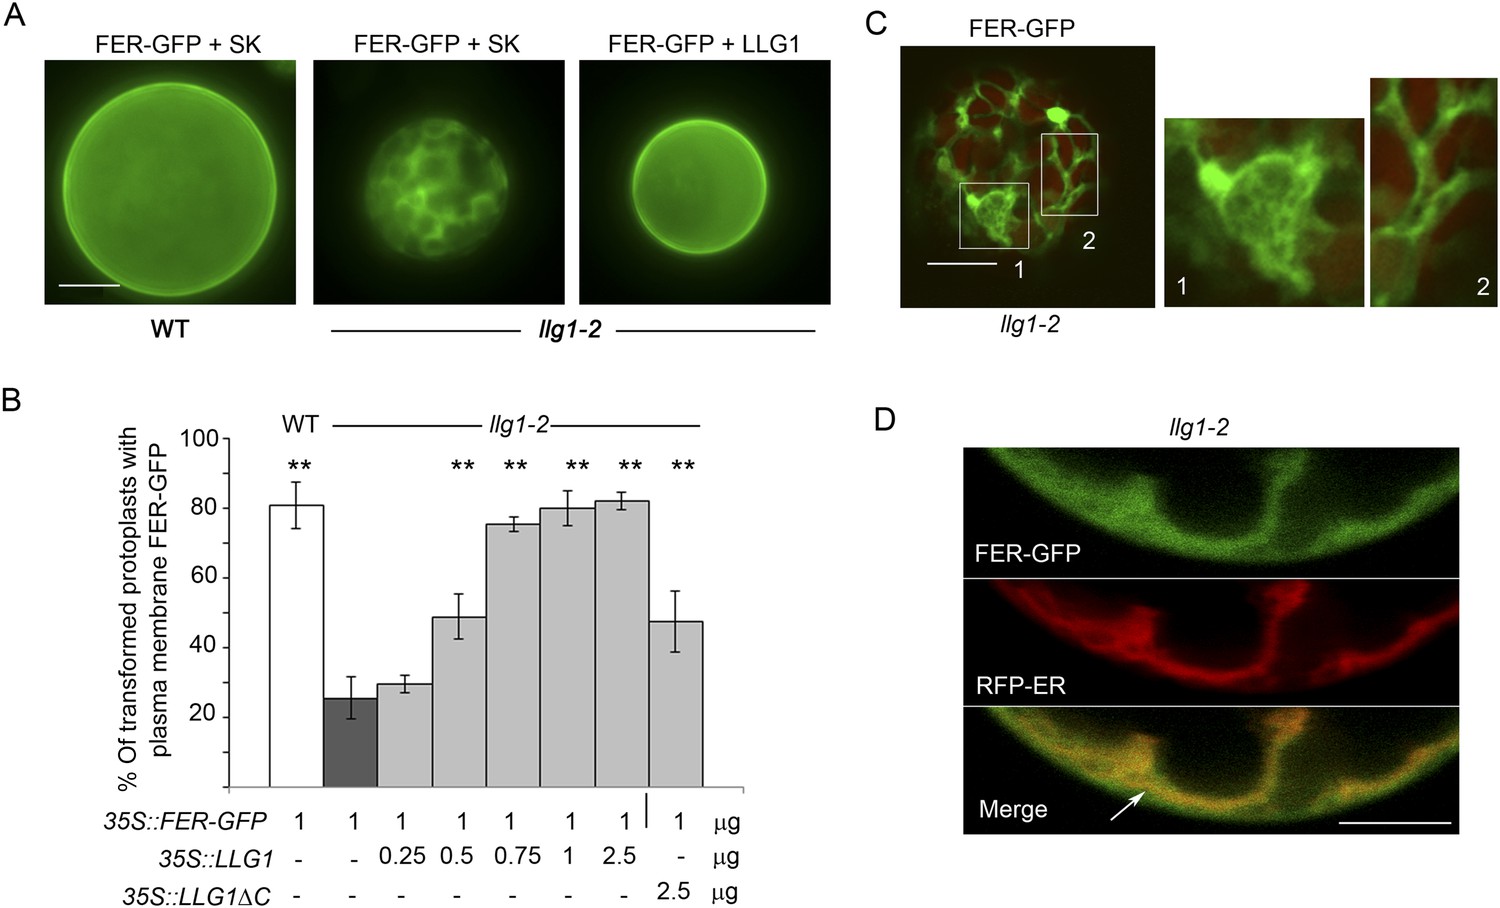
Loss of LLG1 induces endoplasmic reticulum (ER) retention of FER-GFP.
(A) FER-GFP localization in transiently transformed wild type (WT) and llg1 protoplasts. SK, vector DNA. (B) FER-GFP localization response in llg1-2 protoplasts to co-transforming LLG1 or LLG1ΔC DNA. Data: average ± SD (n=triplicate samplings of 100 transformed protoplasts in each sample). **p<10−2, both significantly different from FER-GFP transformed llg1-2 (second data bar). Tagged LLG1s were comparably active (see Figure 7—figure supplement 1A). (C) FER-GFP retained in reticulate structures (magnified boxes 1, 2) in llg1-2 protoplasts; red indicates chlorophyll autofluorescence. (D) Localization of FER-GFP with co-expressed RFP-ER in llg1-2 cells; arrow indicates cell membrane–cortical ER boundary. See also Figure 7—figure supplement 2B–D. (A) Wide-field images; (C, D) single confocal sections. Scale bars: 10 μm.
Figure 7—figure supplement 1
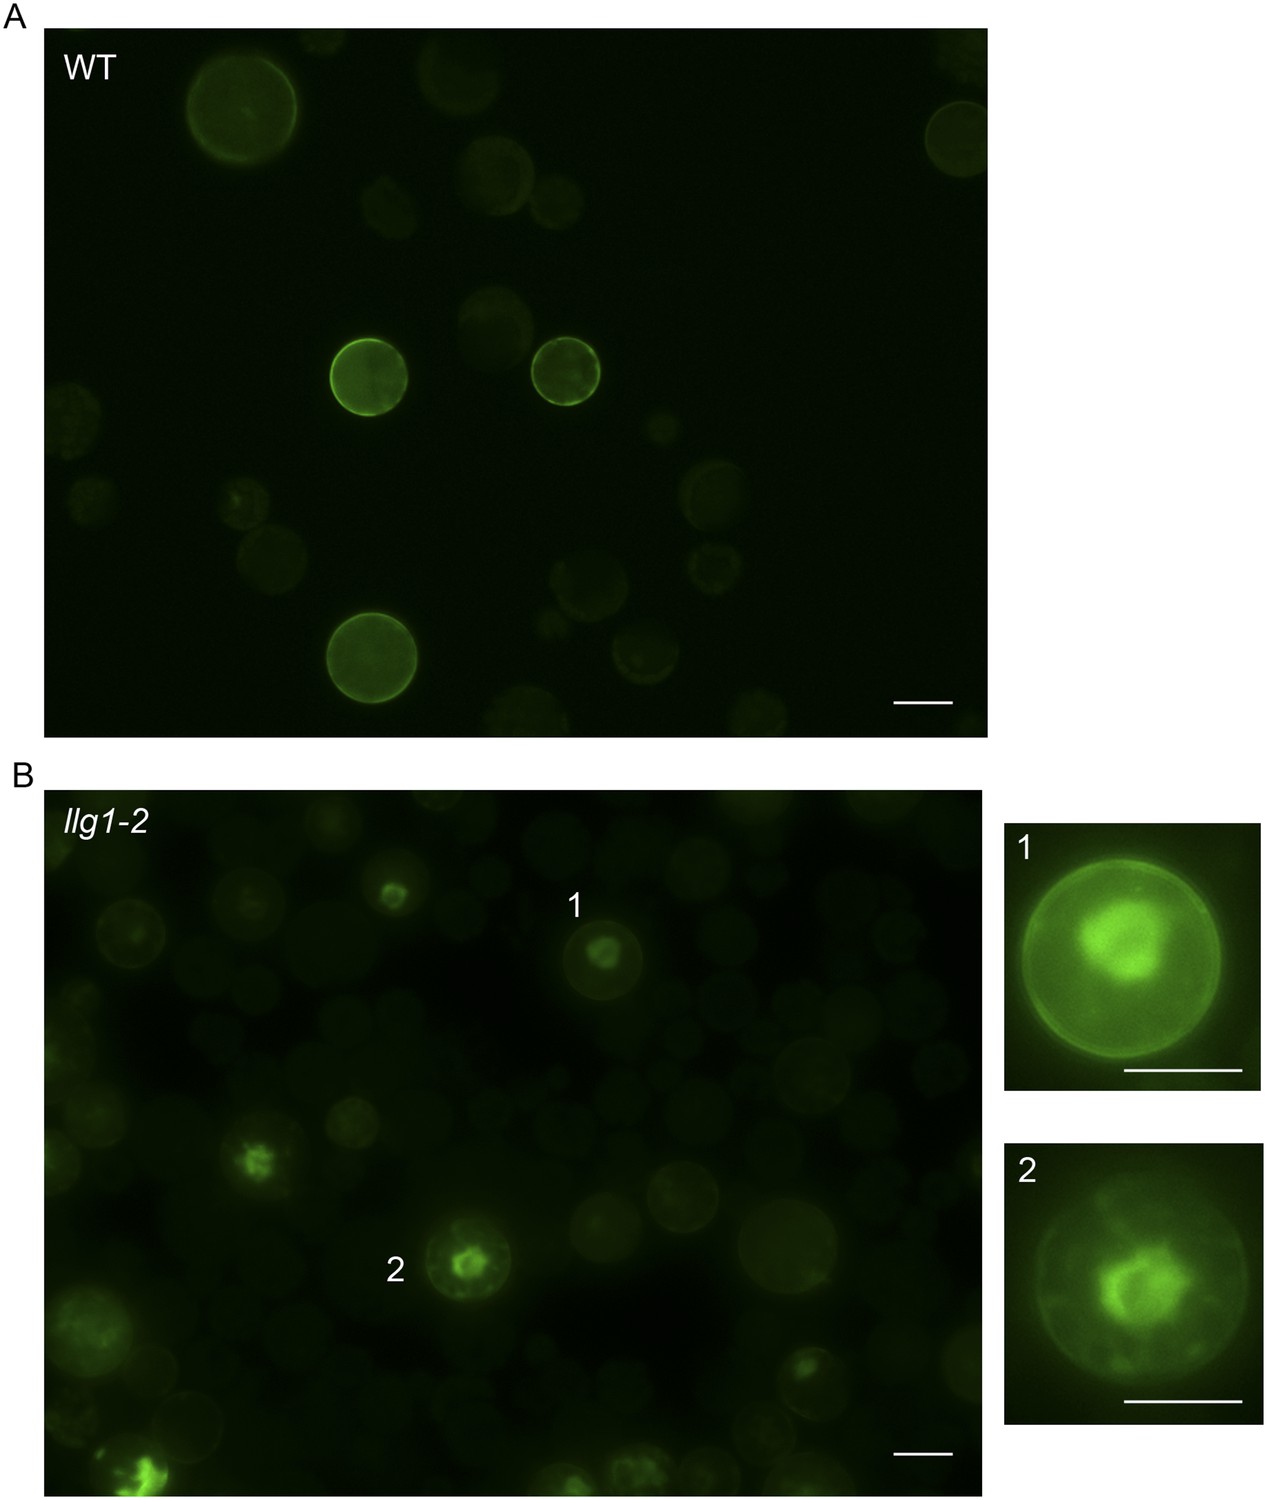
35S::FER-GFP transformed wild type (A) and llg1-2 (B) protoplasts.
Overviews of transformed cell cultures. Cells 1, 2 were enlarged to highlight intracellular FER-GFP signal. WT: wild type. Scale bars: 20 μm.
Figure 7—figure supplement 2
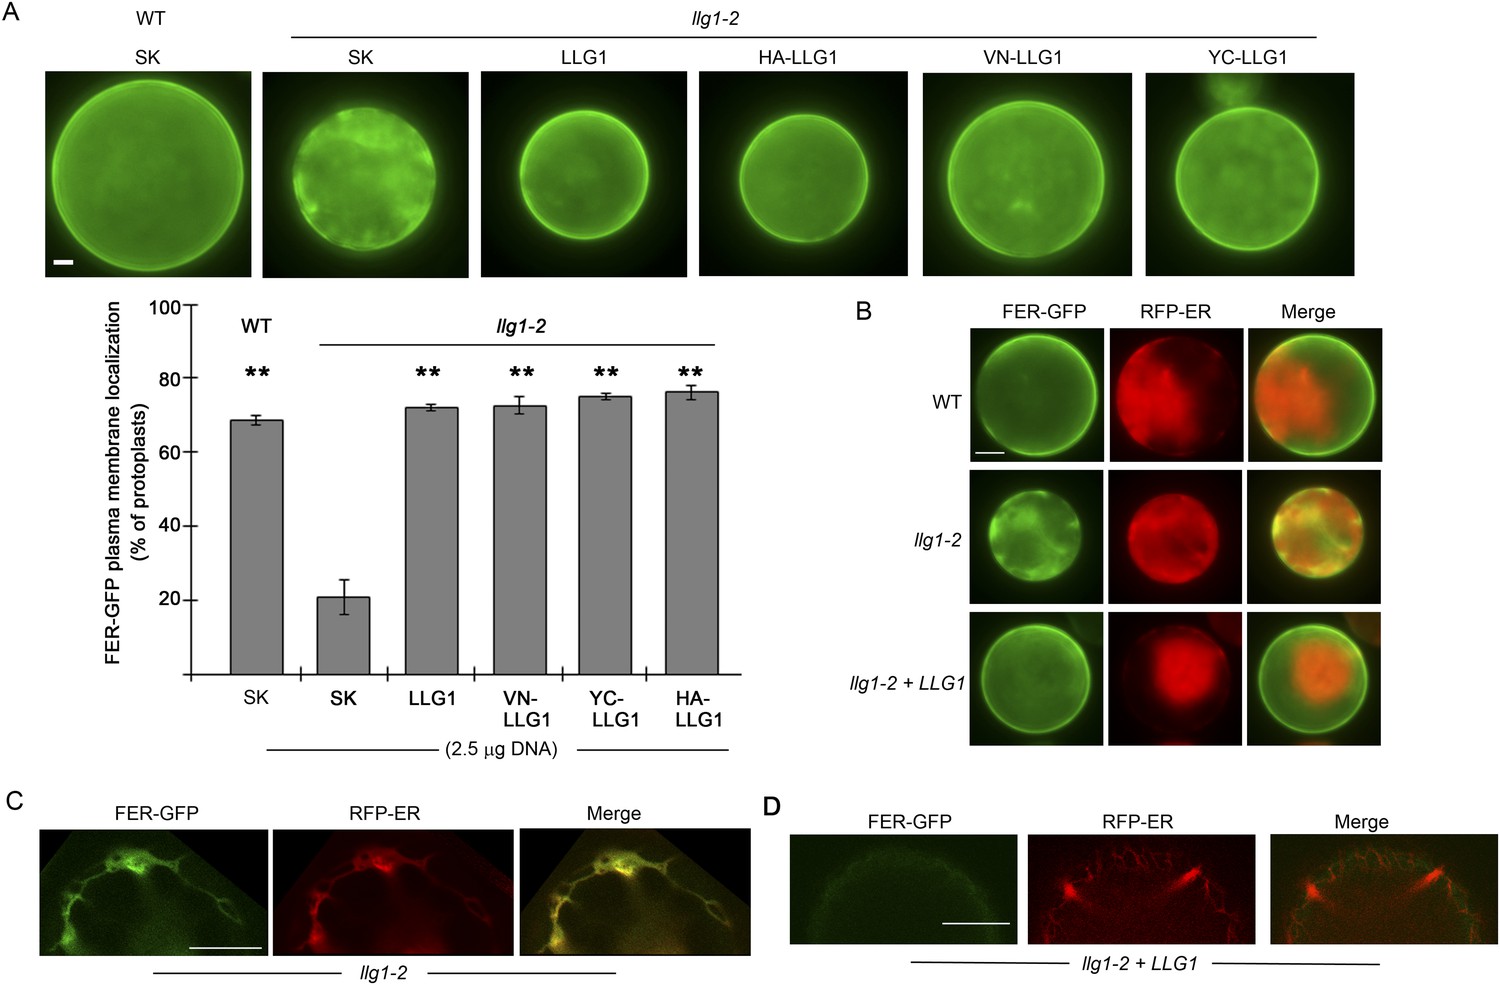
Efficient cell membrane localization of FER-GFP depends on LLG1.
(A) FER-GFP localization in wild type (WT), llg1-2 protoplasts co-transformed by 35S::FER-GFP (1 μg), and SK or various tagged forms of LLG1 DNA (2.5 μg). The histogram quantifies plasma membrane localization of FER-GFP. Data: average ± SD (n=3 replicate samples, each between 100 and 200 transformed cells); **p<10−3, significant differences from FER-GFP and SK-cotransformed llg1-2 (second data bar). (B) Representative wide-field images of protoplasts co-expressing FER-GFP and RFP-ER showing cell membrane location of FER-GFP in wild type and LLG1-complemented llg1-2 cells and its retention in the cytoplasm of llg1-2 cells. (C, D) Sub-medial plane confocal sections showing FER-GFP and RFP-ER colocalization in a llg1-2 cell (C) and that LLG1 complementation obliterated FER-GFP colocalization with the endoplasmic reticulum (ER) marker (D). Scale bars: 5 μm (A, B); 10 μm (C–D).
Figure 8
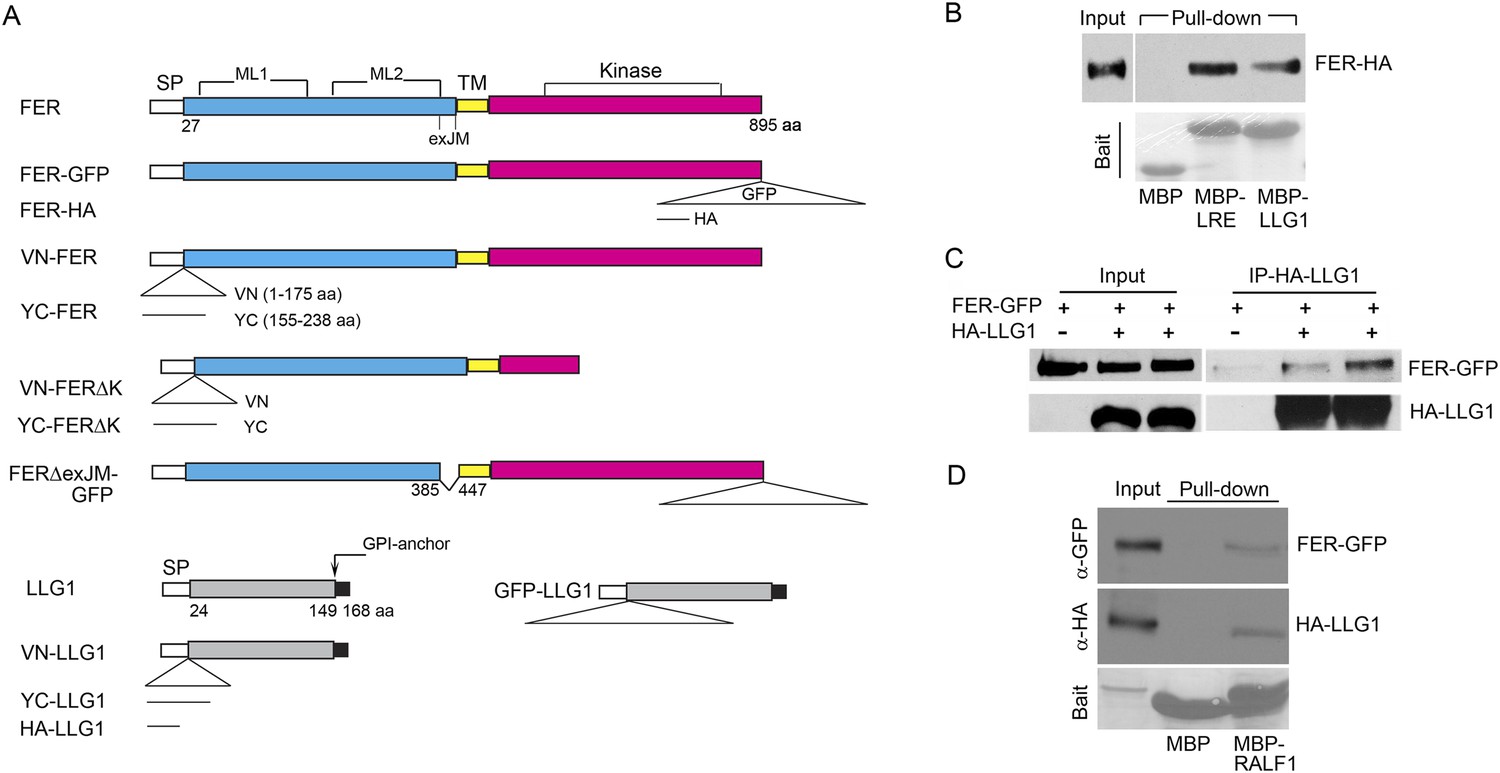
LLG1 and LRE interact with FER.
(A) Domain maps for FER, LLG1, and key constructs used for protein–protein interaction studies. Supplementary file 1 shows a full list of constructs used. SP, TM, ML1,2, and exJM are signal peptide, transmembrane, malectin-like, and extracellular juxtamembrane domains, respectively. ΔexJM, exJM deletion. Triangles indicate insertion locations for the various tags used. (B) Escherichia coli produced LLG1-MBP and LRE-MBP pull-down of protoplasts-expressed FER-HA, detected by anti-HA antibody (upper panel). The lower panel shows the comparable amount of bait proteins used. (C) Co-immunoprecipitation of protoplasts-expressed FER-GFP and HA-LLG1 by anti-HA; FER-GFP was detected by anti-GFP. (D) MBP-RALF1 pull-down of FER-GFP and HA-LLG1 co-expressed in transformed protoplasts. Anti-HA or anti-GFP antibodies were used in these blots. Bait panels were Ponçeau S-stained blots showing comparable amounts of bait usage.
Figure 9 with 1 supplement
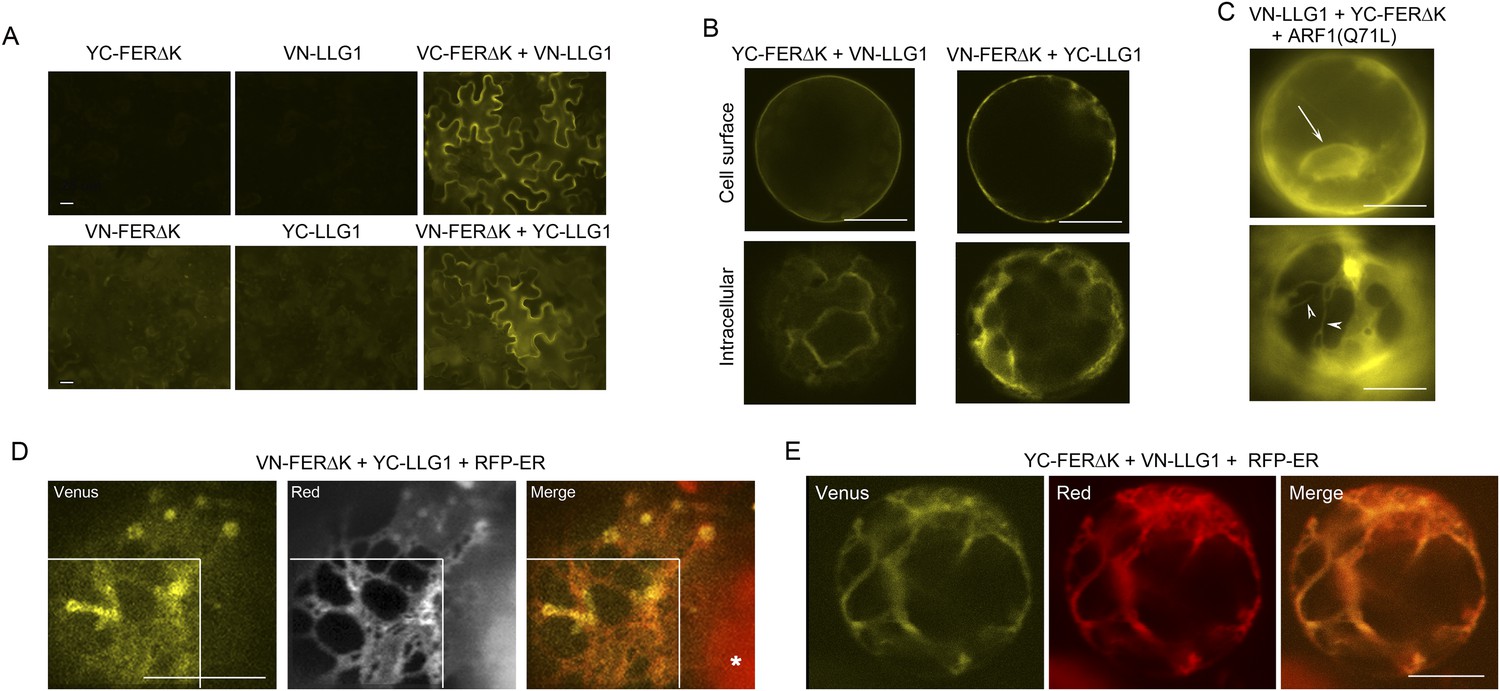
BiFC assays show LLG1-FER interaction on the cell membrane and in the endoplasmic reticulum (ER).
Transgenes used are as indicated. (A) Agroinfiltration-transfected tobacco leaf epidermal cells. Figure 9—figure supplement 1A shows FER-GFP and GFP-LLG1 localization when expressed alone. (B–E) Transformed Arabidopsis protoplasts. (B) Protoplasts with cell membrane-located reconstituted Venus signal (upper panel) and pronounced intracellular signal (lower panel) were observed on comparable levels (n>3 replicate assays, with ∼50 BiFC positive cells each). Figure 9—figure supplement 1 shows GFP-LLG1 localization when expressed alone, single vector controls, and reconstituted Venus signal in cells expressing the full-length FER as one of the split Venus pair. (C) The majority of protoplasts (>90%, n=triplicate samplings, ∼50 BIFC positive cells each) co-transformed by ARF1(Q71L) and the split Venus pair showed strong intracellular Venus signals that resembled the ER. Arrow indicates perinuclear; arrowheads indicate dynamic reticulate structure (see Videos 1, 2). (D, E) Colocalization of the split Venus signal with the ER marker, RFP-ER. Boxed areas in (D) were contrast-enhanced (equally) to highlight the signals. *, chlorophyll fluorescence. (A, C) Wide-field, (B, D, E) confocal images. Scale bars: 25 μm (A), 10 μm (B–E).
Figure 9—figure supplement 1
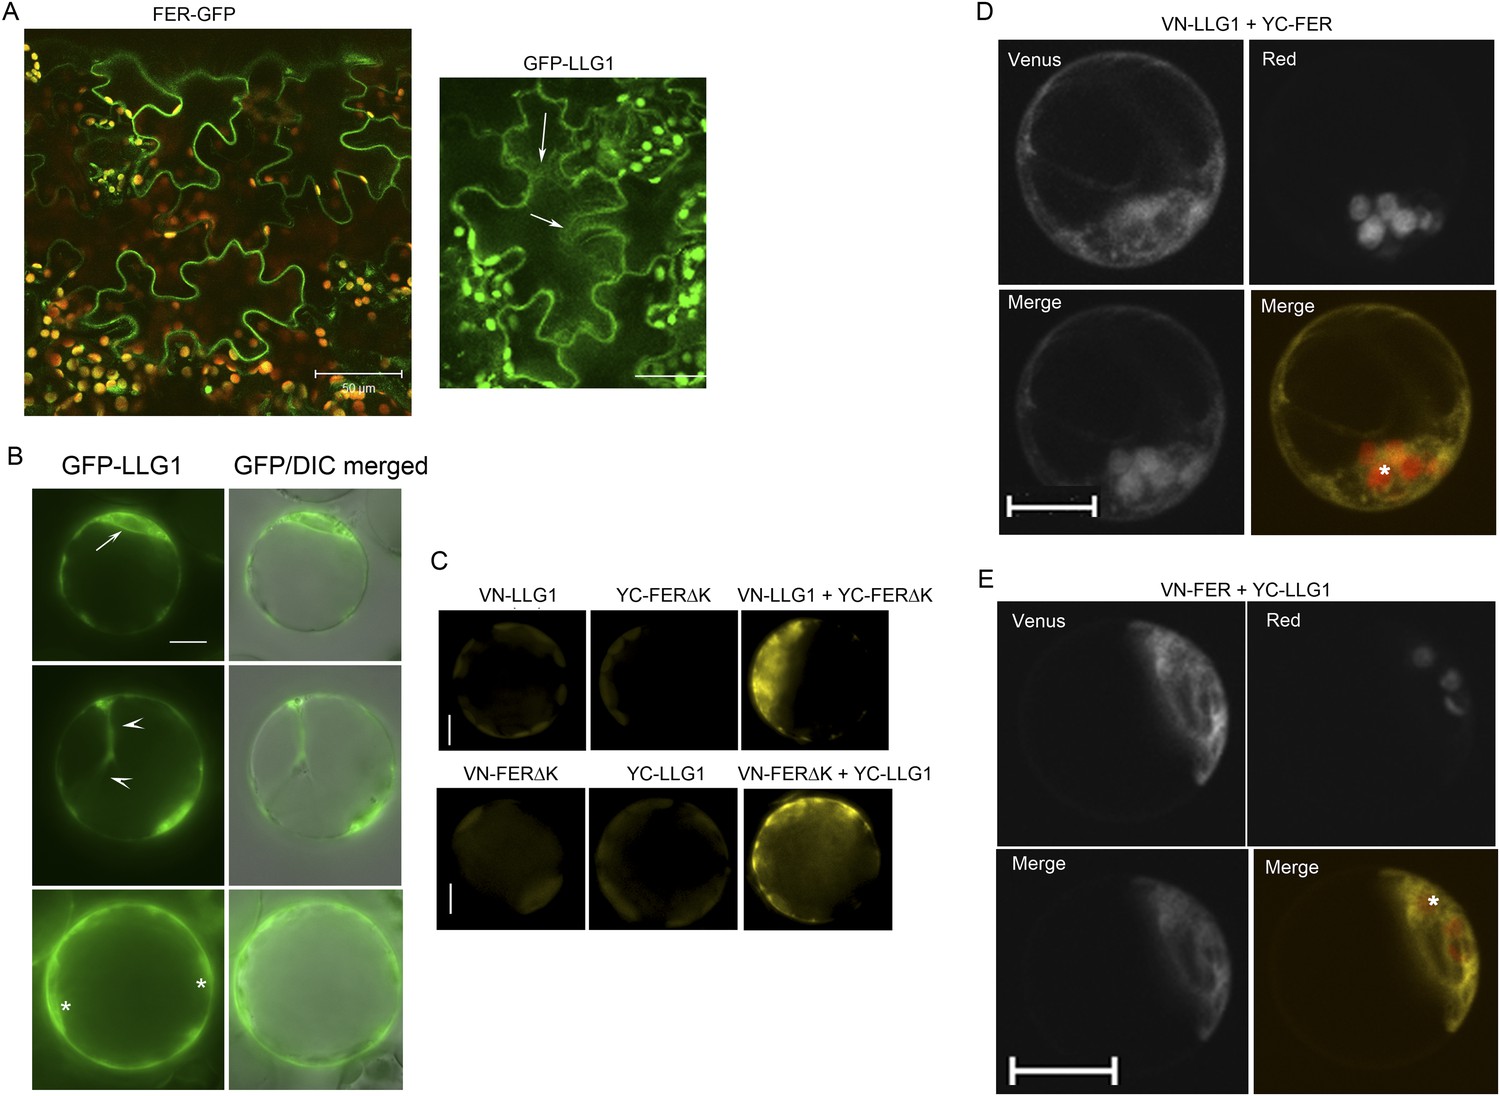
Additional controls and supportive data for BiFC studies.
(A) pFER-expressed FER-GFP and 35S-expressed GFP-LLG1 localization in agroinfiltration transformed tobacco epidermis. Some cytoplasmic GFP-LLG1 signal (arrows) was evident in these transformed cells. (B–E) Arabidopsis protoplasts. (B) 35S-expressed GFP-LLG1 showed combined cell surface and intracellular signals that were often perinuclear (arrow), in cytoplasmic strands (arrowheads), and around the cortex (*), regions typically densely occupied by ER. (C) Control (half Venus) (left and middle images) and BiFC (right image). (D, E) BiFC of LLG1 and full-length FER in protoplasts also showed strong intracellular yellow fluorescence, reminiscent of ER. The merged images were pseudo-colored (lower right) to highlight BiFC signal (yellow) and identify chloroplast (red) autofluorescence (*). (A, D, E) Confocal images; (B, C) wide-field images. Scale bar: 50 μm (A); 10 μm (all others).
Figure 10 with 2 supplements
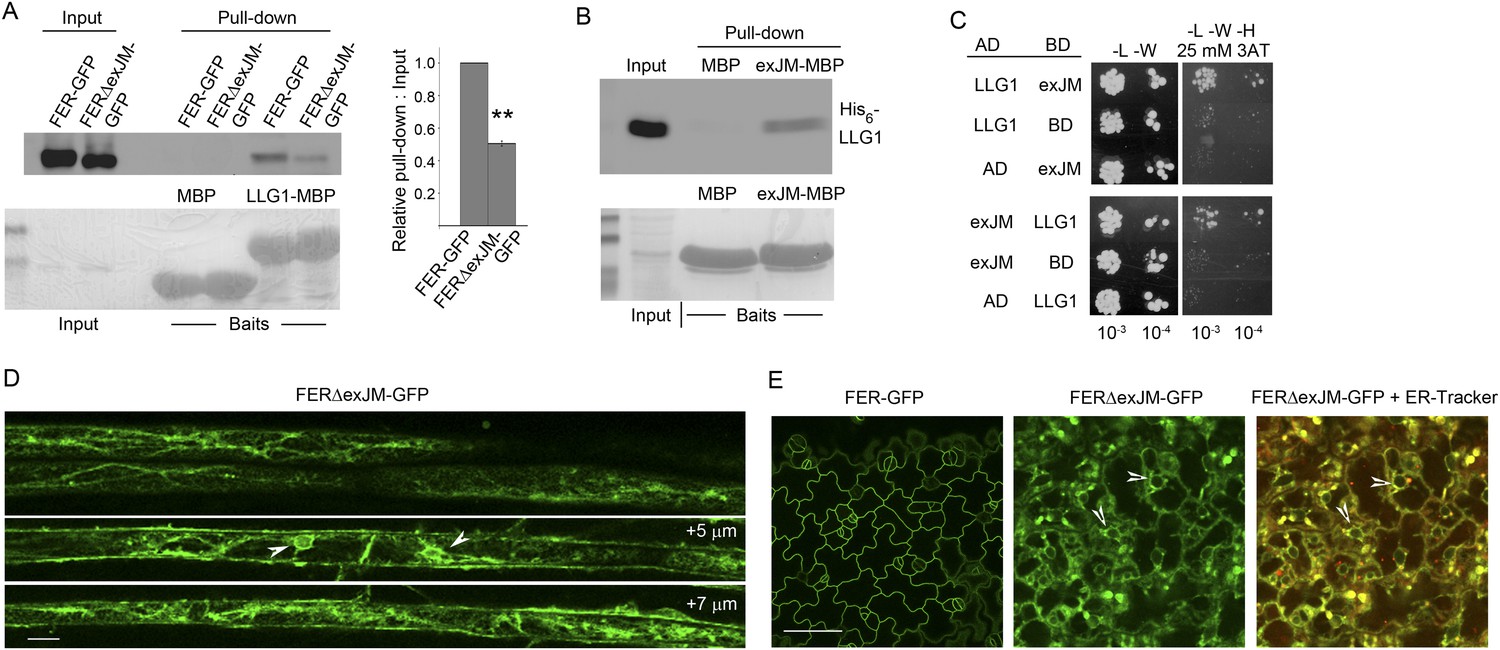
LLG1 interacts with exJM and underlies FER localization to the cell membrane.
(A) LLG1-MBP pull-down of protoplasts-expressed FER-GFP and FERΔexJM-GFP. Histogram shows relative pull-down efficiency (pull-down signal: input signal); n=3 independent experiments, pull-down efficiency for FER-GFP in each experiment was normalized to 1; **p<10−2. (B) exJM fragment pull-down of His6-tagged LLG1; both were expressed in Escherichia coli. (C) Yeast two-hybrid assays between exJM and LLG1 (amino acids 24–149, Figure 8A) on 3AT selection. Figure 10—figure supplement 1 shows β-galactosidase assays for LLG1-exJM interaction and exJM-LRE (amino acids 21–138) interaction. (D, E) FERΔexJM-GFP localization in root (D) and cotyledon epidermal cells (counter-stained by ER-Tracker Red) (E) of pFER::FERΔexJM-GFP transformed Arabidopsis seedlings (4 days old). (D) Optical sections from a Z-stack (see Figure 10—figure supplement 2A) selected to highlight the endoplasmic reticulum (ER)-reminiscent reticulate and perinuclear (arrowheads) labeling pattern; +5 μm and +7 μm indicate distances from the image shown at the top. Scale bars: 20 μm (D), 25 μm (E).
Figure 10—figure supplement 1
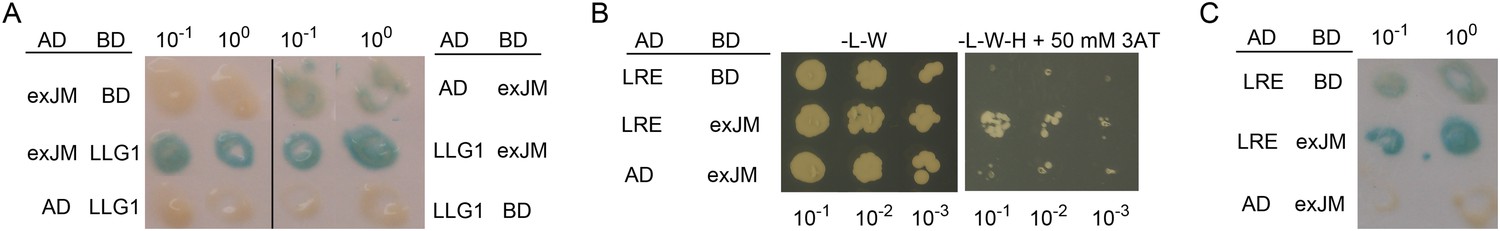
Yeast two-hybrid analysis of FERexJM-LLG1/LRE interaction.
(A) β-Galactosidase assay for LLG1-exJM interaction. (B, C) LRE (amino acids 21–138) and exJM interaction using 3AT selection (B) and β-galactosidase assays (C).
Figure 10—figure supplement 2
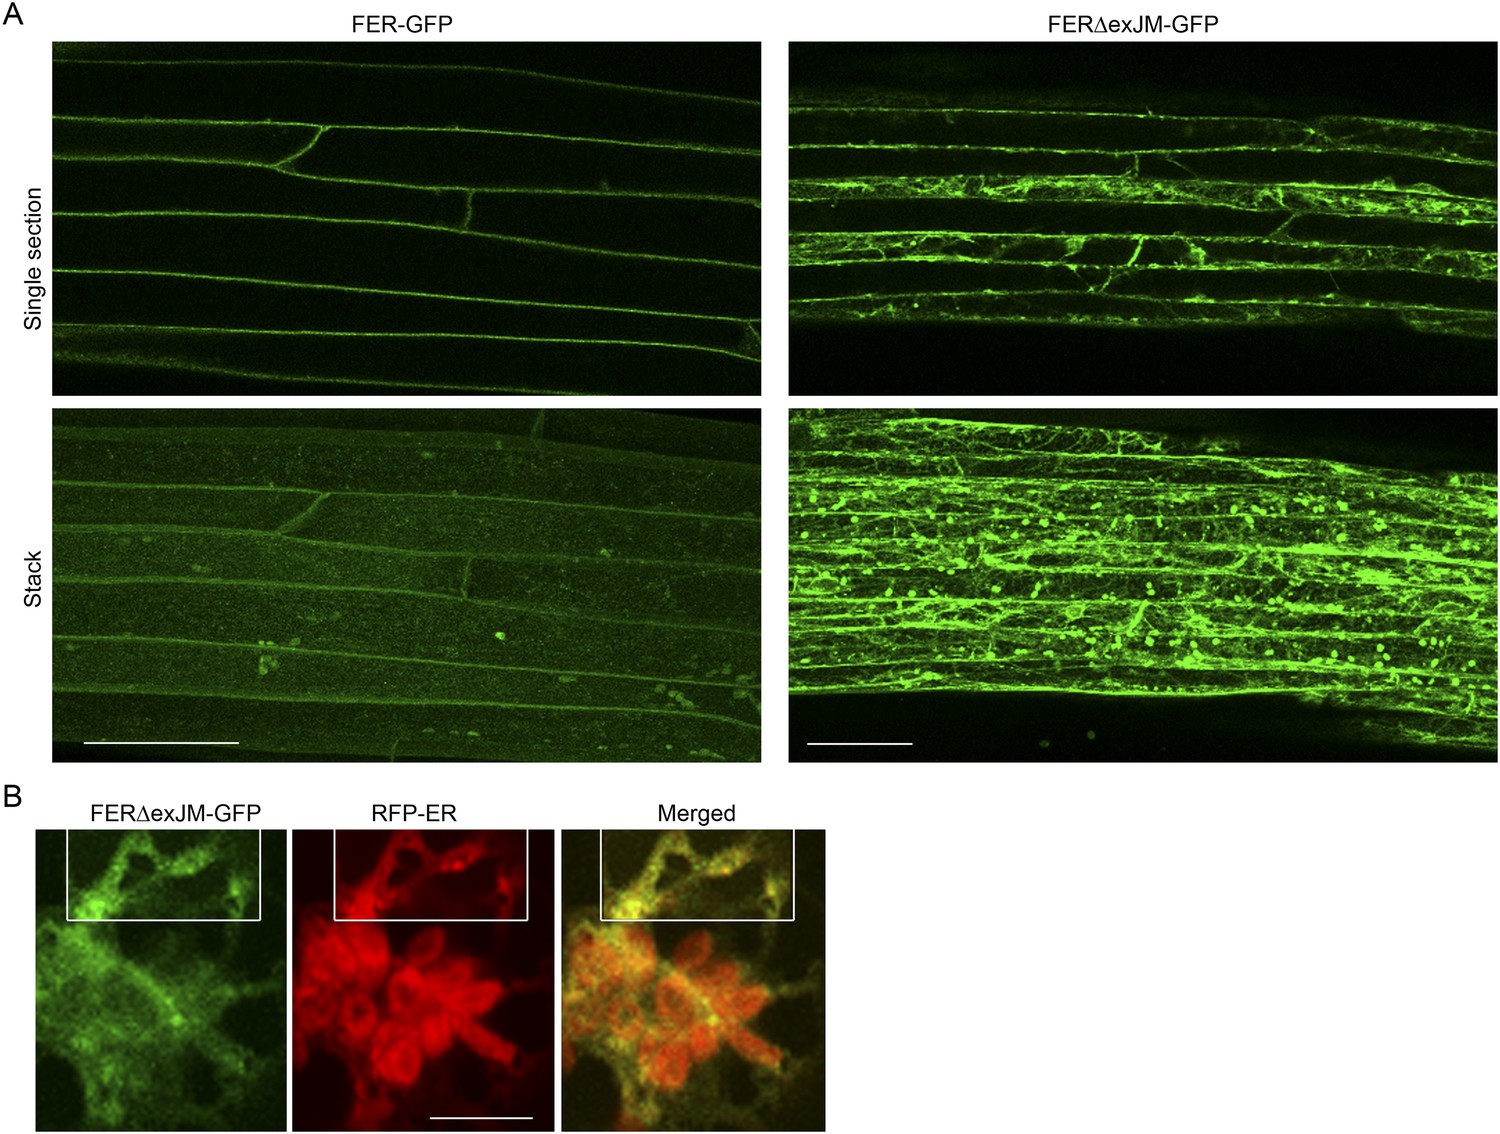
FERΔexJM-GFP localization.
(A) FER-GFP and FERΔexJM-GFP (see Figure 8A) localization in transformed Arabidopsis roots (4-day-old seedlings). Single optical sections (upper panel) and maximum projection of the entire Z-stacks (lower panel) of typical signal patterns for the wild type and exJM-deleted FER-GFP. (B) Colocalization of FERΔexJM-GFP and RFP-ER in transiently co-transformed protoplasts. Boxed regions are contrast-enhanced equally to highlight the colocalization signal. Scale bar: 50 μm.
Figure 11

A model for FER-LLG1/LRE interaction and mediated RAC/ROP signaling.
FER-LLG1/LRE are shown interacting in the endoplasmic reticulum (ER) and on the cell membrane where they exist as components of a RAC/ROP signaling complex. FER-ROPGEF (Duan et al., 2010) and ROPGEF-RAC/ROP (Berken et al., 2005) interactions were previously established. RAC/ROPs pull-down FER (Duan et al., 2010), LRE, and LLG1 (Figure 5A) in a GDP-dependent manner. Upon signal activation, activated GTP-bound RAC/ROPs target effectors, such as NADPH oxidase (Wong et al., 2007) (Figure 5B), to mediate downstream processes, including ROS-mediated polarized root hair growth and pollen tube rupture (Duan et al., 2010, 2014). FER-LLG1 interaction in the ER and FER dependence on LLG1 and LRE to localize to the cell membrane suggest co-delivery of FER-LLG1/LRE complex to the cell membrane. ROS, reactive oxygen species.
Author response image 1
Videos
Video 1
Time series showing the dynamics of intracellular LLG1-FERΔK BiFC signal, typical of the endoplasmic reticulum (ER), in the protoplast shown in Figure 9C, lower, which was co-transformed by the split Venus pair and ARF1(Q71L) as indicated on the figure.
Time series shows 89 images in about real-time.
Video 2
Time series showing the dynamics of intracellular LLG1-FERΔK BiFC signal in a protoplast that co-transformed by the split Venus pair and ARF1(Q71L) in which the ER-reticulate structure is apparent.
Time series shows 200 images, about 3× accelerated from acquisition time.
Additional files
-
Supplementary file 1
A list of gene constructs.
- https://doi.org/10.7554/eLife.06587.029
Download links
A two-part list of links to download the article, or parts of the article, in various formats.
Downloads (link to download the article as PDF)
Open citations (links to open the citations from this article in various online reference manager services)
Cite this article (links to download the citations from this article in formats compatible with various reference manager tools)
Glycosylphosphatidylinositol-anchored proteins as chaperones and co-receptors for FERONIA receptor kinase signaling in Arabidopsis
eLife 4:e06587.
https://doi.org/10.7554/eLife.06587


