Seasonal shift in timing of vernalization as an adaptation to extreme winter
- John Innes Centre, United Kingdom
- Mid Sweden University, Sweden
- University of East Anglia, United Kingdom
Figures
Figure 1 with 2 supplements
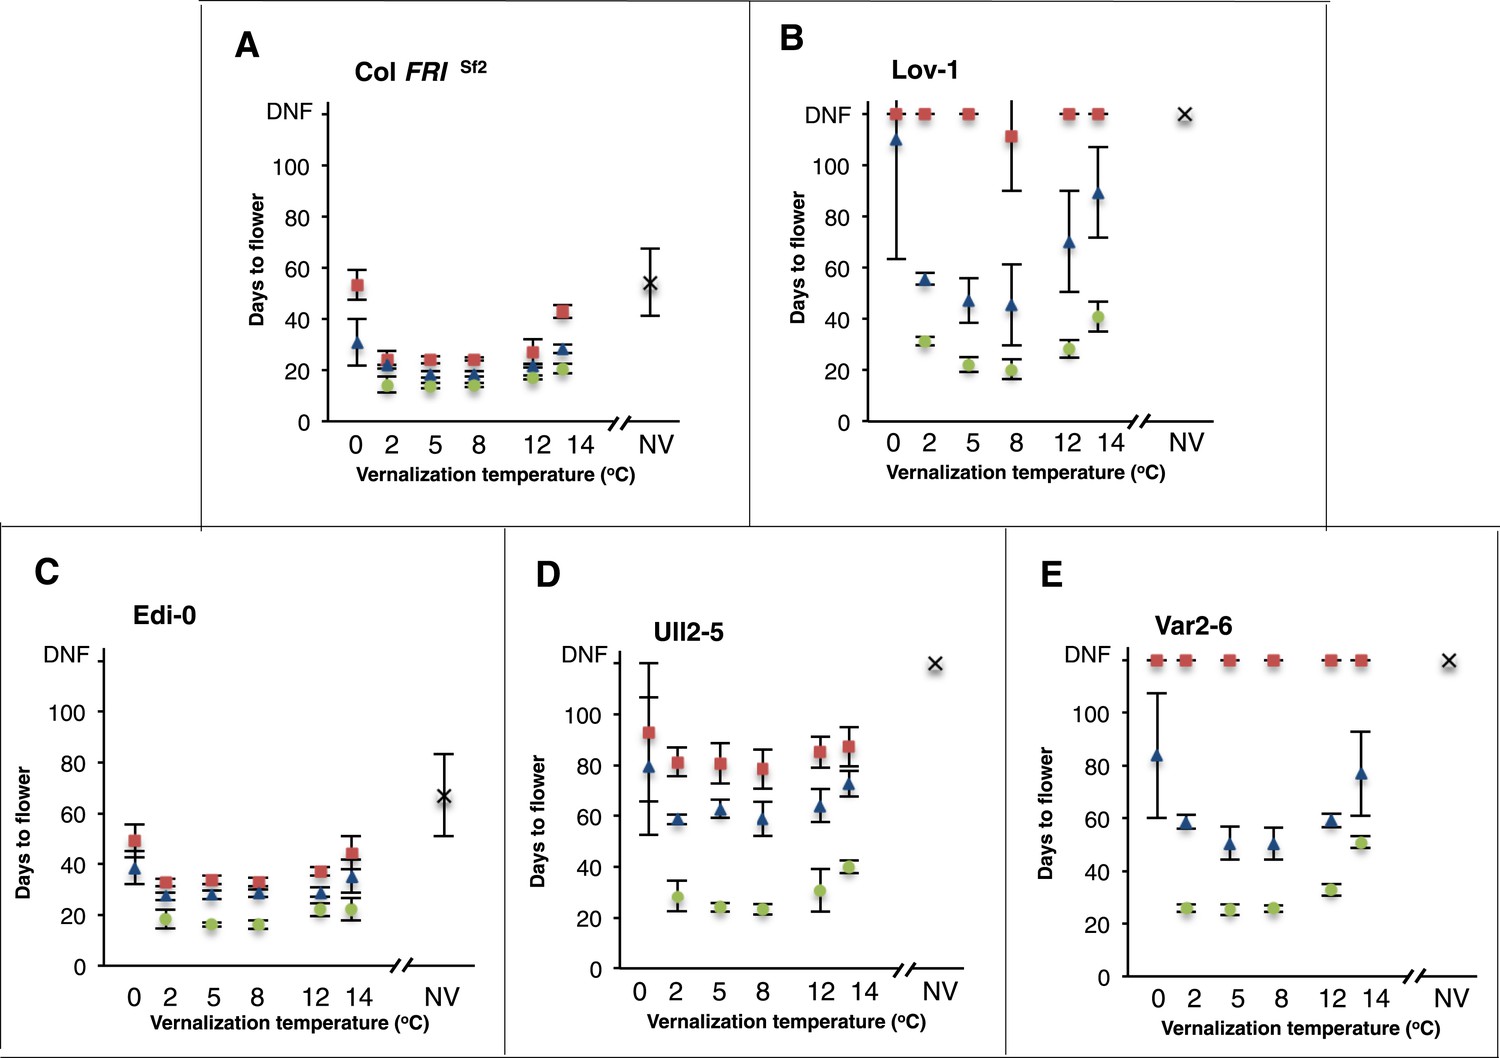
Vernalization responses at a range of constant temperatures.
Days to flower were recorded for five genotypes after 0 (crosses), 4 (red squares), 6 (blue triangles) and 12 (green circles) weeks vernalization at a range of temperatures, n ≥ 10. NV = non-vernalized. Error bars = ±S.D.
Figure 1—figure supplement 1
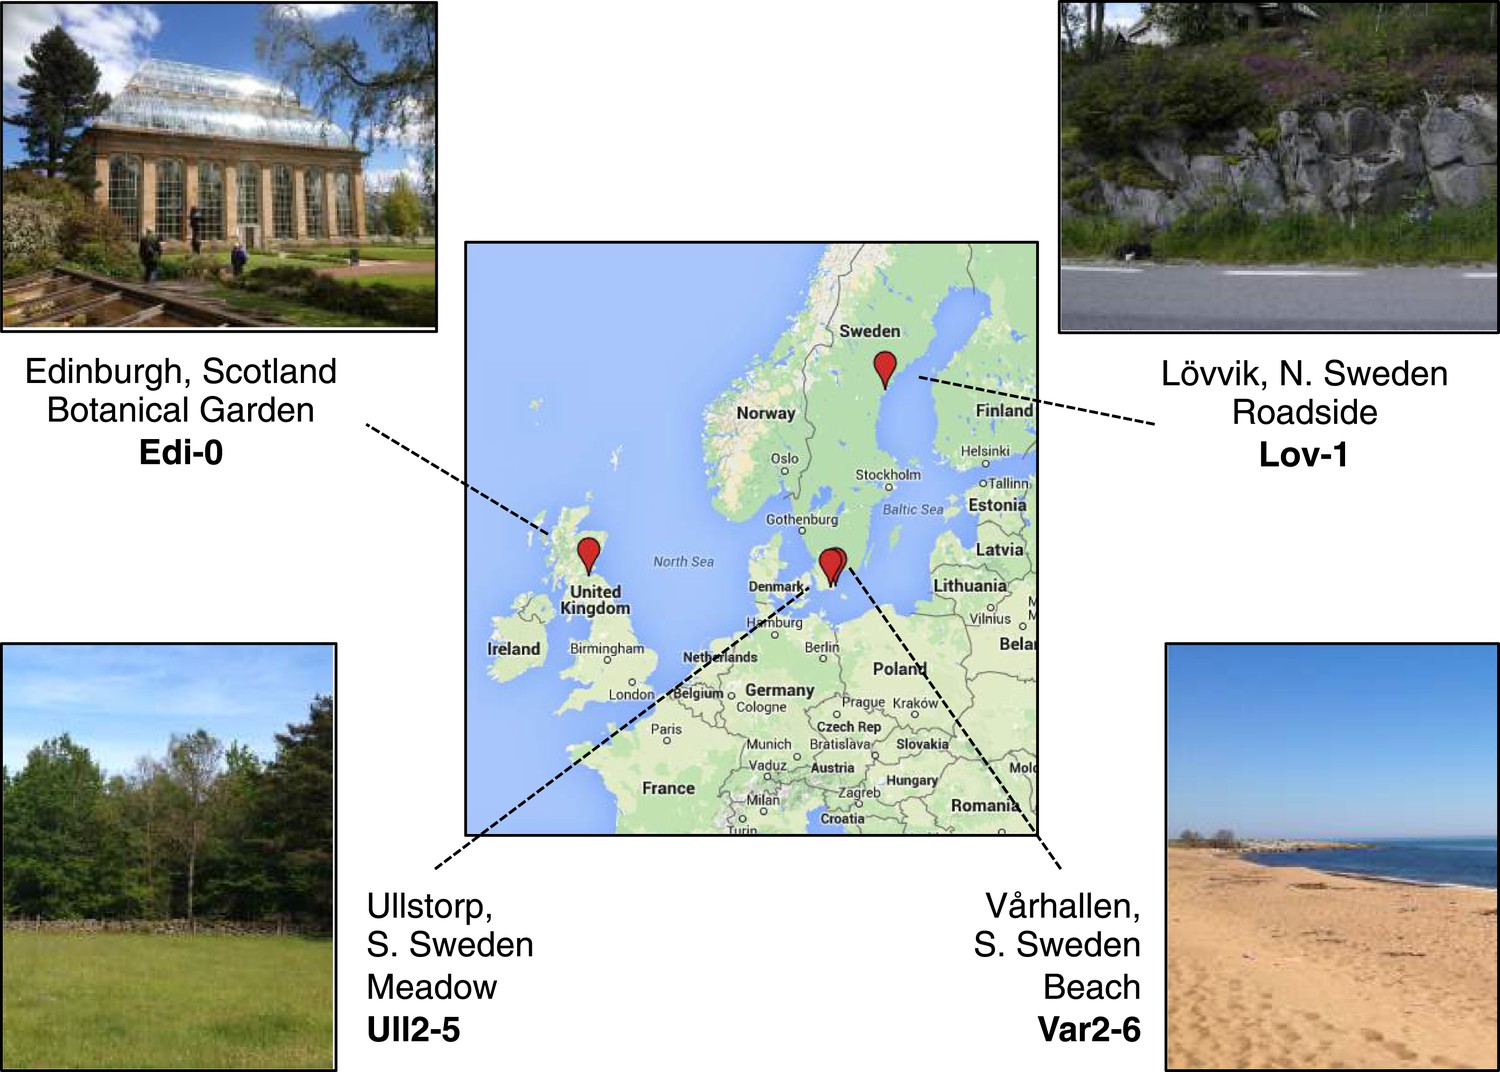
Map showing accession collection sites.
Image generated using Google Maps (GeoBasis-DE/BKG 2009).
Figure 1—figure supplement 2
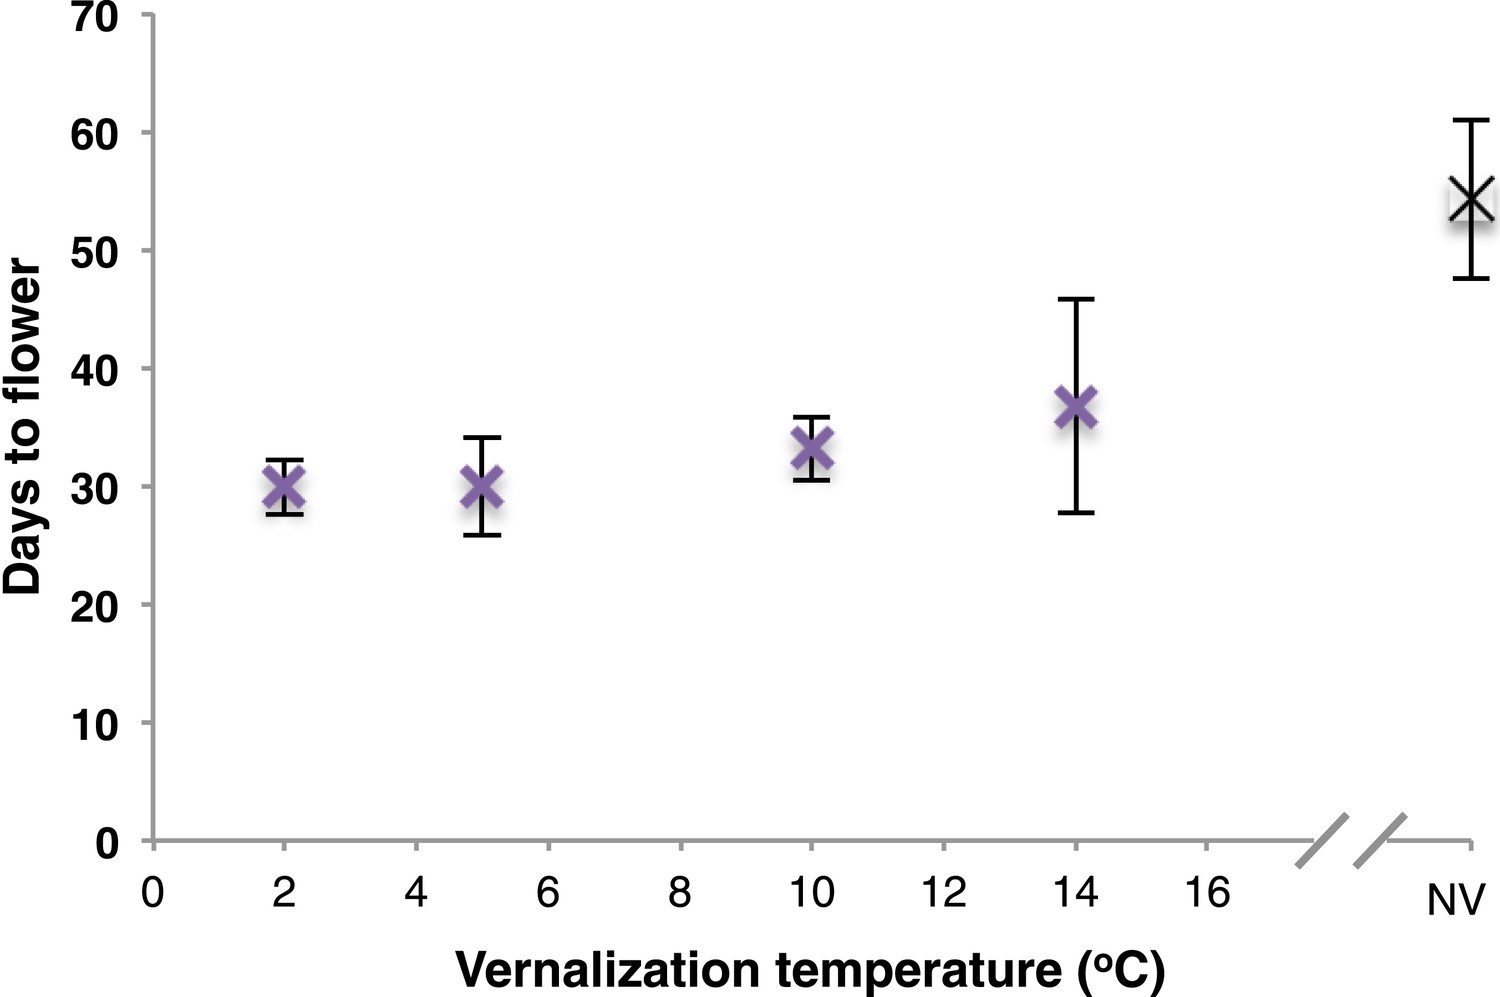
2 week vernalization of Col FRISf2 does not reveal differential response to 2 and 5°C treatments.
Days to flowering recorded after 2 weeks vernalization at a range of temperatures. n = 12. NV = nonvernalized. Error bars = ±S.D.
Figure 2 with 1 supplement
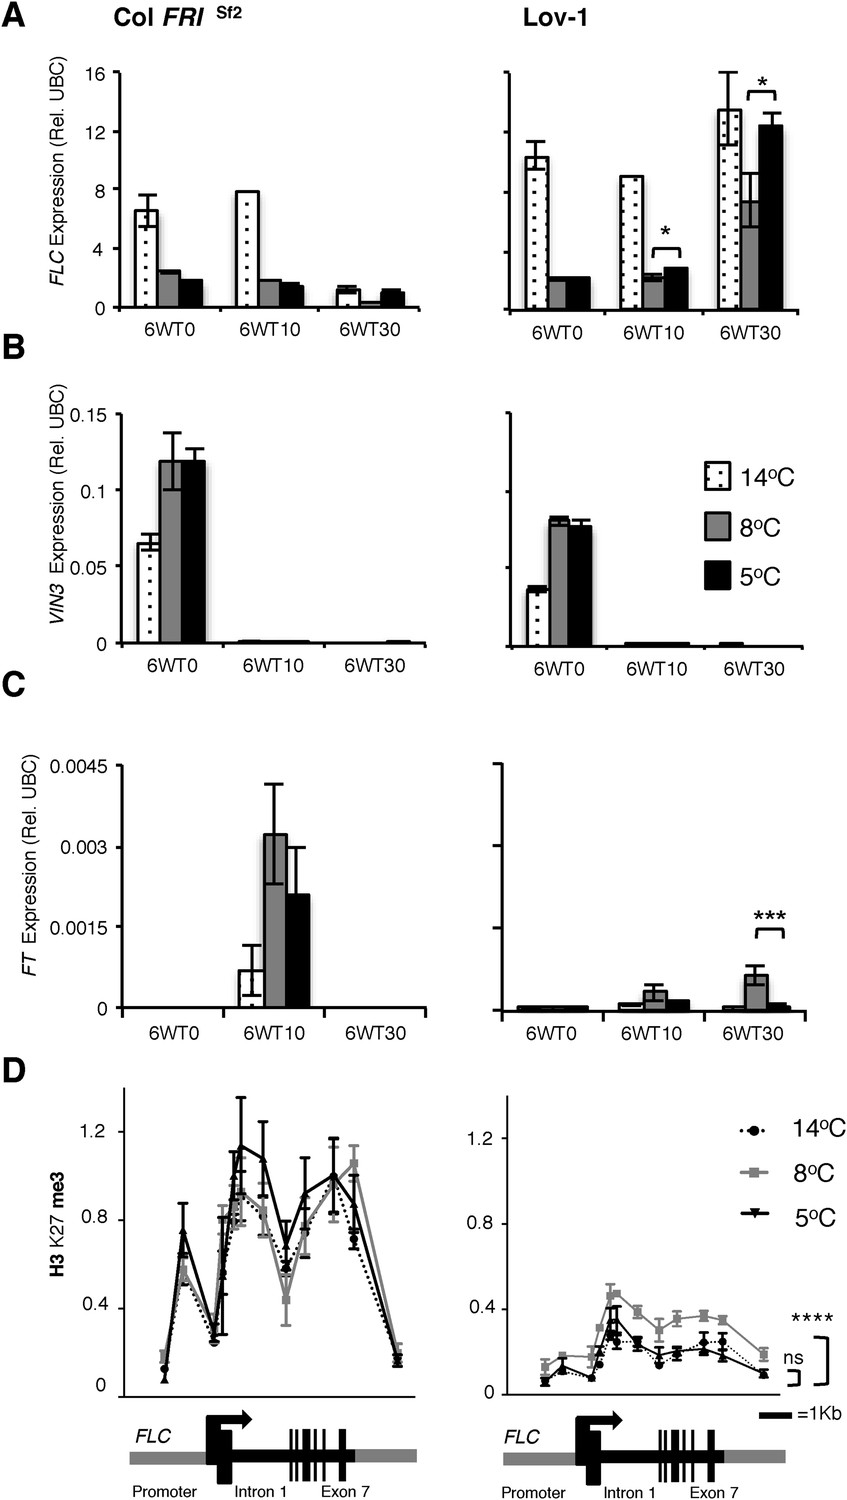
Quantitative PCR and ChIP analyses of plants vernalized at 5°C, 8°C and 14°C.
Changes in FLC (A), VIN3 (B) and (C) FT expression were determined directly after 6 weeks of cold exposure (T0) and again after 10 (T10) and 30 (T30) days subsequent growth at 20°C. Two-tailed Student's t-test results: *p < 0.05, ***p < 0.005. n = 3. Error bars = ±S.D. (D) H3K27me3 levels over the FLC locus were higher for Lov-1 after 6 weeks vernalization at 8°C than 14°C or 5°C (samples were harvested 30 days post cold). **** p < 0.0001, Wilcoxon matched-pairs signed rank test on measurements for 12 primer pairs. Error bars = ±S.E.M. NV = nonvernalized, DNF = did not flower and ns = not significant.
-
Figure 2—source data 1
Primers used for qPCR ChIP.
- https://doi.org/10.7554/eLife.06620.007
Figure 2—figure supplement 1
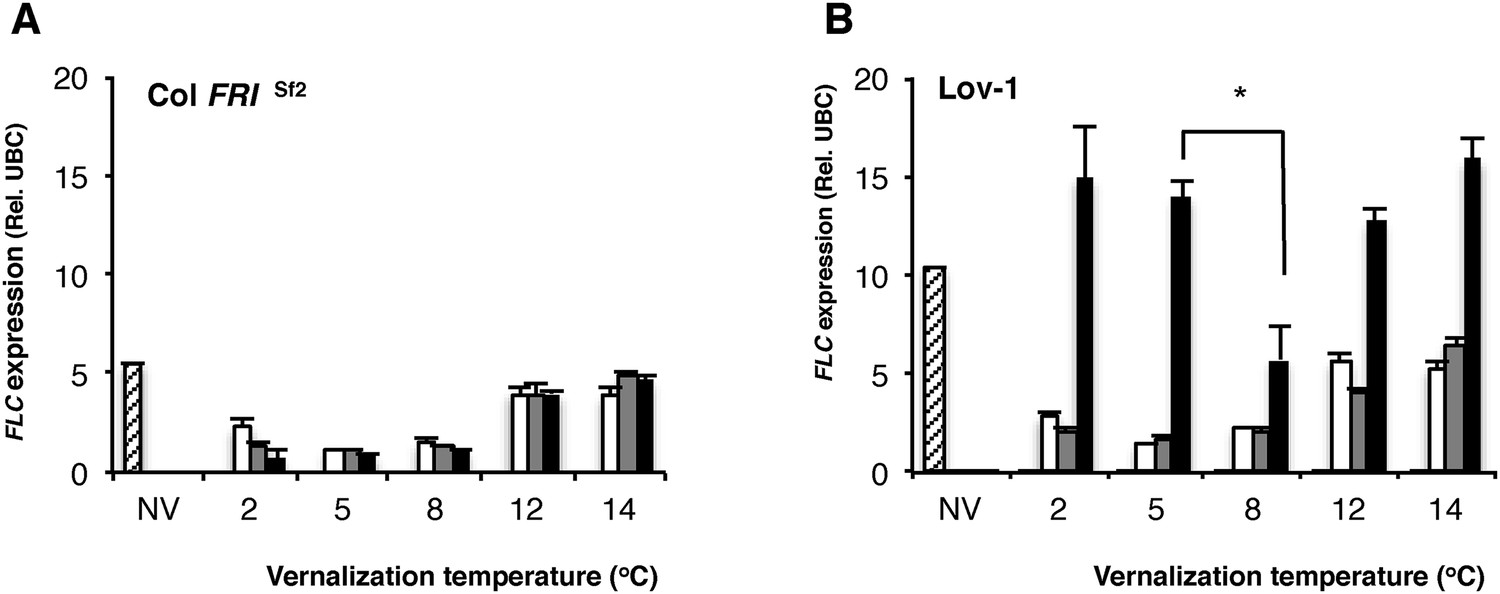
FLC expression determined after 4 weeks of vernalization at a range of temperatures.
Quantitative PCR (qRT-PCR) analysis showing FLC expression levels before cold (hatched), after 4 weeks vernalization (white) and after 10 days (grey) and 30 days (black) subsequent growth at 20°C. *p = 0.0038 two-tailed Student's t-test. n = 3. NV = non-vernalized.
Figure 3 with 7 supplements

Field experiments reveal vernalization occurs in autumn in northern Sweden.
(A) Date of sowing and plant transfers to the greenhouse are shown with hourly soil surface temperatures recorded during autumn 2011. (B) Days to flower recorded after plants were transferred to a warmed greenhouse at three time points during autumn: Transfer 1 (black), Transfer 2 (grey) and Transfer 3 (white). n ≥ 10. Error bars = ±S.D.
-
Figure 3—source data 1
Developmental stage of natural Arabidopsis thaliana populations in spring in the High Coast area of N. Sweden (62.5°N).
- https://doi.org/10.7554/eLife.06620.010
Figure 3—figure supplement 1
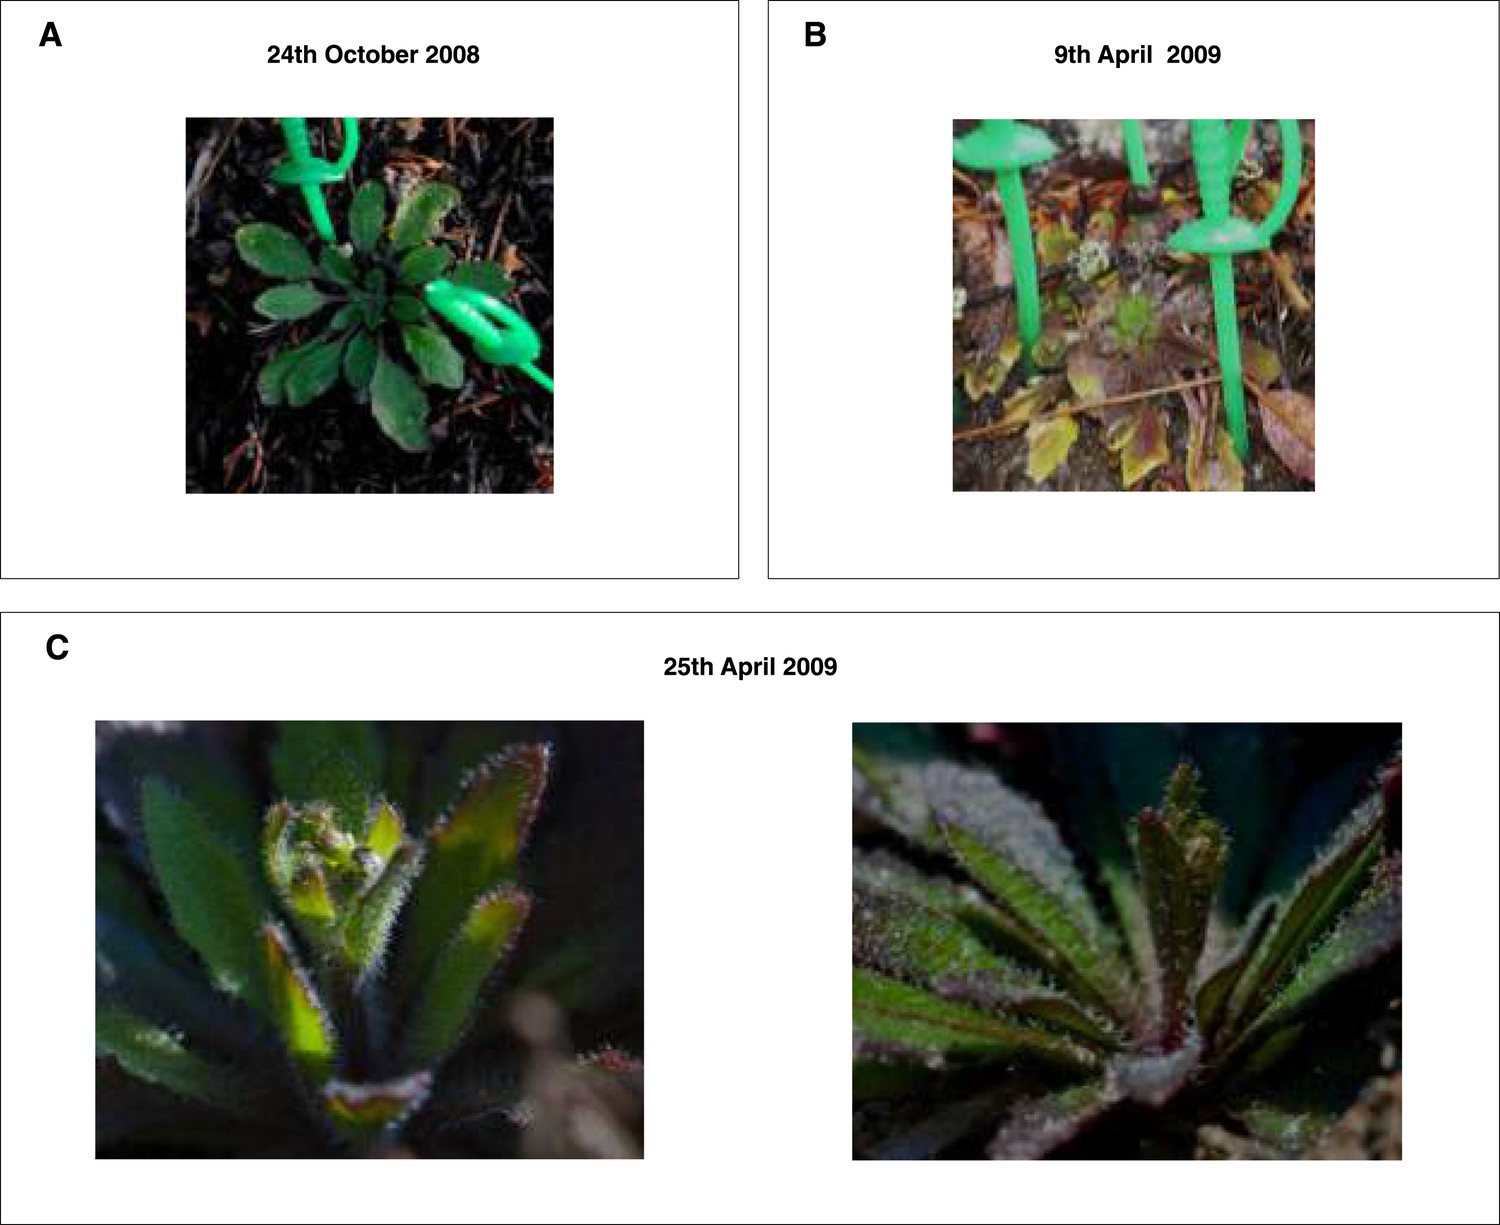
The Lov-1 natural population flowers rapidly after snowmelt in spring.
Photographs of representative Lov-1 rosettes taken (A) before snow cover and (B) immediately after snowmelt (green markers indicate rosette size). (C) Evidence of stem elongation was apparent 16 days post snowmelt.
Figure 3—figure supplement 2
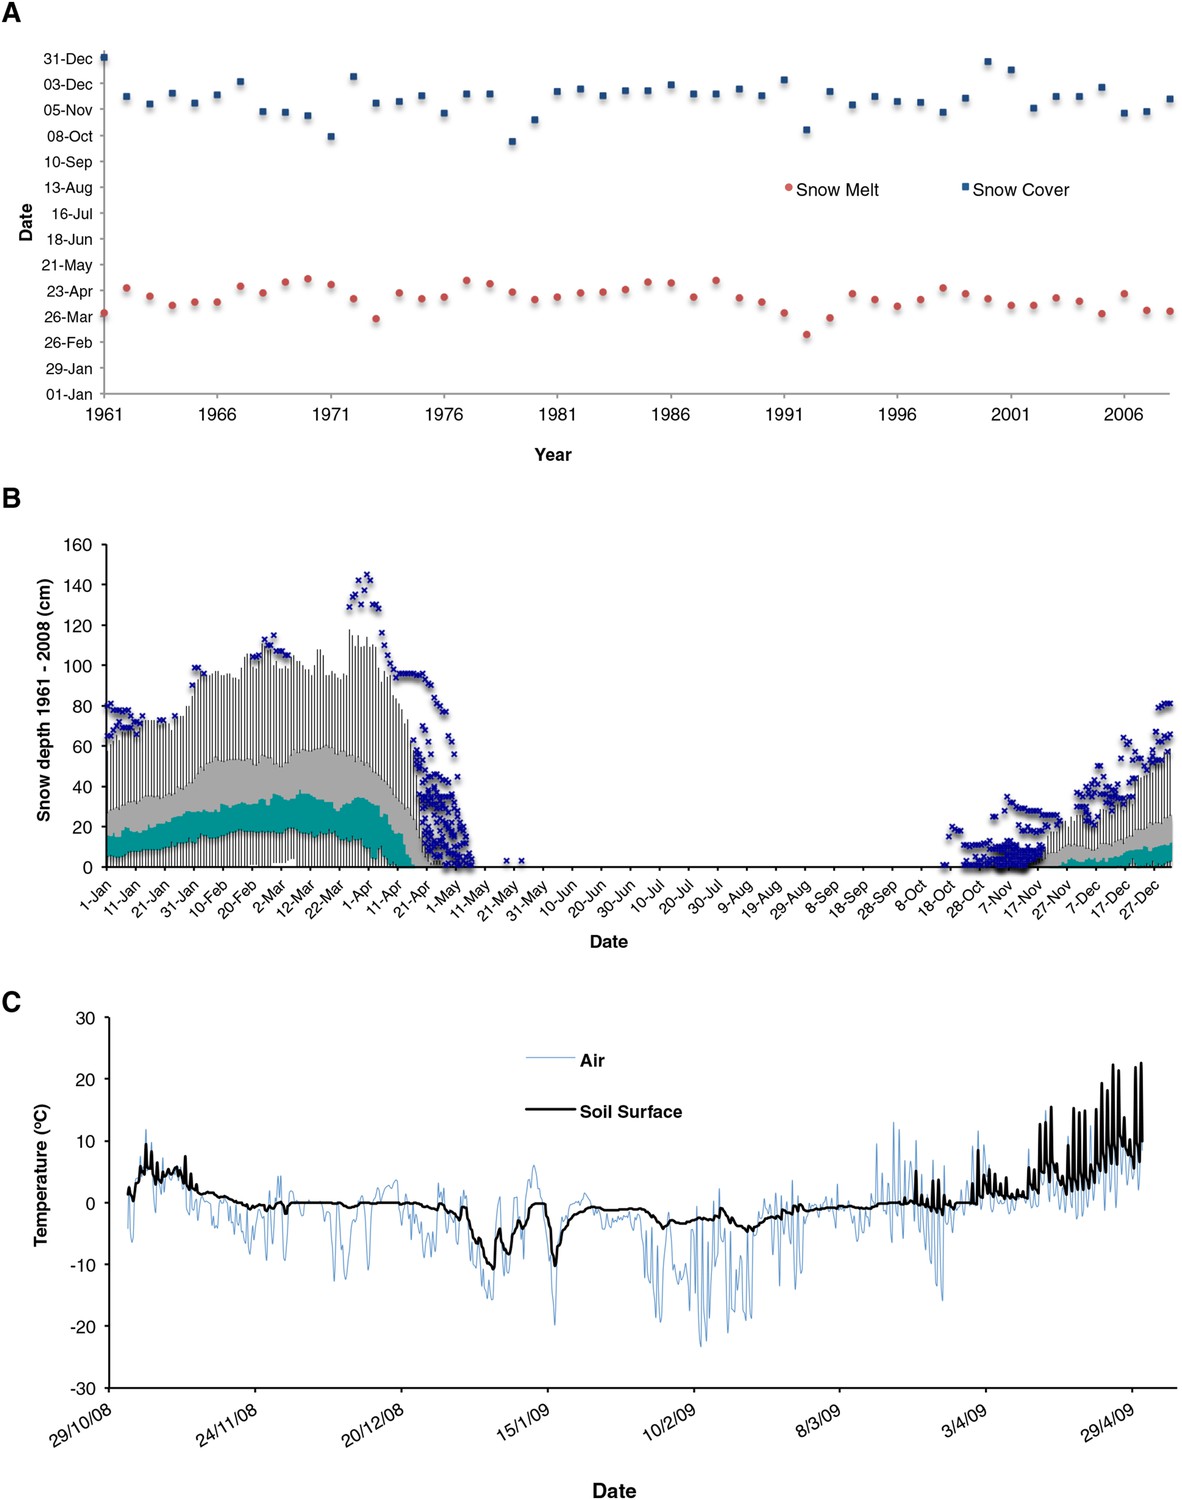
Snow consistently covers and protects plants from subzero air temperatures during winter.
(A) Snow cover and melt dates recorded over 47 years. (B) Box plots of average snow depth recorded through the year. (C) Air and soil temperatures recorded simultaneously during winter 2008/2009. Green and grey boxes = median to 1st and 3rd quartile, respectively. Upper and lower whiskers represent 1.5* interquartile range (IQR) or highest/lowest values. Blue crosses = outlier values greater than 1.5*IQR. Blue crosses = outlier values.
Figure 3—figure supplement 3
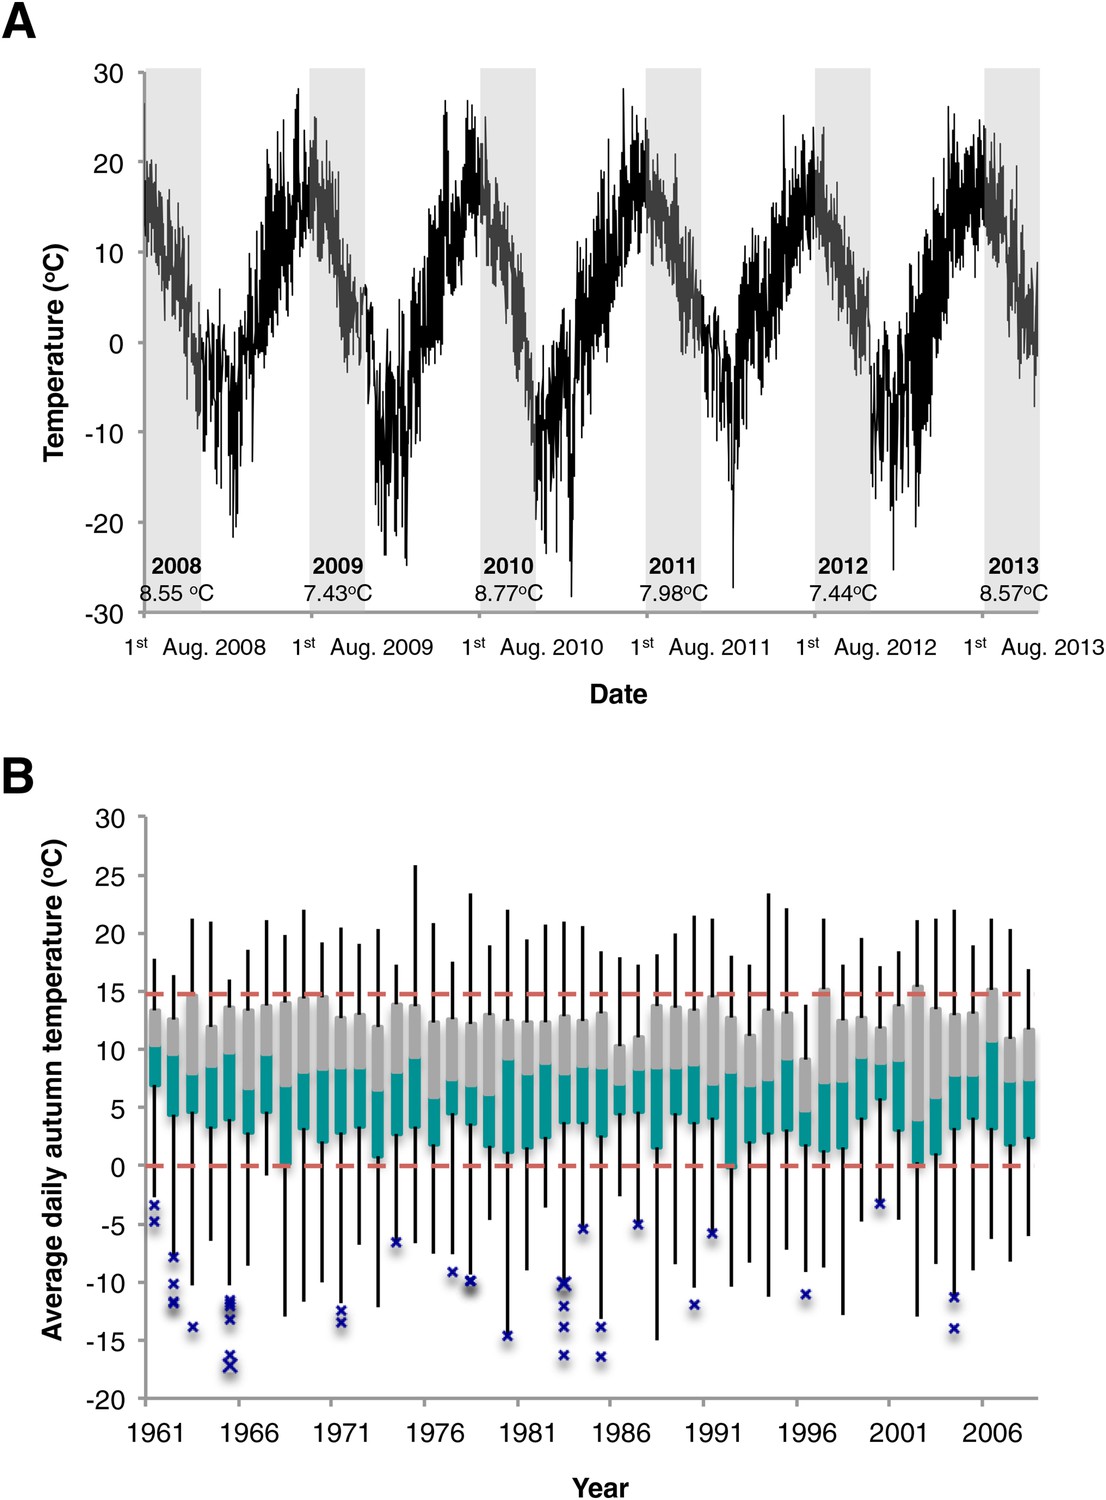
Temperature records from N. Sweden near Lövvik.
(A) Hourly air temperature collected between 2008 and 2013. Grey shading highlights the temperatures used to calculate the mean values shown for five consecutive Lov-1 autumn growing seasons. (B) Box plots of mean average daily temperatures recorded during autumn (1st August—30th November) over 47 years. Dashed red lines indicate 0°C and 15°C—the upper and lower temperature thresholds identified for Lov-1 vernalization. Green and grey boxes = median to 1st and 3rd quartiles, respectively. Upper and lower whiskers represent 1.5* IQR or highest/lowest values. Blue crosses = outlier values greater than 1.5*IQR.
Figure 3—figure supplement 4
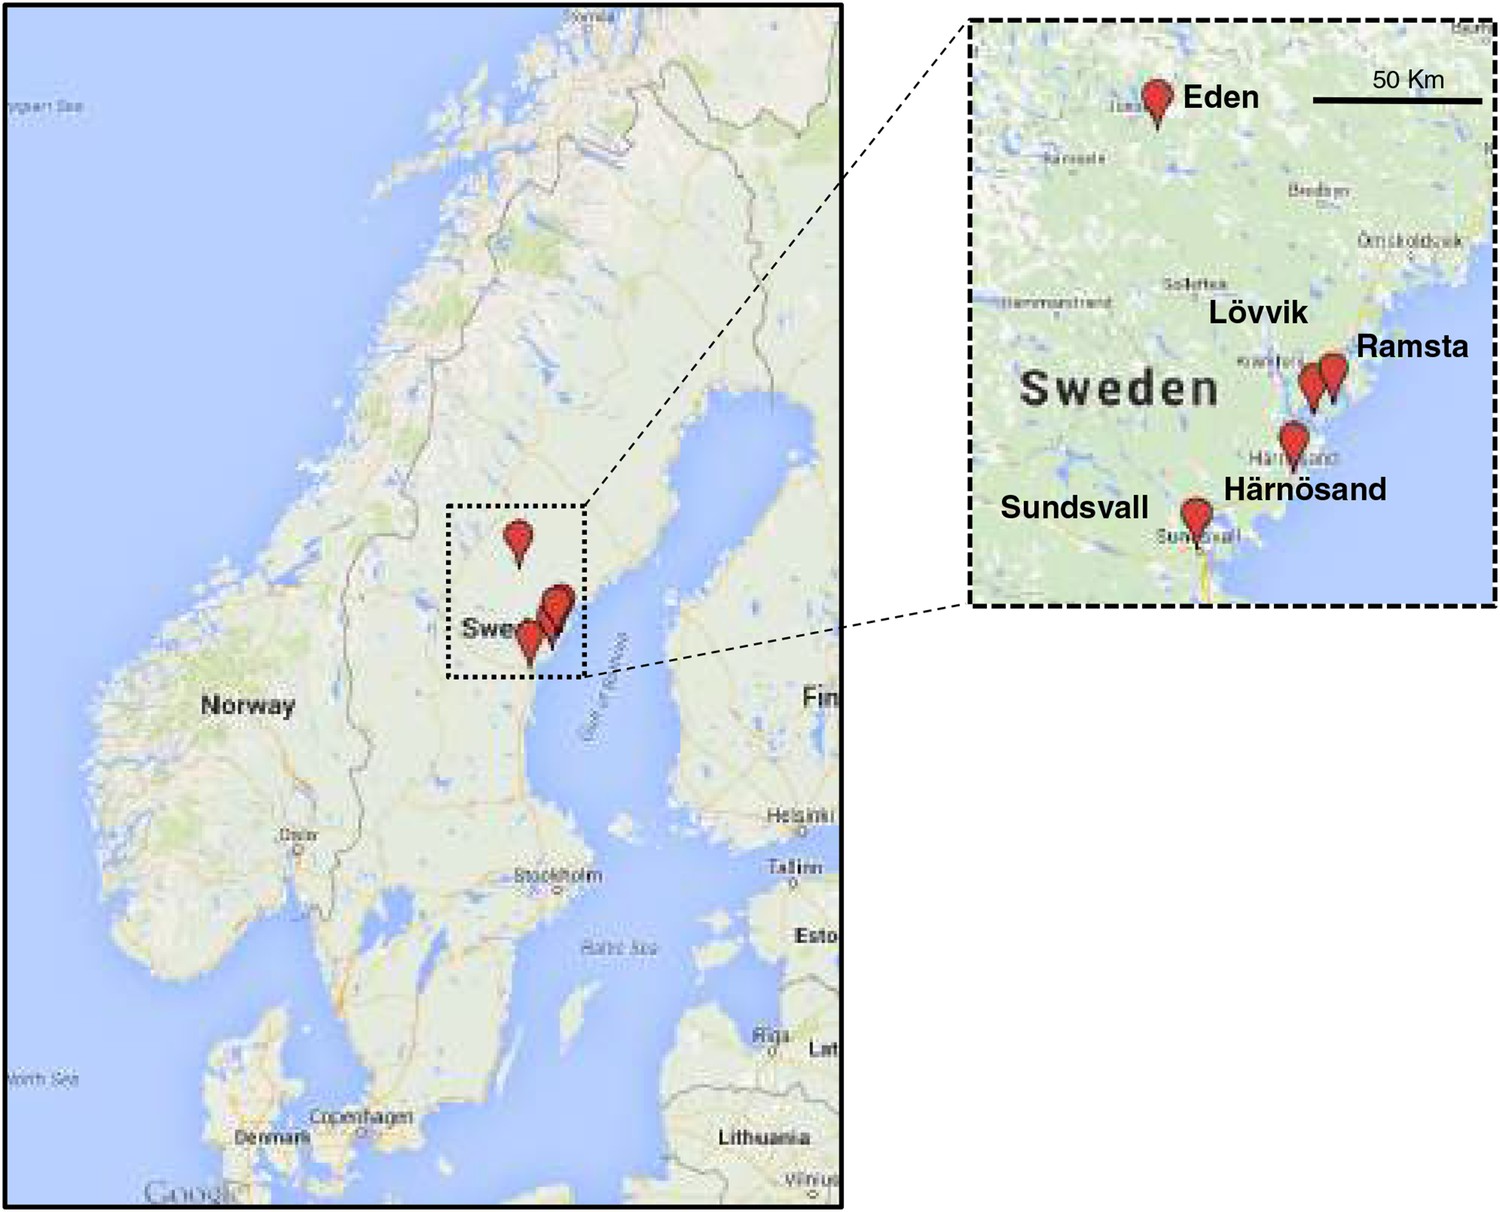
Field locations and climate data collection sites in Sweden.
Hourly temperature data were collected in Eden. Swedish climate data were provided by Swedish Hydrological and Meteorological Institute weather stations located in Härnösand. Plants for the 2011 and 2012 field experiments were germinated in Sundsvall and transferred to Ramsta. (Map courtesy of Google, GeoBasics-DE/BKG 2009.)
Figure 3—figure supplement 5
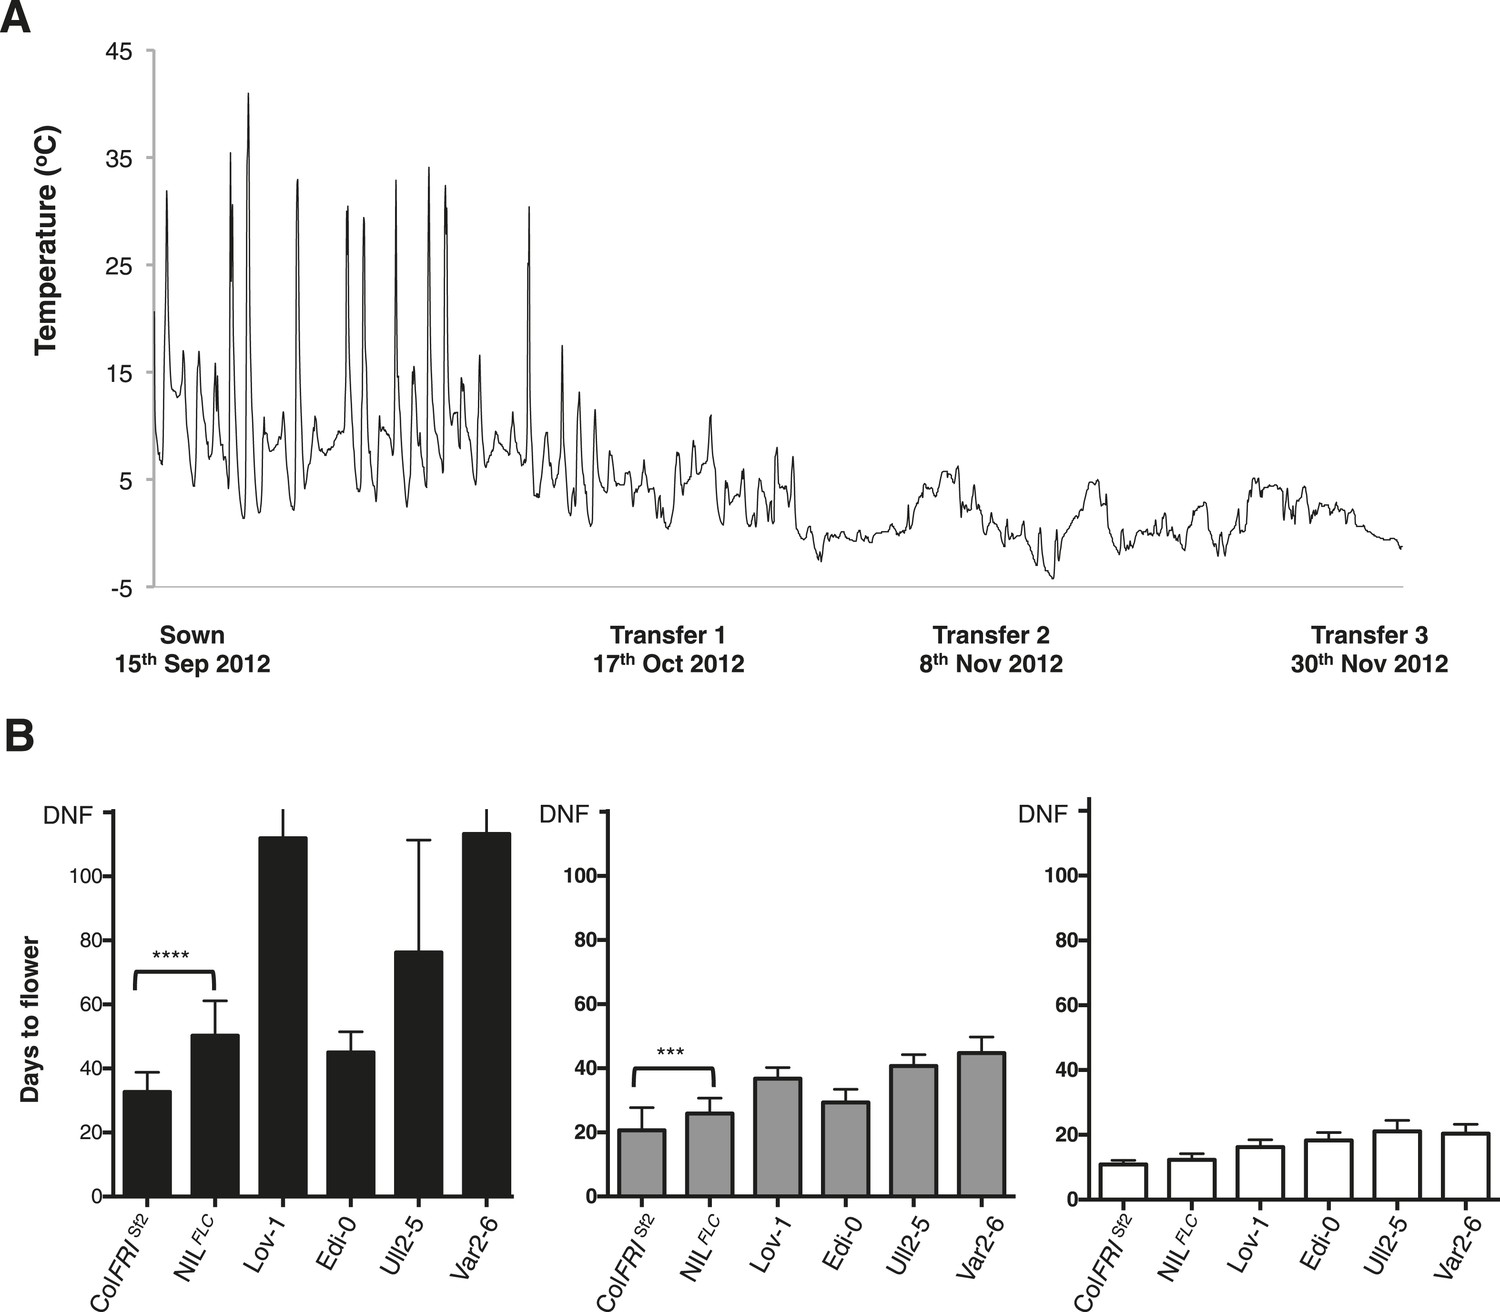
Sweden field experiments results 2012.
(A) Date of sowing and plant transfers to the greenhouse are shown with hourly soil surface temperatures recorded during autumn 2012. (B) Days to flower recorded after plants were transferred to a warmed greenhouse at three time points during autumn: Transfer 1 (black), Transfer 2 (grey) and Transfer 3 (white). n ≥ 10. Error bars represent ±S.D. Mann–Whitney U test results: ****p < 0.0001 (U value: 10.50), ***p = 0.0009 (U value: 34). DNF = did not flower.
Figure 3—figure supplement 6
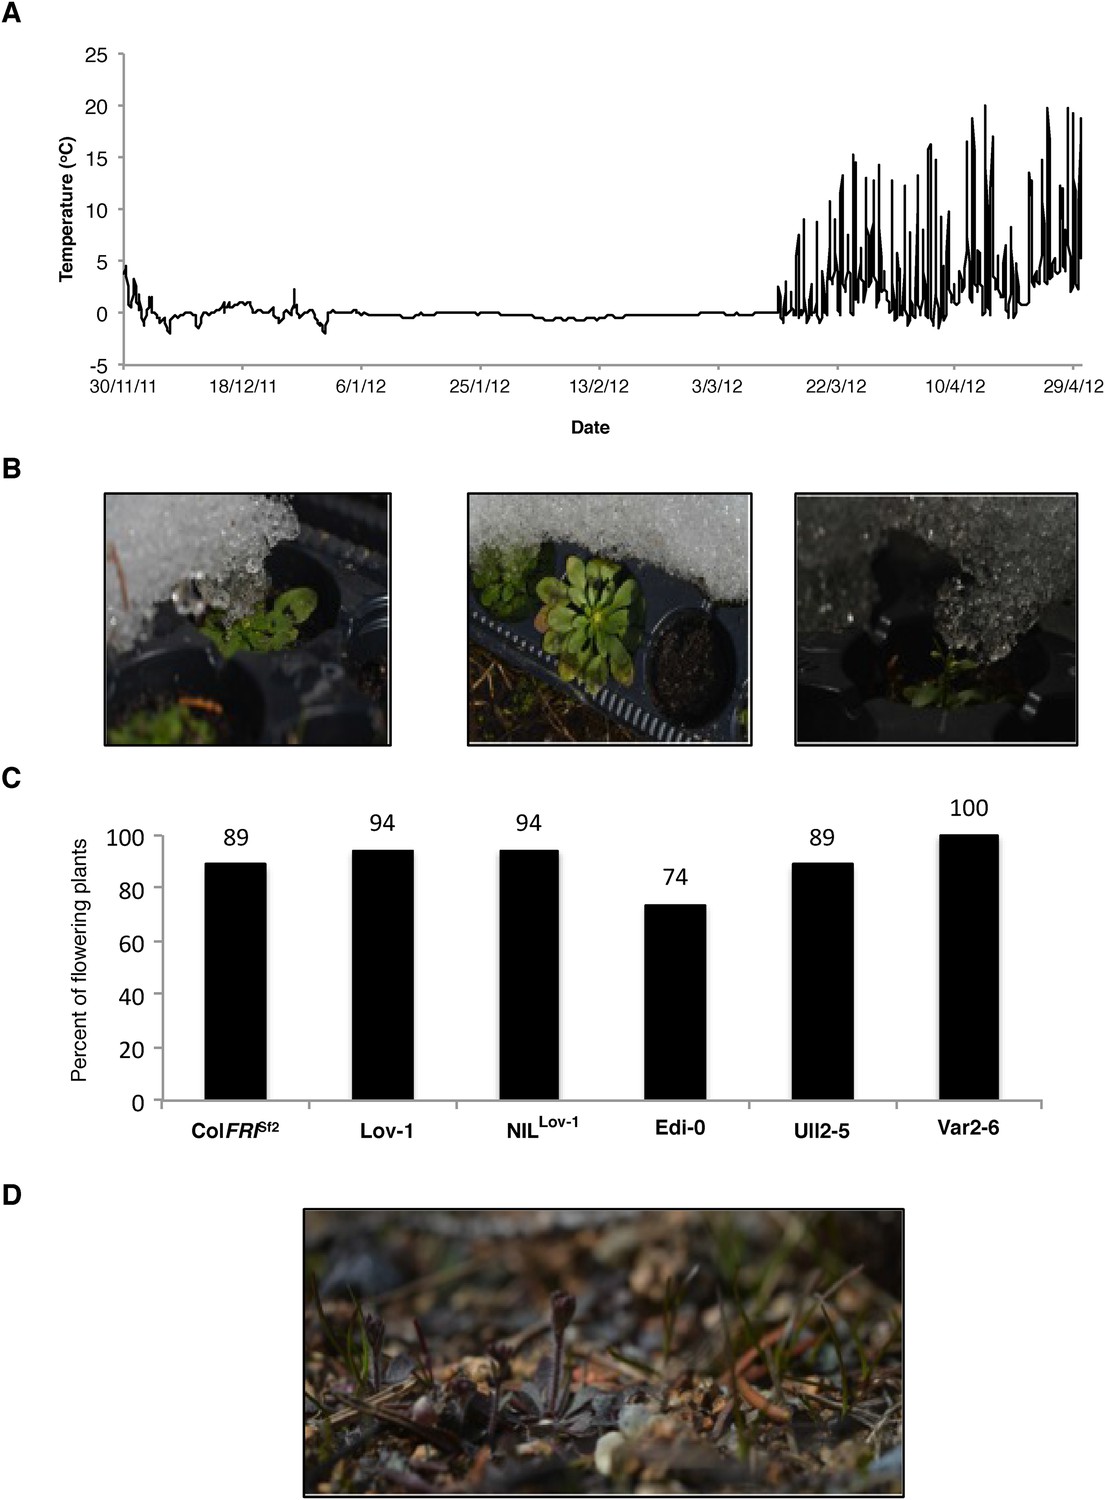
Plants flowered synchronously with natural populations after 5 months of continuous snow cover.
(A) Surface temperature recorded at Ramsta indicating that overwintered plants were continuously covered by snow during winter 2012. (B) Representative images of the overwintered cohort with floral buds visible. (C) Percentage plants with visible buds on 26th April 2013, 5 days after snowmelt and (D) Image of natural population taken 26th April 2013.
Figure 3—figure supplement 7
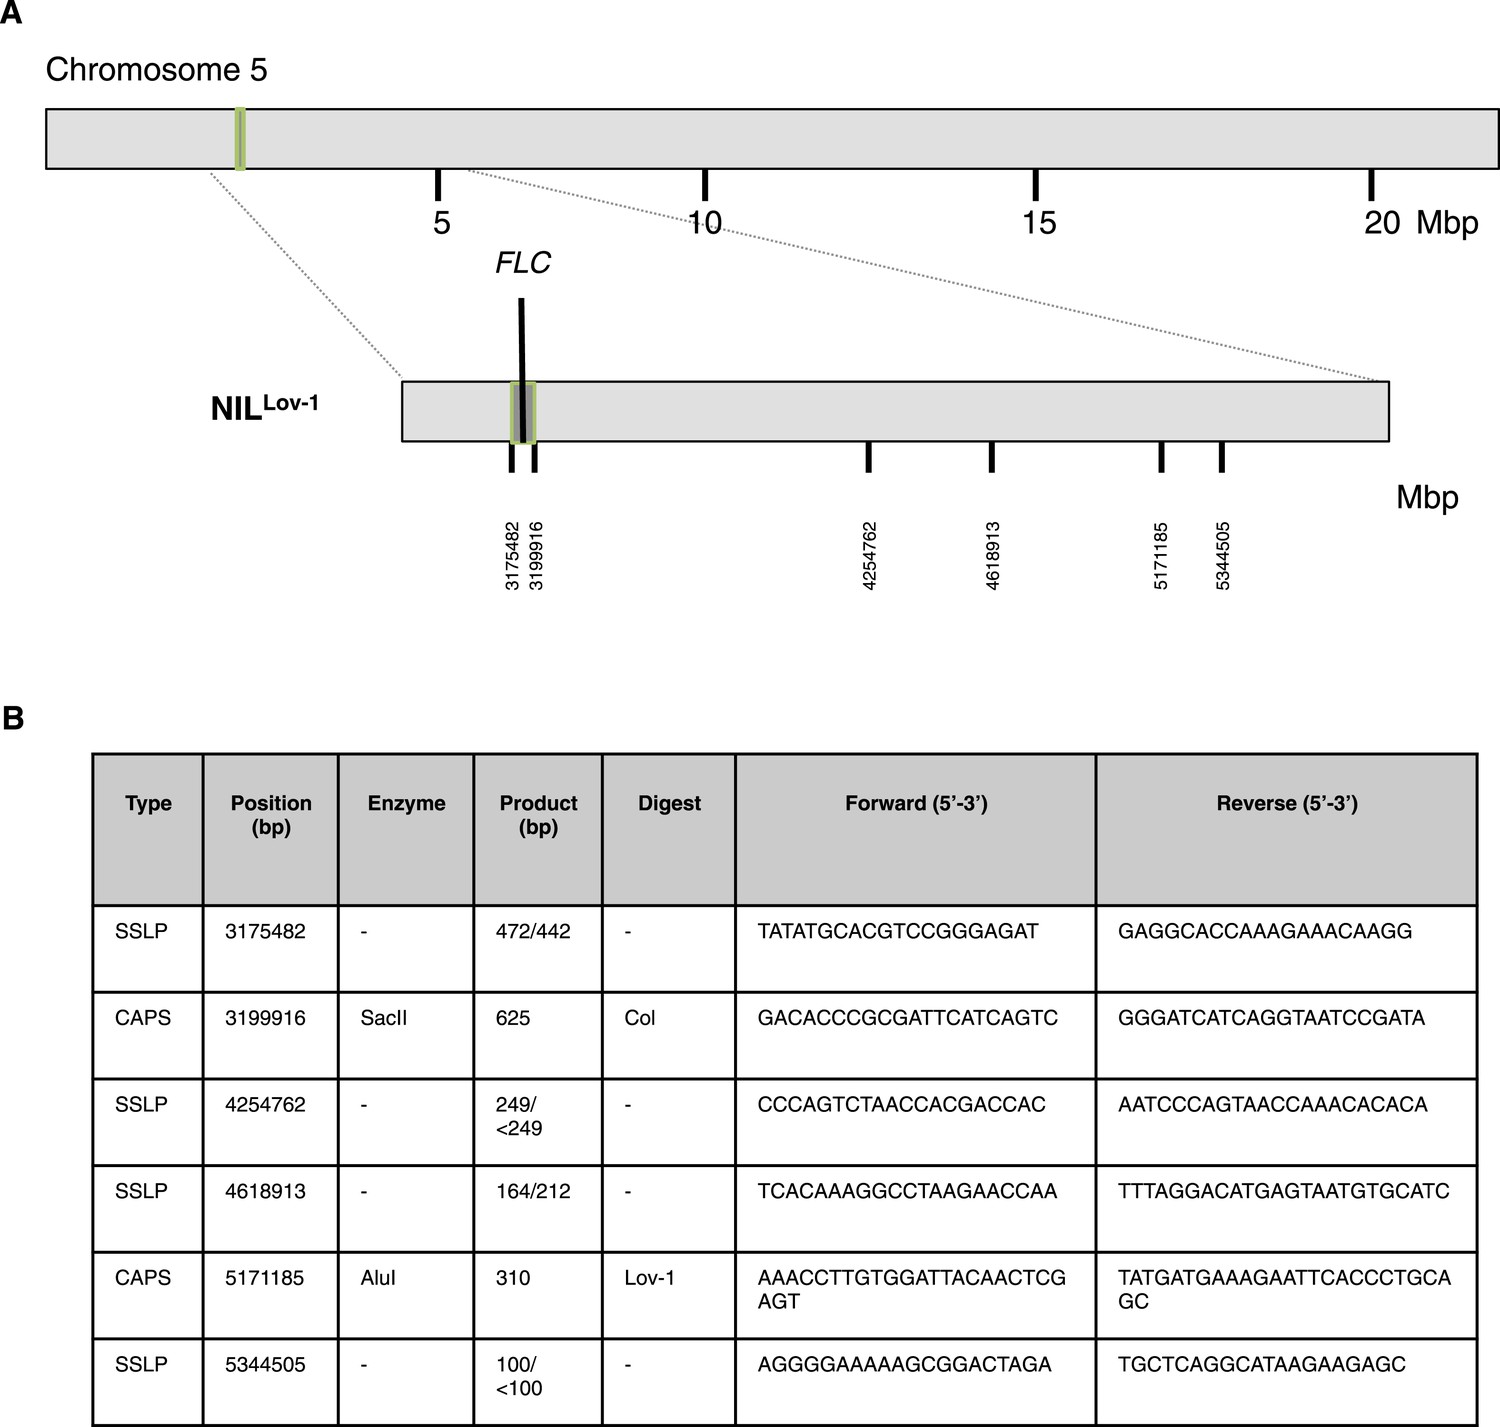
Genetic map showing Lov-1 introgressed region on chromosome 5.
(A) Vertical lines indicate PCR-based markers used to distinguish between Col-0 (light grey) and Lov-1 (dark grey) regions. NILLov-1 introgression line contains the Lov-1 FLC locus (region outlined in green). (B) Markers used to map the introgressed regions on Chromosome 5. The positions correspond to AGI coordinates. Where the marker is a simple sequence length polymorphism (SSLP), the product size is shown for Col-0/Lov-1. Where the marker is a Cleaved Amplified Polymorphic sequence (CAPS), the enzyme required to digest the PCR product of the specified accession is given.
Figure 4 with 1 supplement
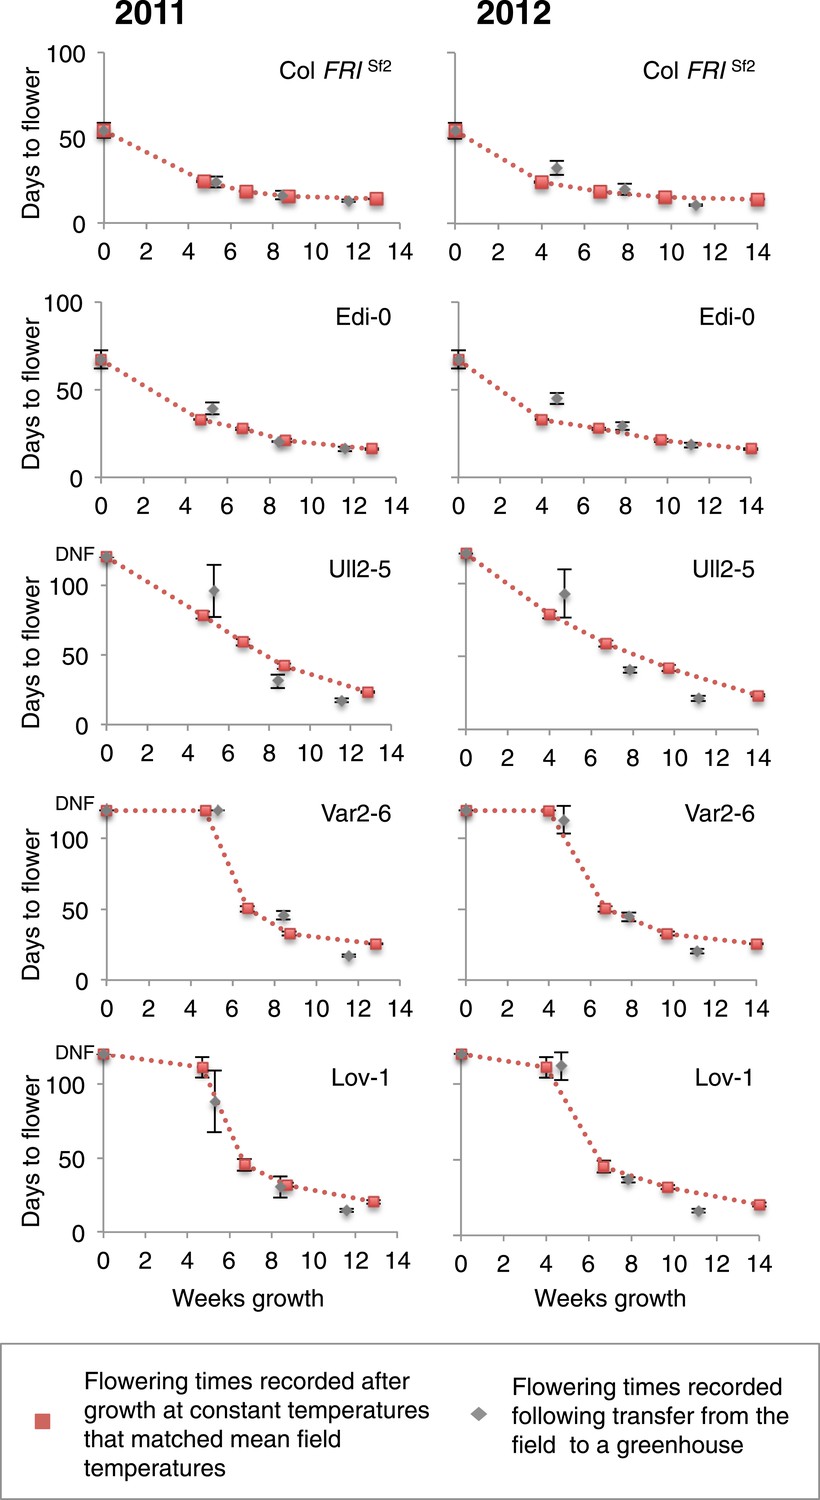
Prediction of vernalization response under field conditions.
Days to flower recorded after the three transplants during field experiments in 2011 and 2012 are shown in grey. Red dashed lines indicate changes in flowering time estimated by flowering time results observed after vernalization at constant temperatures. Error bars represent ±S.D. n ≥ 10, DNF = did not flower.
-
Figure 4—source data 1
Cabinet flowering time data were selected where conditions most closely matched mean temperatures recorded during 2011 and 2012 field experiments.
- https://doi.org/10.7554/eLife.06620.019
Figure 4—figure supplement 1
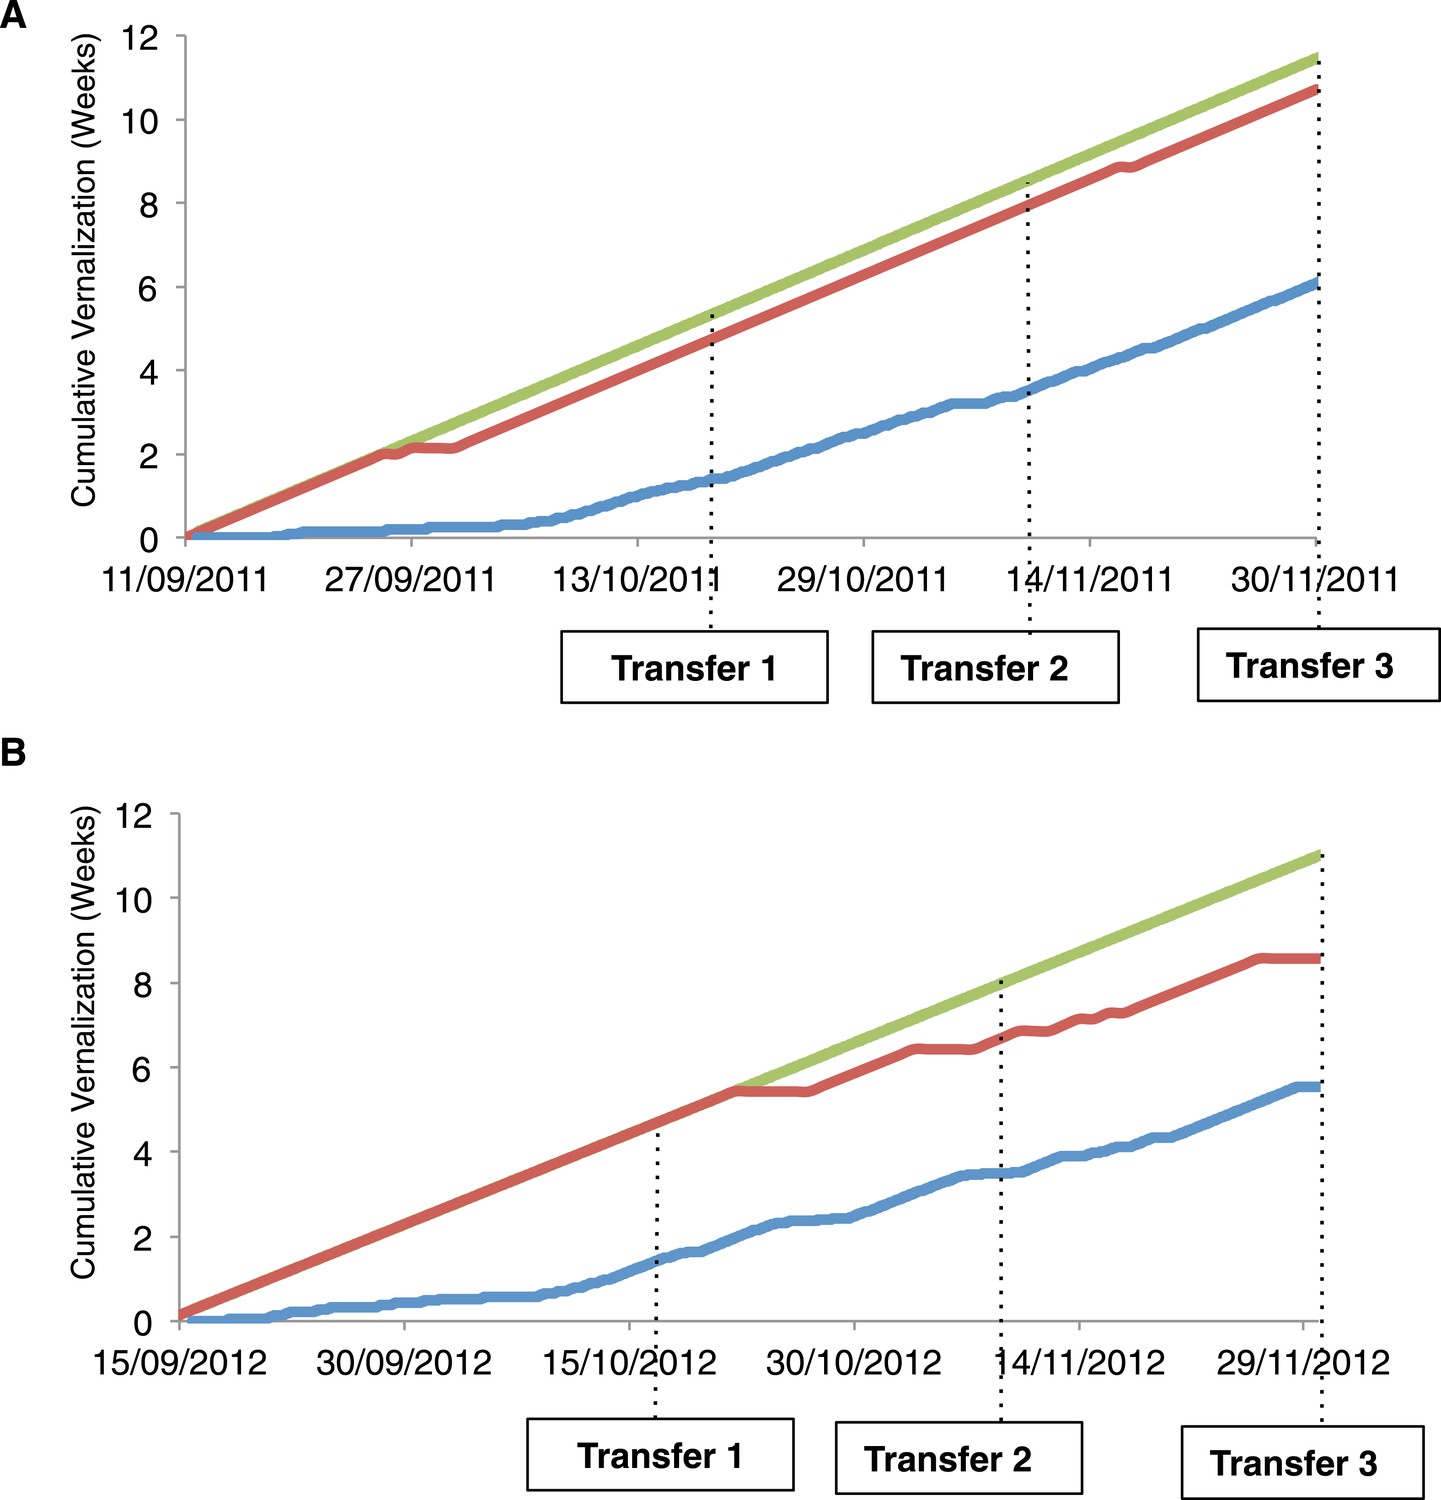
Accumulation of temperatures within different effective vernalization ranges.
(A) Predicted accumulation of effective vernalization weeks during 2011 and (B) 2012 field experiments. Red and blue lines indicate accumulated hours(0°C, 6°C) and daily average temperatures 0°C, 15°C) respectively. The green line indicates maximal temperature accumulation under constant 8°C growing conditions.
Download links
A two-part list of links to download the article, or parts of the article, in various formats.
Downloads (link to download the article as PDF)
Open citations (links to open the citations from this article in various online reference manager services)
Cite this article (links to download the citations from this article in formats compatible with various reference manager tools)
Seasonal shift in timing of vernalization as an adaptation to extreme winter
eLife 4:e06620.
https://doi.org/10.7554/eLife.06620


