An internal thioester in a pathogen surface protein mediates covalent host binding
- John Innes Centre, United Kingdom
- University of St Andrews, United Kingdom
- Helmholtz Centre for Infection Research, Germany
Figures
Figure 1 with 3 supplements
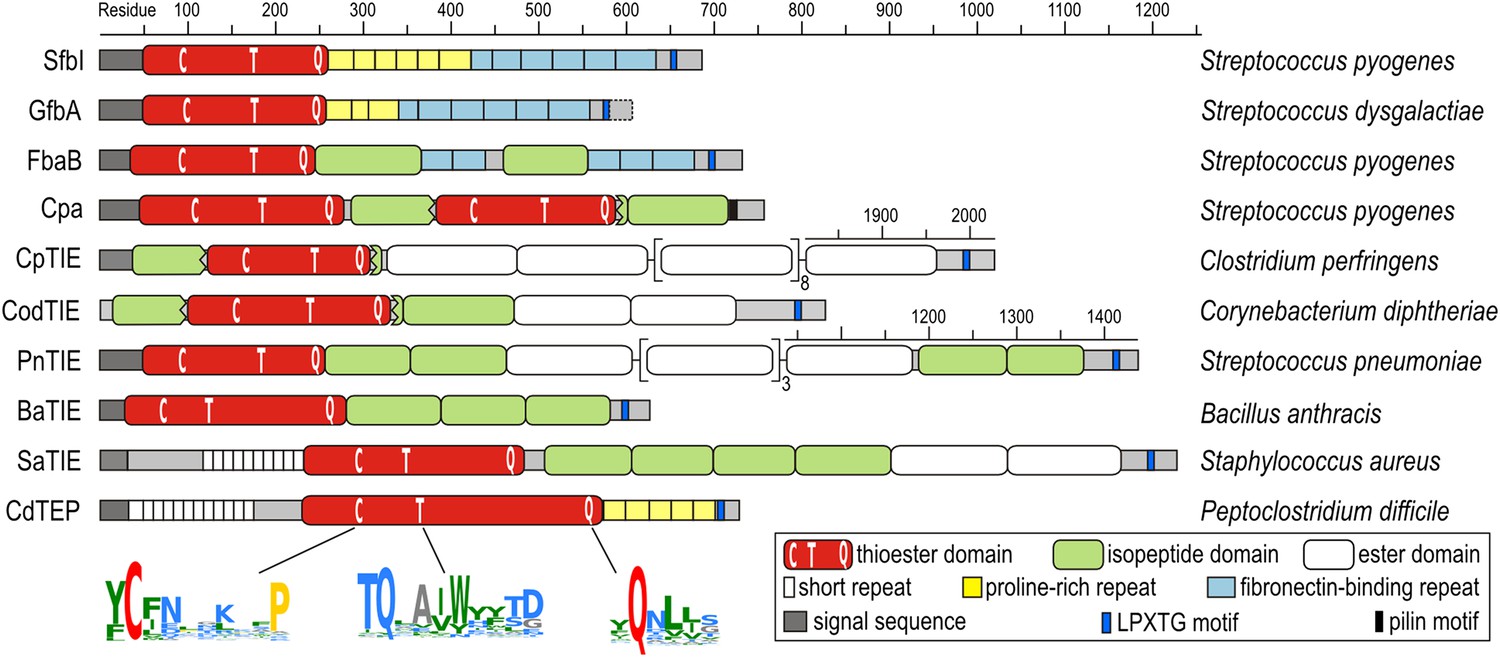
Domain architectures of TED-containing proteins of clinically relevant bacteria.
C, T and Q indicate positions of conserved motifs. The MEME signatures (Bailey et al., 2009) derived from 54 sequences (Figure 1—figure supplement 1) are also shown with the thioester-forming residues in red; proline, hydrophobic, polar and small residues in yellow, green, blue and grey, respectively. TIE, thioester, isopeptide, ester domain protein; TEP, thioester domain containing protein.
Figure 1—figure supplement 1
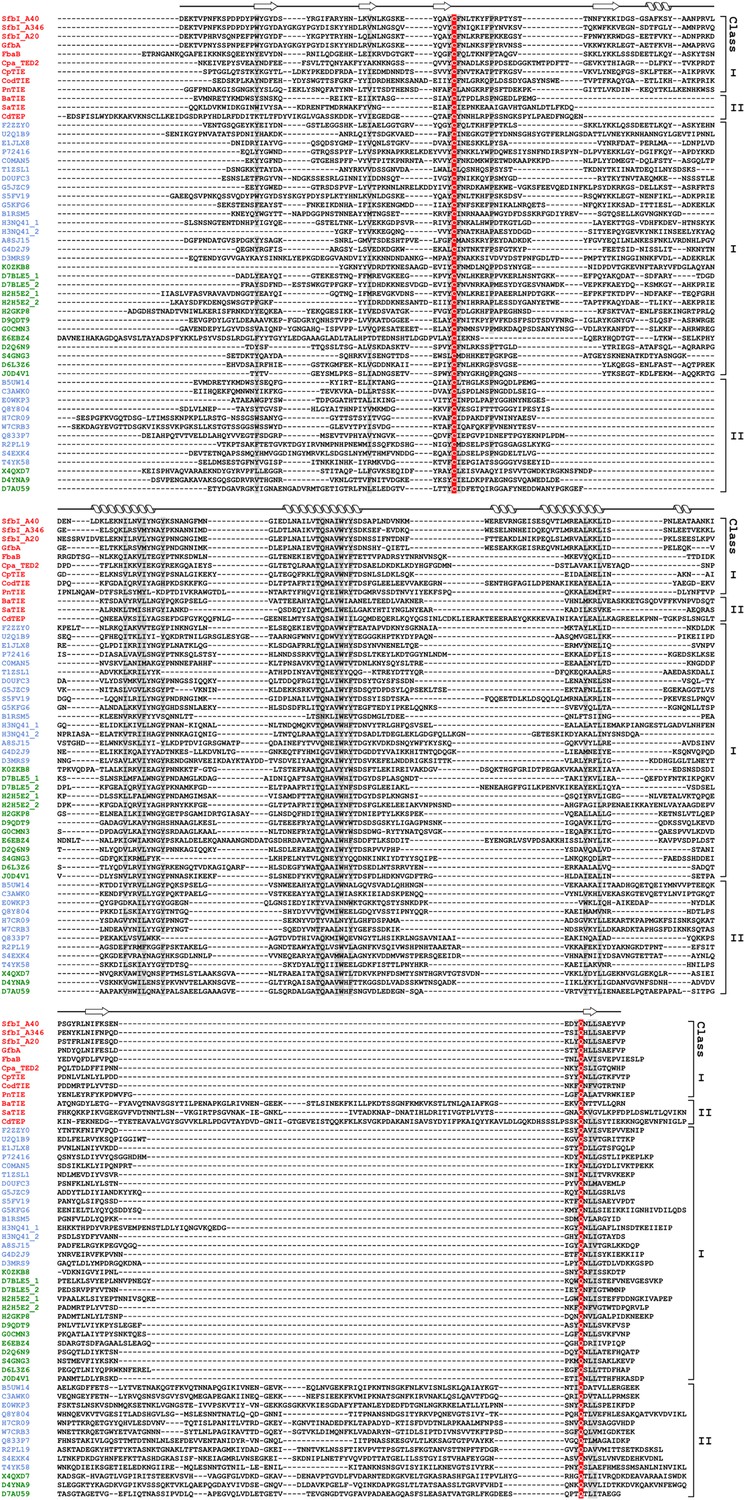
Sequence alignment of 54 TEDs from 40 species.
Proteins with names shown in red were investigated in this study. Blue and green Uniprot accession codes belong to proteins of firmicutes and actinobacteria, respectively. Secondary structure elements of SfbI-A40-TED are displayed on top. The thioester-forming Cys and Gln residues are highlighted in red, partially conserved residues are shaded grey (threshold for shading 85%). The following proteins are included in the alignment. UniProt accession codes and species names are given, also protein names in parentheses, where available: Q1JDZ6 (SfbI-A40), Streptococcus pyogenes; Q711F8 (SfbI-A346), S. pyogenes; Q01924 (SfbI-A20), S. pyogenes; Q6EWI8 (GfbA), Streptococcus dysgalactiae subsp. equisimilis; Q8G9G1 (FbaB), S. pyogenes; Q8GRA2 (Cpa-TED2), S. pyogenes; B1R775 (CpTIE), Clostridium perfringens; H2G8R6 (CodTIE), Corynebacterium diphtheriae; A5MCJ6/Q4K1R7 (PnTIE), Streptococcus pneumoniae; C3PDP7 (BaTIE), Bacillus anthracis; I3GYQ5/I3HJ59/I3HKL2 (SaTIE), Staphylococcus aureus VRS11b; Q17ZZ0 (CdTEP), Peptoclostridium difficile; F2ZZY0, Gemella haemolysans; U2Q1B9, Gemella bergeriae; E1JLX8, Lactococcus salivarius; P72416 (FnZ), Streptococcus equi; C0MAN5 (FneC), Streptococcus equi subsp. equi; T1ZSL1, Streptococcus constellatus; D0UFC3 (Sbs13), Streptococcus gallolyticus; G5JZC9, Streptococcus ictaluri; S5FV19 (Cpa-TED1), S. pyogenes; G5KFG6, Streptococcus urinalis; B1RSM5, C. perfringens; H3NQ41, Helcococcus kunzii; A8SJ15, Parvimonas micra; G4D2J9, Peptoniphilus indolicus; D3MRS9, Peptostreptococcus anaerobius; K0ZKB8, Actinomyces turicensis; D7BLE5, Arcanobacterium haemolyticum; H2H5E2, C. diphtheriae; H2GKP8, C. diphtheriae; D9QDT9, Corynebacterium pseudotuberculosis; G0CMN3, Corynebacterium ulcerans; E6EBZ4, Propionibacterium acnes; D2Q6N9, Bifidobacterium dentium; S4GNG3, Gardnerella vaginalis; D6L3Z6, Parascardovia denticolens; J0D4V1, Scardovia wiggsiae; B5UW14, Bacillus cereus; C3AWK0, Bacillus mycoides; E0WKP3, Listeria grayi; Q8Y804, Listeria monocytogenes; H7CR09, L. monocytogenes; W7CRB3, Listeria weihenstephanensis; Q833P7, Enterococcus faecalis; R2PL19, Enterococcus faecium; S4EXK4, E. faecium; T4YK58, P. difficile; X4QXD7, Trueperella pyogenes; D4YNA9, Brevibacterium mcbrellneri; D7AU59, Nocardiopsis dassonvillei.
Figure 1—figure supplement 2

10 of the 12 purified TEDs used in this study.
SDS-PAGE showing the final purity of 10 of the 12 TED samples. The second bands observed for CodTIE and BaTIE likely represent breakdown products of the TEDs.
Figure 1—figure supplement 3
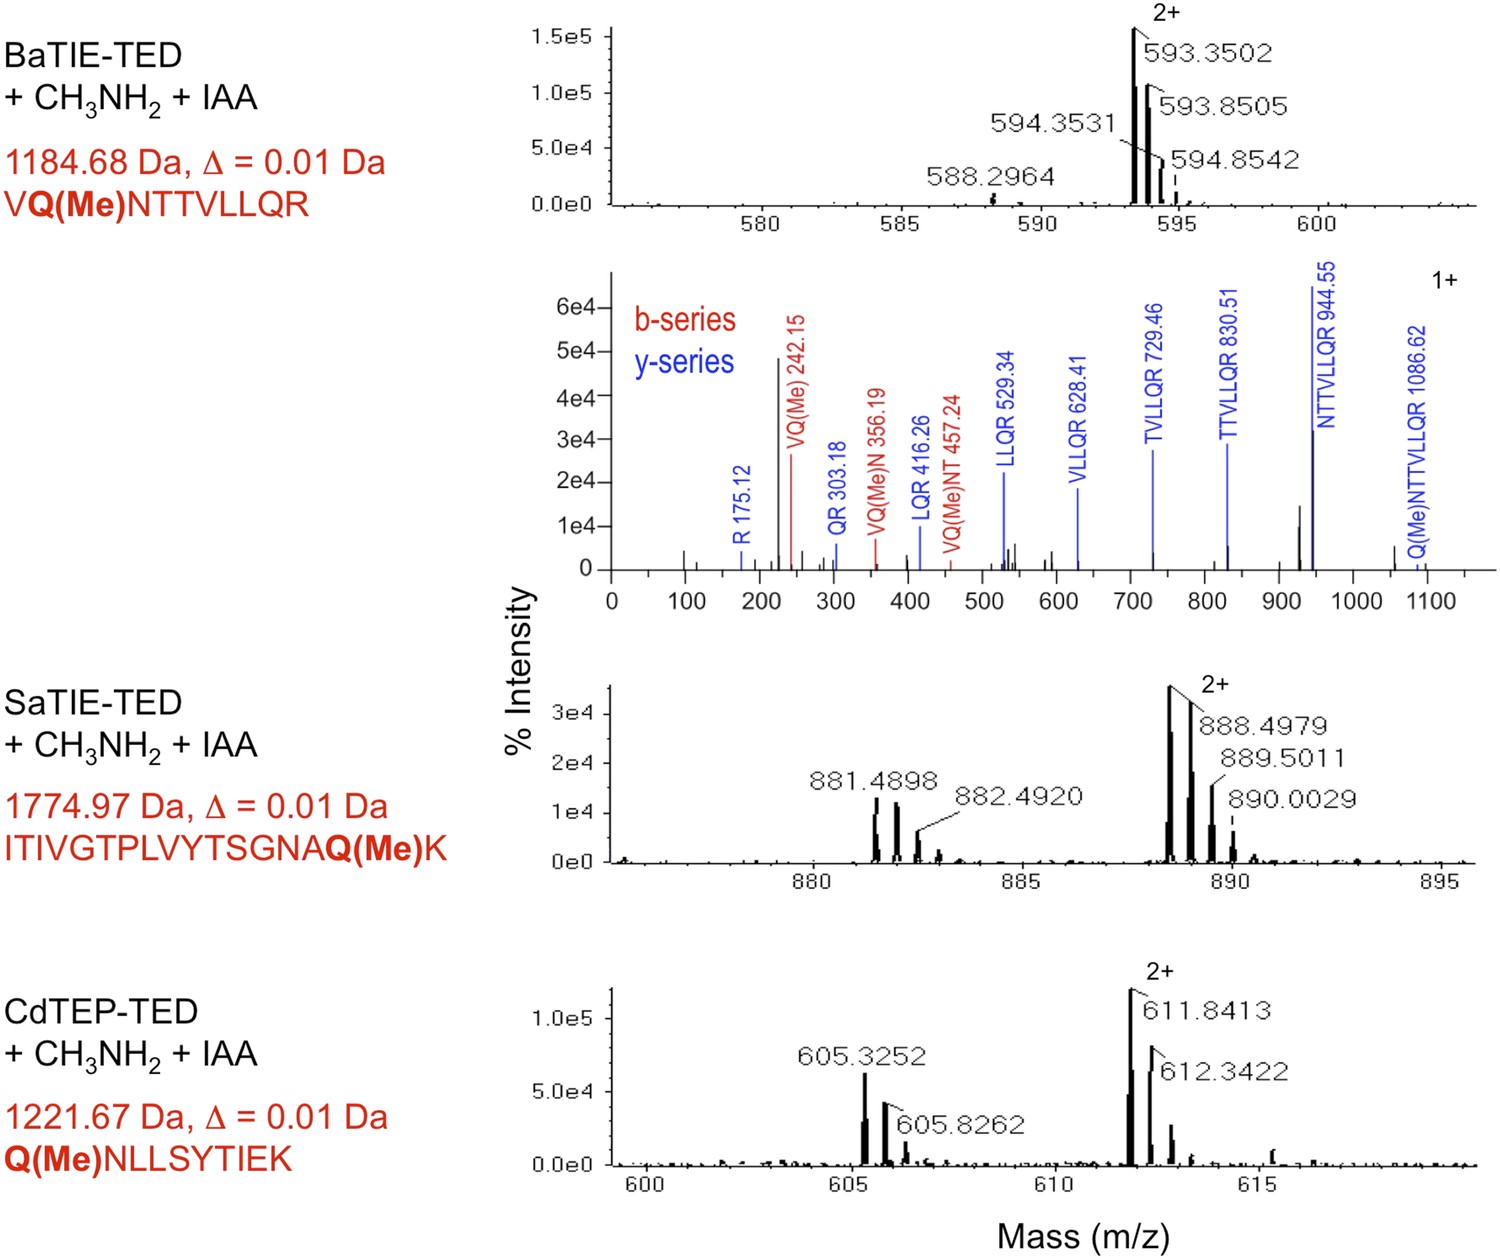
Identification of the thioester-forming Gln residues in class-II TEDs.
MS of tryptic digests of TEDs following incubation with methylamine and blocking of the resulting free Cys thiol with iodoacetamide (IAA). The thioester-forming Gln residues appear as methylated Gln (Q(Me)). Precursor signals matching the methylated tryptic fragment are shown. The masses do not match any other tryptic fragments of the TEDs. Δ, difference between experimental and theoretical mass. The BaTIE-TED fragment contains two Gln residues, and MS/MS analysis was used to unambiguously identify Gln266 as the residue involved in thioester formation.
Figure 2 with 1 supplement
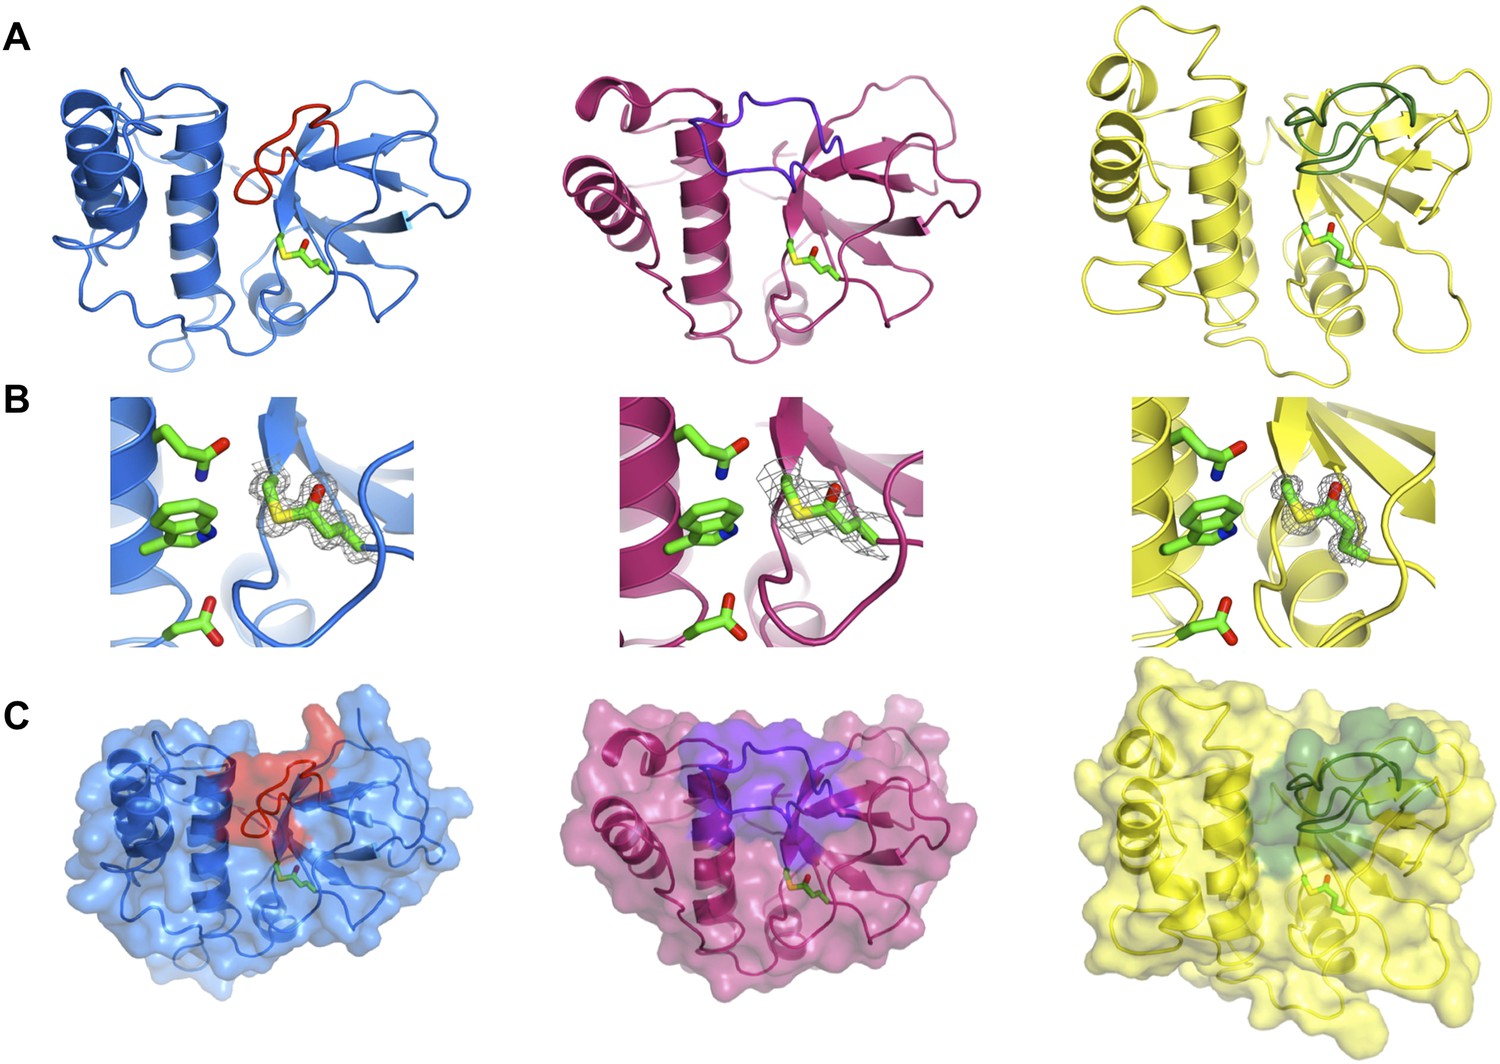
Crystal structures of TEDs.
(A) Cartoon representations of crystal structures of SfbI-A40-TED (blue), CpTIE-TED (burgundy) and PnTIE-TED (yellow) with thioesters shown as sticks. Variable loops adjacent to the thioester are colored red, purple and green, respectively. (B) Close-up views of the thioesters. Residues forming the thioesters are shown overlaid with electron density (2mFobs − DFcalc contoured at 1.0σ). The ‘Q’, ‘W’ and ‘ζ’ residues of the TQxxΦWΦxζ motif are also shown. (C) Surface representations with variable loops colored as in A.
Figure 2—figure supplement 1

Comparison of TED structures.
(A) Overlay of SfbI-A40-TED (blue), CpTIE-TED (burgundy), Pn-TIE-TED (yellow), Cpa-TED2 (pale blue, PDB:2XI9) and Cpa-TED1 (grey, PDB:4C0Z). Thioester and TQxxΦWΦxζ motif residues are shown as sticks. (B) Crystal structure of CpTIE-TED:Cys138Ala with adjacent variable loop colored cyan. (C) Overlay of CpTIE-TED (burgundy) and CpTIE-TED-Cys138Ala (orange).
Figure 3 with 1 supplement
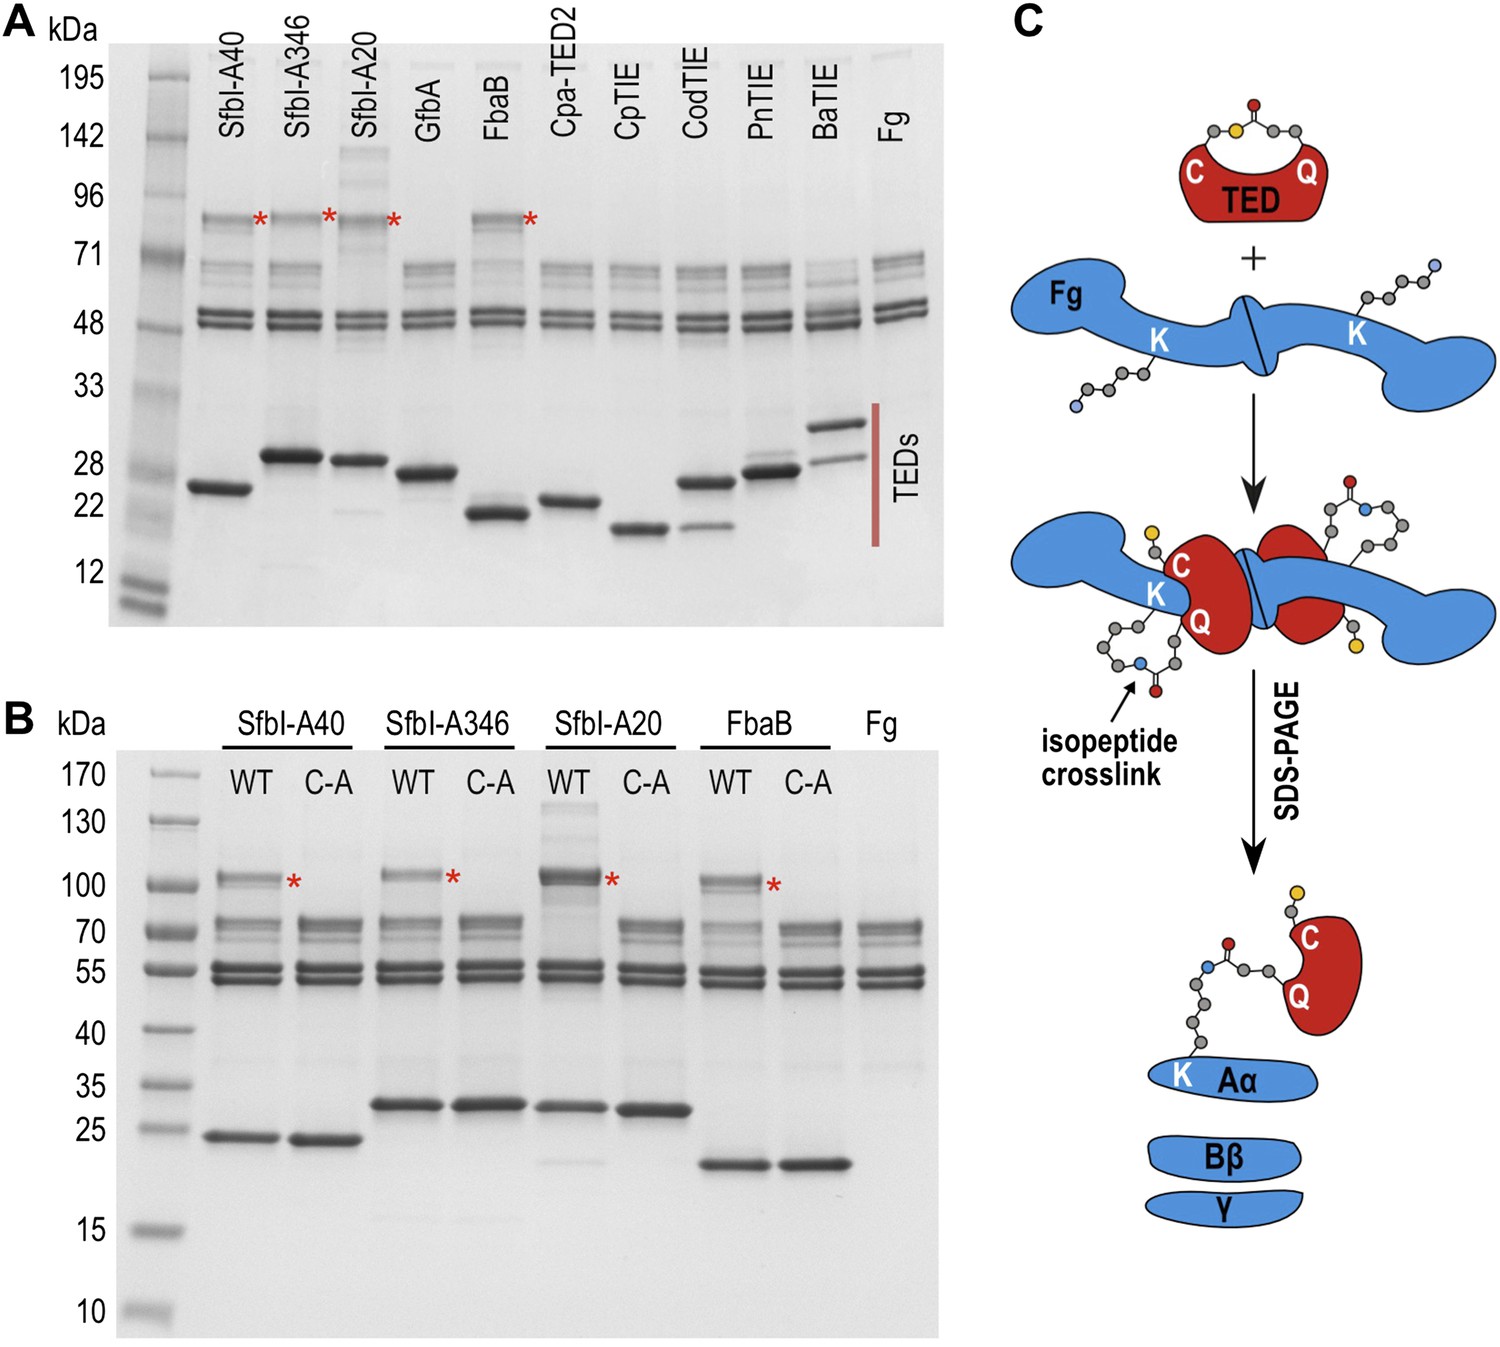
SDS-PAGE analysis of TED:fibrinogen (Fg) adduct formation.
(A) Stable adducts between fibrinogen and TEDs revealed by SDS-PAGE. Red asterisks, adduct bands. (B) Cys-to-Ala mutants of TEDs do not result in adduct formation after incubation with Fg. (C) Schematic representation of the intermolecular isopeptide bond formed between a Lys residue of fibrinogen Aα and the Gln residue of the TED.
Figure 3—figure supplement 1

Effect of acetylation of Lys side chains on fibrinogen (Fg):TED adduct formation.
The hash symbol indicates protein pre-incubated with sulfo-NHS acetate. Red asterisks highlight the positions of adduct bands.
Figure 4 with 1 supplement
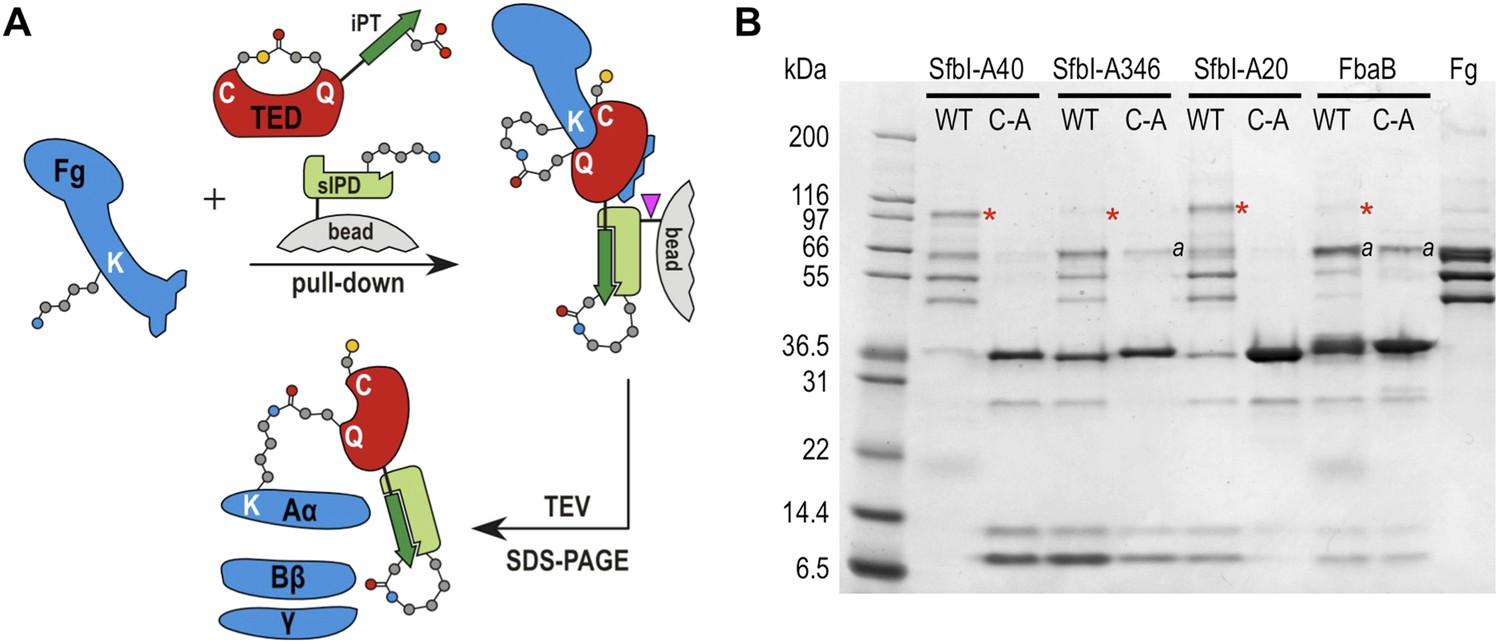
TED:fibrinogen (Fg) adduct formation in plasma pull down assays.
(A) Schematic representation of the isopeptide domain (green) complementation used in the pull-down assays. Pink triangle, tobacco etch virus protease cleavage site. (B) SfbI and FbaB-TEDs pull down fibrinogen from blood plasma, forming covalent adducts (red asterisks). ‘a’ denotes bands corresponding to human serum albumin. Bands below 31 kDa are breakdown products of tagged TEDs.
Figure 4—figure supplement 1

TED:fibrinogen (Fg) adduct formation in plasma pull down assays.
An overloaded gel of the plasma pull-down better shows adduct formation between fibrinogen and TEDs, and its dependence on the thioester. P = plasma depleted of the majority of albumin by blue sepharose chromatography. Red asterisks, adduct bands, ‘a’ and ‘d’ denote human serum albumin and Fg γ dimer, respectively.
Figure 5 with 2 supplements
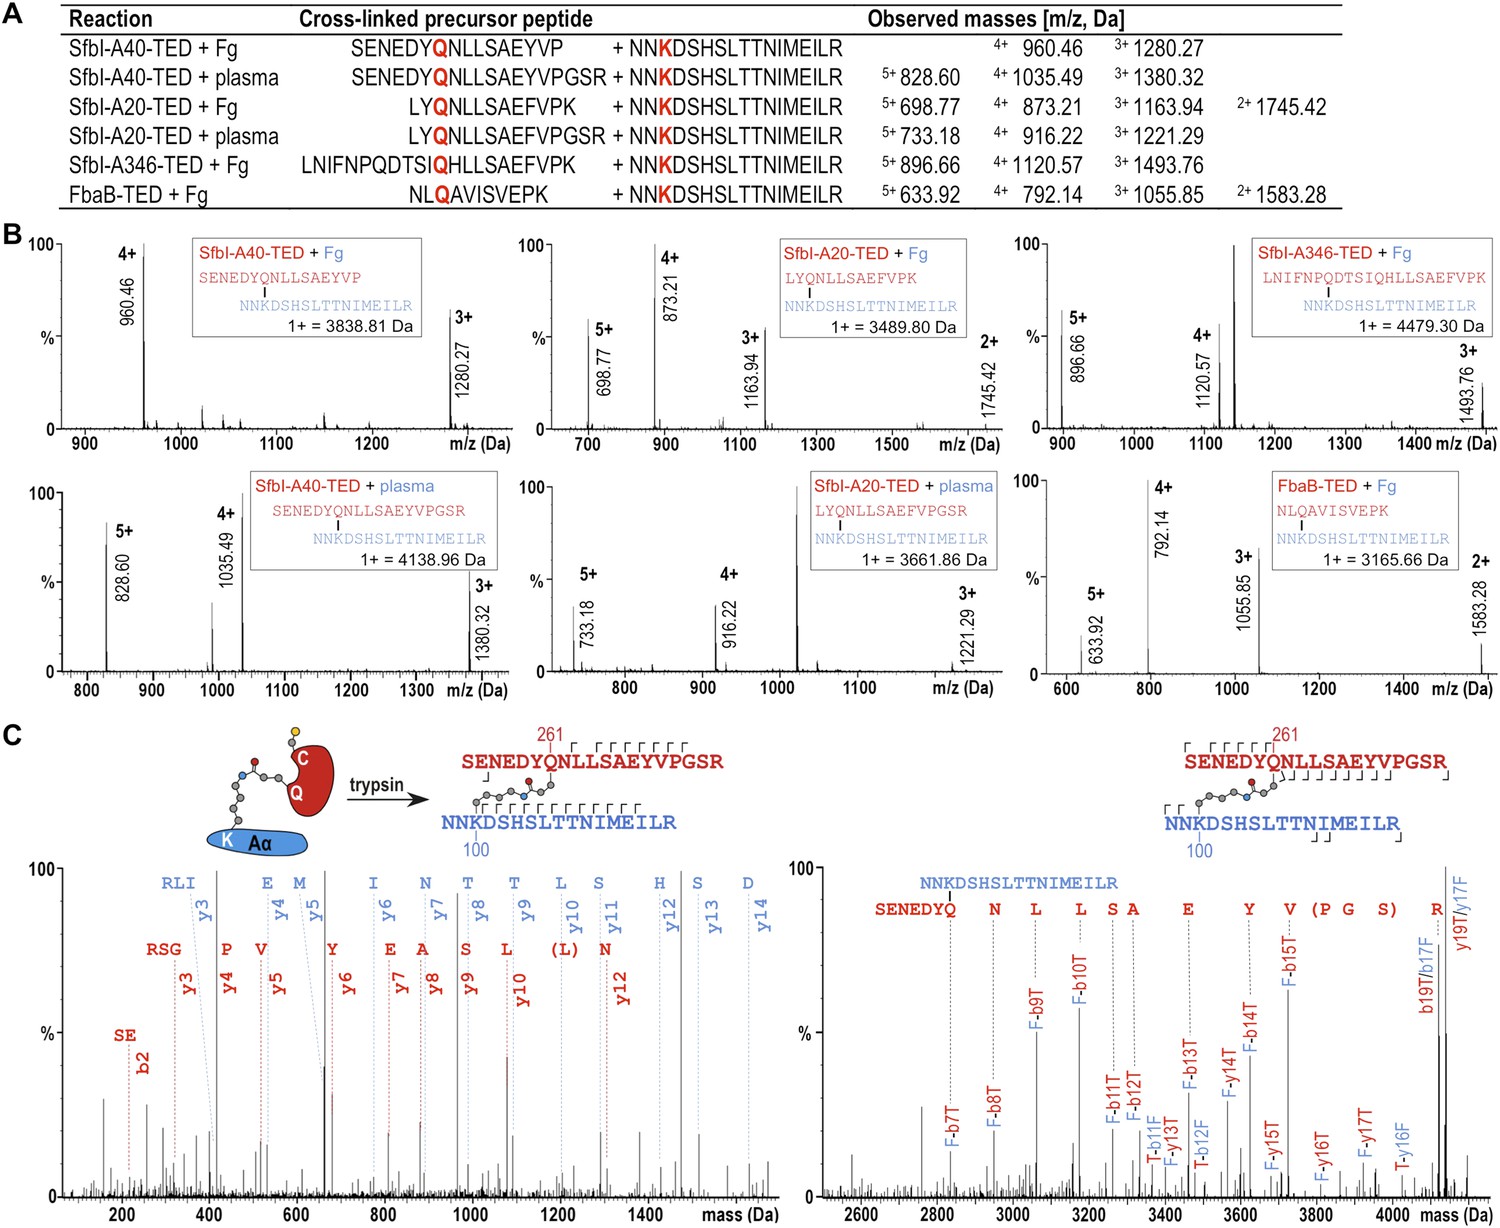
Mass spectrometric identification of the SfbI-TED and FbaB-TED target residue in fibrinogen (Fg).
(A) Precursor ion masses identified in tryptic-digest nanoLC-MSE of excised adduct gel bands for different samples. (B) Several charged states are observed in nanoLC-MSE of cross-linked precursor peptides obtained by tryptic digestion of adducts formed by TEDs with fibrinogen or in plasma pull-downs. (C) Fragmentation nanoLC-MSE spectra of the cross-linked precursor obtained for SfbI-A40-TED in a plasma pull-down. The low and high mass range spectrum is shown on the left and right, respectively. Fragmentations observed in nanoLC-MSE are indicated in the schematic drawings above the spectra by hooks, y-series on top of sequences, b-series below sequences. Numbers correspond to positions in the cross-linked fragments; red, SfbI-A40-TED; blue, fibrinogen Aα.
Figure 5—figure supplement 1

Acetylation of Lys residues in the fibrinogen Aα subunit in absence and presence of SfbI-A40-TED.
Sequence coverage by peptide mass fingerprinting is indicated by colors mapped onto the sequence of human fibrinogen subunit Aα. Grey, signal sequence (not present in mature fibrinogen Aα); red, trypsin coverage; blue and green, additional coverage obtained by endoproteinase GluC and chymotrypsin digestion, respectively; black, no coverage. All Lys residues are highlighted in boldface. Underlined K indicates that the residue was observed in its acetylated form; non-underlined K were observed only in the non-acetylated form.
Figure 5—figure supplement 2
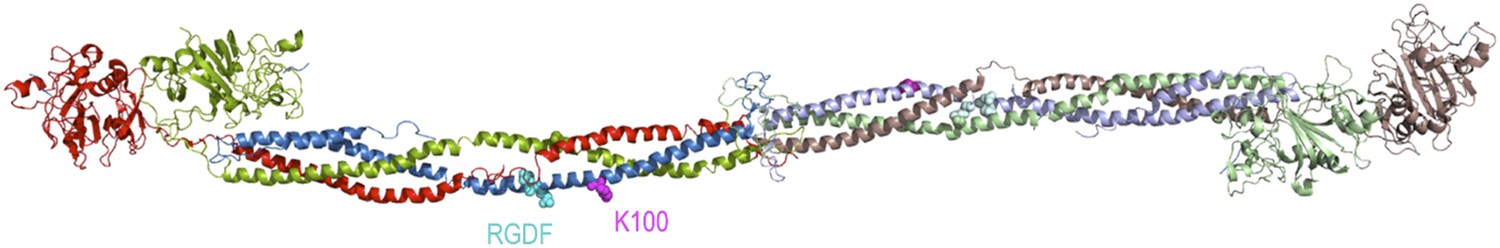
Structure of fibrinogen with important sites labeled.
The positions of Lys100 (magenta) and RGDF platelet-binding motif (cyan) are highlighted on the crystal structure of Fg (PDB:3GHG). α, β and γ chains are colored blue, green and red, respectively.
Figure 6 with 2 supplements
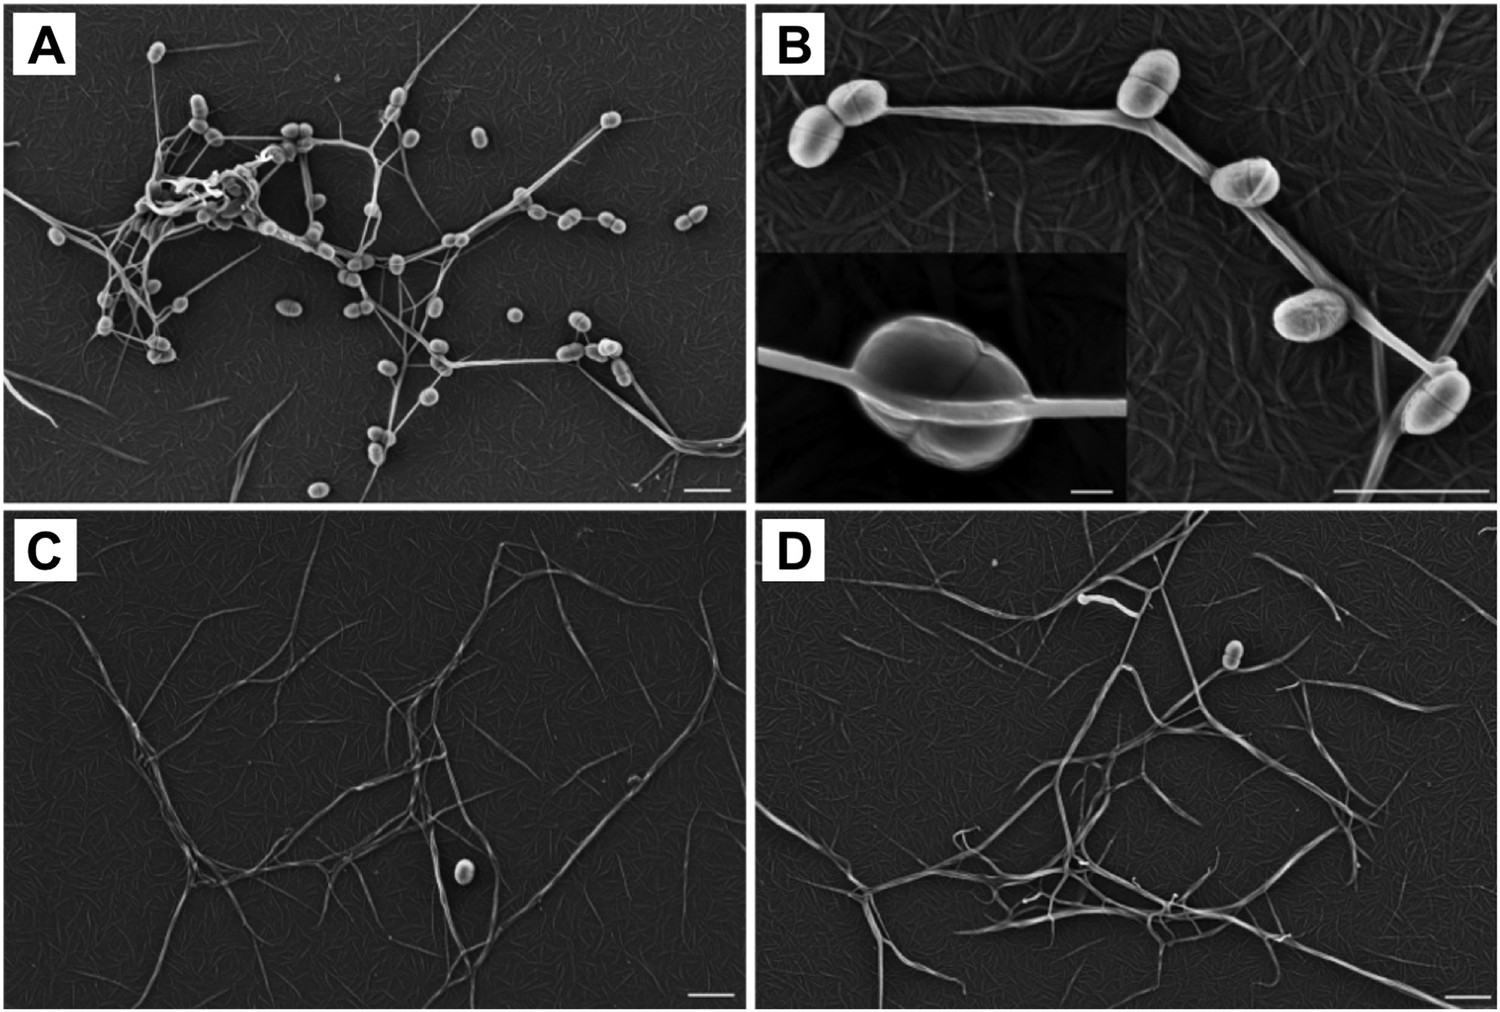
Thioester-dependent binding of bacteria to fibrin.
(A) and (B) fibrin binding by L. lactis expressing SfbI-A40. (C) SfbI-A40:Cys109Ala does not confer fibrin-binding activity to L. lactis. (D) Control of L. lactis transformed with empty pOri23 plasmid. All scale bars 2 μm, except in the insert in panel B, 0.2 μm.
Figure 6—figure supplement 1
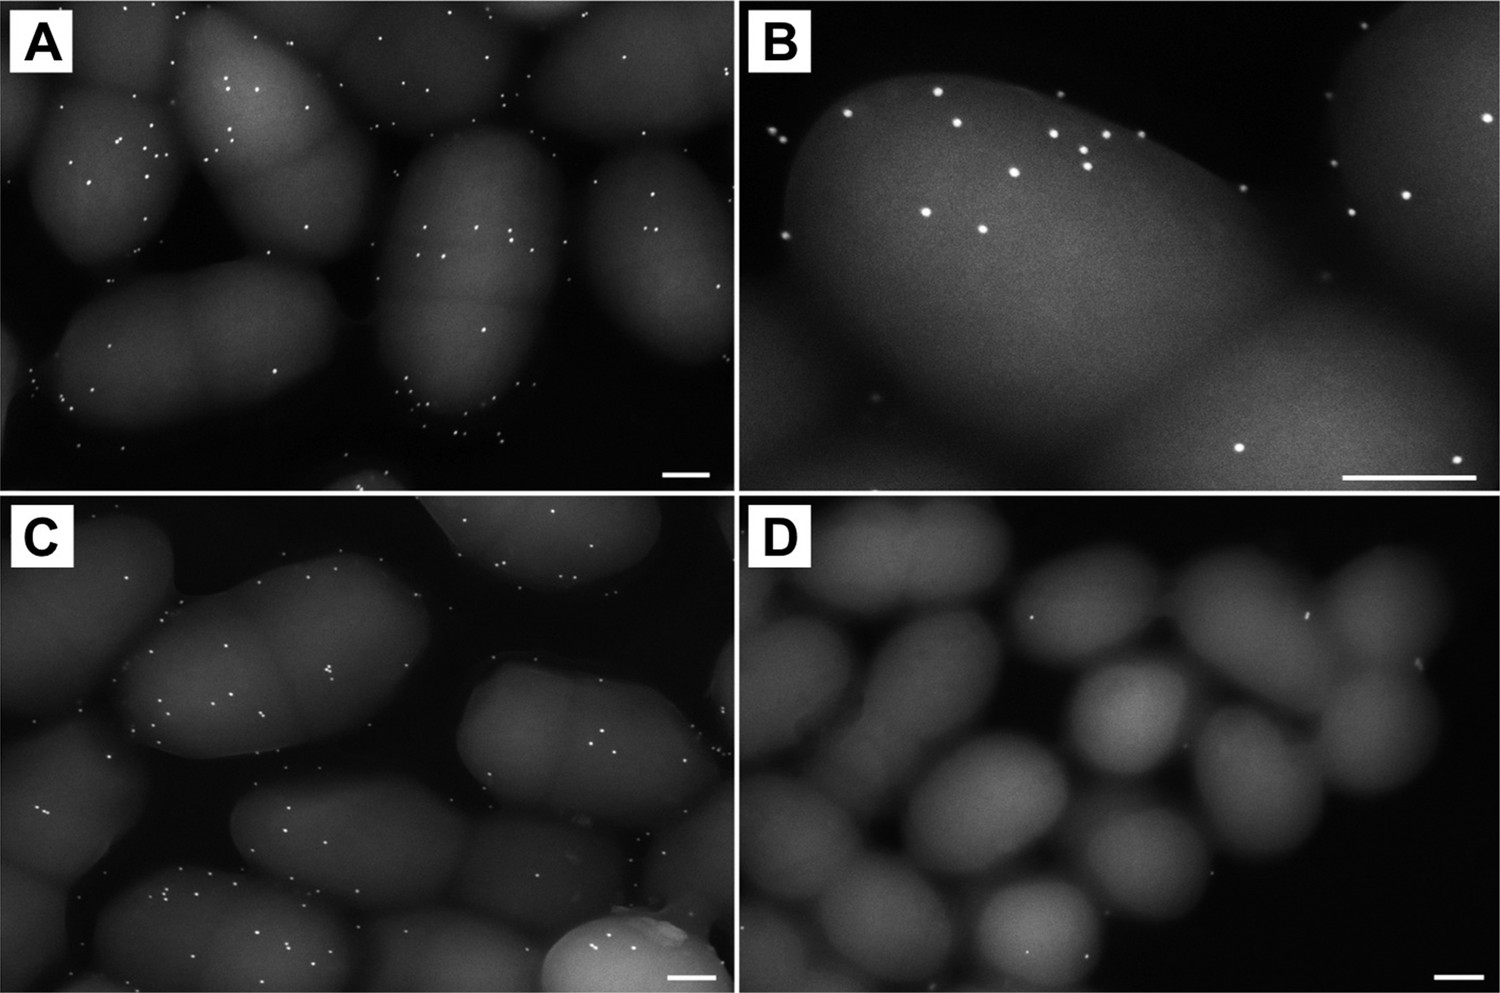
Immunogold labeling of SfbI-A40 and SfbI-A40:Cys109Ala on L. lactis surfaces.
A and B L. lactis expressing SfbI-A40. (C) L. lactis expressing SfbI-A40:Cys109Ala. (D) L. lactis transformed with empty pOri23 plasmid shows essentially no cross-reactivity of the antibody with the bacterial surface. All scale bars 0.2 μm.
Figure 6—figure supplement 2
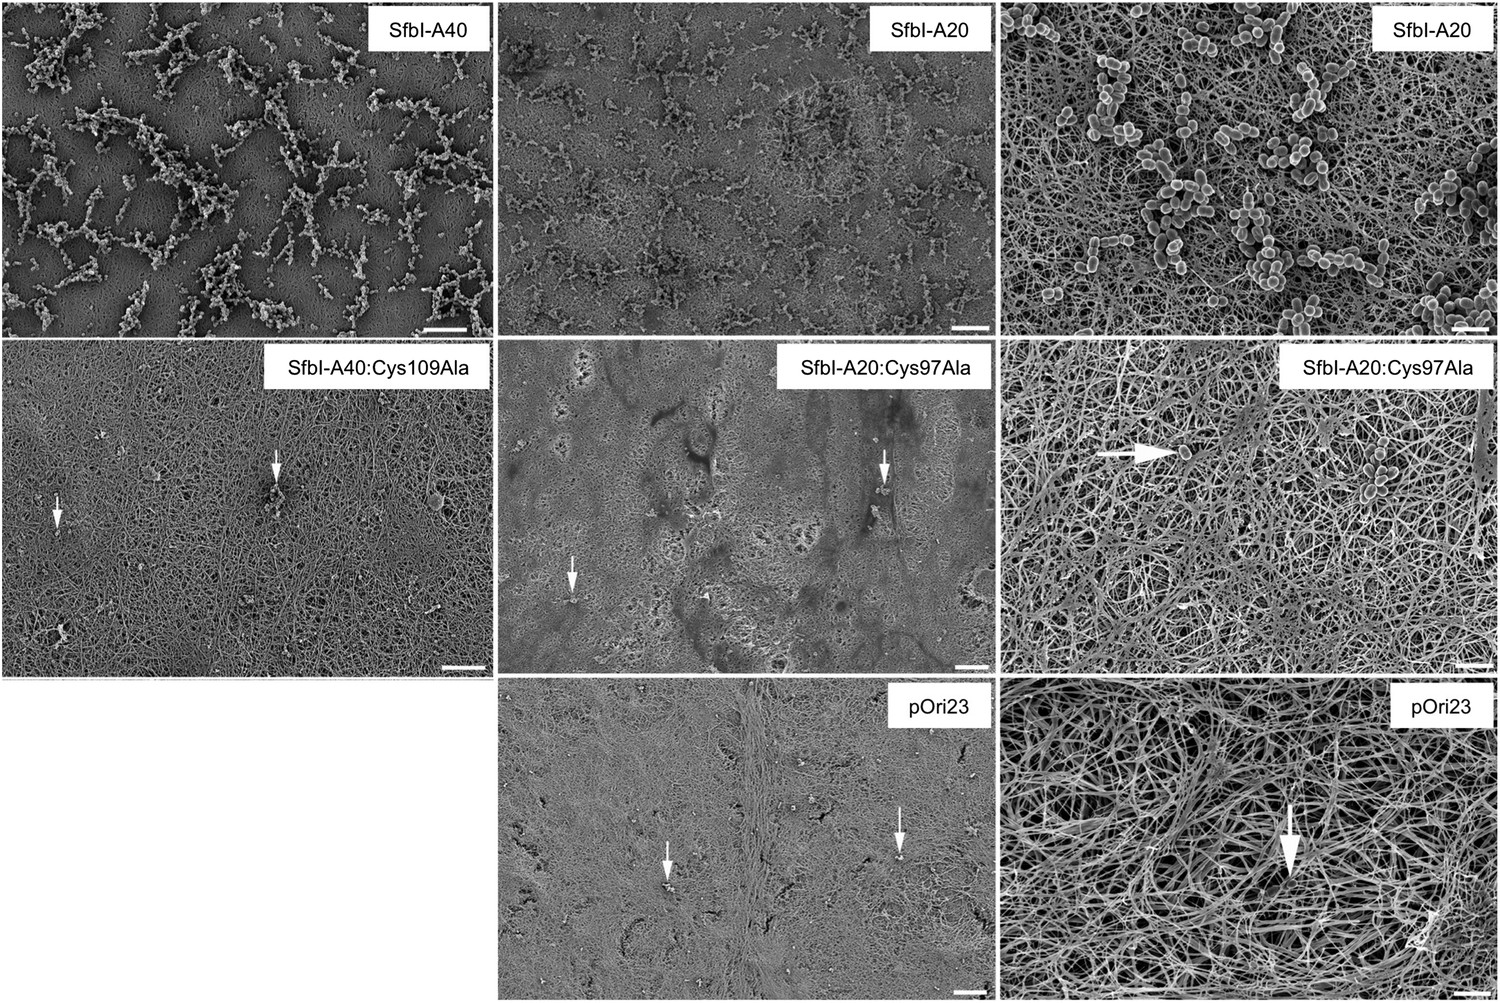
Fibrin clot binding of L. lactis expressing SfbI variants.
A control of L. lactis transformed with empty pOri23 plasmid is also shown. All scale bars 10 μm except in the right column, 2 μm. White arrows point to bacteria in the experiments with the Cys-to-Ala mutants and the empty plasmid.
Figure 7
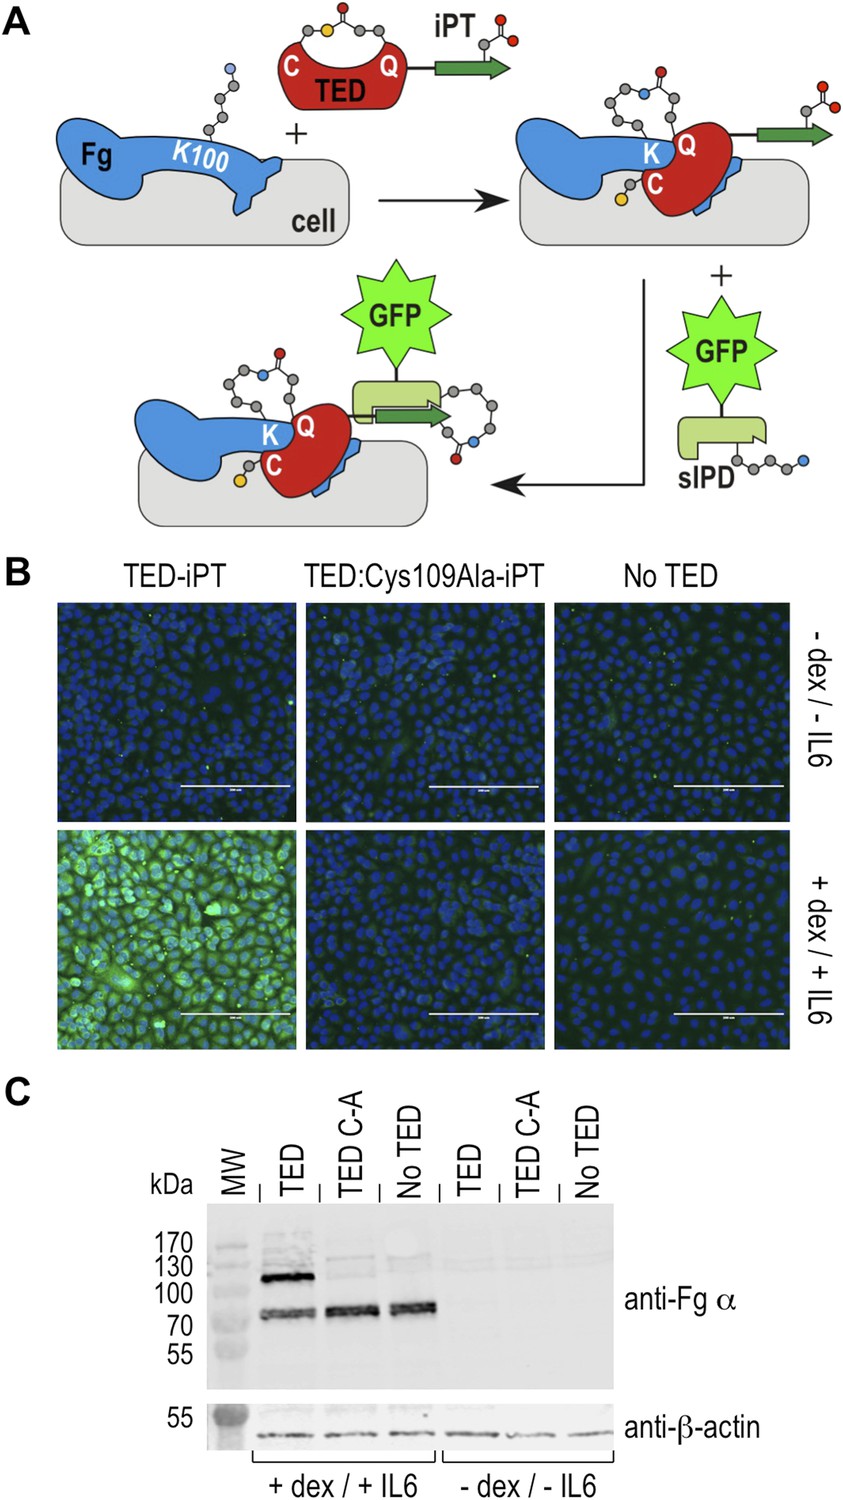
Thioester-dependent binding of SfbI-A40-TED to A549 cells.
(A) Schematic representation of the covalent cell labeling experiment. After incubation with cells, isopep-tag (iPT) labeled TED is detected by GFP fused to sIPD. (B) SfbI-A40-TED and SfbI-A40-TED:Cys109Ala binding to A549 cells before and after incubation with interleukin-6 (IL6) and dexamethasone (dex). No TED, sIPD-GFP controls. Cell nuclei appear in blue. Scale bars, 200 μm. (C) Western blot of whole-cell extracts of induced and non-induced A549 cells, probed with an anti-fibrinogen α antibody. The same membrane was re-probed with an anti-β-actin antibody (shown in separate panel). MW, molecular weight markers; TED, cells incubated with SfbI-A40-TED-iPT; TED C-A, cells incubated with SfbI-A40-TED:Cys109Ala-iPT.
Tables
Table 1
Protein intact mass MS analysis
| Protein | Vector | Molecular mass (Da) | ||
|---|---|---|---|---|
| Calculated | Observed | Δ | ||
| SfbI-A40-TED | pOPIN-F* | 24,156.9 | 24,139.6 | −17.3 |
| SfbI-A40-TED:Cys109Ala | pOPIN-F* | 24,124.9 | 24,124.7 | −0.2 |
| SfbI-A346-TED | pDEST† | 24,835.8 | 24,818.2 | −17.6 |
| SfbI-A346-TED:Cys103Ala | pOPIN-E‡ | 25,626.6 | 25,626.3 | −0.3 |
| SfbI-A20-TED | pOPIN-E‡ | 25,996.1 | 25,978.5 | −17.6 |
| SfbI-A20-TED:Cys97Ala | pOPIN-E‡ | 25,964.1 | 25,963.6 | −0.5 |
| GfbA-TED | pDEST† | 24,382.4 | 24,364.7 | −17.7 |
| FbaB-TED | pOPIN-F* | 21,683.0 | 21,665.6 | −17.4 |
| FbaB-TED:Cys94Ala | pOPIN-E§ | 22,447.7 | 22,447.5 | −0.2 |
| Cpa-TED2 | pOPIN-F* | 22,377.8 | 22,360.5 | −17.3 |
| CpTIE-TED | pOPIN-F* | 21,261.0 | 21,243.7 | −17.3 |
| CpTIE-TED:Cys138Ala | pOPIN-F* | 21,228.9 | 21,227.8 | −1.1 |
| CodTIE-TED | pOPIN-F* | 25,011.6 | 24,994.3 | −17.3 |
| CodTIE-TED:Cys157Ala | pOPIN-F* | 24,979.5 | 24,979.1 | −0.4 |
| PnTIE-TED | pDEST† | 25,779.0 | 25,761.7 | −17.3 |
| PnTIE-TED:Cys94Ala | pHisTEV† | 25,746.9 | 25,746.5 | −0.4 |
| BaTIE-TED | pHisTEV† | 28,541.1 | 28,523.7 | −17.4 |
| SaTIE-TED | pHisTEV† | 33,167.9 | 33,151.3 | −16.6 |
| CdTEP-TED | pHisTEV# | 46,363.7 | 46,345.7 | −18.0 |
-
*
Non-native residues remaining after 3C cleavage: N-terminal GP.
-
†
Non-native residues remaining after TEV cleavage: N-terminal GAM.
-
‡
Non-native residues remaining: N-terminal M, C-terminal KHHHHHH.
-
§
Non-native residues remaining: C-terminal KHHHHH only. N-terminal M removed.
-
#
Non-native residue remaining after TEV cleavage: N-terminal M.
Table 2
X-ray data collection and refinement statistics
| (A) CpTIE-TED and CpTIE-TED:Cys138Ala | |||
|---|---|---|---|
| CpTIE-TED | CpTIE-TED:Cys138Ala | Iodide | |
| Native | Native | ||
| Data collection | |||
| Space group | P1 | P21212 | P2 |
| Cell dimensions | |||
| a, b, c (Å) | 70.82, 74.36, 82.81 | 98.42, 110.72, 68.77 | 97.91, 110.63, 68.45 |
| α, β, γ (°) | 107.32, 104.32, 98.63 | 90, 90, 90 | 90, 90, 90 |
| Resolution (Å)* | 44.88–2.62 (2.69–2.62) | 44.97–1.60 (1.64–1.60) | 58.21–2.83 (2.90–2.83) |
| Rmerge | 13.3 (76.4) | 5.4 (74.4) | 19.5 (101.8) |
| I/σI | 7.5 (1.8) | 31.6 (4.3) | 22.7 (4.4) |
| Completeness (%) | |||
| Overall | 98.0 (97.3) | 100 (99.9) | 98.2 (97.3) |
| Anomalous | 98.1 (96.2) | ||
| Redundancy | |||
| Overall | 4.7 (4.9) | 18.1 (18.1) | 33.3 (33.0) |
| Anomalous | 17.5 (16.8) | ||
| CC(1/2) (%) | 99.3 (58.9) | 100 (90.9) | 99.8 (86.0) |
| Refinement | |||
| Resolution (Å) | 44.8–2.62 (2.69–2.62) | 44.97–1.60 (1.64–1.60) | |
| No. reflections | 42,485 (3115) | 94,622 (6864) | |
| Rwork/Rfree | 19.6/22.6 (35.1/33.7) | 17.7/21.0 (20.5/22.0) | |
| No. atoms | |||
| Protein | 8260 | 6310 | |
| Ligand/ion/water | 36 | 403 | |
| B-factors | |||
| Protein | 50.9 | 24.5 | |
| Ligand/ion/water | 37.8 | 28.5 | |
| R.m.s deviations | |||
| Bond lengths (Å) | 0.014 | 0.013 | |
| Bond angles (°) | 1.60 | 1.57 | |
| MolProbity Score | 1.11 (100th percentile) | 1.13 (99th percentile) | |
| (B) SfbI-A40-TED and PnTIE-TED | |||
|---|---|---|---|
| SfbI-A40-TED | PnTIE-TED | ||
| Native/Zinc | Native | Iodide | |
| Data collection | |||
| Space group | I41 | P41212 | P41212 |
| Cell dimensions | |||
| a, b, c (Å) | 165.12, 165.12, 42.52 | 59.86, 59.86, 121.70 | 59.37, 59.37, 122.4 |
| α, β, γ (°) | 90, 90, 90 | 90, 90, 90 | 90, 90, 90 |
| Resolution (Å)† | 52.22–1.35 (1.39–1.35) | 42.67–1.30 (1.32–1.30) | 31.22–2.80 (2.95–2.80) |
| Rmerge | 5.3 (75.4) | 5.4 (30.4) | 13.3 (35.7) |
| I/σI | 18.7 (2.7) | 33.8 (7.4) | 24.9 (13.0) |
| Completeness (%) | |||
| Overall | 99.9 (99.1) | 93.6 (62.7) | 100 (100) |
| Anomalous | 99.6 (97.5) | 100 (100) | |
| Redundancy | |||
| Overall | 9.2 (9.1) | 23.9 (11.9) | 32.8 (31.9) |
| Anomalous | 4.6 (4.6) | 18.1 (16.6) | |
| CC(1/2) (%) | 99.9 (85.2) | 100 (96.2) | 99.6 (99.2) |
| Refinement | |||
| Resolution (Å) | 52.22–1.35 (1.39–1.35) | 53.71–1.30 (1.33–1.30) | |
| No. reflections | 119869 (8679) | 48,978 (2374) | |
| Rwork/Rfree | 13.1/15.3 (22.6/22.9) | 11.9/15.1 (12.6/15.9) | |
| No. atoms | |||
| Protein | 3389 | 1848 | |
| Ligand/ion/water | 470 | 252 | |
| B-factors | |||
| Protein | 23.0 | 12.5 | |
| Ligand/ion/water | 39.4 | 26.9 | |
| R.m.s deviations | |||
| Bond lengths (Å) | 0.012 | 0.012 | |
| Bond angles (°) | 1.53 | 1.50 | |
| MolProbity Score | 1.06 (99th percentile) | 1.11 (98th percentile) | |
-
*
The highest resolution shell is shown in parenthesis.
-
†
The highest resolution shell is shown in parenthesis.
Table 3
Pairwise sequence identities of TEDs
| SfbI-A40 | SfbI-A346 | SfbI-A20 | GfbA | FbaB | Cpa-TED2 | CpTIE | CodTIE | PnTIE | BaTIE | SaTIE | CdTIE | Cpa-TED1 | |
|---|---|---|---|---|---|---|---|---|---|---|---|---|---|
| SfbI-A40 | 54.2 | 54.2 | 52.3 | 27.1 | 25.8 | 27.4 | 24.3 | 12.0 | 7.6 | 7.6 | 7.2 | 50.0 | |
| SfbI-A346 | 54.2 | 49.1 | 64.3 | 22.7 | 21.4 | 31.0 | 23.4 | 9.9 | 6.9 | 6.7 | 8.0 | 46.0 | |
| SfbI-A20 | 54.2 | 49.1 | 56.4 | 26.2 | 23.7 | 27.7 | 21.3 | 8.7 | 8.2 | 5.0 | 7.6 | 52.2 | |
| GfbA | 52.3 | 64.3 | 56.4 | 22.7 | 21.0 | 29.7 | 26.0 | 9.5 | 6.6 | 6.7 | 7.5 | 50.2 | |
| FbaB | 27.1 | 22.7 | 26.2 | 22.7 | 19.1 | 21.9 | 17.7 | 19.5 | 7.8 | 8.0 | 5.5 | 24.8 | |
| Cpa-TED2 | 25.8 | 21.4 | 23.7 | 21.0 | 19.1 | 27.1 | 32.6 | 16.9 | 9.5 | 5.0 | 6.2 | 20.3 | |
| CpTIE | 27.4 | 31.0 | 27.7 | 29.7 | 21.9 | 27.1 | 24.4 | 20.1 | 8.4 | 6.7 | 7.2 | 26.8 | |
| CodTIE | 24.3 | 23.4 | 21.3 | 26.0 | 17.7 | 32.6 | 24.4 | 19.6 | 9.0 | 4.7 | 6.6 | 25.4 | |
| PnTIE | 12.0 | 9.9 | 8.7 | 9.5 | 19.5 | 16.9 | 20.1 | 19.6 | 5.2 | 5.1 | 6.0 | 21.6 | |
| BaTIE | 7.6 | 6.9 | 8.2 | 6.6 | 7.8 | 9.5 | 8.4 | 9.0 | 5.2 | 9.3 | 11.8 | 9.1 | |
| SaTIE | 7.6 | 6.7 | 5.0 | 6.7 | 8.0 | 5.0 | 6.7 | 4.7 | 5.1 | 9.3 | 9.2 | 7.0 | |
| CdTIE | 7.2 | 8.0 | 7.6 | 7.5 | 5.5 | 6.2 | 7.2 | 6.6 | 6.0 | 11.8 | 9.2 | 8.0 | |
| Cpa-TED1 | 50.0 | 46.0 | 52.2 | 50.2 | 24.8 | 20.3 | 26.8 | 25.4 | 21.6 | 9.1 | 7.0 | 8.0 |
-
Bold values correspond to pairs of TEDs with known structures. Values highlighted in grey indicate that a pairwise alignment was not meaningful; the values given correspond to pairwise identities as calculated from the alignment of 54 TEDs (Figure 1—figure supplement 1). Alignments of randomized sequences commonly resulted in pairwise identities of 10–20%. Pairwise alignments were produced with BioEdit using a GONNET similarity matrix.
Additional files
-
Supplementary file 1
Excel spreadsheet. Identification of TED-fibrinogen cross-links by MS. Each page presents data for a single TED-fibrinogen or plasma reaction. The sequences and theoretical masses of the Gln-containing TED peptide and Lys100-containing fibrinogen peptide are highlighted in red and blue respectively. The theoretical mass of the TED peptide with and without the thioester bond is given. The mass of the fibrinogen peptide is given for both the oxidized and non-oxidized (Met) states as precursor and fragment ions for both are present in the spectra. Table, top left—calculated theoretical masses for the multiply charged precursor ions of the cross-linked peptide. Precursor masses observed in the spectra are highlighted in red (Figure 5). Table, top right—top three hits found in the Homo sapiens database search for each reaction. Main tables—calculated theoretical masses of every possible fragmentation of the cross-linked peptide (orange shade). Fragment masses observed in the spectra are highlighted in red (Figure 5). Sequences of the fragmented peptide b- and y-ions are shown beside their corresponding masses.
- https://doi.org/10.7554/eLife.06638.023
-
Supplementary file 2
pdf file (table). Oligonucleotide primers used in constructing expression vectors and mutants.
- https://doi.org/10.7554/eLife.06638.024
Download links
A two-part list of links to download the article, or parts of the article, in various formats.
Downloads (link to download the article as PDF)
Open citations (links to open the citations from this article in various online reference manager services)
Cite this article (links to download the citations from this article in formats compatible with various reference manager tools)
An internal thioester in a pathogen surface protein mediates covalent host binding
eLife 4:e06638.
https://doi.org/10.7554/eLife.06638


