ATF4 licenses C/EBPβ activity in human mesenchymal stem cells primed for adipogenesis
- University of Pennsylvania, United States
- Boston University, United States
- Harvard University, United States
Figures
Figure 1 with 2 supplements
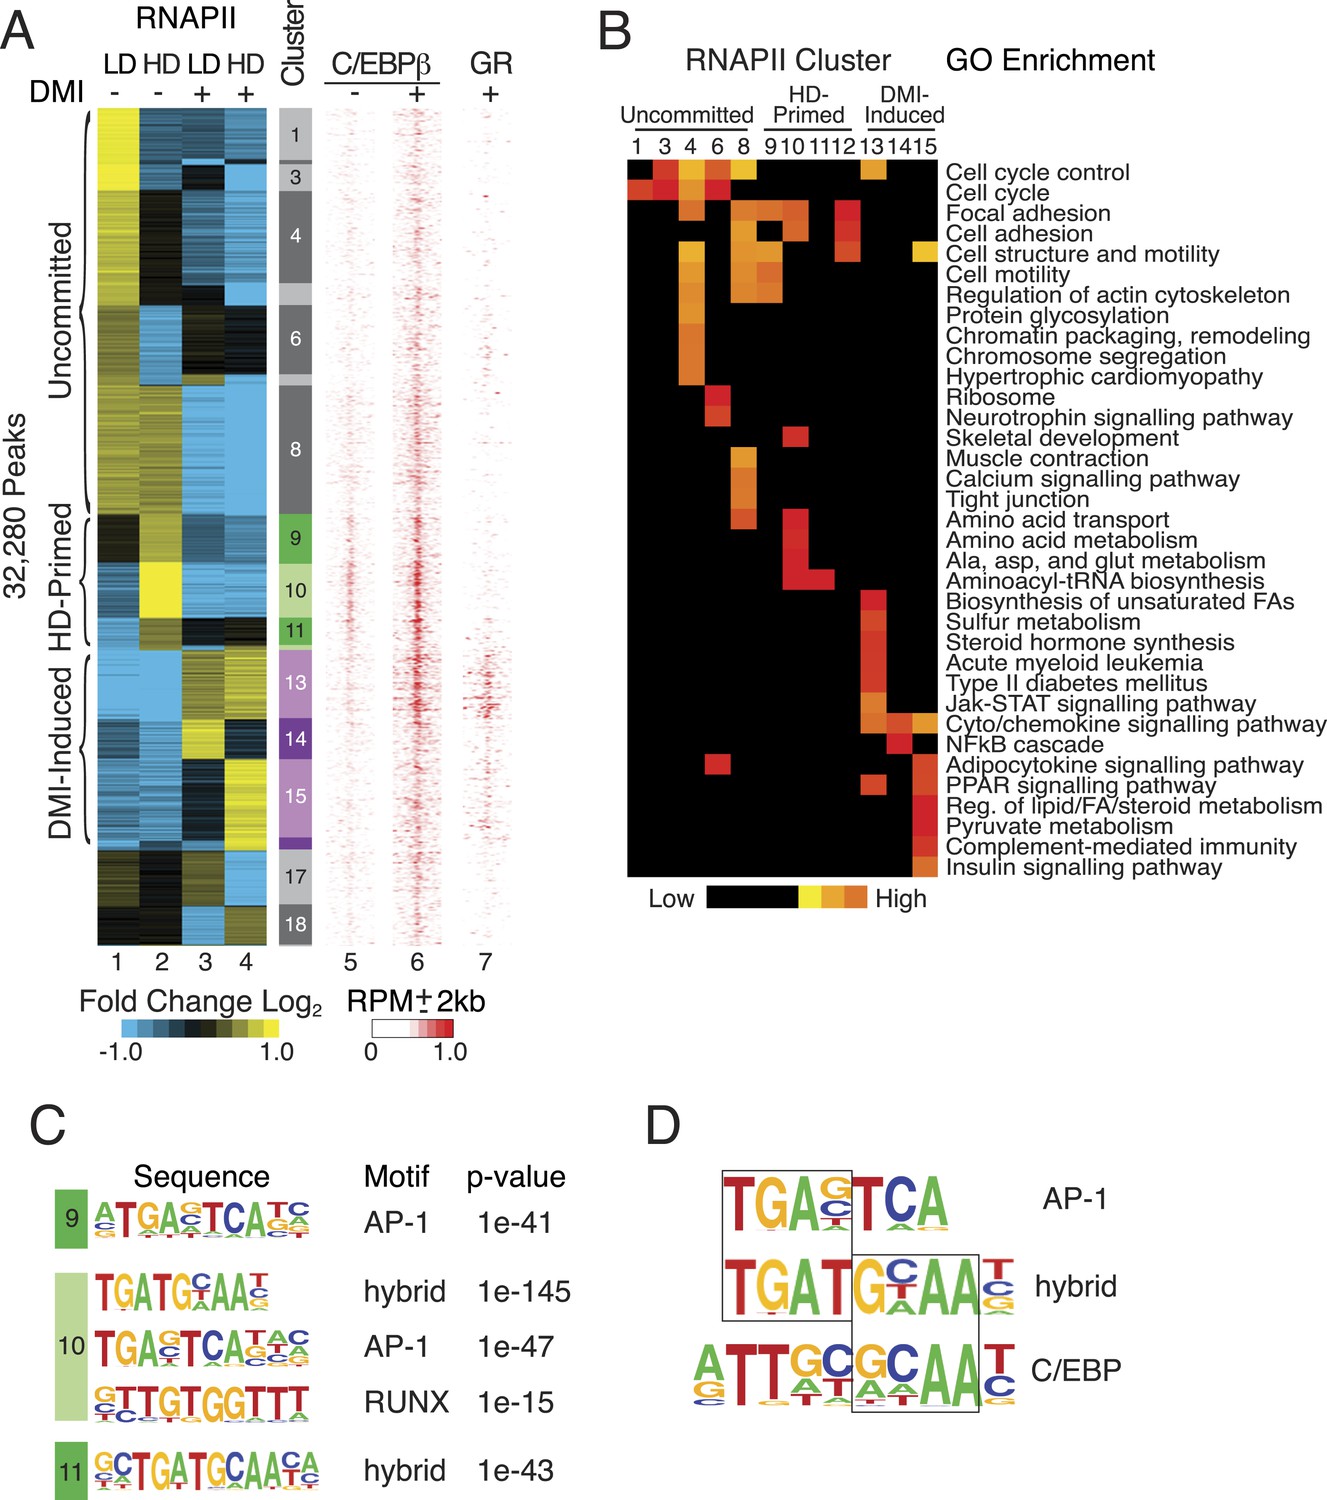
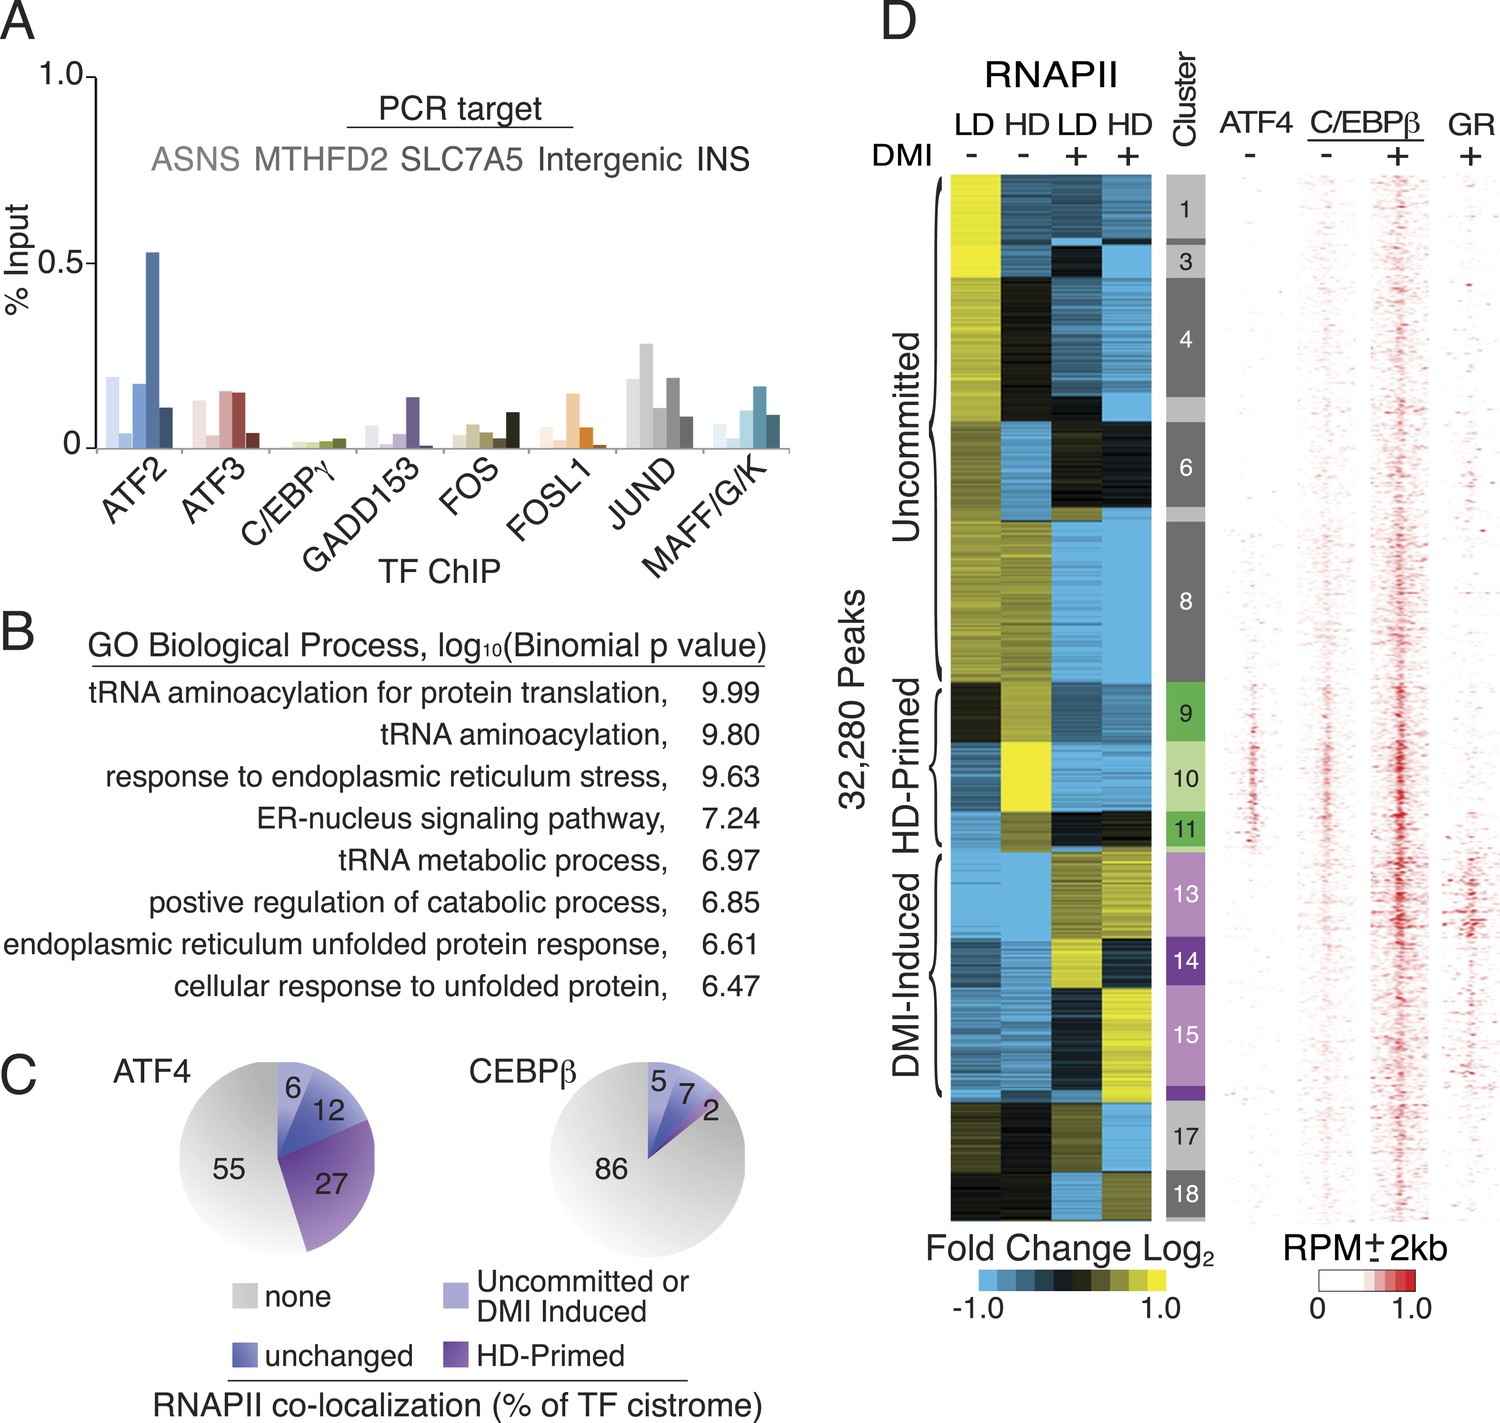
RNAPII-annotated enhancers reveal stage-specific transcriptional programs during adipogenic commitment.
(A) Heat map of RNA Polymerase II (RNAPII) peaks clustered as a function of differential enrichment in response to changes in cell density (low, LD vs high, HD) and differentiation cocktail (+ or − DMI, 24 hr) in human mesenchymal stem cells (hMSCs) (tracks 1–4). Density heat maps (red) of C/EBPβ (0 and 6 hr DMI) and GR (6 hr DMI) binding in hMSCs within a 4 kb window of differential RNAPII peaks (tracks 5–7). Color bar specifically refers to scaling for C/EBPβ tracks. (B) Gene ontologies (GOs) resulting from mapping RNAPII enhancers to genes with correlated changes in gene body RNAPII. (C) Identification of de novo motifs in differential RNAPII clusters 9–11; reported sequences met detection thresholds of at least 5% of targets and p-value ≤ 1e-14. (D) Comparison of the AP-1, hybrid and C/EBP motifs, with the AP-1- and C/EBP-half sites boxed.
Figure 1—figure supplement 1
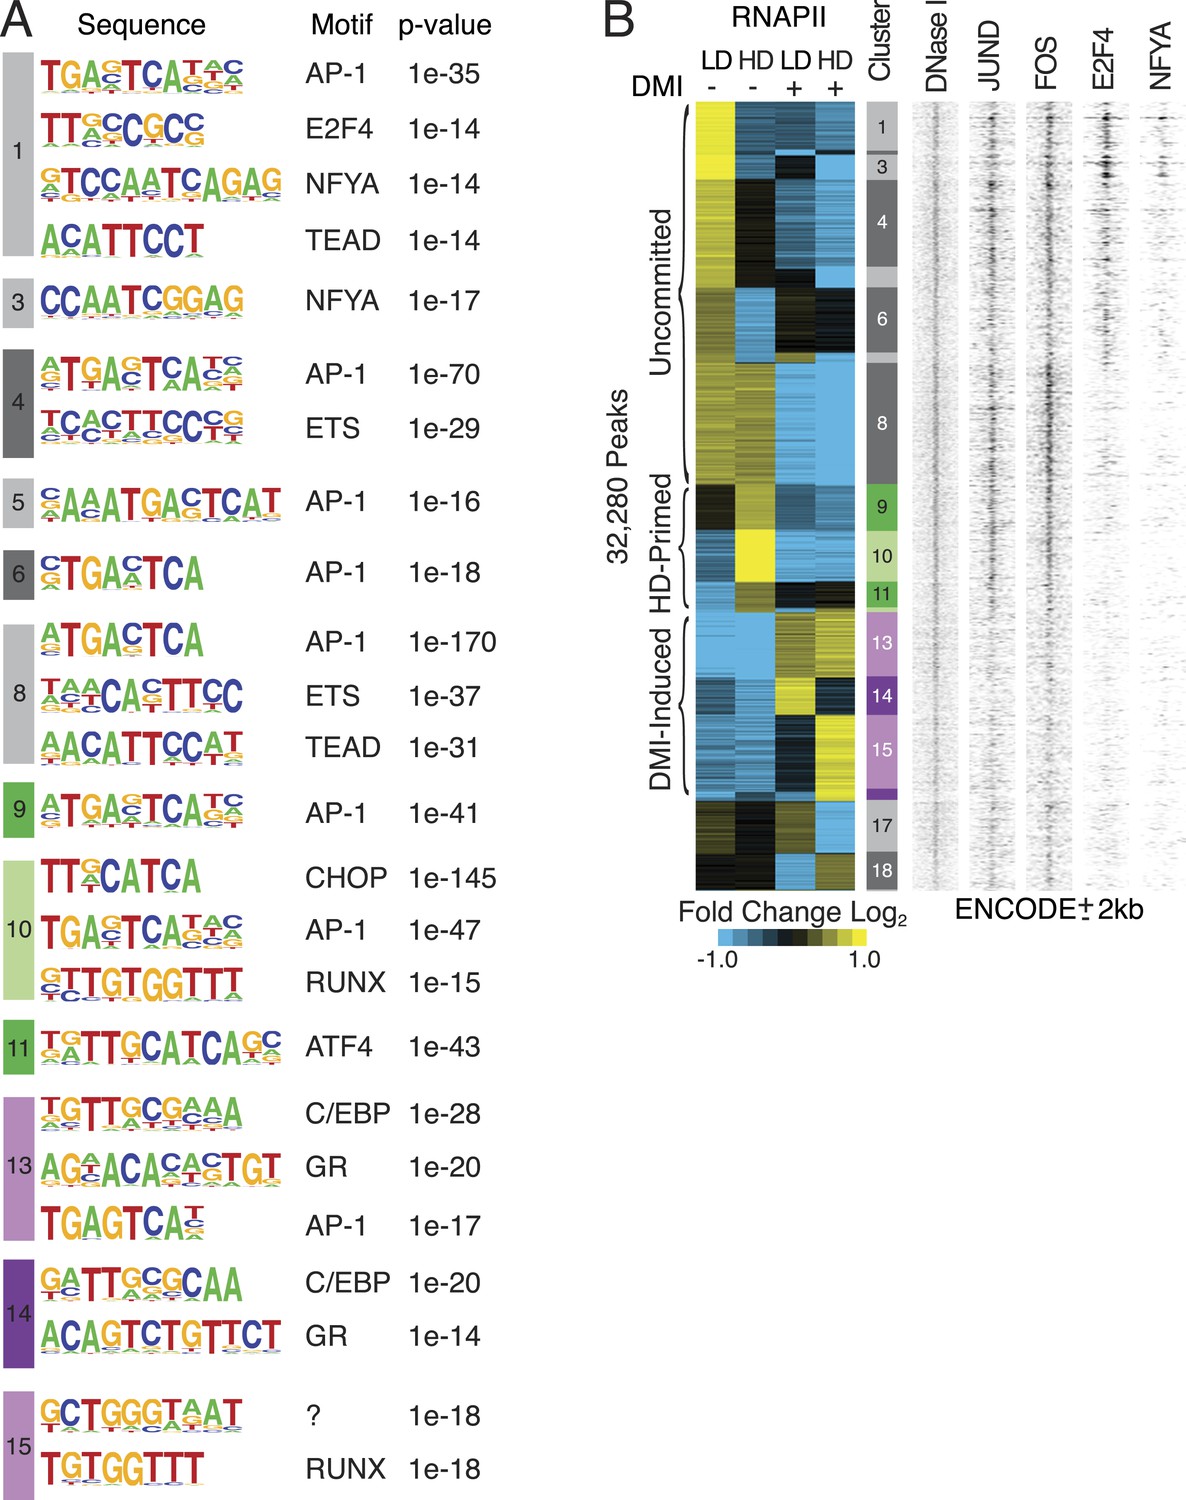
Characterization of RNAPII-annotated enhancers.
(A) Identification of de novo motifs in differential RNAPII clusters; reported sequences met detection thresholds of at least 5% of targets and p-value ≤ 1e-14. Note the striking enrichment in clusters 1 and 3 of E2F4 and NF-YA, transcription factors (TFs) with well-established roles in controlling cell cycle progression (Lukas et al., 1996; Benatti et al., 2011; Lee et al., 2011; Fleming et al., 2013), as well as the identification of C/EBP and GR motifs in the DMI-induced clusters. (B) Density heat maps of ENCODE marks at differential RNAPII clusters implying occupancy of motifs by their cognate factors such as AP-1, E2F and NF-YA within the uncommitted clusters.
Figure 1—figure supplement 2
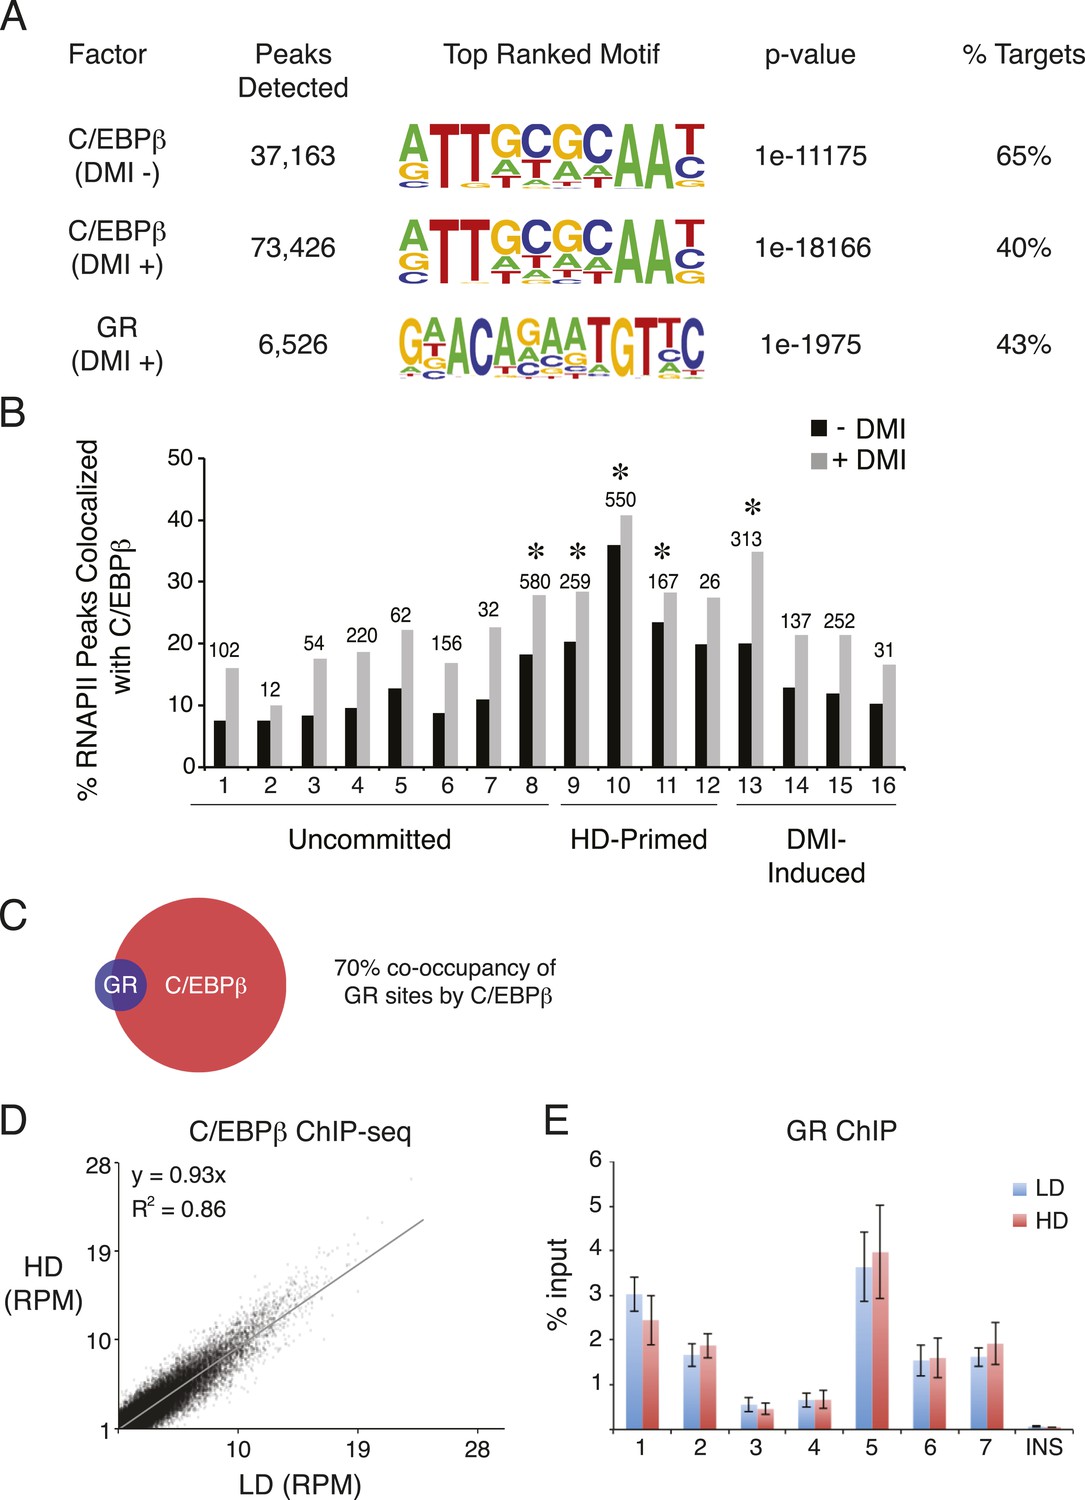
C/EBPβ and GR ChIP-seq in hMSCs.
(A) Summary of ChIP-Seq peak calls and de novo motif analyses (HOMER) for C/EBPβ and GR from hMSCs cultured at HD either in the absence or presence of DMI cocktail for 6 hr. (B) Bar graph of differential RNAPII peaks co-localized with C/EBPβ in the presence or absence of DMI, as a function of RNAPII cluster. Absolute number of RNAPII/CEBPβ co-occupied peaks in the absence of DMI treatment is indicated above each bar. *, indicates hypergeometric p-value ≤ 5 × 10⁻⁶ comparing cluster-specific C/EBPβ co-occupancy to the average co-occupancy across all clusters for the DMI-negative condition. Enrichment for C/EBPβ was also statistically significant in the presence of DMI for clusters 8, 10, and 13. (C) Venn diagram showing overlap between the cistromes of GR and C/EBPβ in DMI-treated hMSCs. (D) Scatterplot comparing sequence tags from C/EBPβ ChIP-seq peaks identified in low (LD) and high (HD) density hMSCs treated with DMI for 6 hr. C/EBPβ-binding strength is highly correlated for the two conditions. (E) GR ChIP in DMI-treated hMSCs comparing LD to HD cells at 7 genomic sites and a non-specific control (INS).
Figure 2
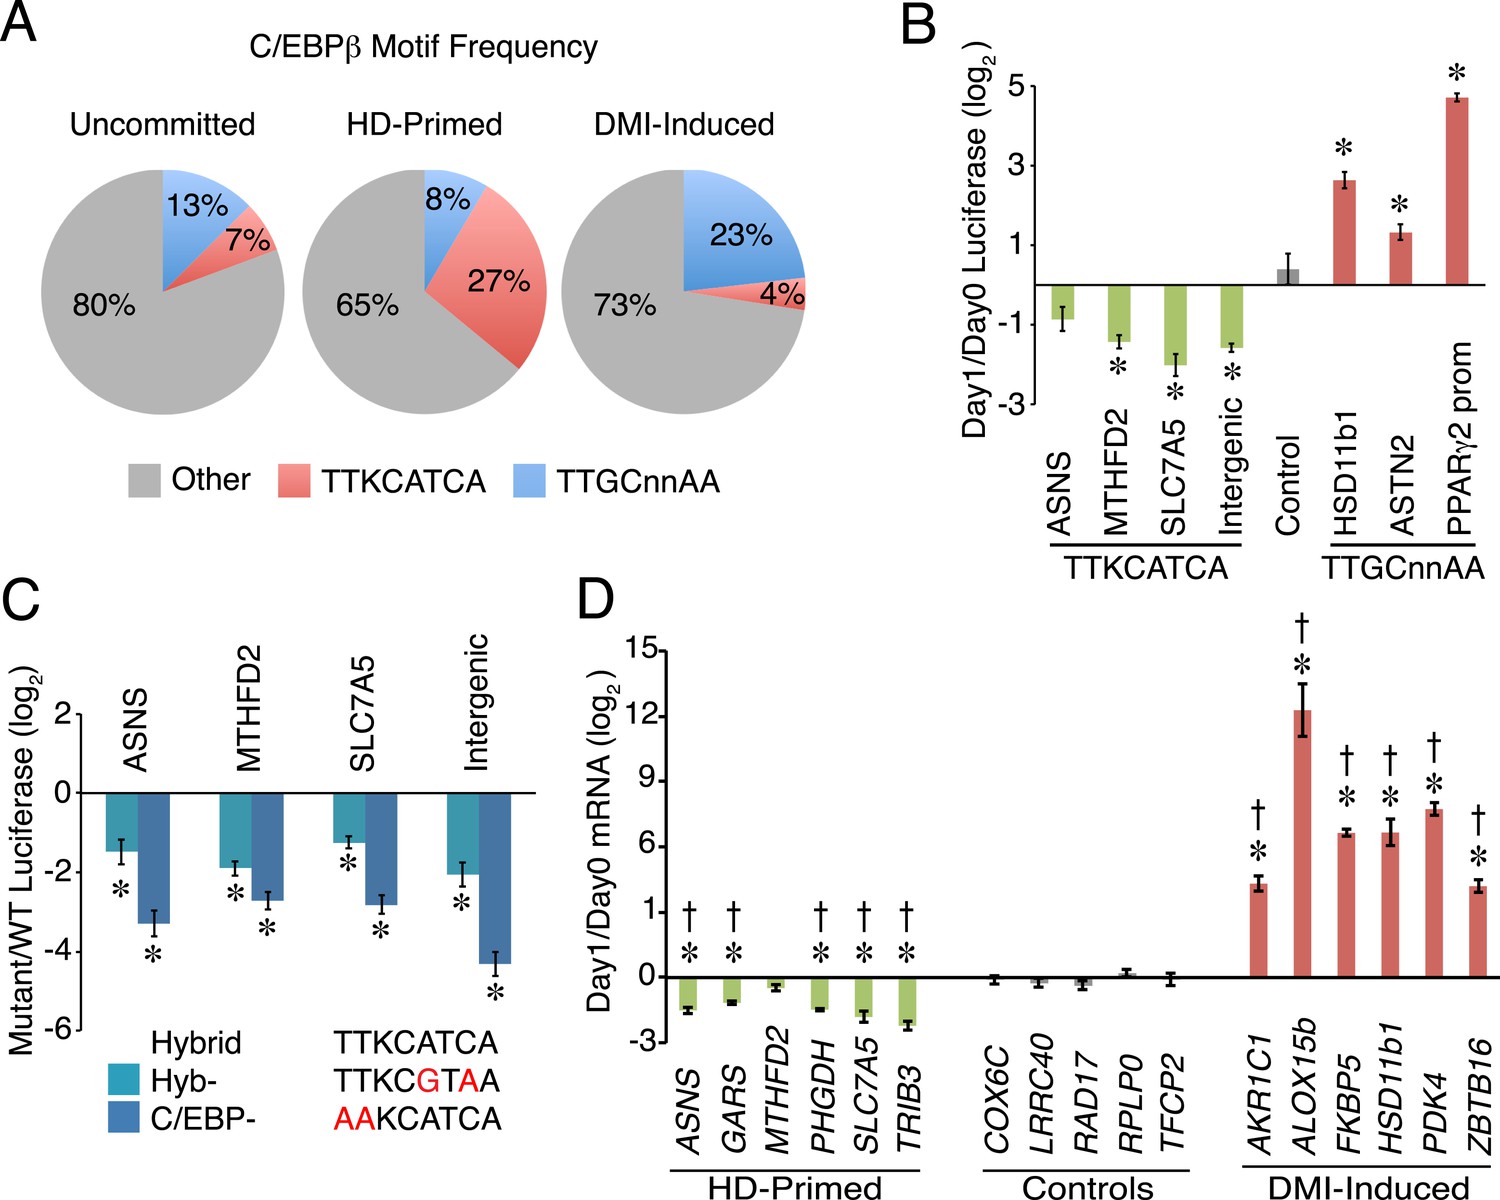
A non-canonical C/EBP motif mediates transcription at HD-primed enhancers.
(A) Pie charts comparing the frequency of hybrid (red) vs canonical C/EBP (blue) motifs present at RNAPII-C/EBPβ co-bound sites at stage-specific enhancers. (B) C/EBPβ enhancers harboring hybrid (green) or canonical C/EBP (red) motifs were assayed by a luciferase reporter in the absence (day 0) or presence (day 1) of DMI cocktail in C3H10T1/2 cells. (C) Mutations disrupting the hybrid motif specifically (cyan) or C/EBP motif generally (blue) were assayed by a luciferase reporter in basal medium in C3H10T1/2 cells. (D) Gene expression was assayed for genes associated with C/EBPβ enhancers containing hybrid (green) or canonical C/EBP motifs (red), and in a panel of endogenous control genes (gray), in DMI-treated (day 1) vs untreated (day 0) hMSCs. *, denotes p < 0.05, Student's t-test comparing stimulated vs unstimulated or mutant vs WT; †, denotes p < 0.002, comparison of fold changes between stage-specific enhancers vs endogenous controls, Mann–Whitney test. Error bars depict SEM.
Figure 3 with 1 supplement
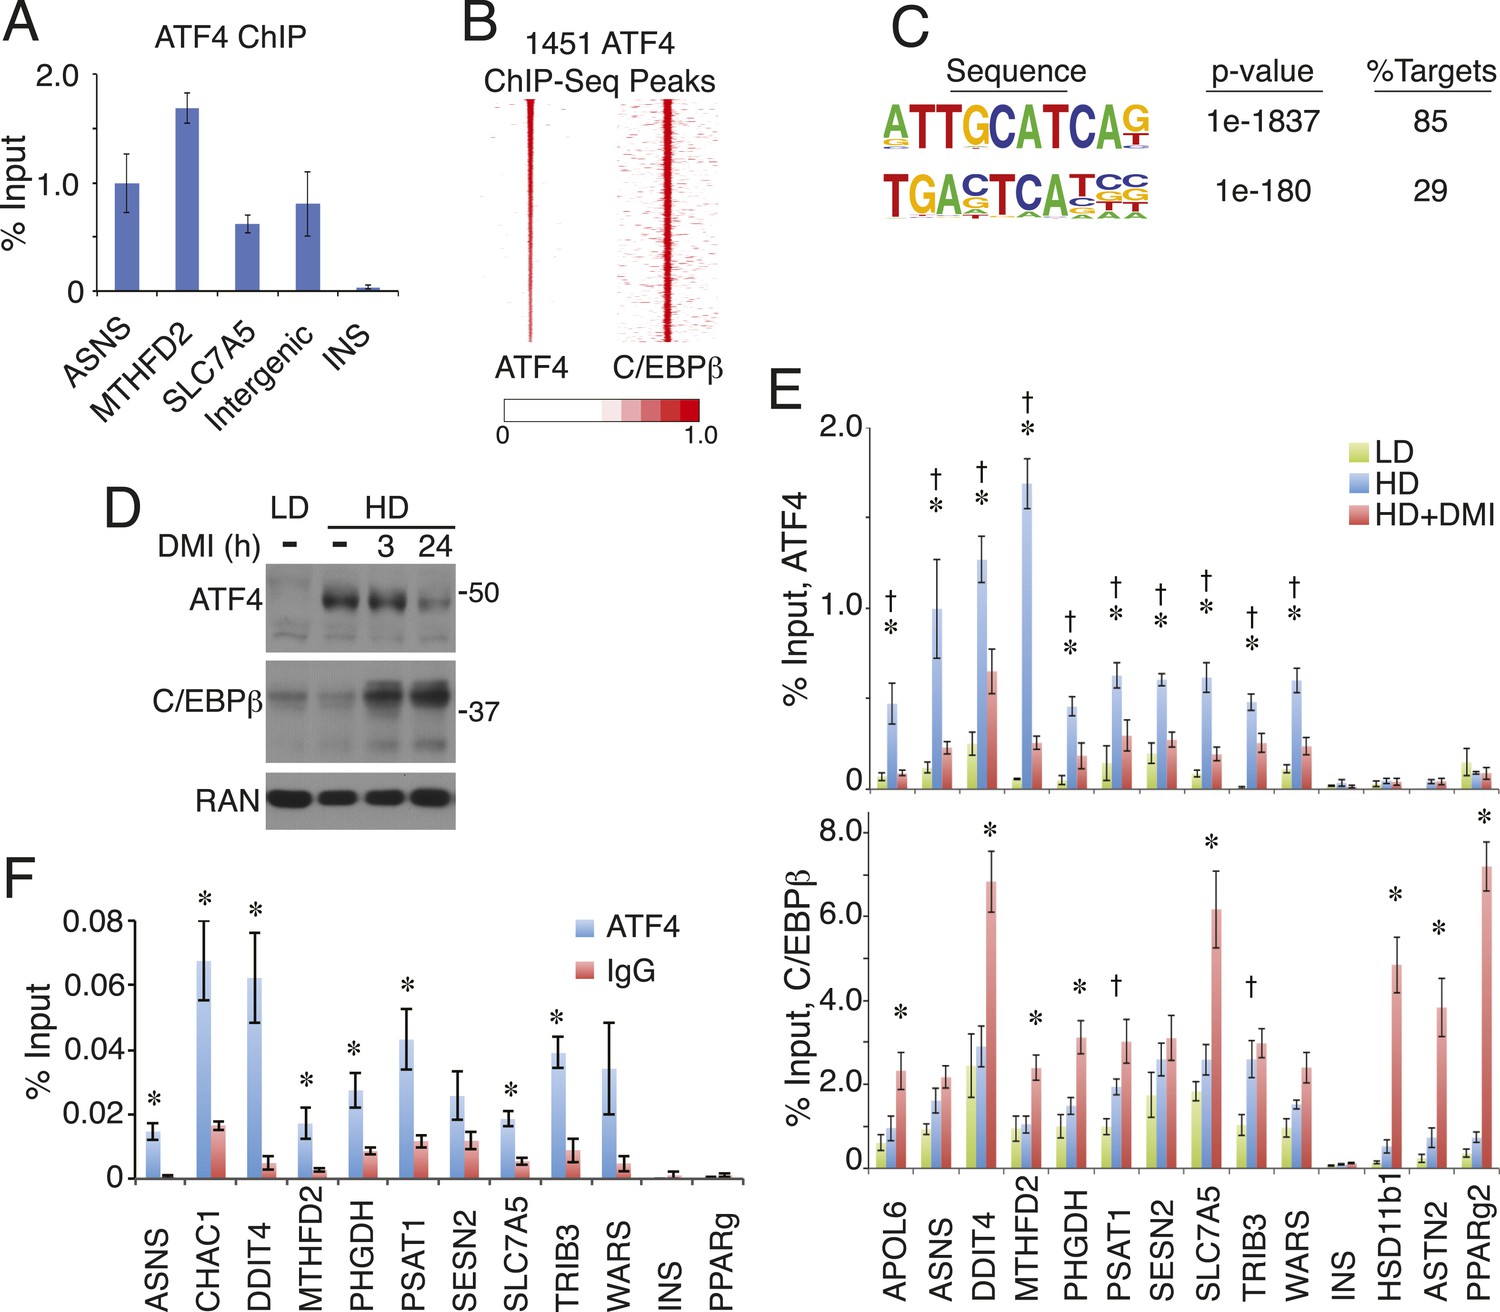
ATF4 is a density-regulated factor that binds to HD-primed enhancers as a heterodimer with C/EBPβ.
(A) ATF4 ChIP in high density (HD) hMSCs interrogating genomic loci that contain the hybrid motif vs non-specific control (INS). (B) Density heat map anchored on ATF4 ChIP-seq peaks to examine co-distribution with C/EBPβ on a genome-wide scale in HD hMSCs. (C) De novo motif analysis of ATF4 ChIP-seq peaks. (D) Changes in ATF4 and C/EBPβ protein levels assessed by Western blotting during adipogenic differentiation. MW markers, 50 and 37 kDa. (E) Bar graphs of ATF4 (top) and C/EBPβ (bottom) occupancy at hybrid or canonical motifs in hMSCs cultured at low (green bars) or high (blue bars) seeding density in the absence of DMI or following 24 hr of treatment (red bars). *, denotes p < 0.05, Student's t-test comparison of HD samples with vs without DMI treatment; †, denotes p < 0.05, Student's t-test comparison of LD vs HD samples without DMI treatment. (F) Sequential ChIP of C/EBPβ followed by ATF4 or IgG to interrogate simultaneous occupancy of both factors at hybrid motifs. *, denotes p < 0.05 for a one-tailed Student's t-test. Error bars depict SEM.
Figure 3—figure supplement 1
Characterization of ATF4-binding sites.
(A) bZip TF ChIP in HD hMSCs interrogating the same genomic loci from Figure 3A. With the exception of insulin (INS), each target carries a hybrid motif and is occupied by ATF4. (B) Top-ranked GOs from mapping ATF4-binding sites to nearby genes. (C) Percent of ATF4 or C/EBPβ sites co-localized with or without RNAPII in HD hMSCs. Co-bound sites were further subdivided into those with or without changed RNAPII occupancy during adipogenesis. (D) Density heat map of ATF4 occupancy in HD hMSCs juxtaposed against the differential RNAPII clusters and C/EBPβ and GR datasets from Figure 1A. Heat map color bar refers C/EBPβ tracks. Maximum signal intensity set to 0.5 for GR and 0.25 for ATF4 to facilitate visualization.
Figure 4 with 1 supplement

ATF4 promotes adipocyte differentiation and density-dependent transcription.
(A) ATF4 knockdown in hMSCs and 3T3-L1 pre-adipocytes assessed by western blotting. RAN, loading control. (B) hMSCs (top) and 3T3-L1 cells (bottom) were transfected with siATF4 RNA duplexes or control sequences, and assessed for lipid droplet formation following 1 week of adipogenic differentiation. Top images, Oil Red O staining at the level of individual cells (hMSCs) or for an entire well of a 6-well plate (3T3-L1s). Bottom panel, phase contrast images. (C) HD hMSCs were transfected with control (PPIB) or ATF4 siRNAs and assayed for mRNA expression of early adipogenic markers at days 0 (HD) and 3 (HD+DMI) of differentiation. Expression was normalized to the maximum level for the control siRNA. (D) Changes in ATF4 (top), RNAPII (middle) and C/EBPβ (bottom) occupancy as a function of ATF4 knockdown assessed by ChIP in undifferentiated hMSCs cultured at high seeding density. *, denotes p < 0.05. Error bars depict SEM.
Figure 4—figure supplement 1
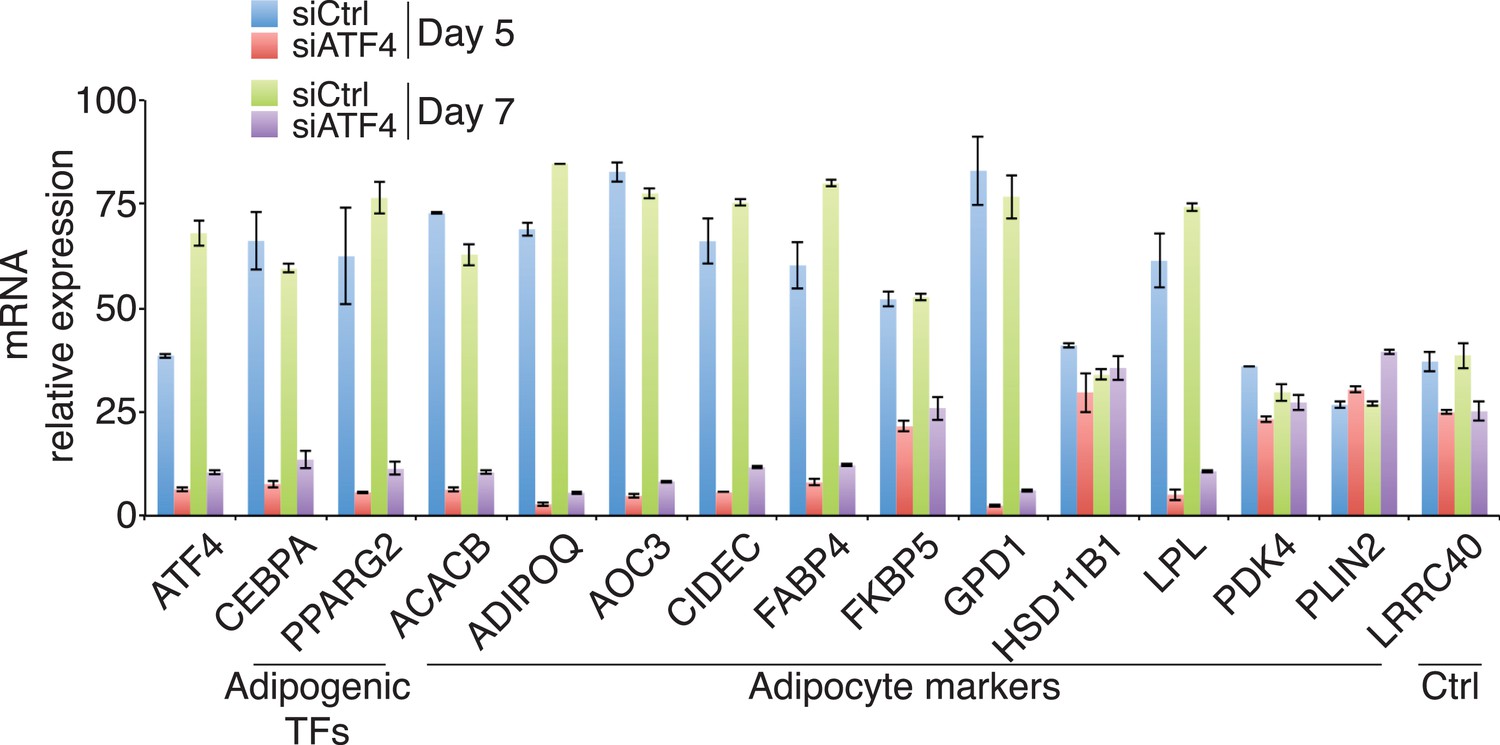
Gene expression in ATF4 knockdown cells.
Adipogenic gene expression assayed following DMI treatment for 5 or 7 days of hMSCs transfected with siRNAs targeting PPIB (control) or ATF4. The average of two biological replicates is shown. Error bars denote the range of the data.
Figure 5 with 1 supplement

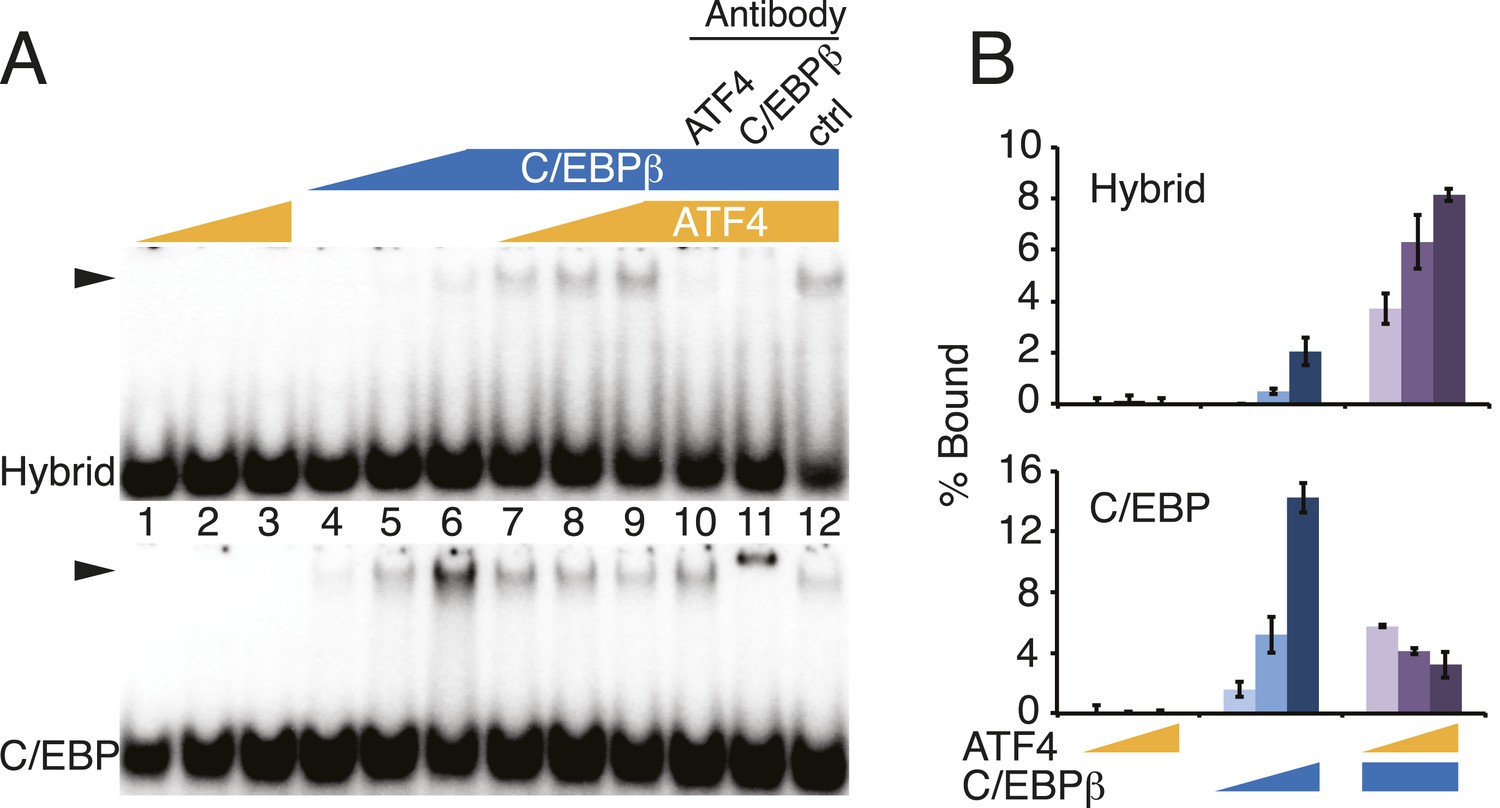
Distinct DNA-binding activities for ATF4, C/EBPβ and the C/EBPβ-ATF4 heterodimer.
(A) EMSA probe design for the hybrid and C/EBP sequences. Motifs are capitalized. (B) Silver-stained SDS-PAGE of recombinant his-tagged ATF4 and C/EBPβ. Arrowheads indicate the expected MWs for the tagged constructs. (C and D) EMSA titration of ATF4 (10, 30 and 90 μM) and C/EBPβ (100, 300 and 900 nM) with 0.25 nM of either the hybrid (C) or C/EBP (D) radiolabeled probe. Bar graphs show phosphoimager-based quantification of bound complexes relative to free probe.
Figure 5—figure supplement 1
DNA-binding activities for ATF4, C/EBPβ and the C/EBPβ-ATF4 heterodimer.
(A) EMSA titration of ATF4 (2, 6 and 18 μM) and C/EBPβ (50, 150 and 450 nM) with 0.25 nM of either the hybrid (upper) or C/EBP (lower) radiolabeled probe. Antibody controls show a supershift for the C/EBPβ homodimer, however are inhibitory for DNA binding by the C/EBPβ-ATF4 heterodimer. Antibodies were added to recombinant proteins prior to the addition of probe. Arrowheads indicate gel–shift complexes. (B) Bar graphs quantifying probe binding from two independent EMSA experiments; error bars depict the data range.
Figure 6 with 1 supplement
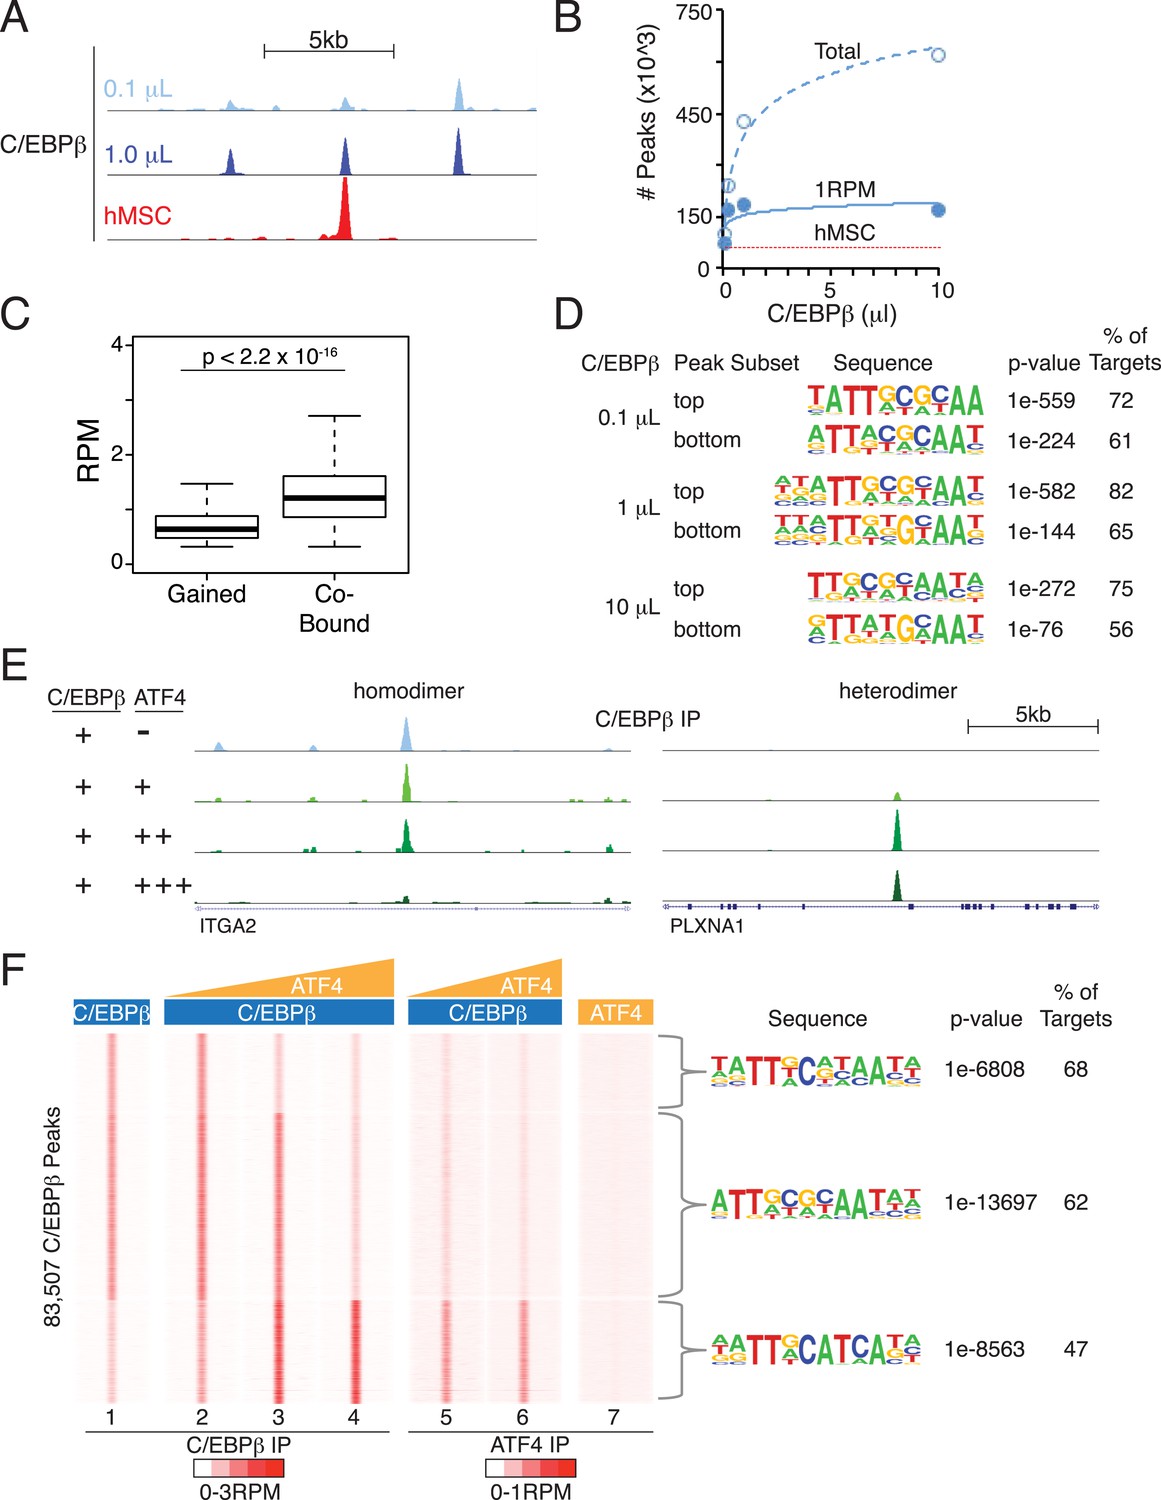
Heterodimer formation with C/EBPβ is necessary for ATF4 binding and is sufficient to alter C/EBPβ-sequence specificity.
(A) Browser shot comparing C/EBPβ peaks from the in vitro cistromics assay (IVC) and hMSC ChIP-seq. 0.1 and 1 μl C/EBPβ molarity equivalents in the initial binding reaction are ∼60 and 600 nM, respectively. Tracks are RPM normalized, y-axes scaled from 0–3 (in vitro) and 0–5 (hMSC). (B) In vitro ChIP-seq peaks total vs a 1 RPM threshold, plotted as a function of C/EBPβ titration (0.1, 0.25, 1 and 10 μl). Total C/EBPβ peaks found in hMSCs (red line) is included for point of comparison. (C) Box plot of peak strength in the 10 μl C/EBPβ cistrome comparing gained vs co-bound sites. The co-bound fraction met a 0.5 RPM threshold in all C/EBPβ homodimer cistromes. (D) Motif enrichment for the strongest- and weakest-1000 sites of the C/EBPβ cistromes. (E) Browser shots of C/EBPβ peaks upon titration of ATF (0.1, 1 and 10 μM) with C/EBPβ (60 nM). Tracks are RPM normalized, 0–3 RPM scale on the left panel, 0–20 RPM on the right. (F) K-means clustered density heat maps of C/EBPβ occupancy as a function of ATF4 titration. Titration of ATF4 (0.1, 1 and 10 μM, C/EBPβ IP; 1 and 10 μM, ATF4 IP) with C/EBPβ (60 nM) is indicated. ATF4 homodimer binding was examined with 250 μM protein. Peaks thresholded to meet 1 RPM in at least two C/EBPβ cistromes. Three discrete clusters were identified and the de novo motif enrichment was based on all sites in each cluster.
Figure 6—figure supplement 1

Characterization of binding associated with either in vitro-selective C/EBPβ sites or ATF4 homodimers.
(A) Average profile plot of H3K27ac in hMSCs at sites bound by C/EBPβ in hMSCs or in vitro only (0.1 μl cistrome). (B) De novo motif enrichment at 111 peaks identified in the ATF4 homodimer cistrome. Top two motifs shown. (C) Blocks diagram showing multimerization of motifs at ATF4 homodimer peaks.
Figure 7
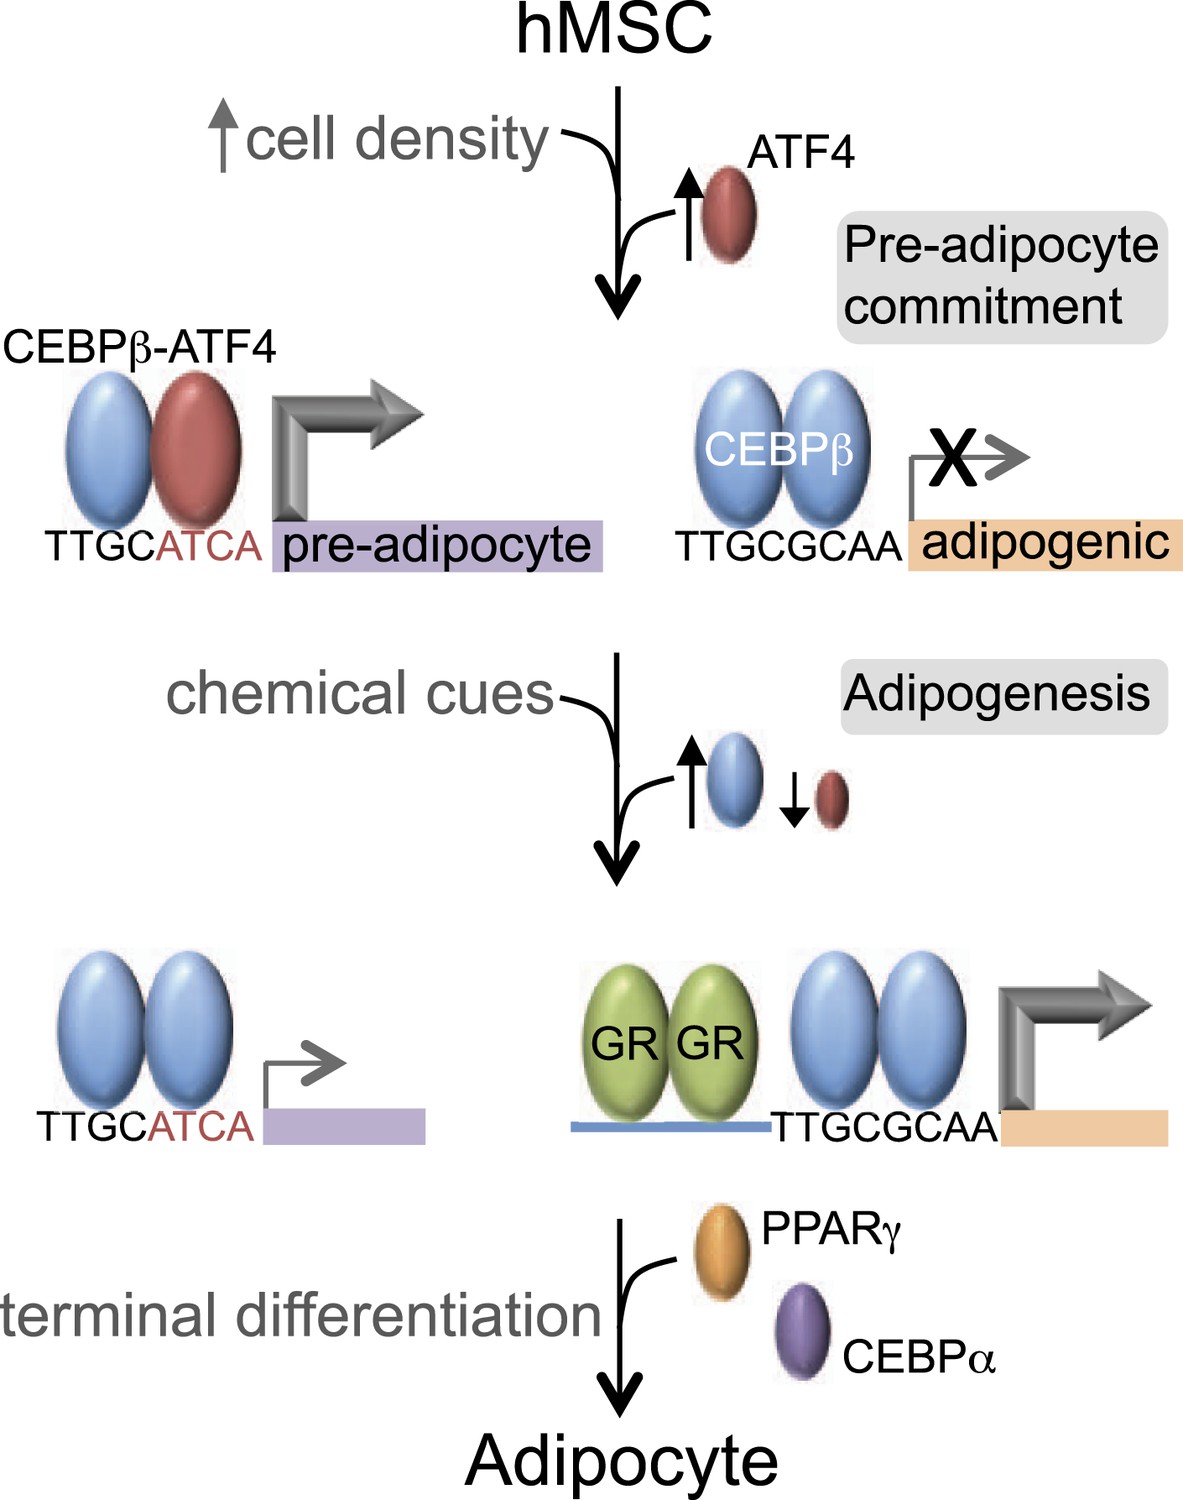
C/EBPβ controls distinct gene expression programs in hMSCs.
Cell density regulates ATF4 expression to control C/EBPβ-ATF4 heterodimer formation. Prior to DMI treatment, heterodimer binding to hybrid motifs promotes a gene expression program priming hMSCs for adipogenesis. In this basal state, C/EBPβ is a poor transcriptional activator. In response to DMI, ATF4 level decreases, C/EBPβ level and GR activity increase. C/EBPβ initiates a program of transcription at new genes to orchestrate adipocyte differentiation with cooperating factors such as GR.
Author response image 1
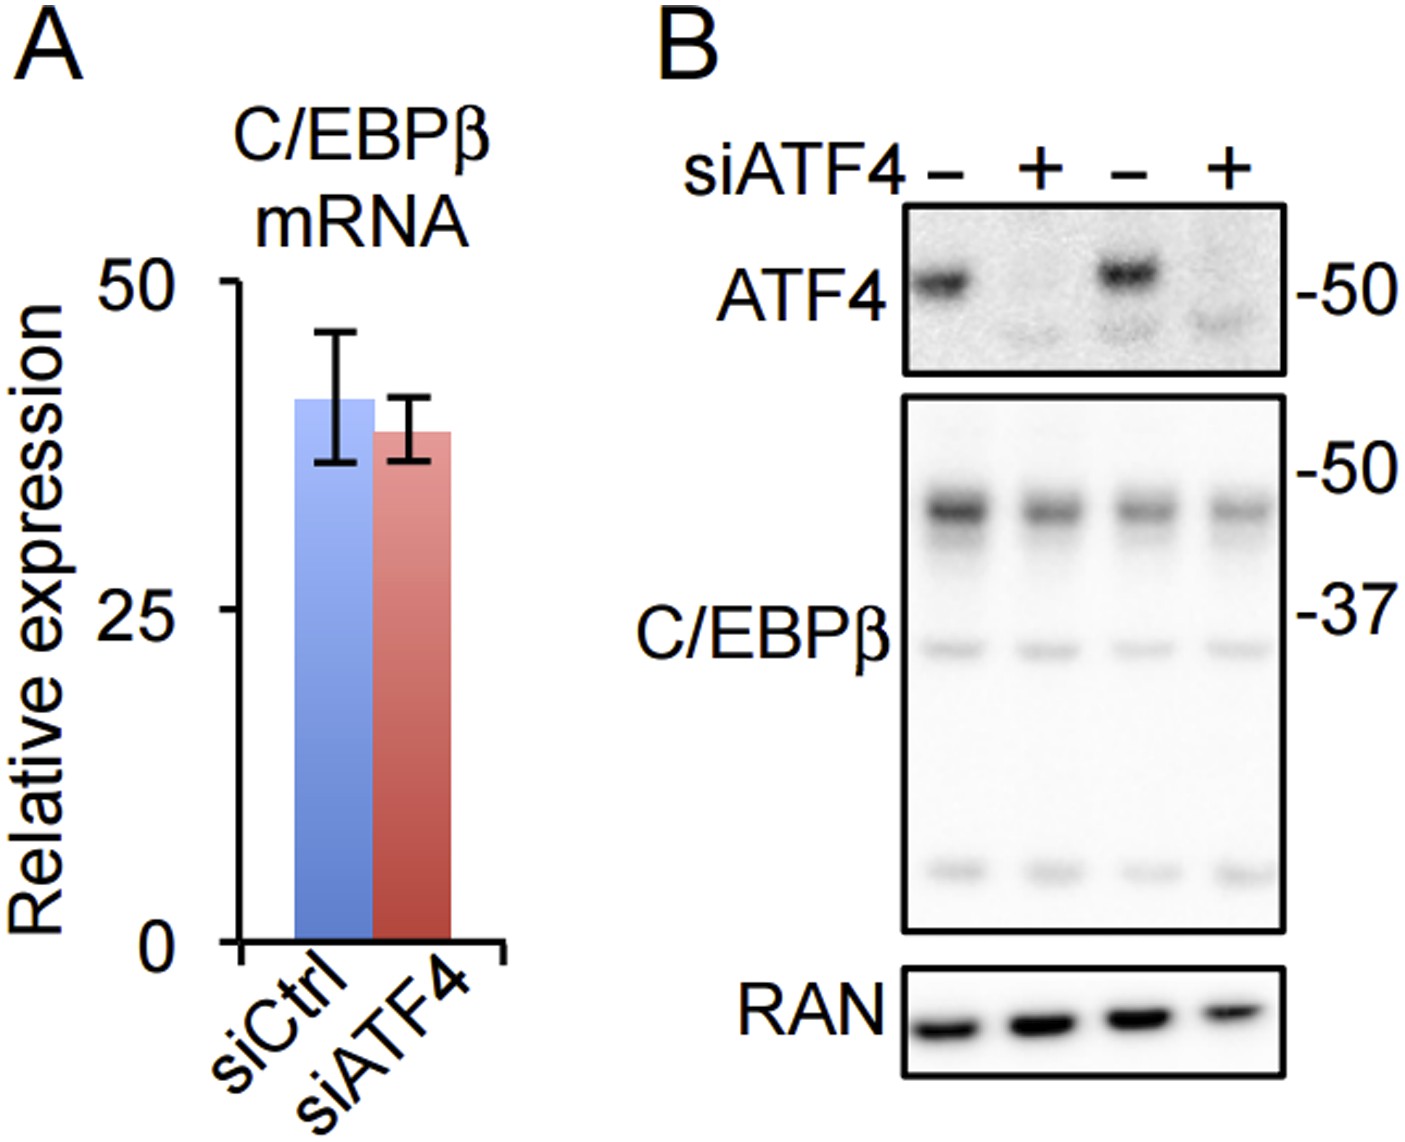
(A) C/EBPβ gene expression in HD hMSCs treated with control (PPIB) or ATF4 siRNAs. Error bars depict SEM. As shown in Figure 4C, ATF4 mRNA is dramatically reduced by the treatment. (B) ATF4 knockdown in HD hMSCs assessed by western blotting for two biological replicates. RAN, loading control.
Author response image 2

CEBPβ (green) and ATF4 (yellow) ChIP-seq tracks in HD hMSCs. Tracks are RPM normalized and presented with the same y-axis scale (0 - 5).
Additional files
-
Supplementary file 1
Gene Lists Associated with Gene Ontology Analysis, Related to Figure 1. RNAPII regions were mapped to nearby genes using GREAT (McLean et al., 2010). RNAPII occupancy was scored for each gene as a function of cell density and DMI treatment and genes showing correlated changes between an RNAPII peak and the entire gene locus were submitted to DAVID (Dennis et al., 2003) for Gene Ontology (GO) analysis (Panther and KEGG Pathways). Spreadsheets list RNAPII differential regions mapped to genes (‘by Enhancer’), with distance to the transcription start site (TSS), and accompanying GO Terms and RNAPII cluster designation (see Figure 1A), as well as contain summary lists of all differential regions associated with each gene (‘by Gene’), and all genes associated with each GO Term (‘by GO Term’).
- https://doi.org/10.7554/eLife.06821.016
-
Supplementary file 2
Oligonucleotides Used in the Study. Spreadsheets list PCR primers used to subclone candidate enhancers for luciferase assays, to examine first-strand cDNA for mRNA expression, and to interrogate ChIP DNA for TF occupancy.
- https://doi.org/10.7554/eLife.06821.017
Download links
A two-part list of links to download the article, or parts of the article, in various formats.
Downloads (link to download the article as PDF)
Open citations (links to open the citations from this article in various online reference manager services)
Cite this article (links to download the citations from this article in formats compatible with various reference manager tools)
ATF4 licenses C/EBPβ activity in human mesenchymal stem cells primed for adipogenesis
eLife 4:e06821.
https://doi.org/10.7554/eLife.06821


