Cis and trans RET signaling control the survival and central projection growth of rapidly adapting mechanoreceptors
- University of Pennsylvania, United States
- Max Planck Institute of Neurobiology, Germany
- Parkinson's Disease and Movement Disorder Center of Maryland, United States
Figures
Figure 1 with 3 supplements
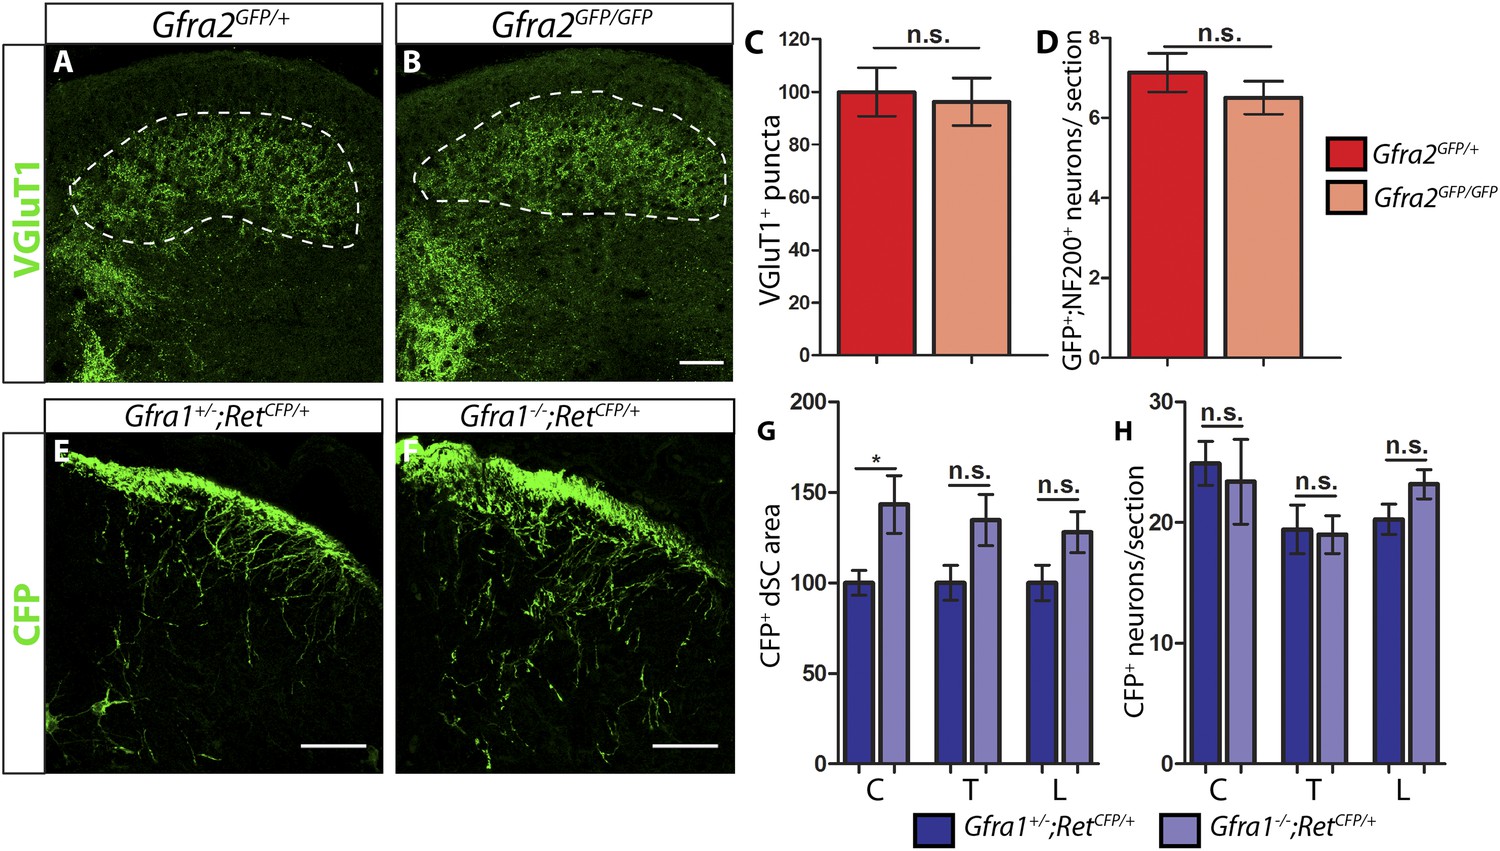
P7 Gfra2 mutant mice show normal dorsal spinal cord (dSC) VGLUT1 staining and Gfra1 null mice display normal rapidly adapting (RA) mechanoreceptor central projections at E13.5.
(A–B) Anti-VGLUT1 immunostaining of P7 SC sections from Gfra2GFP/+ control (A) and Gfra2GFP/GFP null (B) mice. VGLUT1 staining labels presynaptic terminals of mechanosensory neurons, which are found in layers III–V of the dSC (outlined in white). Note that green fluorescent protein (GFP) driven from the Gfra2 locus cannot be visualized directly. Therefore, positive signal indicates presynaptic VGLUT1+ puncta and not GFRa2+ primary afferent axons. (C) Quantification of VGLUT1+ puncta in dSC, which is displayed as a percentage of VGLUT1+ pixels compared to the control pixel count. The similar density of VGLUT1+ puncta between mutant and control tissue suggests that cis RET signaling via GFRa2 is dispensable for the growth of RA mechanosensory central projections at P7. (D) Quantification of GFP+;NF200+ neurons, which indicate RA mechanoreceptors, per DRG section. The non-significant decrease in RA mechanoreceptor number per section in Gfra2 nulls suggests that most RA mechanoreceptors are not dependent on cis RET signaling for survival. (E–F) Anti-GFP immunostaining of RA mechanoreceptor central projections in E13.5 Gfra1+/−;RetCFP/+ control (E) and Gfra1−/−;RetCFP/+ mutant (F) SC sections. The increased CFP signal in Gfra1 null dSC is likely due to the precocious expression of Ret in some dSC neurons of Gfra1 mutants. (G) Quantification of CFP+ pixel number in dSC. The lack of a reduction in CFP+ axons in Gfra1 mutant dSC indicates that trans signaling via GFRa1 is not required for the initial growth of RA mechanosensory third order central projections. (H) Quantification of number of CFP+ neurons per DRG section indicates no loss of RA mechanoreceptors in Gfra1 mutants at E13.5. C: cervical level, T: thoracic level, L: lumbar level. Scale bars = 50 μm. Error bars represent SEM. n.s. = p > 0.05, * = p < 0.05. Source data are provided in Figure 1—source data 1, 2.
-
Figure 1—source data 1
VGLUT1 dSC staining and RA mechanoreceptor number in P7 Gfra2 mutants.
- https://doi.org/10.7554/eLife.06828.004
-
Figure 1—source data 2
RA mechanoreceptor central projections and cell number in E13.5 Ret, Gfra1, Gfra2, and Nrtn mutants.
- https://doi.org/10.7554/eLife.06828.005
Figure 1—figure supplement 1
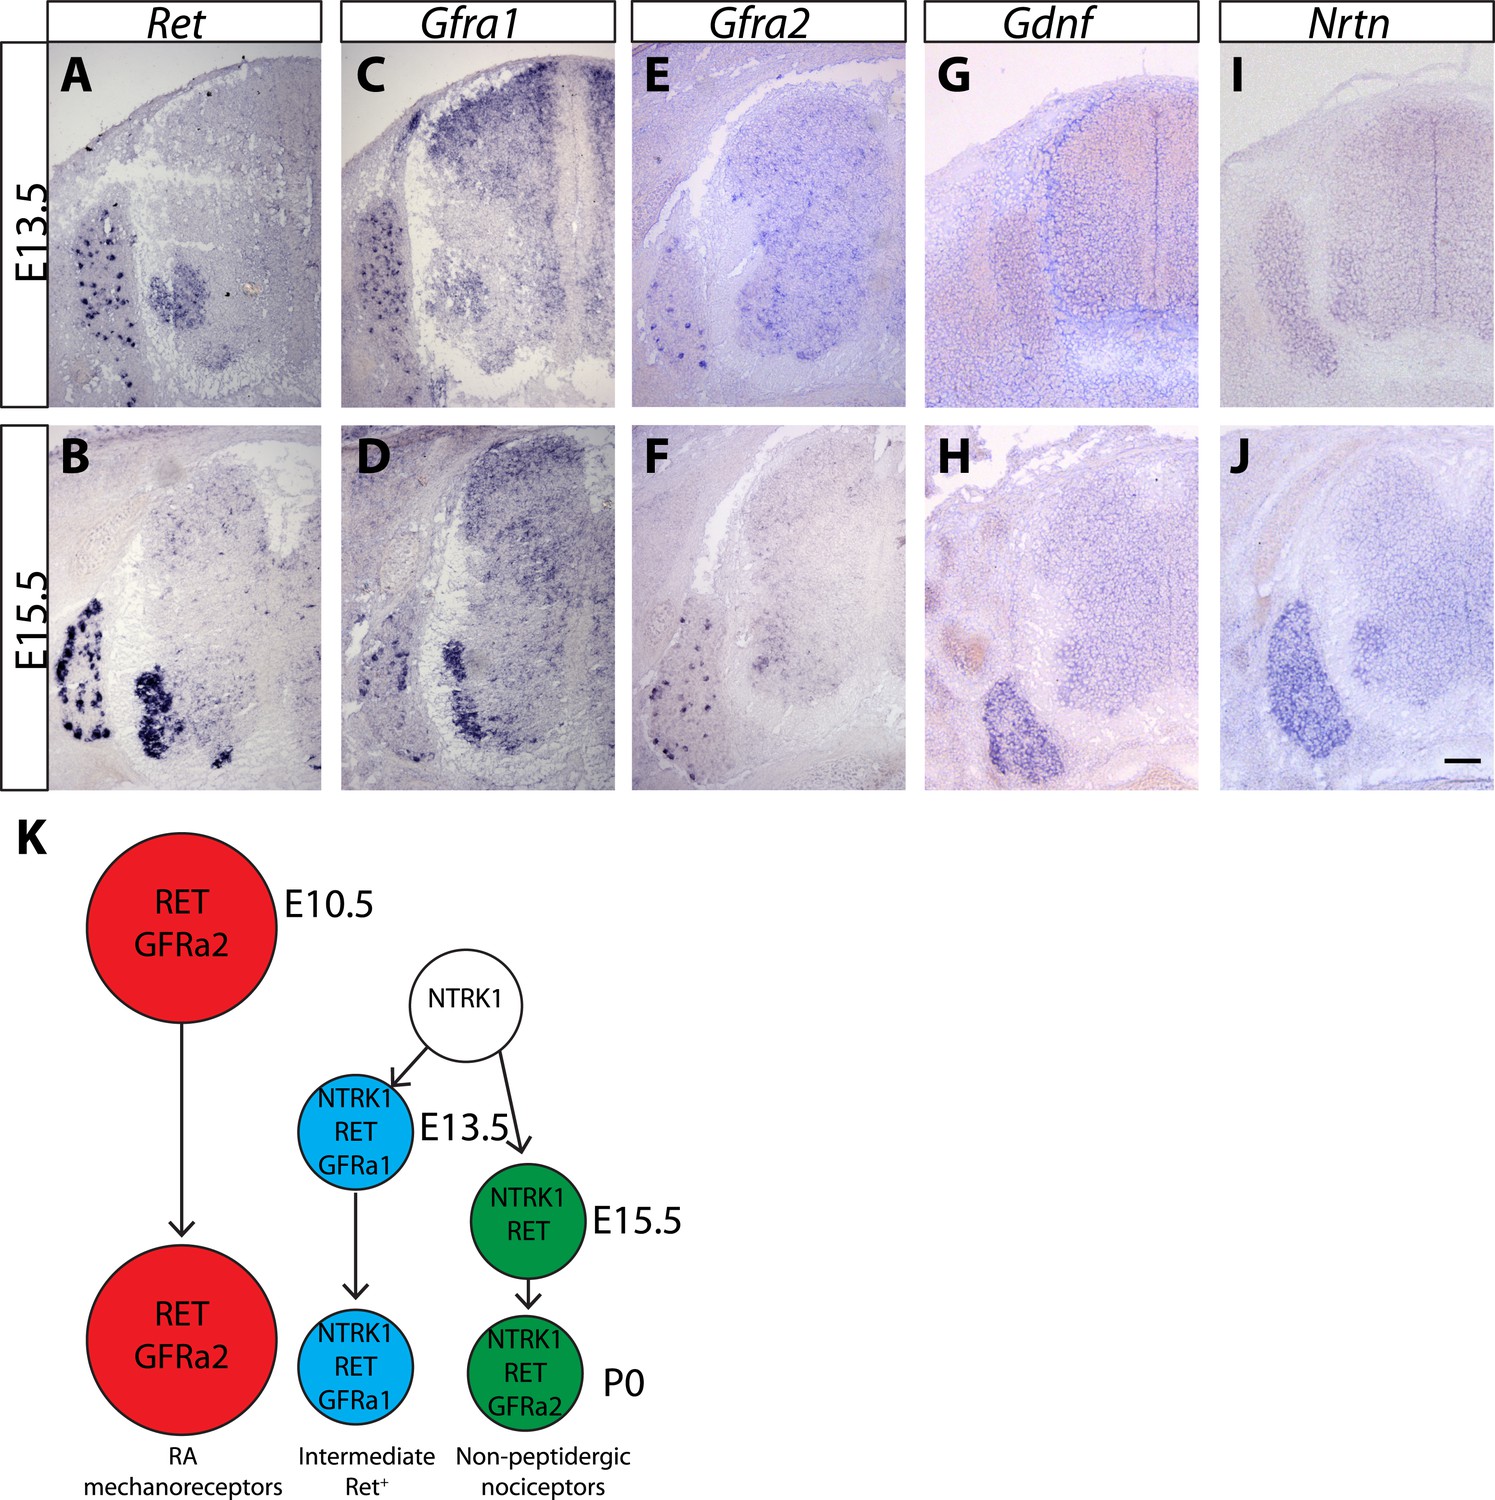
Expression of Ret, Gfras, and Gfls in developing spinal cord (SC) and DRG.
(A–J) In situ hybridization of mouse SC and DRG at E13.5 and E15.5 for Ret (A–B), Gfra1 (C–D), Gfra2 (E–F), Gdnf (G–H), and Nrtn (I–J). Ret is expressed in DRG neurons and motor neurons at E13.5 and E15.5. Ret is also expressed in dSC from E15.5. Gfra1 is expressed in DRG neurons, motor neurons, dorsal root entry zone, and dSC at both stages. Note that expression of Gfra1 in the dorsal root entry zone and dSC is largely Ret independent. Gfra2 is expressed in large diameter DRG neurons and in motor neurons. Nrtn and Gdnf are barely detected in DRG and SC at E13.5 and display increased expression in DRGs at E15.5. (K) Schematic of temporal expression of Ret and Gfra co-receptors in DRG neurons, which is adapted from previous studies (Luo et al., 2007, 2009; Molliver et al., 1997). RA mechanoreceptors (red cells) are early RET+ DRG neurons, which begin to express Ret and Gfra2 from E10.5 or earlier. All other RET+ DRG neurons develop from NTRK1+ precursors and depend on NTRK1 signaling for their expression of Ret and Gfras. Intermediate RET+ neurons (blue cells) express Ret and Gfra1 from E13.5. The late RET+ non-peptidergic nociceptors express Ret from E15.5, and begin to express a low level of Gfra2 around P0. Scale bar = 100 μm.
Figure 1—figure supplement 2
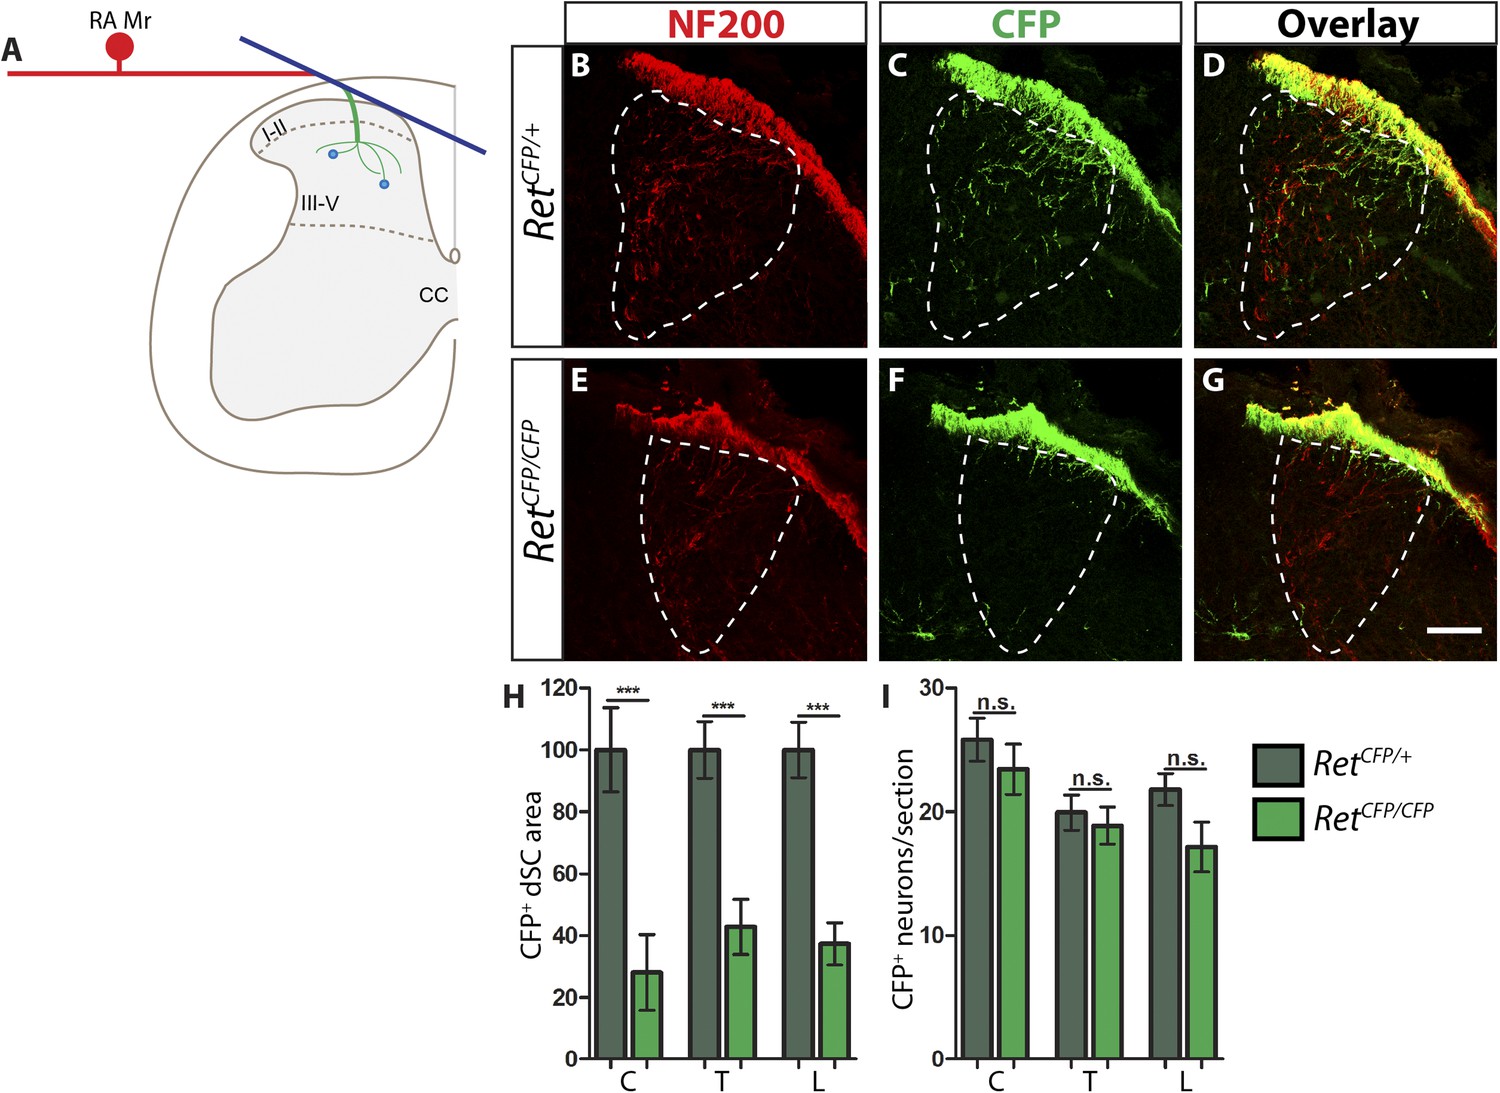
Ret is required for the growth of RA mechanosensory third order central projections at E13.5.
(A) Schematic of development of RA mechanosensory central projections. RA mechanoreceptors grow central and peripheral axons soon after neurogenesis, generating first order branches (red color). Upon reaching the dSC, the central axons bifurcate and send second order longitudinal branches rostrally and caudally (blue color). Around E13.5, third order interstitial projections (green color) from the longitudinal branches innervate layers III–V of the dSC and develop complex branching patterns. Synaptic connections between mechanoreceptors and dSC neurons (light blue dots) develop from E18.5. (B–G) Anti-NF200 and anti-GFP immunostaining of E13.5 RetCFP/+ (B–D) and RetCFP/CFP (E–G) SC. The dSC innervations of RA mechanosensory fibers are outlined by white dotted line. (H) Quantification of CFP+ pixel number in the dSC, which is displayed as a percentage of pixel number relative to control. There is a significant decrease in CFP+ axons innervating the SC in Ret mutants, suggesting that the initial growth of RA mechanosensory third order projections depends on RET signaling. (I) Quantification of the number of CFP+ neurons per DRG section. There is no significant change in the number of CFP+ neurons per DRG section, suggesting that there is no cell death or downregualtion of CFP expression in E13.5 Ret null RA mechanoreceptors. Scale bar = 50 μm. C = Cervical, T = Thoracic, L = Lumbar. Error bars represent SEM. n.s. = p > 0.05, *** = p < 0.001. Source data are provided in Figure 1—source data 2.
Figure 1—figure supplement 3
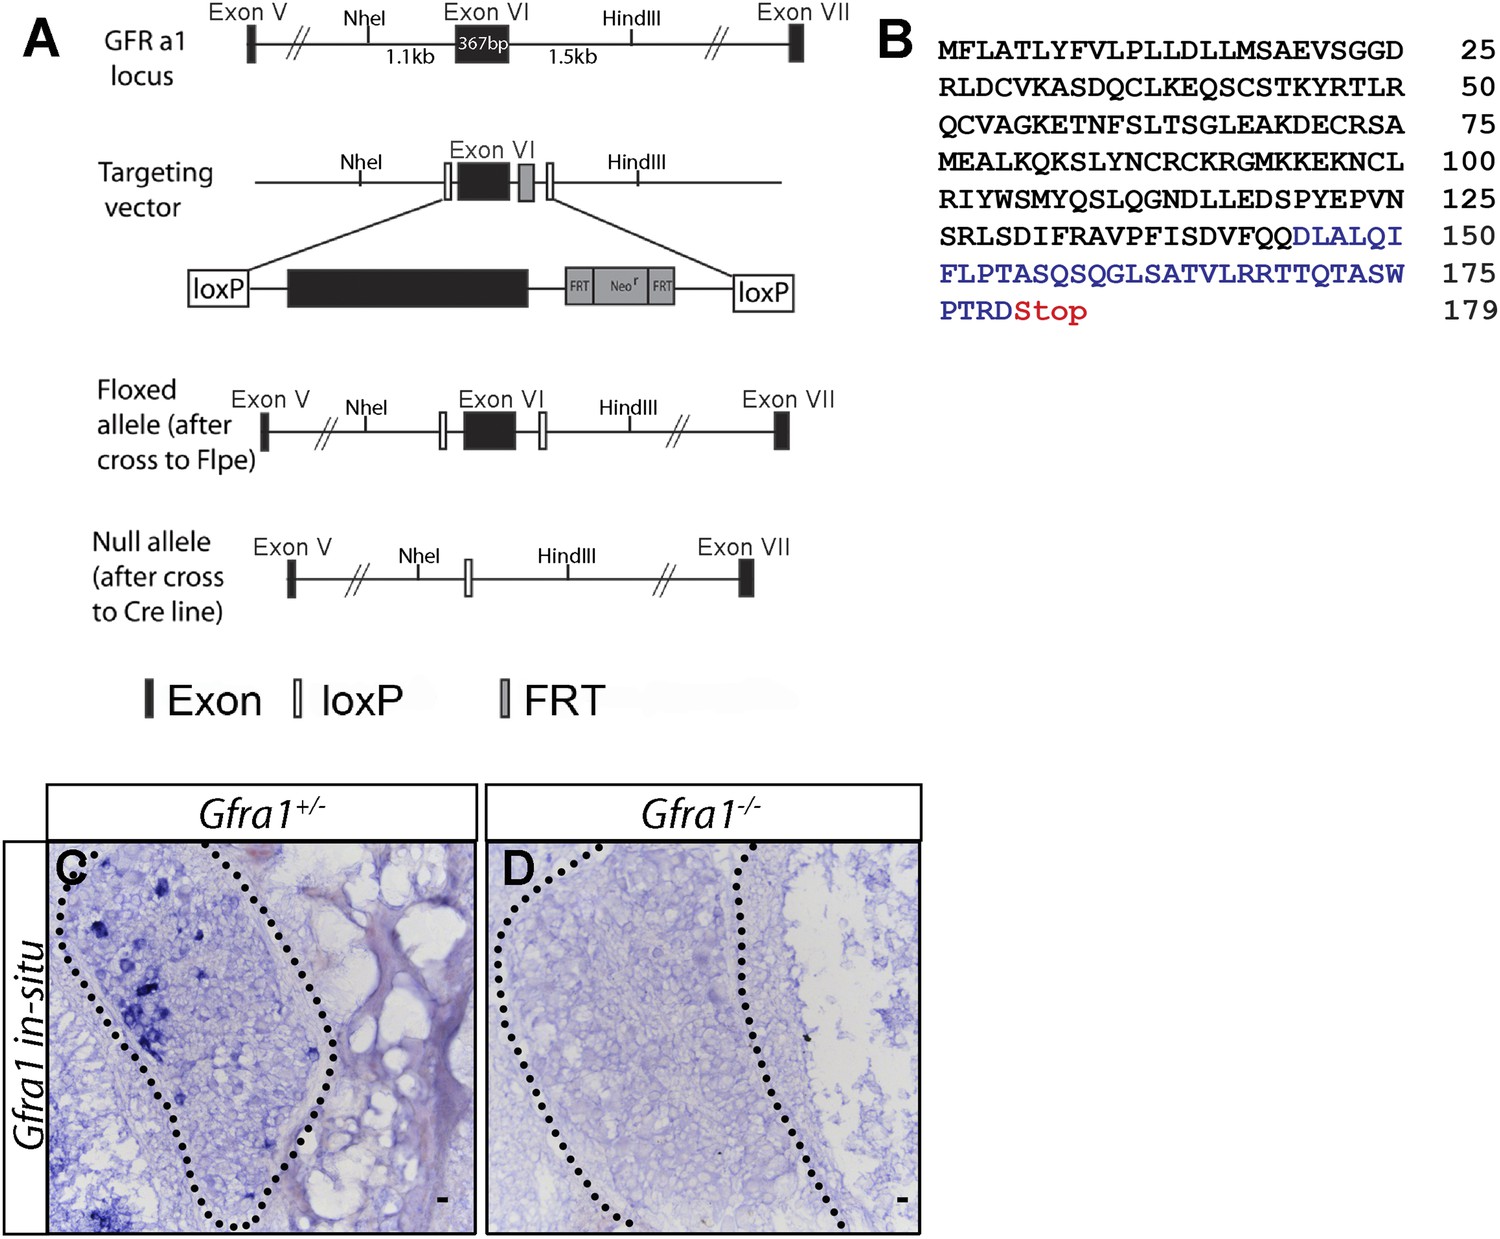
Generation of Gfra1 conditional and null alleles.
(A) Schematic of generation of Gfra1 conditional and null alleles. See supplemental ‘Materials and methods’ for additional details. (B) Predicted peptide sequence of the truncated GFRa1 protein after the excision of exon 6. Black letters represent amino acids which share identity with wild-type protein sequence. The loss of exon 6 causes a frame shift, leading to the inclusion of amino acids which do not match the wild-type sequence (blue letters). The frame shift also introduces a premature stop codon following amino acid 179. (C–D) In situ hybridization of Gfra1 in P0 Gfra1+/+ control (C) and Gfra1−/− null (D) DRG sections shows a complete loss of Gfra1 transcript in Gfra1 null tissue.
Figure 2
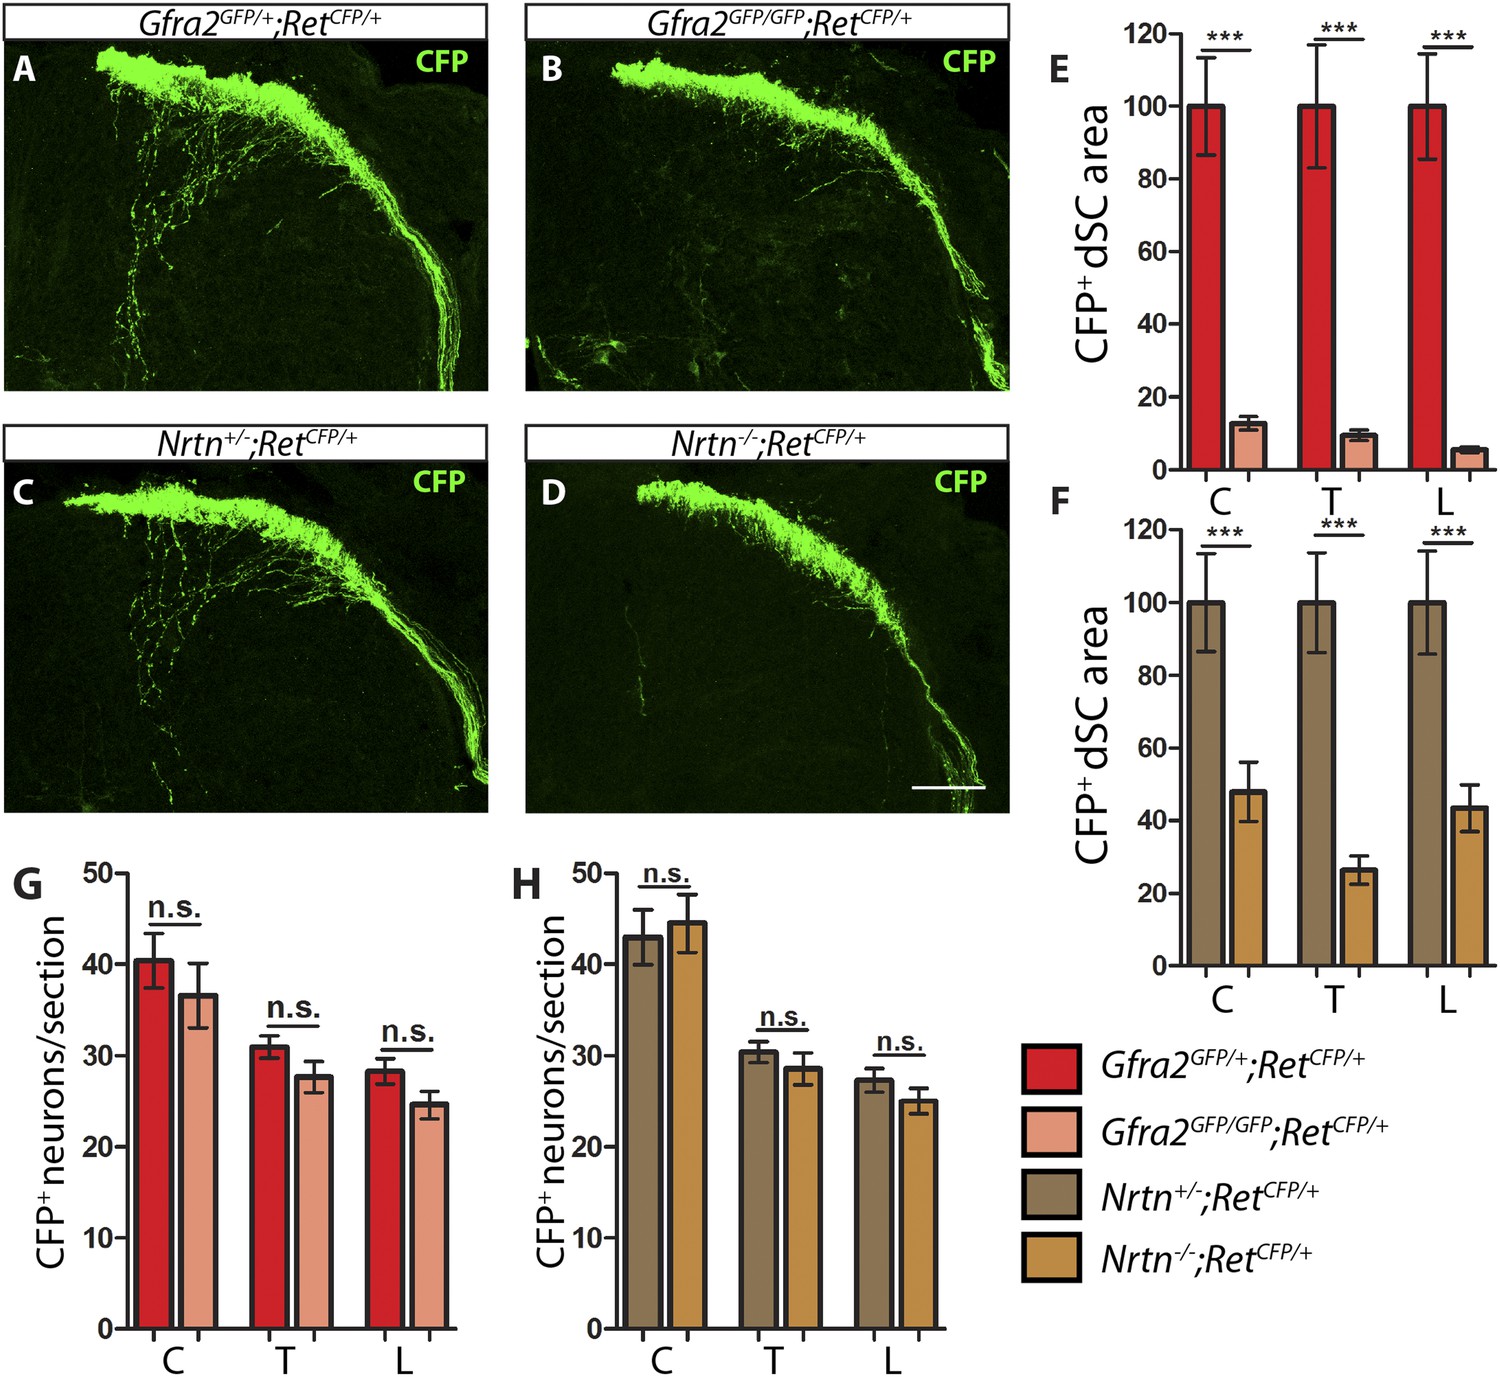
Gfra2 and Nrtn null mice show reduced RA mechanoreceptor central projections at E13.5.
(A–D) Anti-GFP immunostaining to visualize RA mechanosensory central projections in E13.5 dSC sections of Gfra2GFP/+;RetCFP/+ control (A), Gfra2GFP/GFP;RetCFP/+ mutant (B), Nrtn+/−;RetCFP/+ control (C), and Nrtn−/−;RetCFP/+ mutant (D) mice. (E–F) Quantification of CFP+ pixel number in dSC of Gfra2 (E) and Nrtn (F) mice. The dramatic reduction in CFP+ axons in Gfra2 and Nrtn nulls at E13.5 suggests that cis activation of RET is required for the initial growth of RA mechanosensory third order central projections. (G–H) Quantification of number of CFP+ neurons per DRG section in Gfra2 (G) and Nrtn (H) mice. Similar number of CFP+ DRG neurons between control and mutant mice indicates that cell death of RA mechanoreceptors or downregulation of RetCFP allele do not occur at E13.5 when cis RET signaling is ablated. Scale bar = 50 μm. Error bars represent SEM. n.s. = p > 0.05, ** = p < 0.01 *** = p < 0.001. Source data are provided in Figure 1—source data 2.
Figure 3 with 1 supplement
Central projection growth deficit of Gfra2 null RA mechanoreceptors at E15.5.
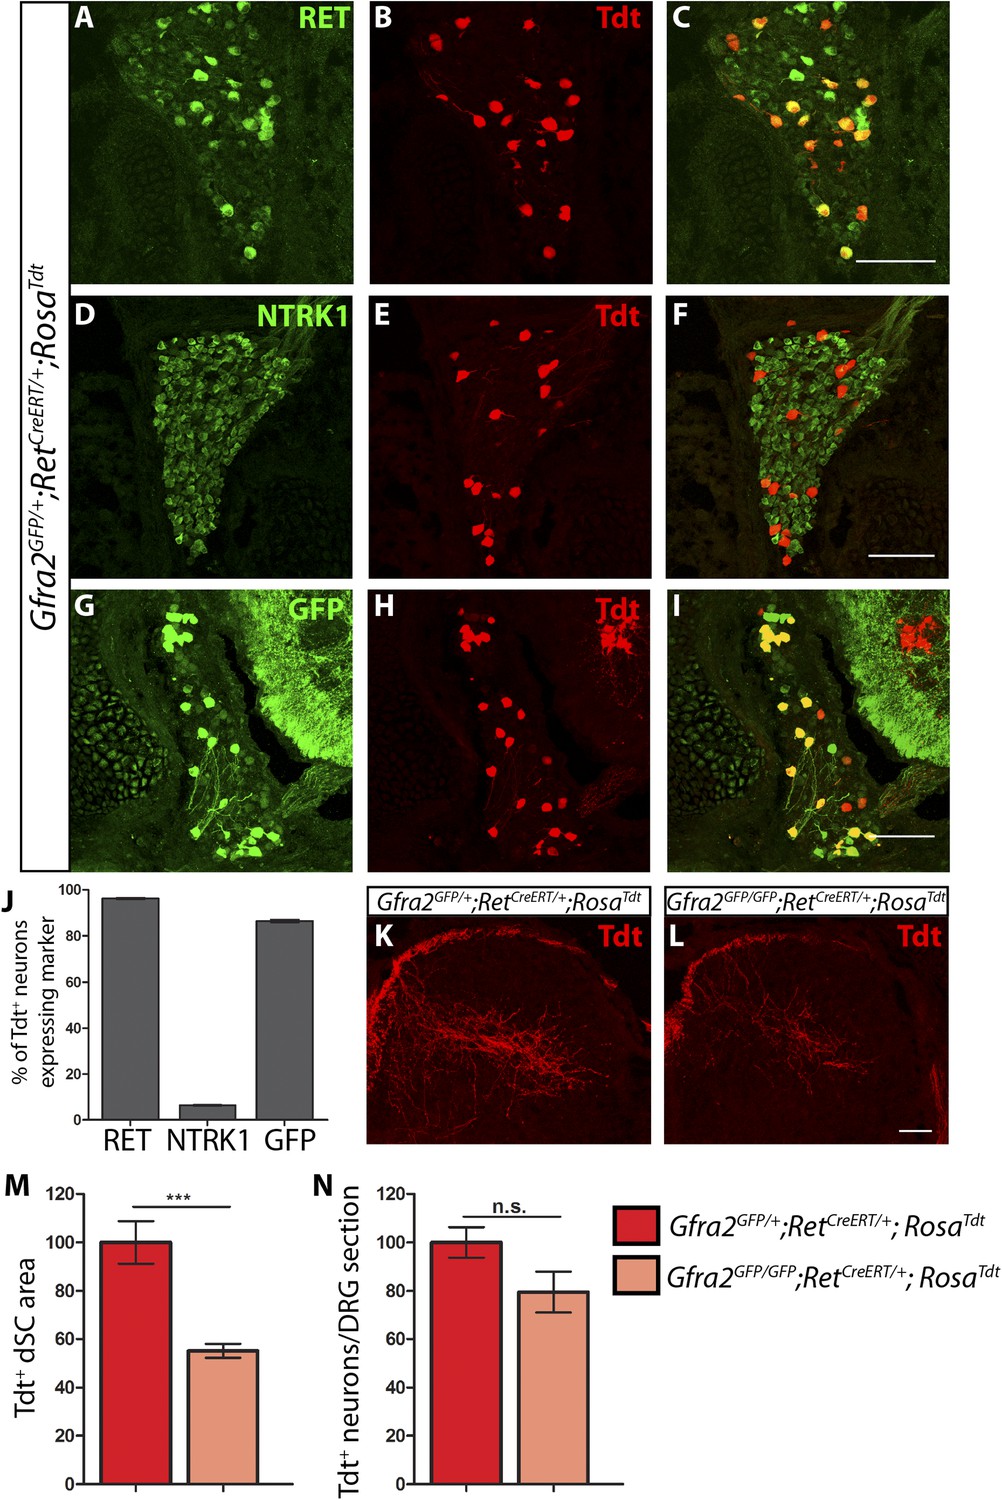
(A–I) E15.5 Gfra2GFP/+;RetCreERT/+;RosaTdt DRG sections stained with anti-RET (A–C), anti-NTRK1 (D–F), and anti-GFP (G–I). (J) Quantification of percentage of Tdt+ DRG neurons which co-express RET (96.16 ± 0.28%), NTRK1 (6.56 ± 0.18%), and GFP driven from the Gfra2 locus (86.48 ± 0.55%). The expression profile of Tdt+ neurons confirms that this genetic labeling strategy specifically labels RA mechanoreceptors. (K–L) Visualization of Tdt+ RA mechanosensory central projections in dSC of E15.5 Gfra2GFP/+; RetCreERT/+; RosaTdt control (K) and Gfra2GFP/GFP; RetCreERT/+; RosaTdt mutant (L) SC sections. (M) Quantification of Tdt+ pixels in dSC, which is displayed as a percentage normalized to dSC Tdt+ pixels of the within litter controls. Gfra2 mutant mice have 55.13 ± 2.82% of control staining (p < 0.001). Note that although Gfra2 null RA mechanoreceptors still have a central projection deficit at E15.5, the reduction at this stage is less severe than the deficit observed at E13.5. (N) Quantification of number of Tdt+ neurons per DRG section, which is displayed as a percentage normalized to Tdt+ neurons of the within litter controls. Gfra2 mutant mice have 79.52 ± 8.39% of control cell number (p = 0.06), which suggests that the survival of RA mechanoreceptors is not dependent on cis signaling at this stage. Scale bars = 100 μm (A–I), 50 μm (K–L). Error bars represent SEM. n.s. = p > 0.05, *** = p < 0.001. Source data are provided in Figure 3—source data 1.
-
Figure 3—source data 1
RA mechanoreceptor central projections and cell number in E15.5 Gfra2mutants.
- https://doi.org/10.7554/eLife.06828.011
Figure 3—figure supplement 1
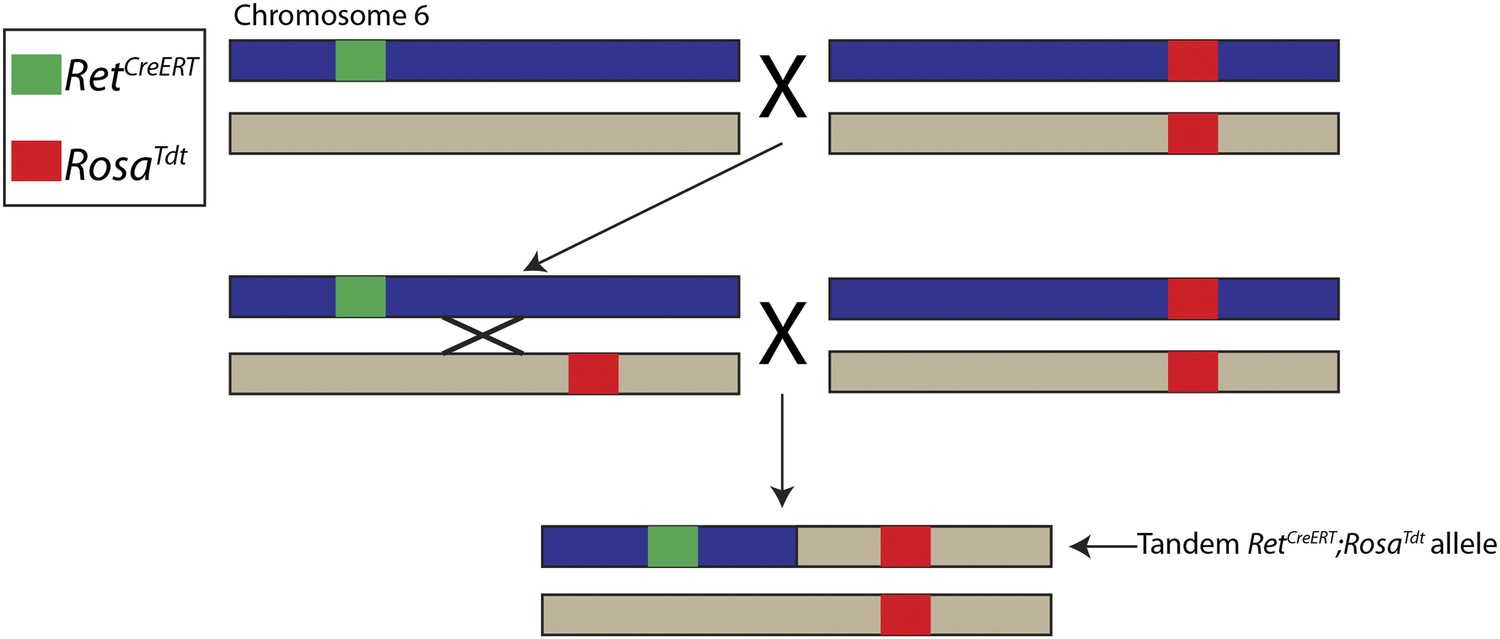
Generation of tandem RetCreERT;RosaTdt allele.
The Ret and Rosa loci are located ∼5 megabases apart on mouse chromosome 6. RetCreERT/+ mice were crossed to RosaTdt/Tdt mice to generate RetCreERT/+;RosaTdt/+ mice, which were crossed back to RosaTdt/Tdt mice. Occasionally, an interchromosomal recombination event occurred between the Ret and Rosa loci, which caused RetCreERT and RosaTdt to be located on the same chromosome. Recombinants were identified by genotyping for the RetCreERT allele and the homozygous presence of the RosaTdt allele. The chromosome containing both RetCreERT and RosaTdt alleles is called the tandem RetCreERT;RosaTdt allele and maintained by mating with RosaTdt/Tdt mice.
Figure 4 with 1 supplement
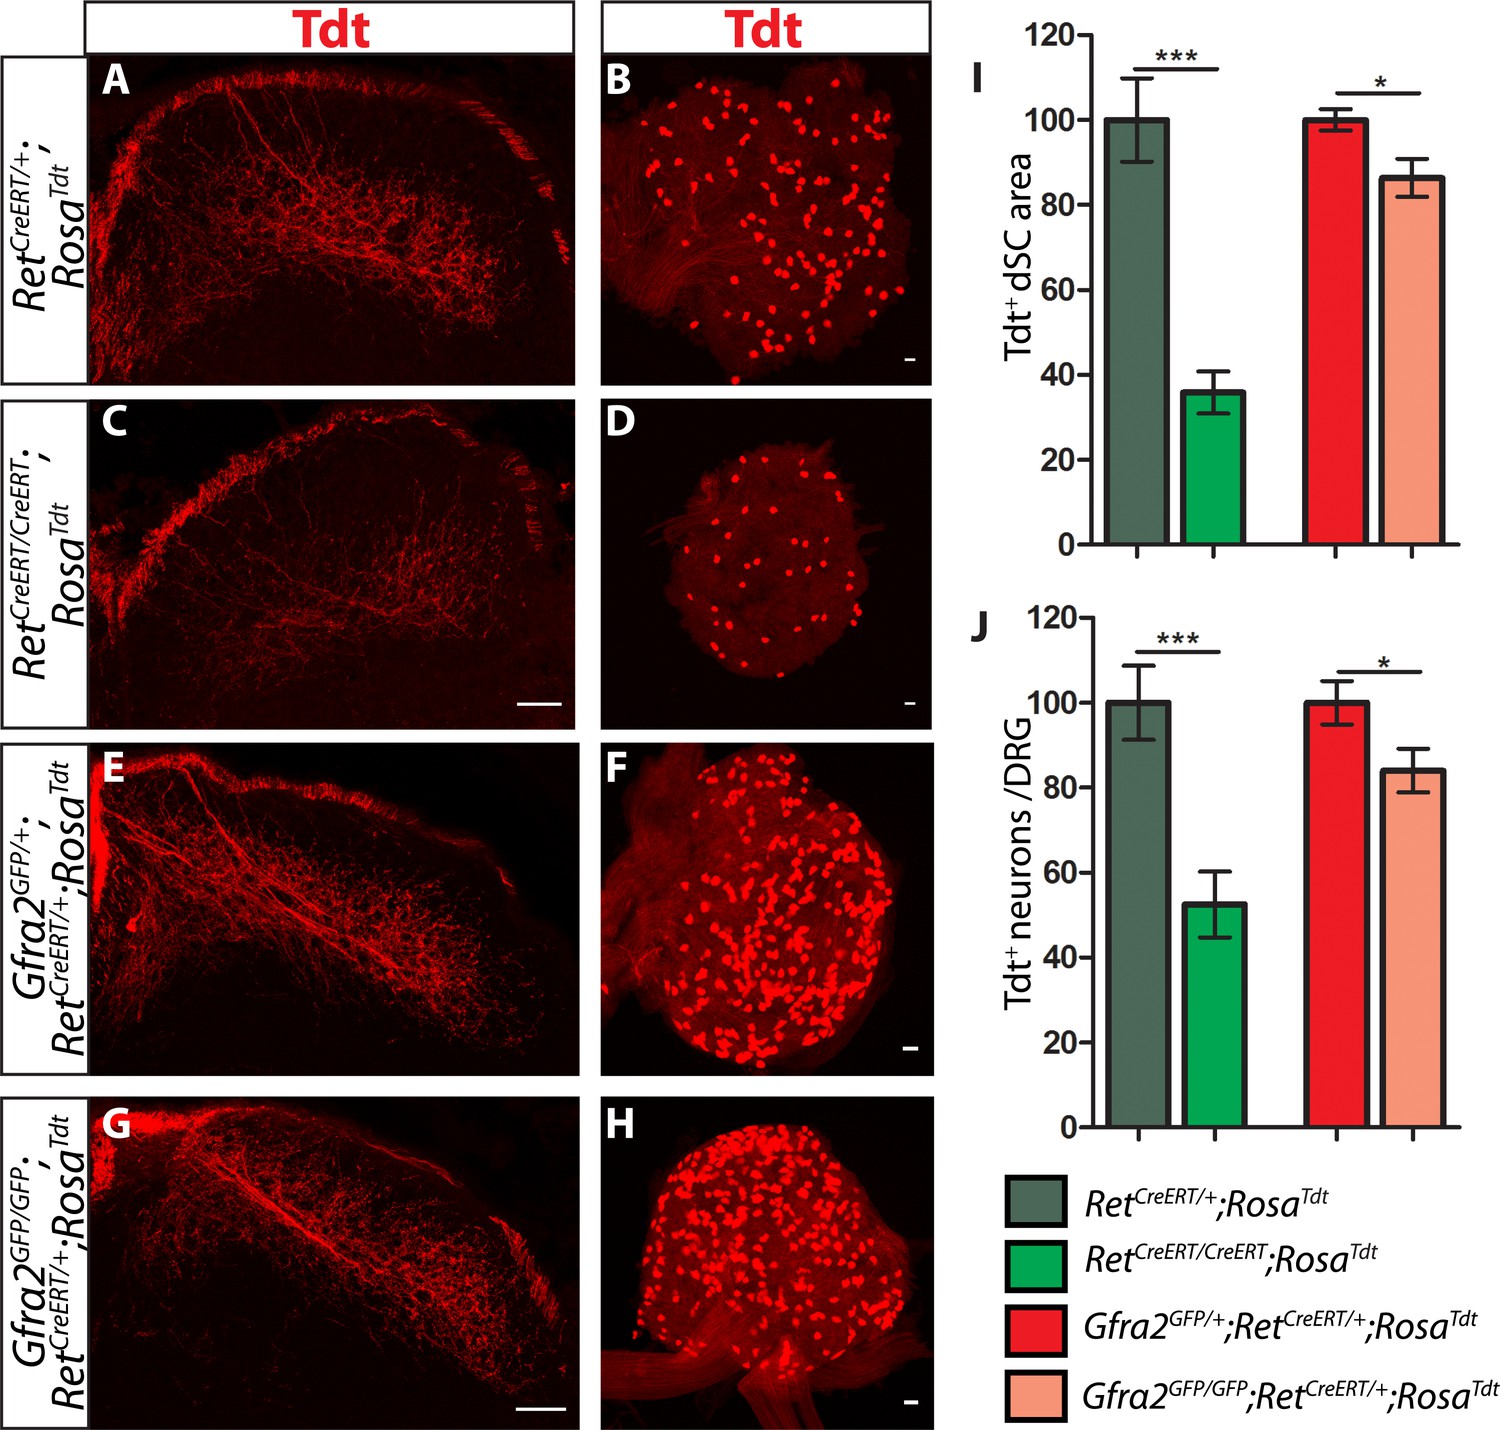
Ret and Gfra2 null mice display different central projection and cell survival deficits at E18.5.
(A–H) SC sections and whole mount L4/L5 DRGs of Tdt labeled RA mechanoreceptor from E18.5 RetCreERT/+;RosaTdt control (A–B), RetCreERT/CreERT;RosaTdt mutant (C–D), Gfra2GFP/+;RetCreERT/+;RosaTdt control (E–F), and Gfra2GFP/GFP;RetCreERT/+;RosaTdt mutant (G–H) embryos. (I) Quantification of Tdt+ pixels in dSC, which is displayed as a percentage normalized to dSC Tdt+ pixels of the within litter controls. (J) Quantification of the number of Tdt+ DRG neurons per whole-mount L4/L5 DRG, which is displayed as a percentage normalized to Tdt+ neurons of the within litter controls. Ret mutants have significant decreases in RA mechanosensory axons innervating the dSC and in the number of Tdt+ RA mechanoreceptors, suggesting that Ret mutants have deficits in both the growth of third order central projections and the survival of RA mechanoreceptors at E18.5. In contrast, Gfra2 nulls have only minor deficits in RA mechanosensory central projection growth and the survival or RA mechanoreceptors, suggesting that an additional GFRa2 independent but RET-dependent mechanism functions in these processes. Scale bar = 50 μm. Error bars represent SEM. * = p < 0.05, *** = p < 0.001. Source data are provided in Figure 4—source data 1.
-
Figure 4—source data 1
RA mechanoreceptor central projections and cell number in E18.5 Ret, Gfra2, Gfra1, and Gfra1;Gfra2 mutants.
- https://doi.org/10.7554/eLife.06828.014
Figure 4—figure supplement 1
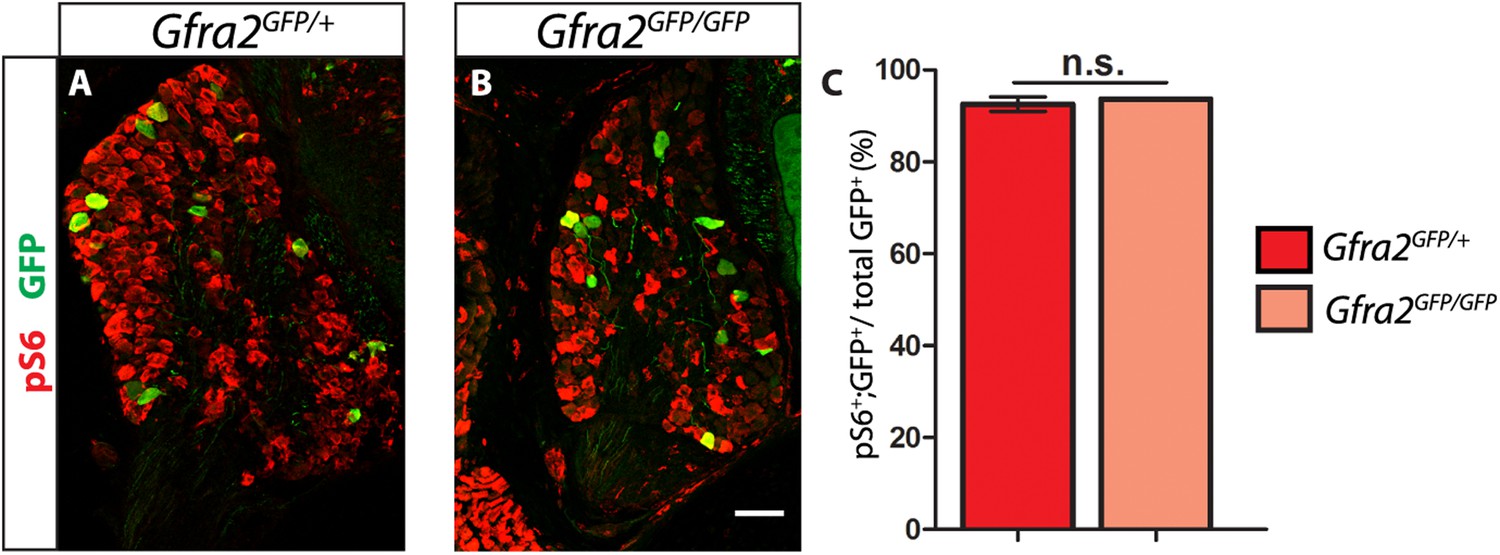
Gfra2 null RA mechanoreceptors retain phospho-S6 expression.
(A–B) Anti-GFP (green) and anti-phospho-S6 (red) staining of P0 Gfra2GFP/+ control (A) and Gfra2GFP/GFP null (B) DRG sections. (C) Quantification of percentage of GFP+ neurons which express phospho-S6 shows no significant change in proportion of phospho-S6+ RA mechanoreceptors (92.53 ± 1.55% of Gfra2GFP/+ GFP+ DRG neurons express phospho-S6, 93.66 ± 0.14% of Gfra2GFPGFP+ GFP+ DRG neurons express phospho-S6, p = 0.51). Therefore, active RTK signaling seems to still occur in Gfra2 null RA mechanoreceptors.
Figure 5
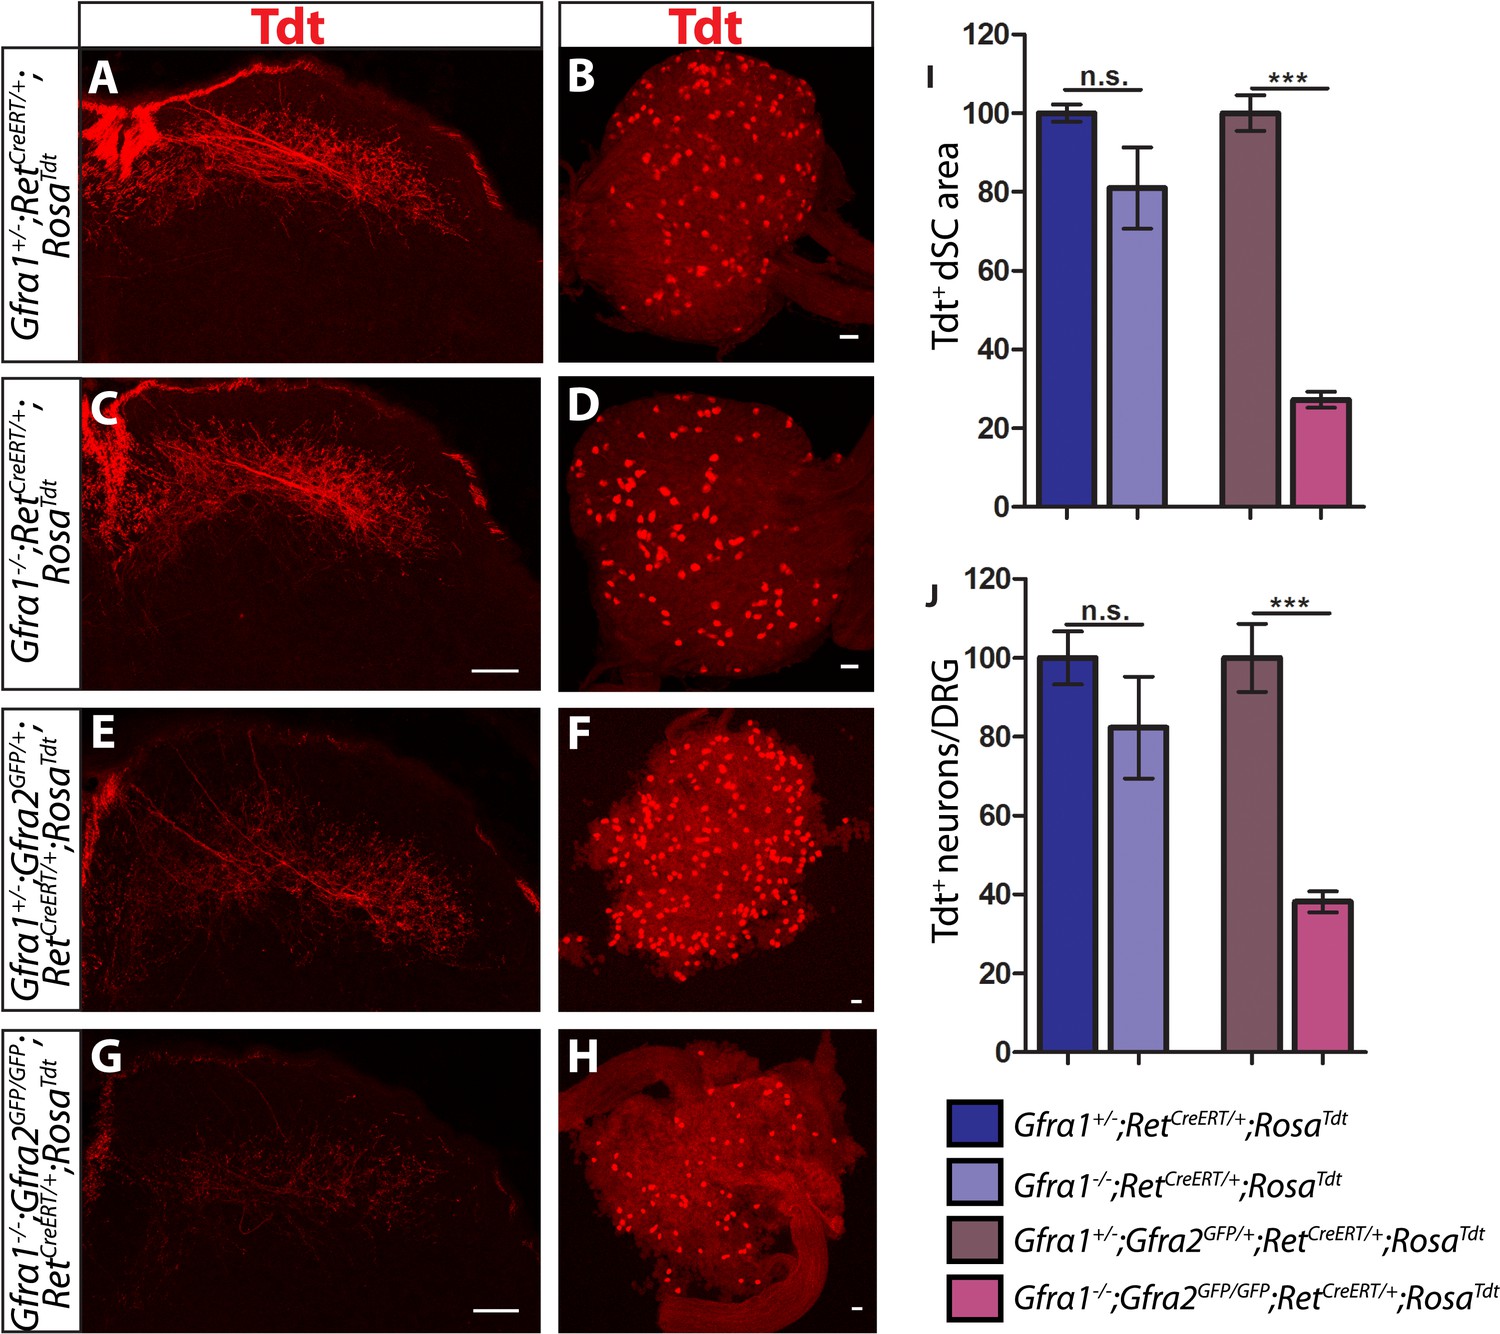
Gfra1;Gfra2 double null mice phenocopy Ret mutants at E18.5.
(A–H) SC sections and whole mount L4/L5 DRGs of Tdt labeled RA mechanoreceptors from E18.5 Gfra1+/−;RetCreERT/+;RosaTdt control (A–B), Gfra1−/−;RetCreERT/+;RosaTdt mutant (C–D), Gfra1+/−; Gfra2GFP/+;RetCreERT/+;RosaTdt control (E–F) and Gfra1−/−; Gfra2GFP/GFP;RetCreERT/+;RosaTdt double null (G–H) embryos. (I) Quantification of Tdt+ pixels in dSC, which is displayed as a percentage normalized to dSC Tdt+ pixels of the within litter controls. (J) Quantification of number of Tdt+ DRG neurons per DRG, which is displayed as a percentage normalized to Tdt+ neurons of the within litter controls. Gfra1 mutants have no significant deficits in RA mechanosensory third order projections or cell survival at E18.5, indicating that ablating trans signaling alone is not sufficient to disrupt the development of RA mechanoreceptors. However, loss of both cis and trans signaling in Gfra1;Gfra2 double nulls leads to a significant loss of RA mechanosensory third order projection growth and cell number, suggesting that both cis and trans RET signaling contribute to the development of RA mechanoreceptors. Scale bars = 50 μm. Error bars represent SEM. n.s. = p > 0.05, *** = p < 0.001. Source data are provided in Figure 4—source data 1.
Figure 6 with 1 supplement
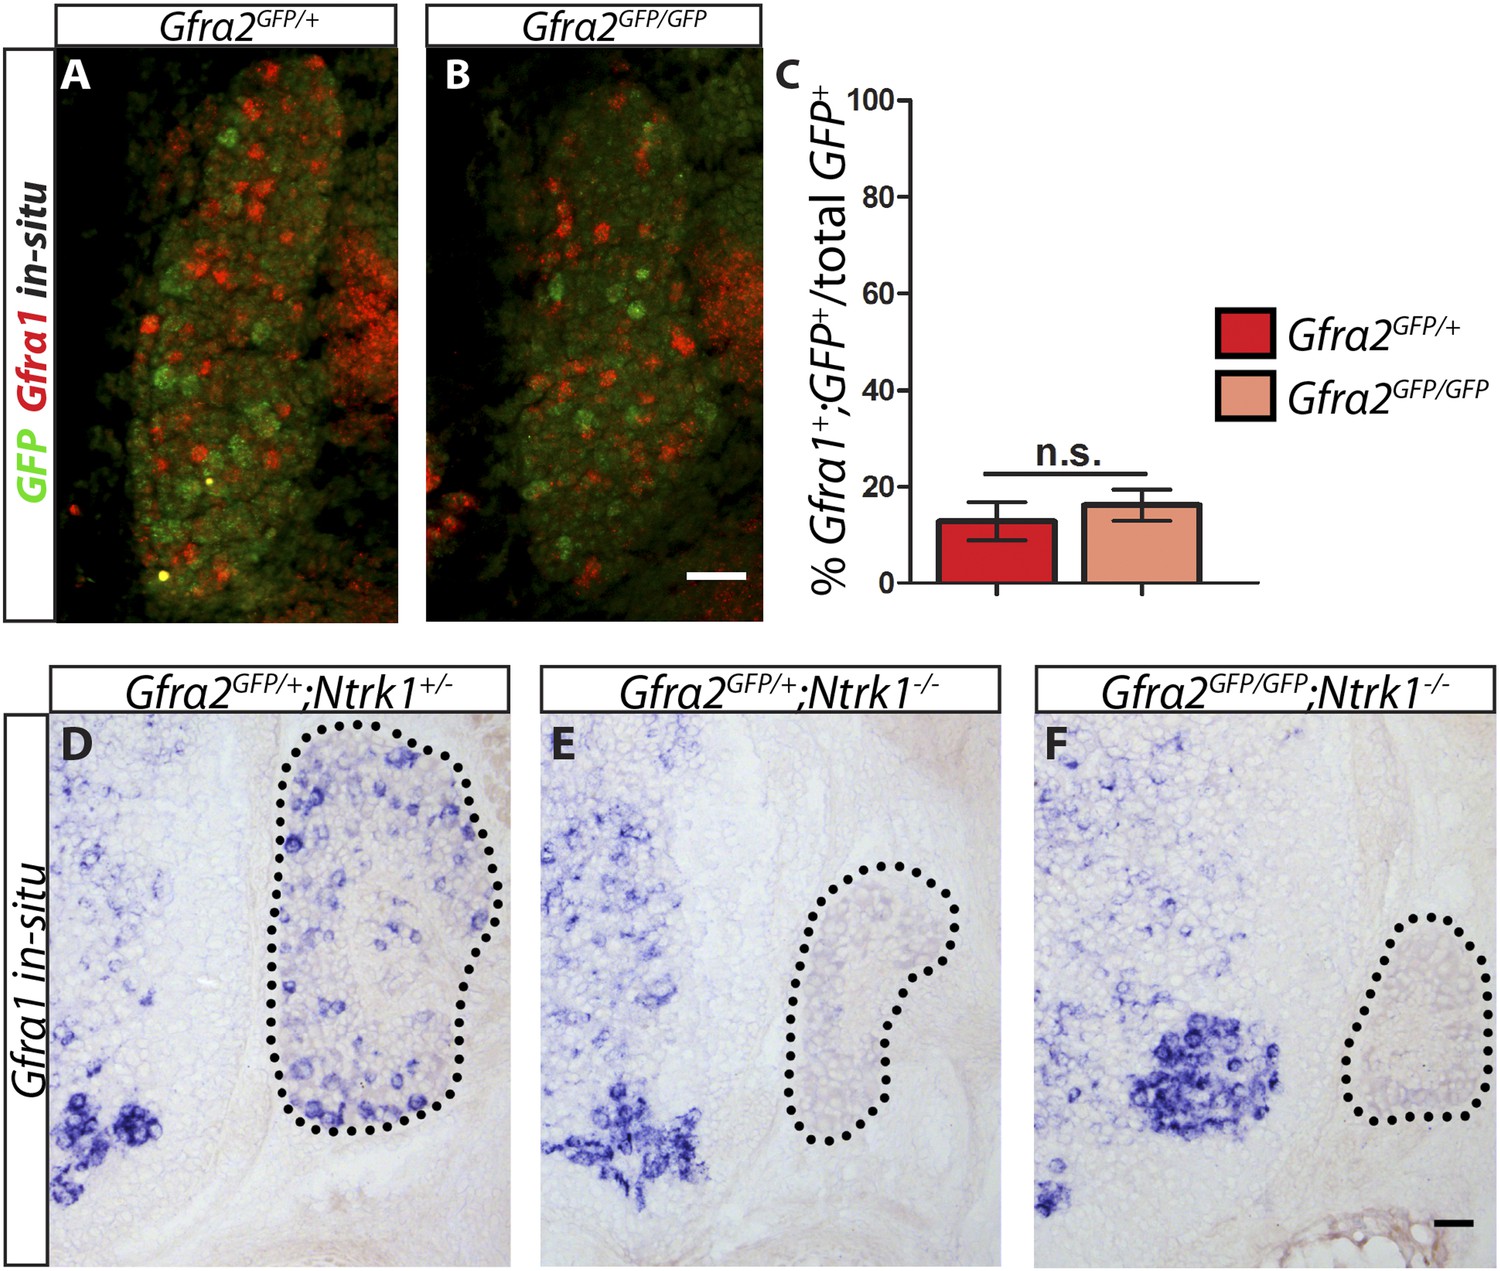
Gfra1 is not upregulated in Gfra2 null RA mechanoreceptors.
(A–B) Double fluorescent in situ hybridization against GFP and Gfra1 on E14.5 Gfra2GFP/+ control (A) and Gfra2GFP/GFP null (B) DRG sections. (C) Quantification of percentage of GFP+ neurons which co-express Gfra1. 12.81 ± 3.92% of control GFP+ neurons express Gfra1, and 16.17 ± 3.31% of Gfra2 null GFP+ neurons express Gfra1 (p = 0.52). The comparable low number of DRG neurons co-expressing GFP and Gfra1 in control and Gfra2 nulls suggests that Gfra1 normally is not expressed in most RA mechanoreceptors and that no upregulation of Gfra1 occurs in Gfra2 null RA mechanoreceptors. (D–F) In situ hybridization against Gfra1 in P0 Gfra2GFP/+;Ntrk1+/− control (D), Gfra2GFP/+;Ntrk1−/− null (E), and Gfra2GFP/GFP;Ntrk1−/− double null (F) DRG and SC sections. Black border outlines DRG. In control DRG sections, Gfra1 is expressed in some DRG neurons. In Gfra2GFP/+;Ntrk1−/− null DRG sections, Gfra1 transcript is not detected because the DRG neurons which normally express detectable levels of Gfra1 don't survive in the absence of Ntrk1. In Gfra2;Ntrk1 double null mice, no Gfra1 expression is detected in DRG neurons as well, which further supports that upregulation of Gfra1 doesn't occur in Gfra2 null RA mechanoreceptors. Scale bars = 50 μm. Error bars represent SEM. n.s. = p > 0.05.
-
Figure 6—source data 1
QPCR of Gfra1 in embryonic Gfra2 null DRGs.
- https://doi.org/10.7554/eLife.06828.018
Figure 6—figure supplement 1
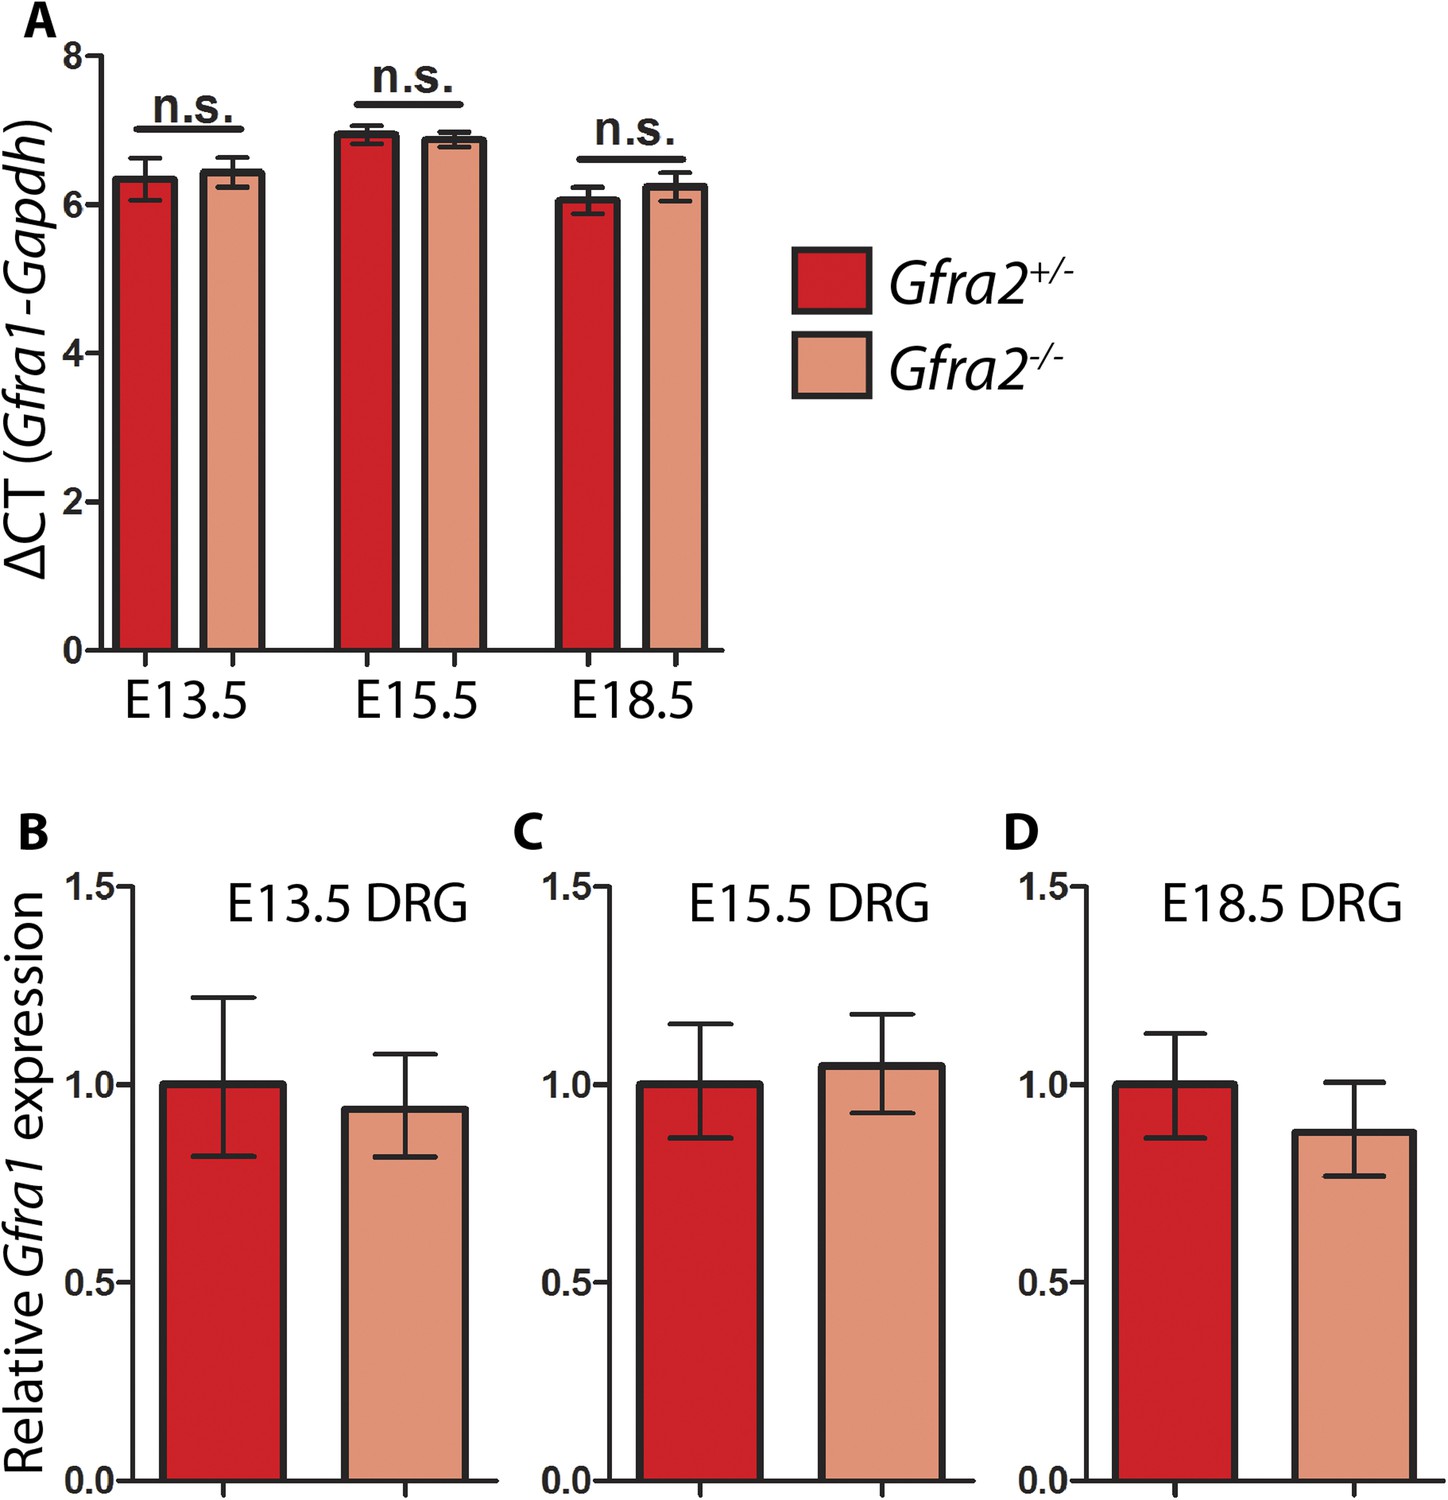
Quantitative RT-PCR (QPCR) of Gfra1 in Gfra2 null DRGs.
QPCR for Gfra1 from cDNAs generated from E13.5, E15.5, and E18.5 Gfra2GFP/+ control and Gfra2GFP/GFP null DRGs. (A) ΔCT values (cycles to reach threshold for Gfra1 minus cycles to reach threshold for Gapdh, a housekeeping gene) are not significantly different between control and mutant DRGs at E13.5, E15.5, or E18.5, suggesting that transcription of Gfra1 is not changed in Gfra2 mutants. Error bars represent standard deviation, n.s. = p > 0.05. (B–D) Relative quantification of Gfra1 expression levels at E13.5 (B), E15.5 (C), and E18.5 (D) calculated by 2−ΔΔCT. Error bars represent range of expression based on 2−ΔΔCT calculated ± the standard deviation of CT. Source data are provided in Figure 6—source data 1.
Figure 7 with 1 supplement
RA mechanoreceptors utilize GFRa1 produced by neighboring neurons to respond to GDNF.
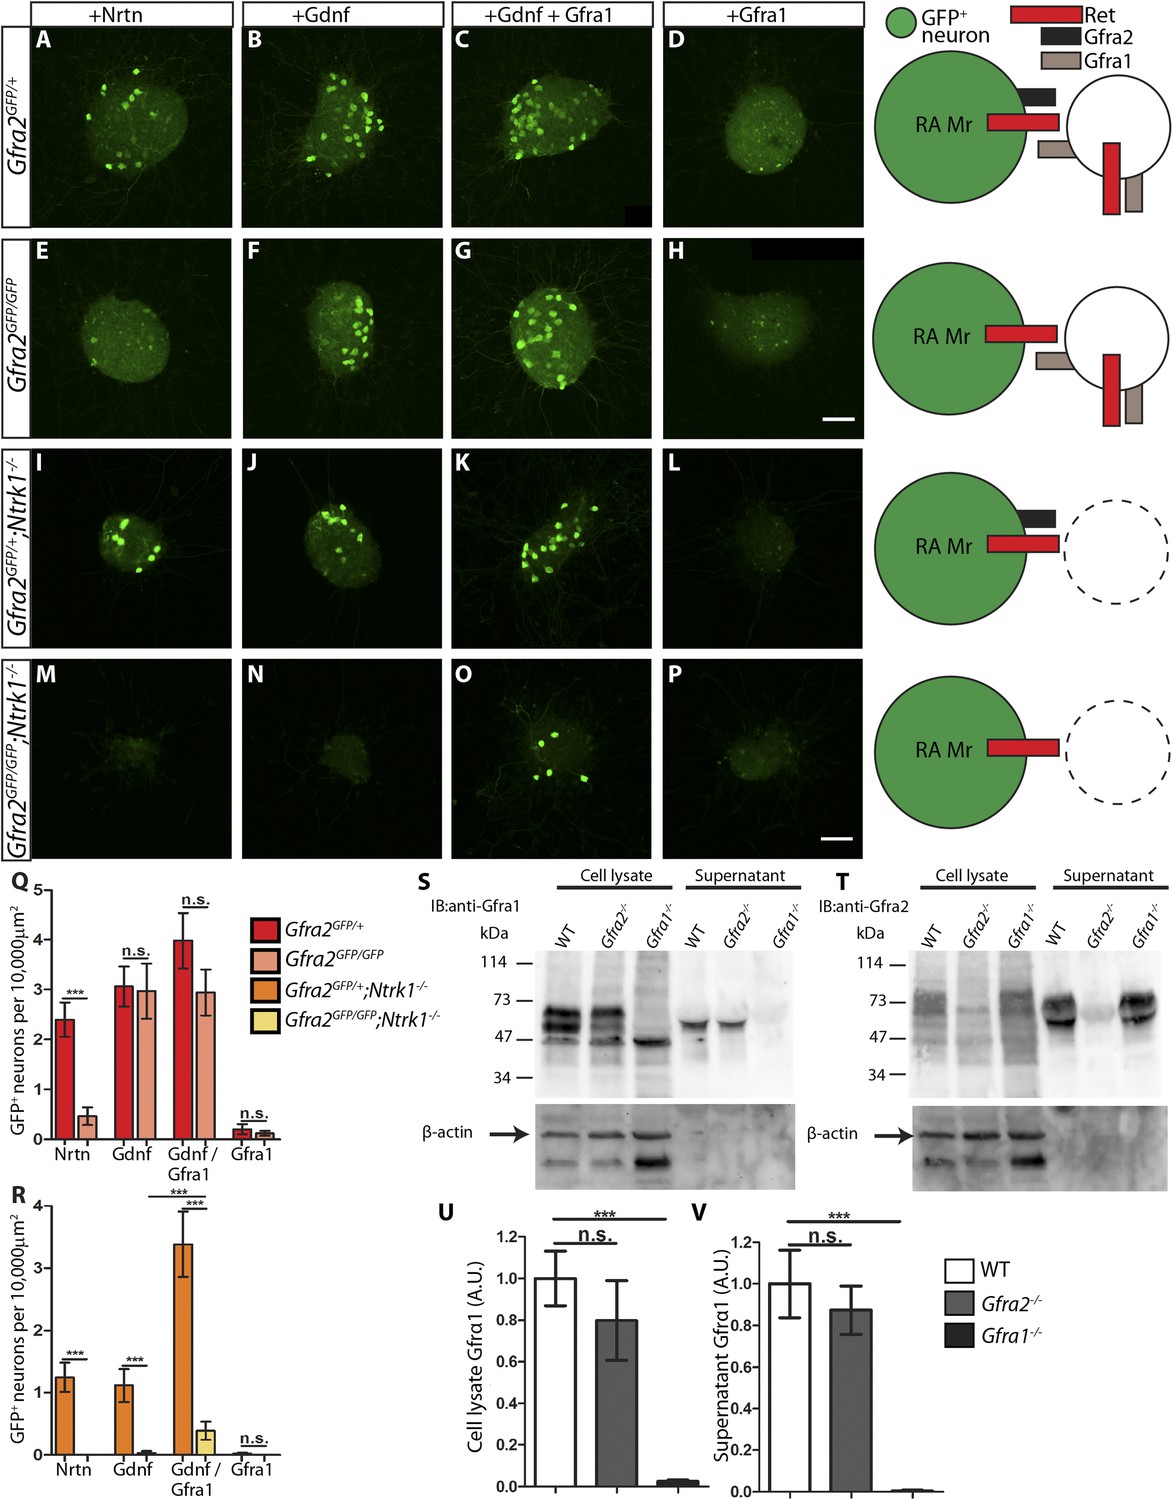
(A–P) DRG explants from Gfra2GFP/+ control (A–D), Gfra2GFP/GFP null (E–H), Gfra2GFP/+;Ntrk1−/− null (I–L), and Gfra2GFP/GFP;Ntrk1−/− double null (M–P) embryos grown for 1 day in vitro and stained with anti-GFP antibody. Explants were treated with NRTN (50 ng/ml), GDNF (100 ng/ml), GDNF (100 ng/ml) plus GFRa1 (300 ng/ml), or GFRa1 (300 ng/ml), respectively. Schematic next to each genotype depicts the presence of RET and GFRas in each condition, and green color indicates cells detected by anti-GFP staining. (Q) Quantification of number of GFP+ neurons per 10,000 μm2 of explant in Gfra2GFP/+ control and Gfra2GFP/GFP null explants. GFP driven from the Gfra2 locus indicates RET signaling activity. Gfra2 control explants display many GFP+ neurons upon NRTN, GDNF, and GDNF plus GFRa1 treatment, but do not respond to GFRa1 alone. Gfra2 null explants lose their responsiveness to NRTN, but remain responsive to GDNF and GDNF plus GFRa1. (R) Quantification of number of GFP+ neurons per 10,000 μm2 of explant in Gfra2GFP/+;Ntrk1−/− null and Gfra2GFP/GFP;Ntrk1−/− double null explants. In a Ntrk1 null background, expression of Gfra1 is lost in non-RA-mechanoreceptor DRG neurons. Gfra2GFP/+;Ntrk1−/− null explants respond to NRTN, GDNF, and GDNF plus GFRa1. In this case, it is likely that GDNF activates RET signaling by interacting with GFRa2 (Jing et al., 1997; Sanicola et al., 1997; Rossi et al., 1999). In contrast, Gfra2;Ntrk1 double null DRG explants show GFP expression upon treatment with a combination of GDNF and GFRa1, but completely lose their responsiveness to GDNF. These results indicate that Gfra2 null RA mechanoreceptors do not express GFRa1 at a functional level and they depend on GFRa1 produced by neighboring NTRK1+ neurons to respond to GDNF. See Figure 7—source data 2 for quantification. (S–V) Western blot analysis of cell lysates and concentrated supernatants from cultured dissociated DRG neurons of E18.5-P1 wild-type, Gfra2 null, and Gfra1 null mice. (S) The specificity of the anti-GFRa1 antibody was confirmed by the loss of a doublet at the predicted size of GFRa1 in Gfra1 null cell lysates. GFRa1 was also detected in the supernatants of wild-type and Gfra2 null cultures, but not Gfra1 null cultures, indicating that GFRa1 is shed from the membrane of DRGs of both wild-type and Gfra2 mutants. Note that the size of cleaved GFRa1 is slightly smaller than that tethered to cells, which is consistent with previous publication (Paratcha et al., 2001). Following detection of GFRa1, membranes were stripped and probed for β-actin, which served as a loading control and confirmation that the supernatant fraction was not contaminated with cells or cellular debris (lower panel). (T) The specificity of the anti-GFRa2 antibody was confirmed by the loss of a band ∼75 kDa in Gfra2 null cell lysates. The larger than predicted size of GFRa2 may be due to post-translational modifications. Two GFRa2 specific bands were also detected in the supernatants of wild-type and Gfra1 null cultures, but not Gfra2 null cultures, indicating that GFRa2 is also shed from DRG cell membranes. The size of cleaved GFRa2 is also smaller than that tethered to cells. (U–V) Densimetric quantification of anti-GFRa1 blots shows no significant change in the level of GFRa1 produced by cells (U) or released into the media (V), which suggests that there is no compensation for the loss of GFRa2 through changes in the expression or release of GFRa1. See Figure 7—source data 3 for quantification. Error bars represent SEM. Scale bars = 50 μm. n.s. = p > 0.05, *** = p < 0.001. Source data are provided in Figure 7—source data 2, 3.
-
Figure 7—source data 1
Quantification of axonal growth in Ret mutant DRG explants.
- https://doi.org/10.7554/eLife.06828.021
-
Figure 7—source data 2
GFP+ neuron number in Gfra2 null and Gfra2;Ntrk1 double null explants.
- https://doi.org/10.7554/eLife.06828.022
-
Figure 7—source data 3
Densimetric measurements of GFRa1 in DRG cell extracts and supernatants.
- https://doi.org/10.7554/eLife.06828.023
Figure 7—figure supplement 1
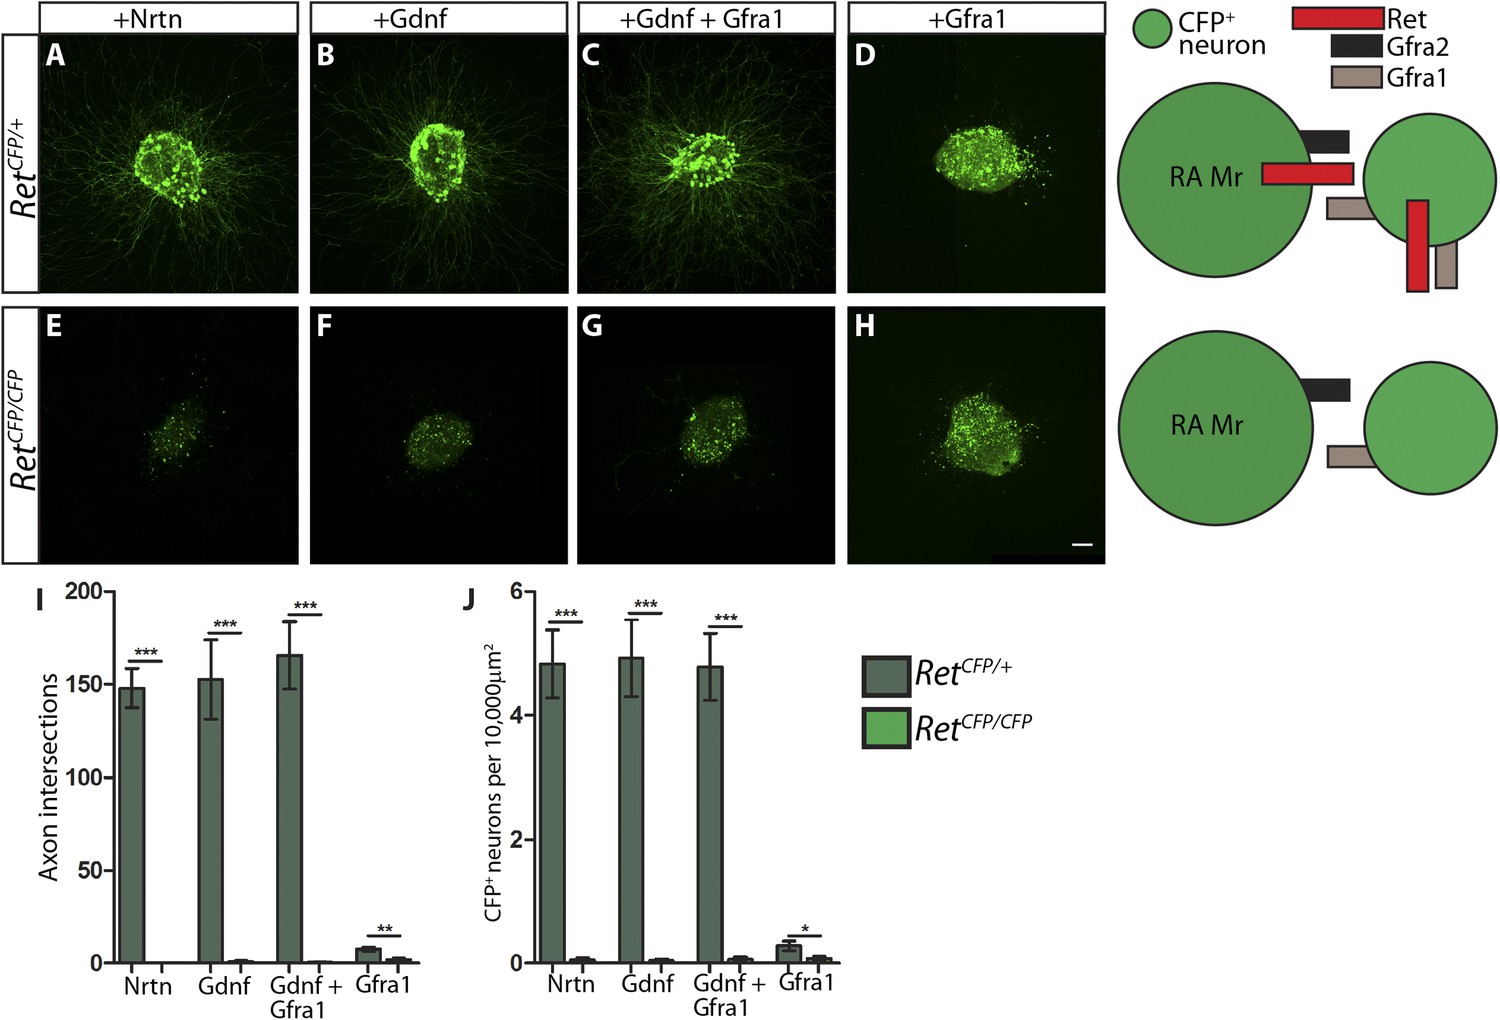
RetCFP null DRG explants lose responsiveness to GFLs.
(A–H) DRG explants from E14.5 RetCFP/+ control (A–D) and RetCFP/CFP null (E–H) embryos grown for 1 day in vitro and stained with anti-GFP antibody. Explants were treated with NRTN (50 ng/ml), GDNF (100 ng/ml), GDNF (100 ng/ml) plus GFRa1 (300 ng/ml), or GFRa1 (300 ng/ml), respectively. Schematic next to each genotype depicts the presence of RET and GFRas in each condition, and green color indicates cells detected by anti-GFP staining. (I) Quantification of number of axonal intersections at a 200 μm distance from the edge each explant for Ret control and null explants. CFP+ neurons in control explants grow numerous axons upon treatment with NRTN, GDNF, or GDNF plus GFRa1, but not in response to GFRa1 alone. Ret null explants do not grow axons upon treatment with GFLs. (J) Quantification of number of CFP+ neurons per 10,000 μm2 of explant in Ret control and null explants. Since RET signaling positively regulates Ret expression, CFP driven from the Ret locus serves as a readout of RET signaling activity as well. Ret control explants have many CFP+ neurons upon NRTN, GDNF, and GDNF plus GFRa1 treatment, but Ret null explants do not respond to treatment with GFLs. Scale = 50 µm. Source data are provided in Figure 7—source data 1, 2.
Figure 8 with 1 supplement
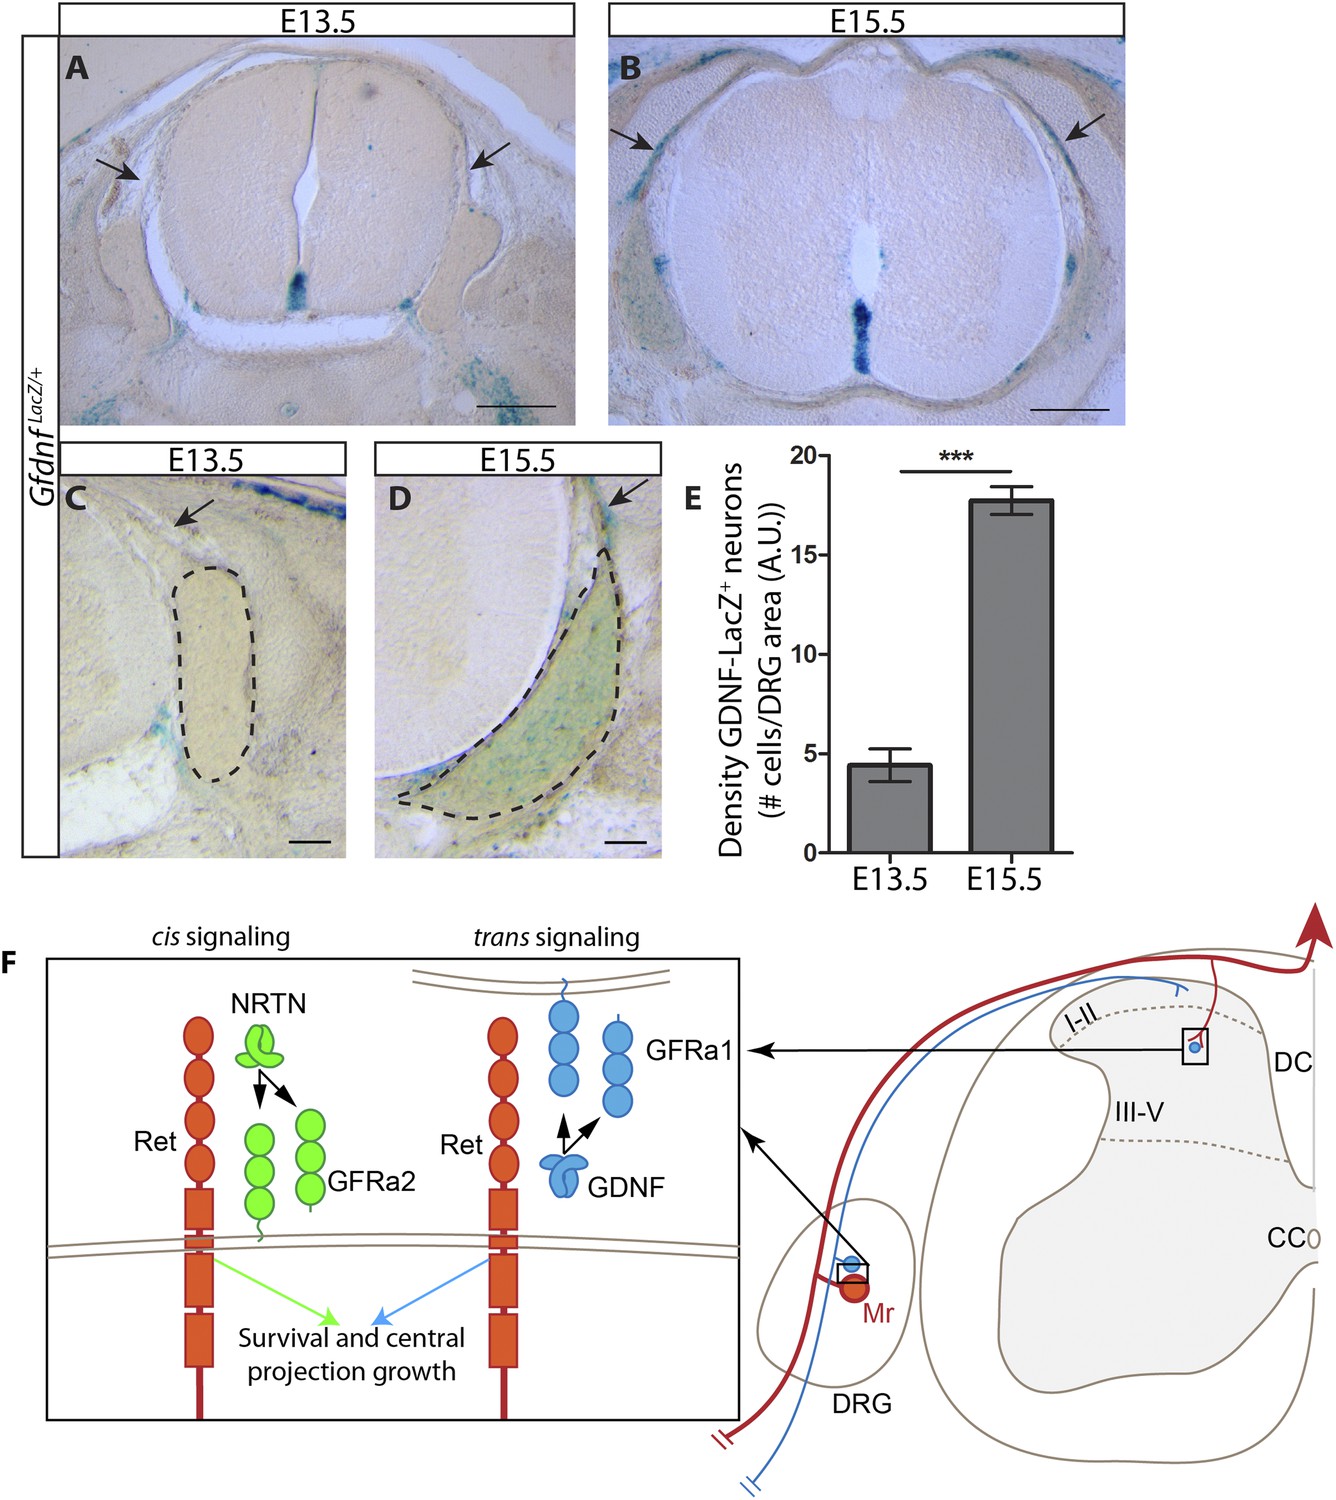
Dynamic expression of GDNF during development.
(A–D) X-Gal staining of E13.5 (A, C) and E15.5 (B, D) GdnfLacZ/+ DRG and SC sections (also see Figure 8—figure supplement 1). Arrows indicate dorsal roots, which express Gdnf at E15.5, but not E13.5. (E) Quantification of LacZ+ cells per DRG section, normalized to DRG area, reveals a significant increase in the number of cells expressing Gdnf from E13.5 to E15.5. E13.5 embryos have 4.41 ± 0.82 LacZ+ cells/unit area of DRG, E15.5 embryos have 17.73 ± 0.70 LacZ+ cells/unit area of DRG (p < 0.001). Error bars represent SEM. Scale bars = 200 μm (A–B), 100 μm (C–D). *** = p < 0.001 (F) Model of cis and trans signaling at cell bodies and central branches of RA mechanoreceptors. GFRa2 is co-expressed with RET in RA mechanoreceptors and can activate RET in cis. GFRa2 can also be shed from the membrane and may activate RET in its soluble form. GFRa1 is expressed in neighboring DRG neurons, dorsal root entry zone cells, and dSC cells. GFRa1 present at the membrane of these cells may directly contact the cell bodies or processes of RA mechanoreceptors to activate RET in trans. In addition, soluble GFRa1 released from these cells may also activate RET in RA mechanoreceptor in trans.
Figure 8—figure supplement 1
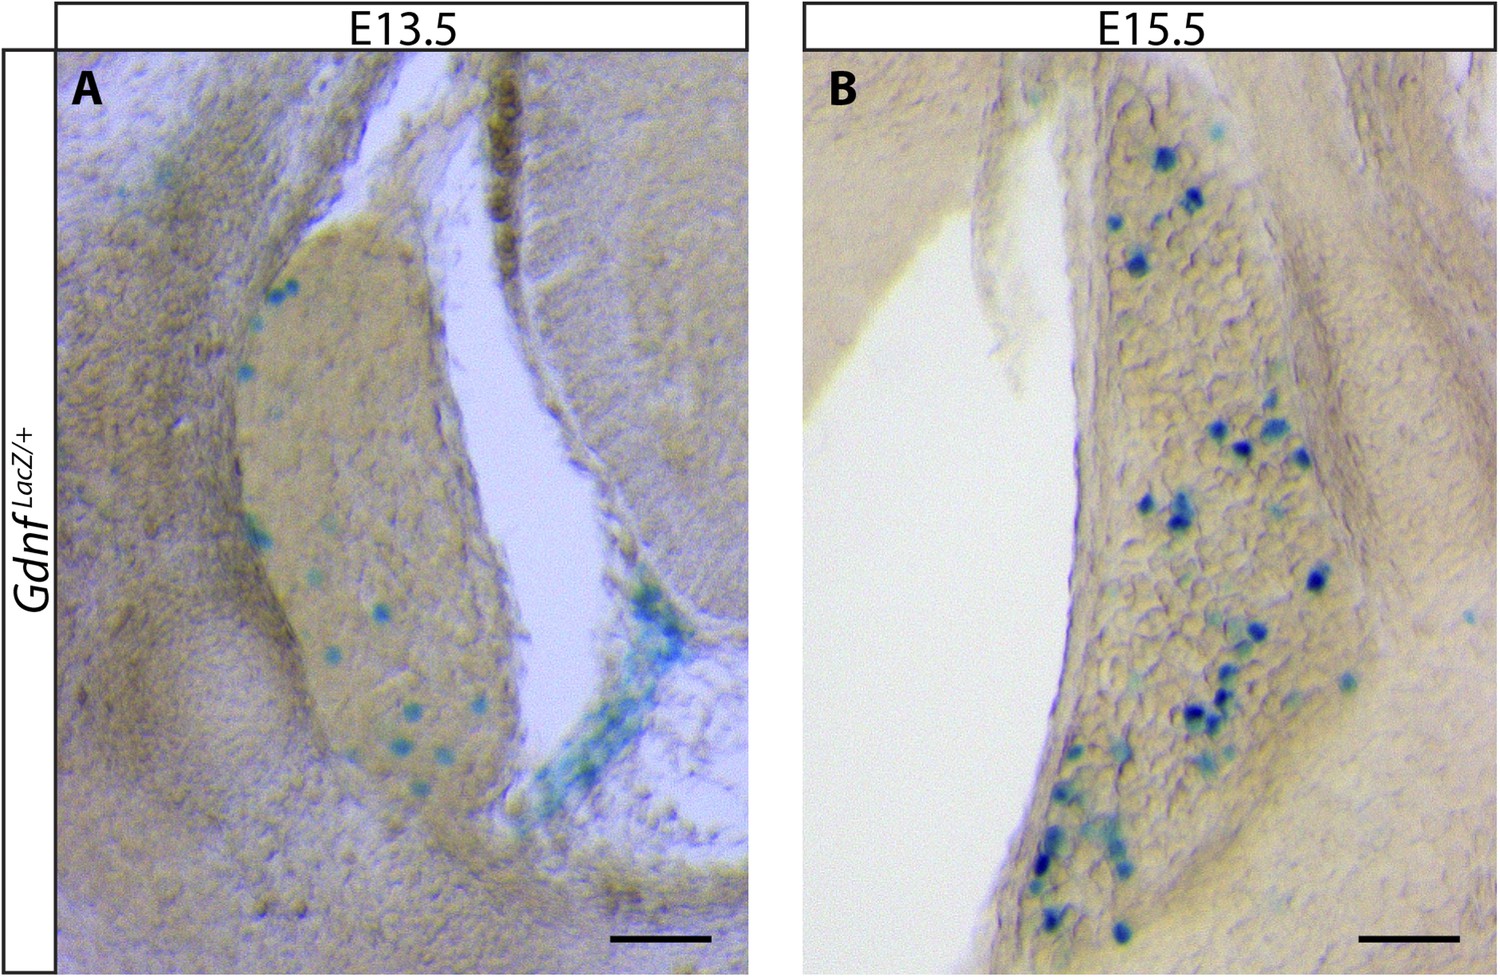
Gdnf LacZ expression in DRGs at E13.5 and E15.5.
DRG sections with large, strongly LacZ+ neurons were observed at both E13.5 (A) and E15.5 (B). Note that there are many more LacZ+ DRG neurons at E15.5. Sections with such cells were observed in all embryos and were usually found in distal anterior and distal posterior segments. Sections with smaller reactive cells, as shown in Figure 6, were observed more frequently. Scale = 100 μm.
Download links
A two-part list of links to download the article, or parts of the article, in various formats.
Downloads (link to download the article as PDF)
Open citations (links to open the citations from this article in various online reference manager services)
Cite this article (links to download the citations from this article in formats compatible with various reference manager tools)
Cis and trans RET signaling control the survival and central projection growth of rapidly adapting mechanoreceptors
eLife 4:e06828.
https://doi.org/10.7554/eLife.06828


