ISG15 counteracts Listeria monocytogenes infection
- Institut Pasteur, France
- Institut National de la Santé et de la Recherche Médicale, U604, France
- Institut National de la Recherche Agronomique, USC2020, France
- AgroParisTech, France
- Université Paris Diderot, Sorbonne Paris Cité, Cellule Pasteur, France
- Universitätsklinikum Freiburg, Germany
Figures
Figure 1 with 1 supplement

ISG15 is induced by Listeria monocytogenes infection both in vitro and in vivo and ISG15 induction can be type I interferon independent.
(A) HeLa cells were lysed and immunoblotted with α-ISG15, α-EF-Tu (EF-Tu is a prokaryotic translation elongation factor that we use as an indicator of infection level), and α-ACTIN following 12 or 24 hr of interferon β treatment at 1000 units/ml, infection with L. monocytogenes for 18 hr at multiplicity of infection (MOI) of 10 or 25 bacteria per human cell, and incubation with Listeria innocua at MOI of 10 or 25 bacteria per human cell. (B) HeLa cells were lysed and immunoblotted with α-ISG15, α-EF-Tu, and α-ACTIN following a time course of L. monocytogenes infection from 3 to 24 hr, interferon β treatment for 24 hr was used as a positive control for ISGylation. (C) Liver tissue from mice injected with saline or infected with Listeria for 72 hr was lysed and immunoblotted with α-ISG15, each lane corresponds to a distinct animal (* indicates background band). (D) Relative fold change by qRT-PCR of ISG15 transcript following time course of infection with Listeria. (E) Relative fold change of ISG15 by qRT-PCR compared with the interferon β transcript over time course of infection with Listeria; data represented in a logarithmic scale. (F) Cells were lysed and immunoblotted with α-ISG15 and α-ACTIN following pre-treatment with the viral protein B18R followed by interferon α2 treatment (1000 μ/ml) or Listeria infection. (G) 2fTGH and U5A (IFNAR2−/−) cells were lysed and immunoblotted with α-ISG15 and α-ACTIN following Listeria infection for 18 hr.
Figure 1—figure supplement 1
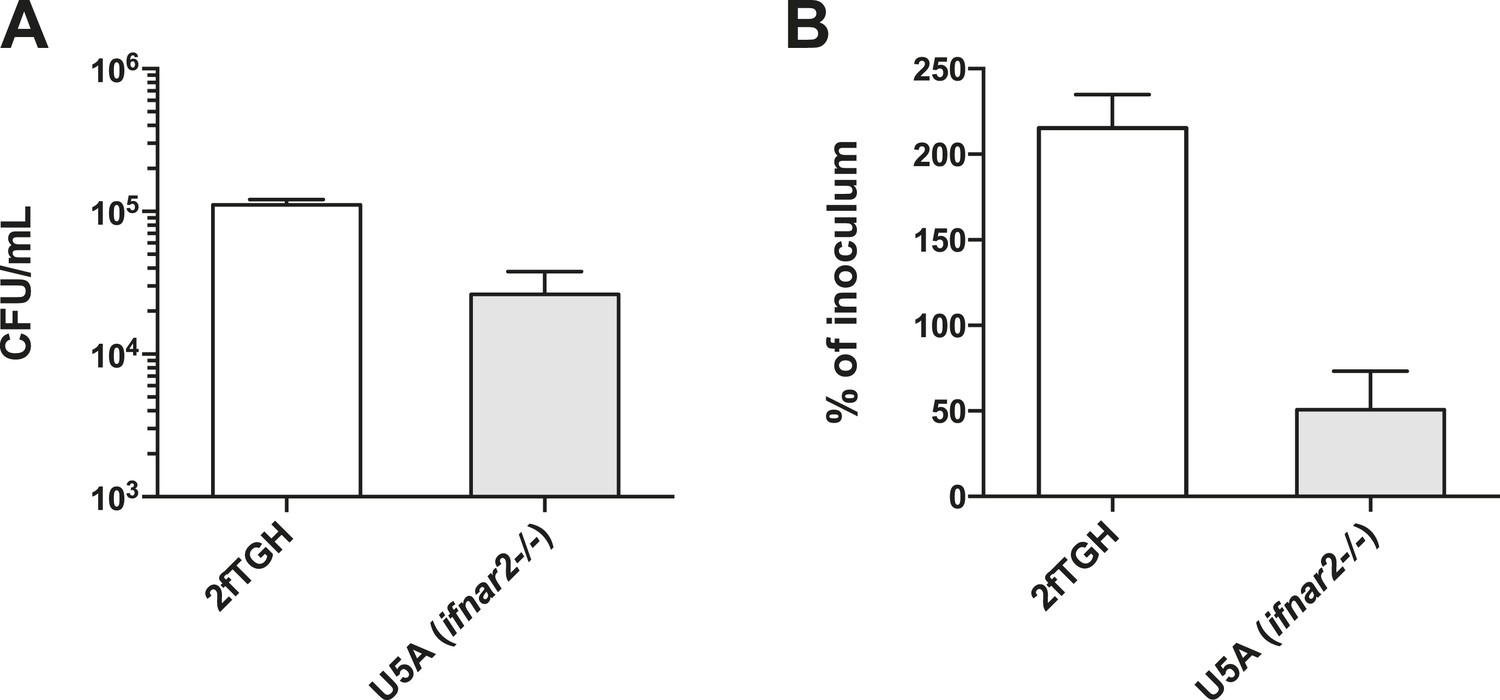
2fTGH cells are permissive to L. monocytogenes infection.
(A) CFU/ml of internalized L. monocytogenes determined following invasion of 2fTGH and U5A cell lines at an MOI of 25 bacteria per cell. (B) Percent invasion (as calculated by % of inoculum) of 2fTGH and U5A cell lines by L. monocytogenes strain EGD following 2 hr of infection.
Figure 2 with 2 supplements

Listeria induces ISG15 via the cytosolic surveillance pathway (CSP) which senses bacterial DNA.
(A) Cells were lysed and immunoblotted with the indicated antibodies following infection with various mutants of Listeria: Listeria strain EGD (MOI 10), Δhly (MOI 10), ΔactA (MOI of 50), and L. innocua + InlB (MOI of 100). Different MOIs were used at the outset in an attempt to equalize Colony forming units (CFUs) at the end of the experiment. CFUs per ml of intracellular bacteria following infection were determined by serial dilution after 18 hr of infection. (B) As before cells were lysed and immunoblotted with the indicated antibodies following infection with Listeria strain EGD-e PrfA* (MOI 10), ΔplcA (MOI 10), Δhly (MOI of 10), and a triple mutant of ΔhlyΔplcAΔplcB (MOI of 100). CFUs per ml of intracellular bacteria following infection were determined by serial dilution after 24 hr of infection. (C) HeLa cells were treated with siRNA pools targeting the indicated mRNA or siControl for 72 hr. Cells were then infected for 18 hr (MOI 10), lysed, and immunoblotted with α-ISG15 and α-ACTIN antibodies. Values were generated using ImageJ to quantify relative levels of induction of ISG15 compared to ACTIN. Values from three independent experiments are displayed (average ± SEM). siRNA knockdown was confirmed with qRT-PCR from a well of a technical replicate. Statistical significance calculated using ANOVA followed by Bonferonni's multiple comparison test against siControl. (D) Cells were lysed and immunoblotted with α-ISG15 and α-ACTIN following permeablization without Cyclic-diAMP, with 1 μM Cyclic-diAMP or with 10 μM Cyclic-diAMP. Average ± SEM; fold change of ISG15 or interferon β normalized to GAPDH levels following permeablization without Cyclic-diAMP, with 1 μM Cyclic-diAMP or with 10 μM Cyclic-diAMP. (E) Cells were lysed and immunoblotted with α-ISG15 and α-ACTIN following transfection with 800 ng of Listeria genomic DNA, Listeria genomic DNA treated with DNAase or total Listeria RNA for 24 hr; Average ± SEM; values were generated using ImageJ to quantify relative levels of induction of ISG15 compared to ACTIN in three independent experiments. Statistical significance calculated using ANOVA followed by Bonferonni's multiple comparison test against transfection control. Statistical significance is indicated as follows: NS, nonsignificant; *p < 0.05; **p < 0.01; ***p < 0.001.
Figure 2—figure supplement 1
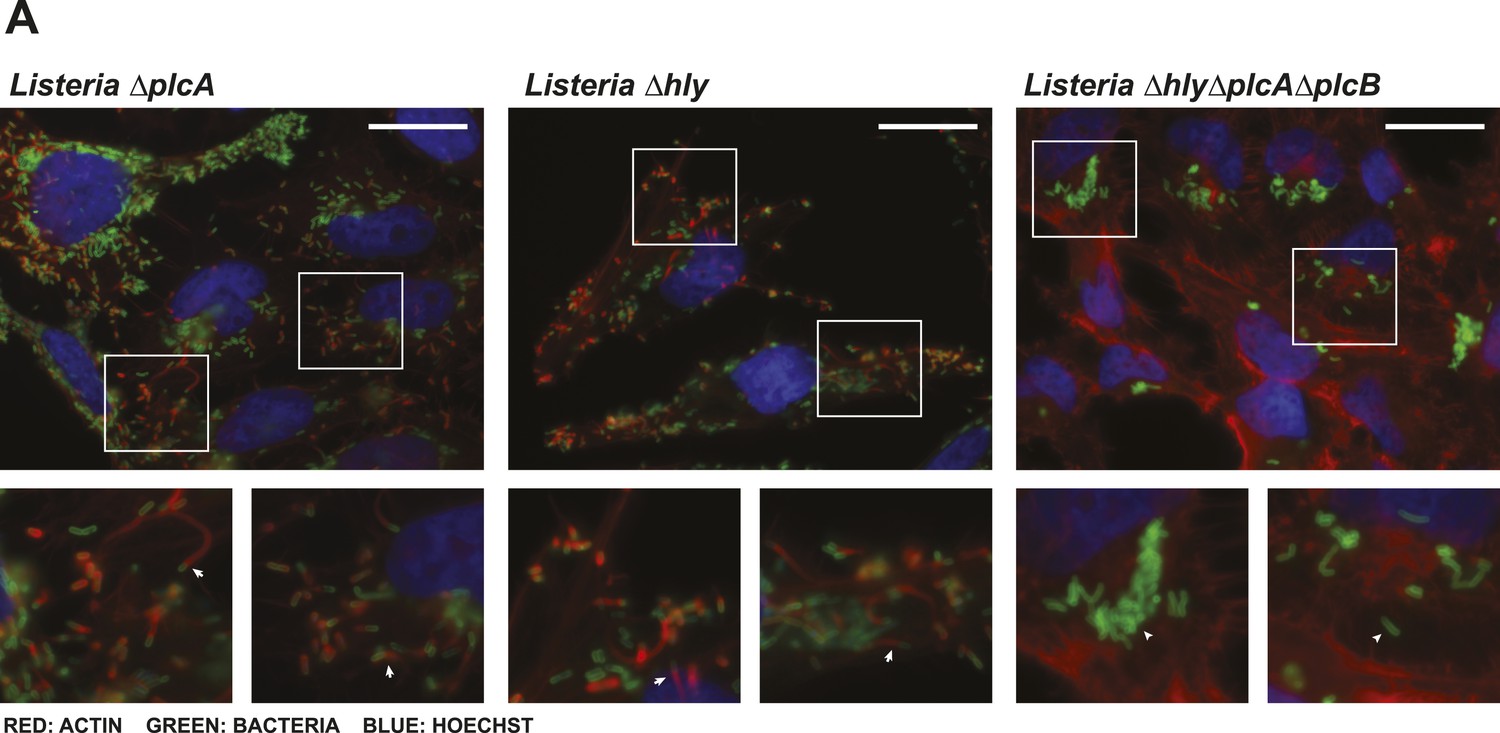
Listeria ΔhlyΔplcAΔplcB does not escape the vacuole.
(A) Immunofluorescence of HeLa cells infected by Listeria EGD-e PrfA* ΔplcA, Listeria EGD-e PrfA* Δhly, or Listeria EGD-e PrfA* Δhly ΔplcA ΔplcB for 6 hr. Actin is depicted in red, Listeria is depicted in green, and Hoechst is depicted in blue (scale bar 25 μm). Arrows indicate examples of actin comet tails, triangles indicate examples of bacteria which do not colocalize with actin. Single mutants escape the vacuole and polymerize actin; however, the triple mutants do not colocalize with actin indicating that they are trapped in the vacuole.
Figure 2—figure supplement 2
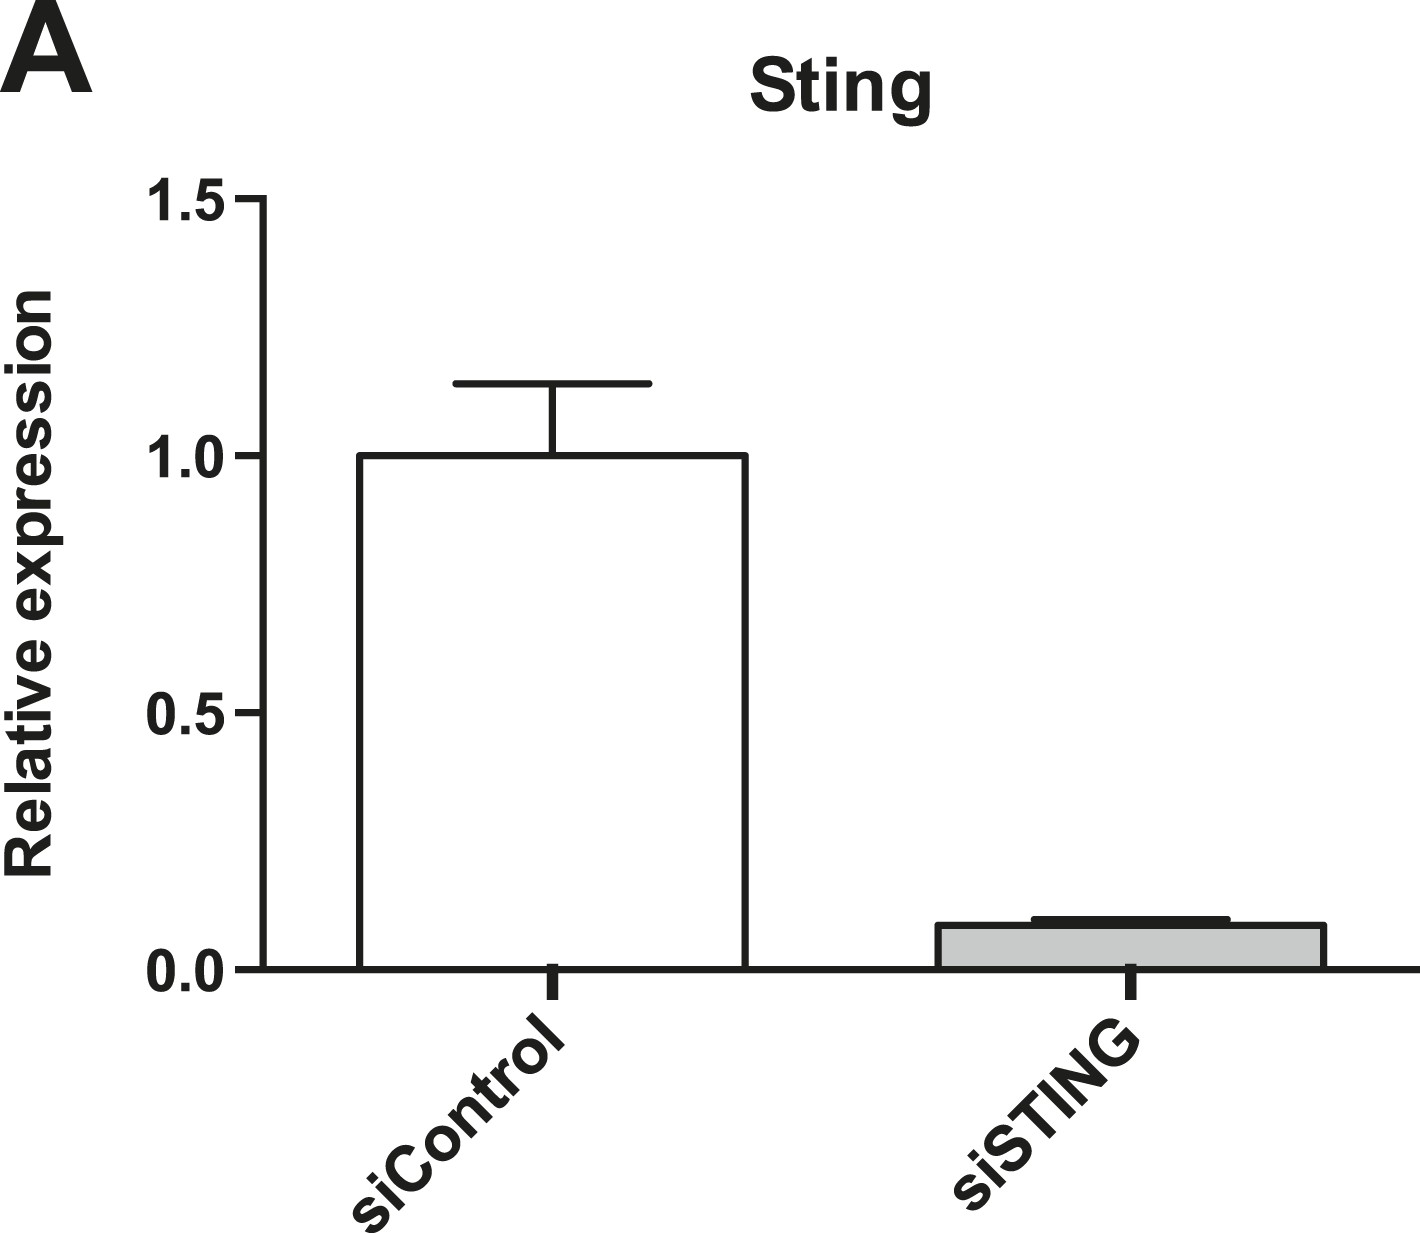
HeLa cells express STING mRNA.
(A) qRT-PCR indicating relative quantity of STING levels normalized to GAPDH levels in HeLa cells treated with siControl or siRNA against STING.
Figure 3 with 2 supplements

ISG15 protects against Listeria infection in vitro and in vivo.
(A) Percentage of bacteria inside HeLa cells, infected at an MOI of 25, which were transduced with empty vector (Control) or stably express ISG15 after 3 hr of infection; CFUs of bacteria within control cells were normalized to 100%, data shown is AVG ± SEM. Statistical significance were determined using two tailed t-test. (B) Percentage of bacteria inside HeLa cells which have been transfected with siControl or siISG15 (15 hr of infection, MOI 25). siControl cells were normalized to 100%, data is shown as AVG ± SEM. Statistical significance determined using two tailed t-test. (C) Primary mouse embryonic fibroblasts (MEFs, Isg15+/+ or Isg15−/−) were infected with Listeria for 4 hr at an MOI of 10. CFUs of bacteria within Isg15+/+ cells were normalized to 100%, and error bars represent ± SEM. Statistical significance determined using two tailed t-test. (D) Data shown is average CFUs per ml ± SEM in Isg15+/+ MEFs vs Isg15−/− MEFs following 4 hr of infection, MOI 10. (E) and (F) Isg15+/+ or Isg15−/− mice were infected intravenously with 5 × 10⁵ of Listeria strain EGD. The liver and spleen were isolated following 72 hr of infection, and CFUs per organ were calculated by serial dilution and replating; circles or squares depict individual animals. The line denotes AVG ± SEM. Significance for in vivo data determined using Mann–Whitney test. (G) RNASeq data of significantly upregulated ISG15-related genes compared with non-infected controls in LoVo cells following Listeria infection for 24 hr. (H) Cells were lysed and immunoblotted with the indicated antibodies following infection with Listeria for 3 hr. (I) Data shown is average CFUs per ml ±SEM in Isg15+/+ MEFs vs Isg15−/− MEFs and in Ube1L+/+ and Ube1L−/− MEFs following 4 hr of infection, using an MOI of 10. Statistical significance is indicated as follows: NS, nonsignificant; *p < 0.05; **p < 0.01; ***p < 0.001.
Figure 3—figure supplement 1
ISG15 protects cells from Listeria infection at early time points.
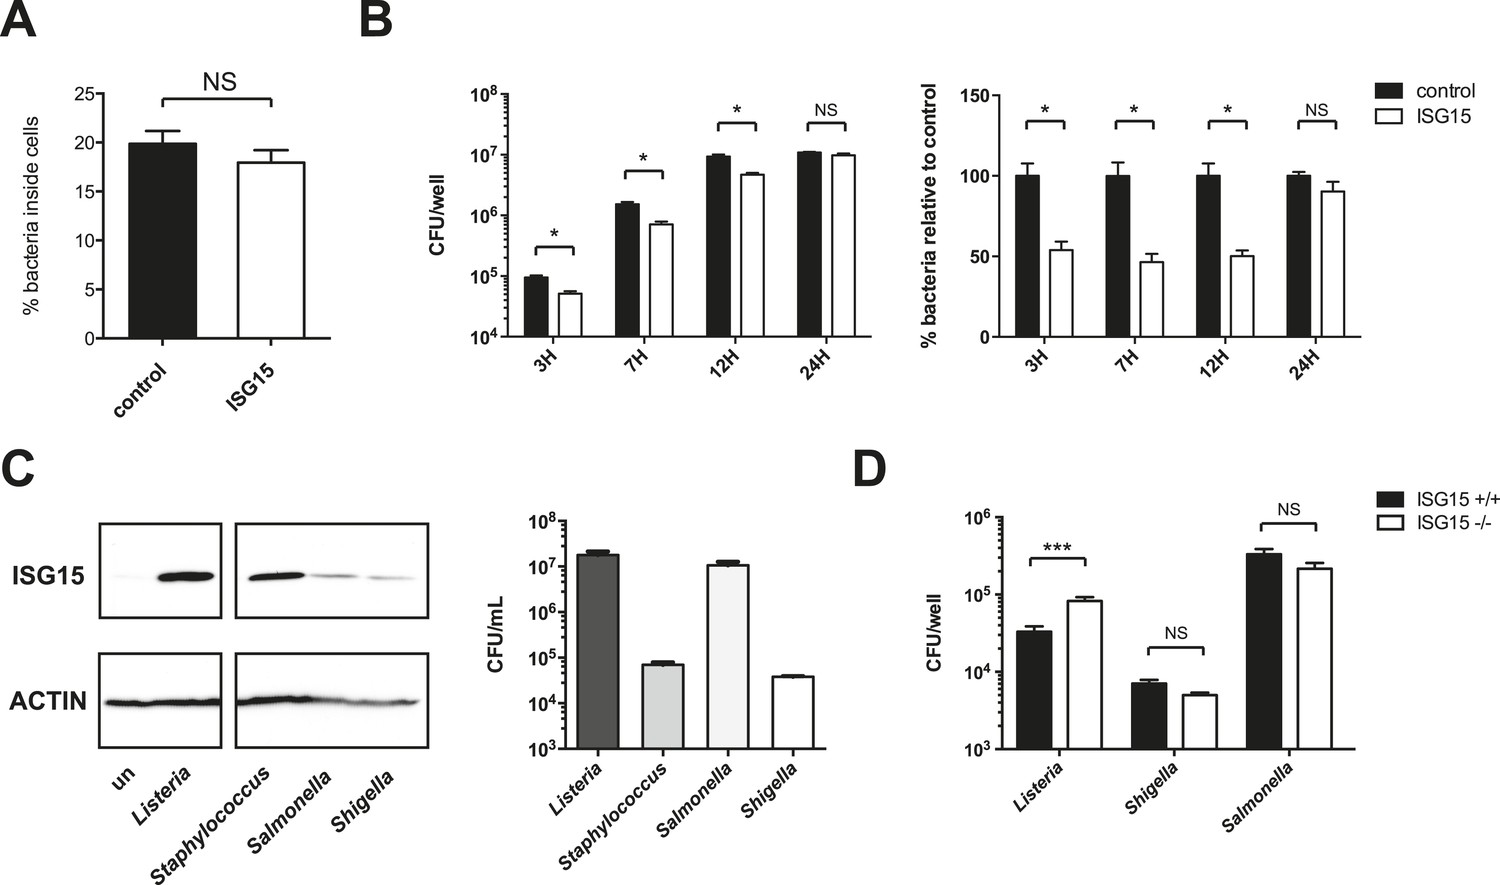
ISG15 is less induced by Gram-negative pathogens and does not protect cells from Salmonella and Shigella infection. (A) Control and ISG15 overexpressing cells were infected with GFP Listeria for 30 min and fixed. External bacteria were marked with an antibody against Listeria, and bacteria were enumerated for entry. Data is represented as percent of bacteria with single GFP labeling (i.e., percent of bacteria within cells). (B) CFUs per well of bacteria inside HeLa cells (control or overexpressing ISG15) over a time course of infection (MOI of 25). Control cells were subsequently normalized to 100%, data are shown is AVG ± SEM. Statistical significance determined using two-tailed t-test. (C) Cells were lysed and immunoblotted with the indicated antibodies following 18 hr of infection with various pathogens: Listeria strain EGD (MOI 10), Staphylococcus aureus (MOI 10), Salmonella typhimurium (MOI 10), and Shigella flexneri (MOI 25). Different MOIs were used at the outset in an attempt to equalize CFUs at the end of the experiment. (D) SV40 transformed MEFs (Isg15+/+ or Isg15−/−) were infected for 4 hr with Listeria strain EGD (MOI 10), S. flexneri (MOI 10) or S. typhimurium (MOI 10). Statistical significance determined using a Mann–Whitney test. Statistical significance is indicated as follows: NS, nonsignificant; *p < 0.05; **p < 0.01; ***p < 0.001.
Figure 3—figure supplement 2
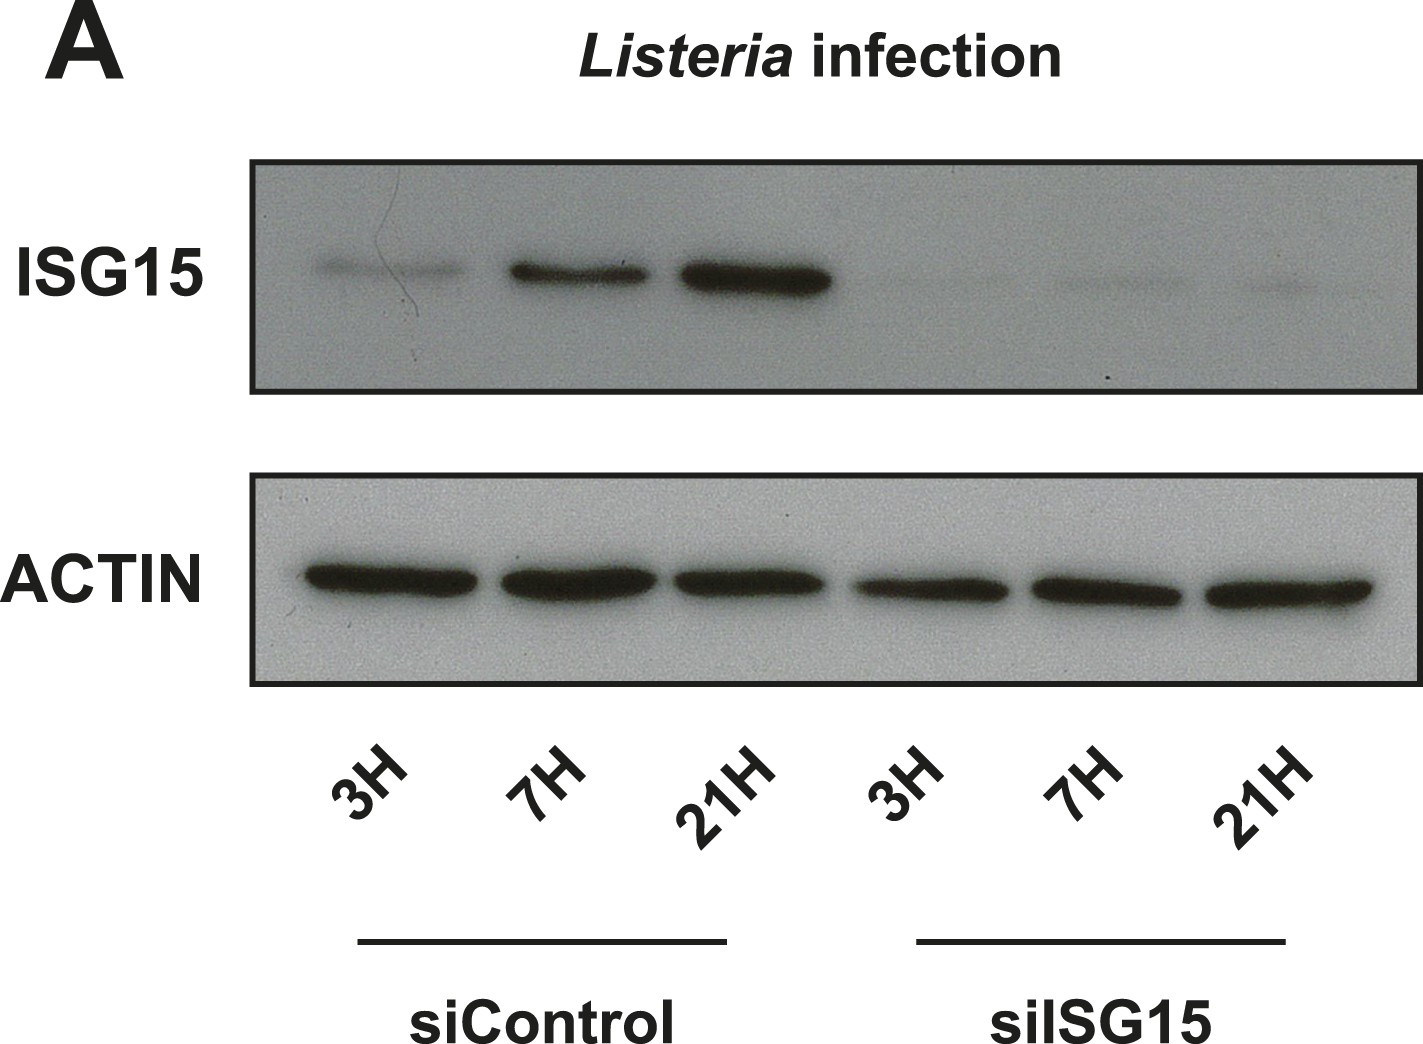
siRNA-mediated knockdown effectively depletes ISG15 during Listeria infection.
(A) Cells were treated with siControl or siISG15 for 24 hr and subsequently infected for the indicated times with Listeria (MOI 25), lysed and immunoblotted with α-ISG15 and α-ACTIN antibodies. Extremely efficient knockdown was achieved.
Figure 4
Schematic representation of ISG15 targets identified by proteomics.
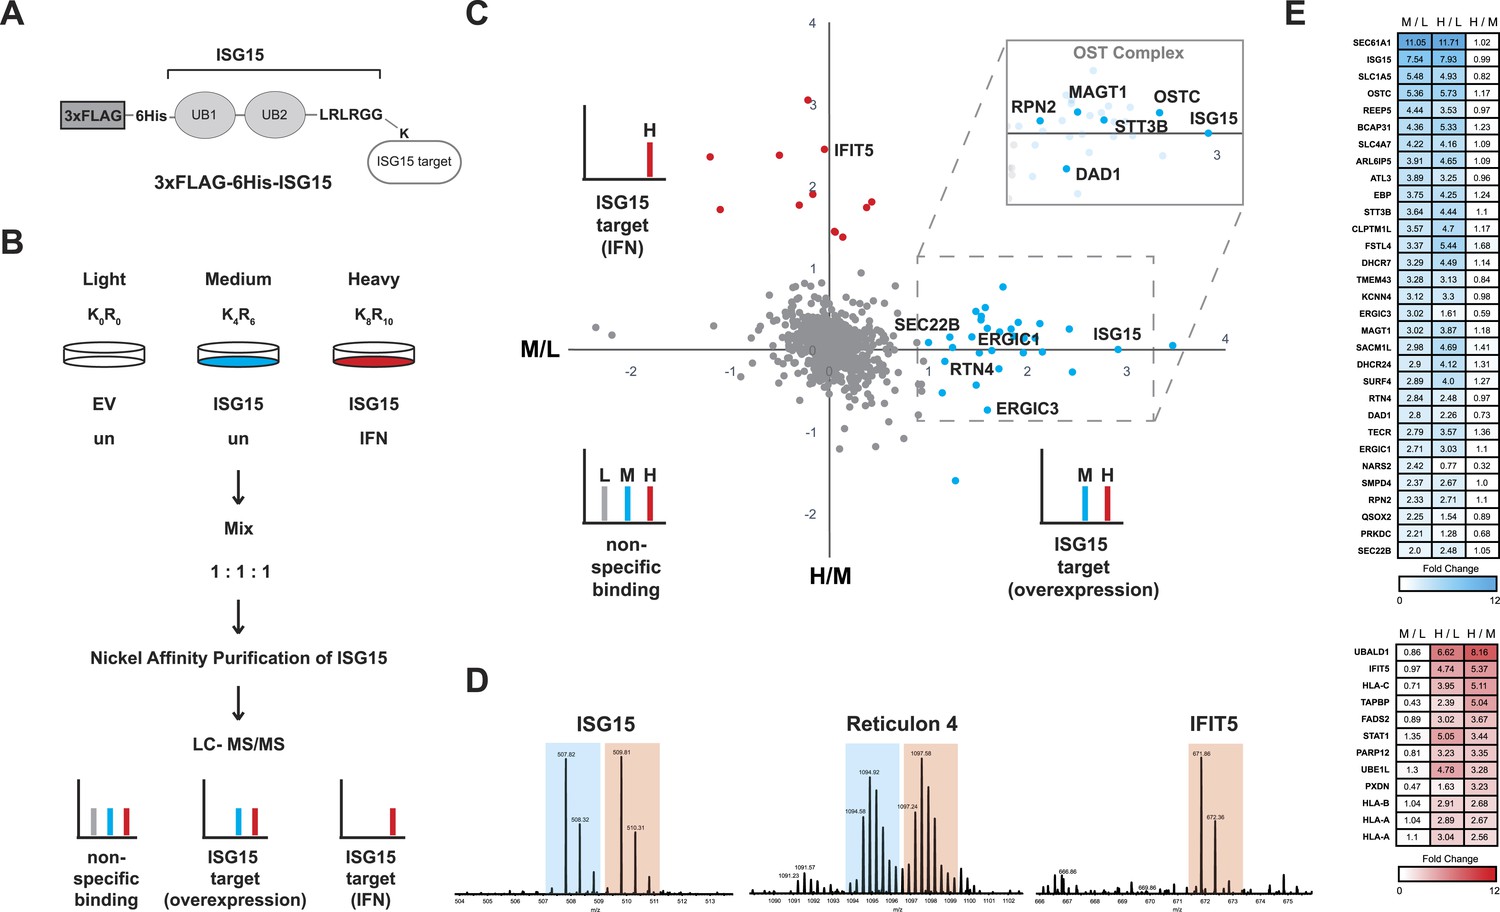
(A) Epitope-tagged ISG15 (3XFLAG-6His-ISG15) represented binding to an unknown target via isopeptide linkage. ISG15 has a stop codon engineered following the LRLRGG motif truncating the amino acid sequence which in wild-type ISG15 would be removed by USP18 during maturation. (B) Scheme for enrichment of ISGylated targets using SILAC. Equal protein amounts of each condition were combined, nickel affinity purified, and then analyzed by LC-MS/MS. (C) Scatter plot of Log2 transformed ISGylated proteins. The X axis displays the medium (M) condition over light (L), which is ISG15 overexpression over empty vector control (in blue), and the Y axis displays the heavy (H) condition over medium (M), which is interferon treatment over ISG15 expression (in red). Cut-off was determined as M/L ratio of greater than or equal to one for ISG15 targets and H/M ratio of greater than or equal to one for interferon ISGylation targets. Inset is a representation of ISG15 targets from the OST Complex. Other targets identified are proteins involved in ER morphology or ER to Golgi transport. (D) Representative MS spectra from ISG15, RTN4 and IFIT5 peptides: 100LTQTVAHLK108 from ISG15, 2+; 58KPAAGLSAAPVPTAPAAGAPLMDFGNDFVPPAPR91 from RTN4, 3+ and 207AVTLNPDNSYIK218 from IFIT5, 2+. (E) Heat map of fold change of ISGylated proteins following ISG15 overexpression (in blue) and of ISGylated proteins following interferon treatment (in red).
-
Figure 4—source data 1
Enlarged heat map with protein identifiers related to Figure 4E.
Heat map of fold change of ISGylated proteins following ISG15 overexpression (in blue) and of ISGylated proteins following interferon treatment (in red). For each protein, the log2 values of the normalized M/L, normalized H/L, and normalized H/M ratios are displayed on the heat map.
- https://doi.org/10.7554/eLife.06848.012
Figure 5 with 3 supplements
ISGylation modifies ER and Golgi proteins and increases canonical secretion.
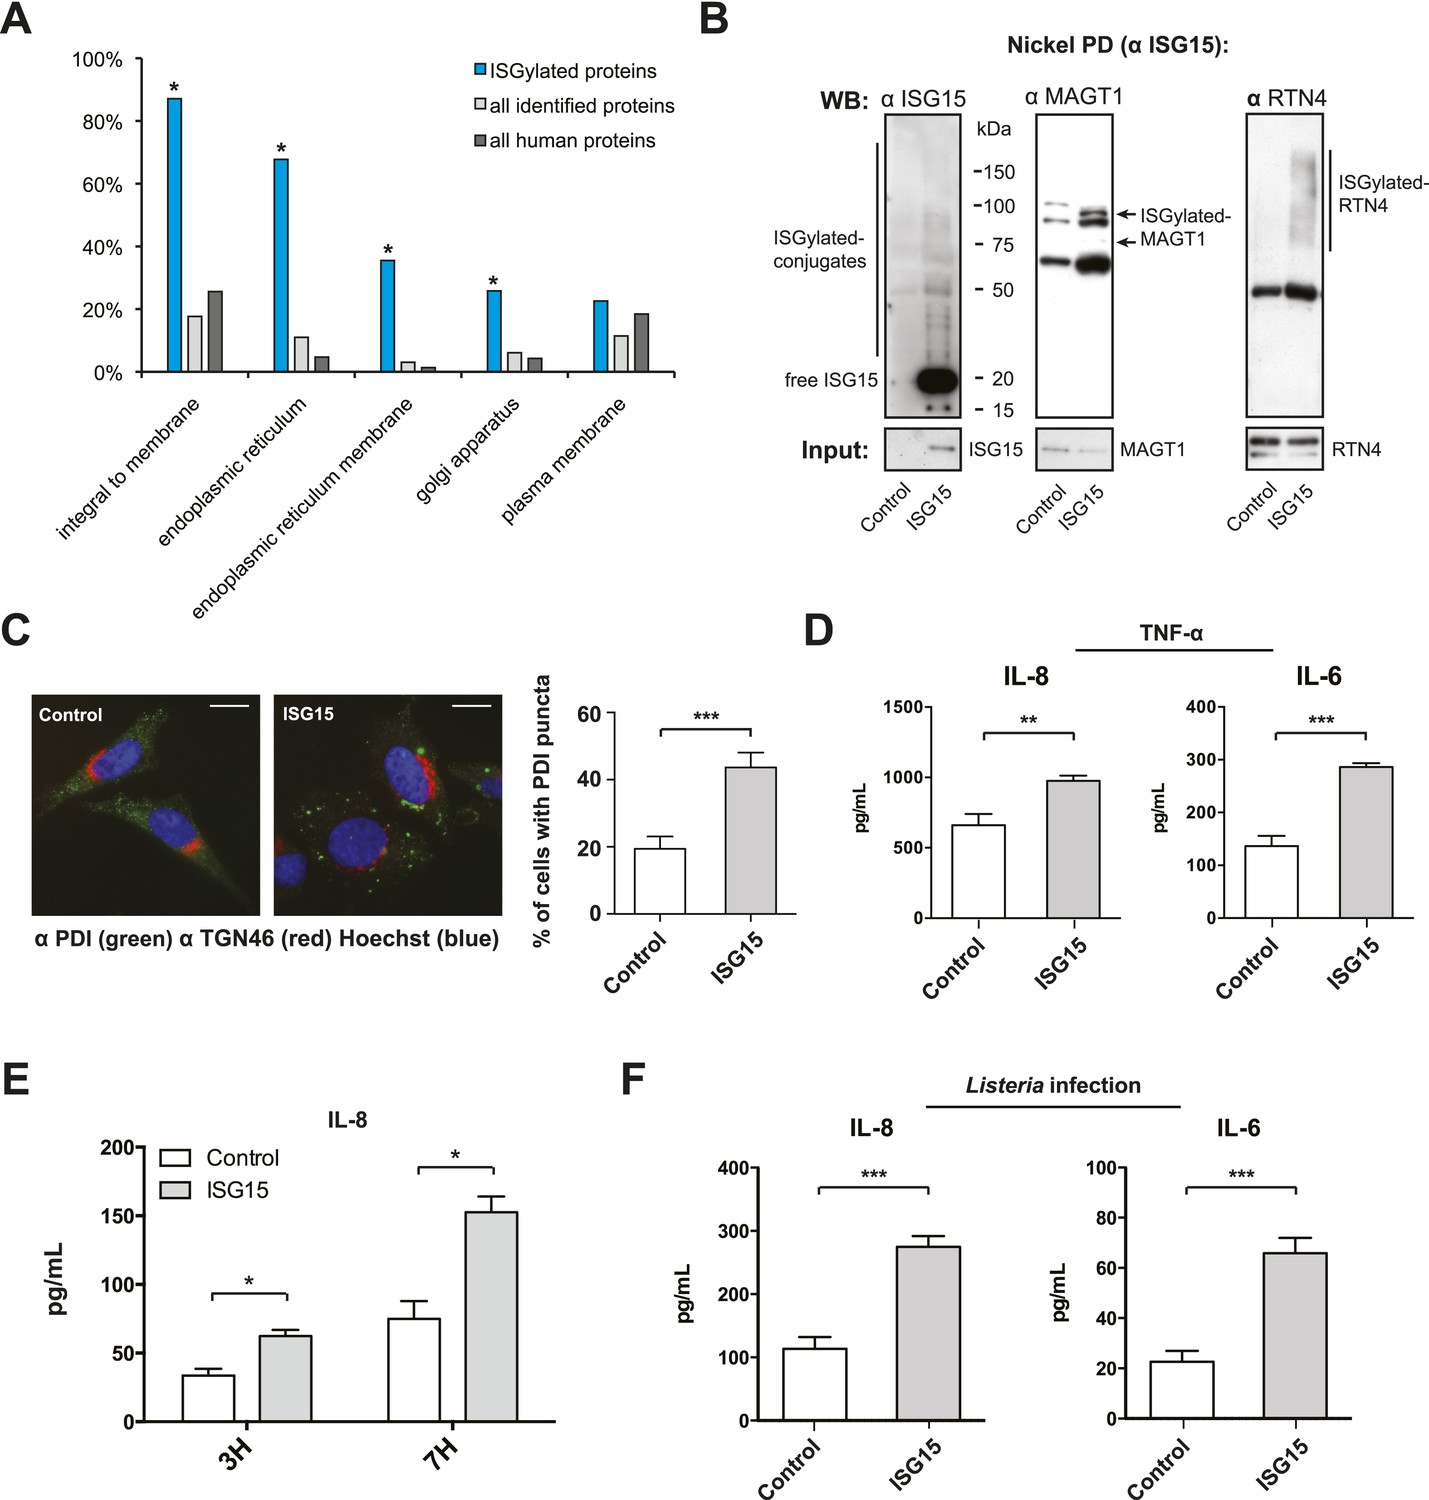
(A) Gene ontology (GO) analysis of ISGylated proteins enriched following ISG15 overexpression (blue) relative to all proteins identified in this analysis (light gray) and all human proteins as annotated by the Uniprot/Swiss-prot database (dark gray). (B) Nickel affinity purification of ISG15 in empty-vector control or ISG15 overexpression cells followed by α-ISG15, α-MAGT1, and α-RTN4 immunoblot. Input is 0.1% of the initial affinity purification volume. Higher molecular weight species corresponding to ISGylated RTN4 or MAGT1 are indicated. (C) Cells were fixed and immunostained with α-PDI antibody (green), with α-TGN46 (red) and Hoechst (blue). Cells with four or more large puncta were enumerated as cells with PDI clusters, a minimum of 100 cells were counted per experiment, and data are shown as percentage of cells with PDI clusters; AVG ± SEM. Statistical significance determined using two-tailed t-test. (D) The indicated cells were treated with 20 ng/ml TNF-α for 24 hr in a 96-well format. 100 μl of supernatant was collected for each ELISA and assayed for the presence of IL-8 and IL-6. Statistical significance determined using two-tailed t-test. (E) The indicated cells were infected for 3 or 7 hr with Listeria (MOI 25) in a 96-well format, supernatants were collected and 100 μl of supernatant was used for an IL-8 ELISA. Statistical significance determined using two-tailed t-test. (F) The indicated cells were either infected with Listeria (MOI 25) for 24 hr in a 96-well format. 100 μl of supernatant was collected for each ELISA and assayed for the presence of IL-6 or IL-8. Statistical significance determined using two-tailed t-test. Statistical significance is indicated as follows: NS, nonsignificant; *p < 0.05; **p < 0.01; ***p < 0.001.
Figure 5—figure supplement 1
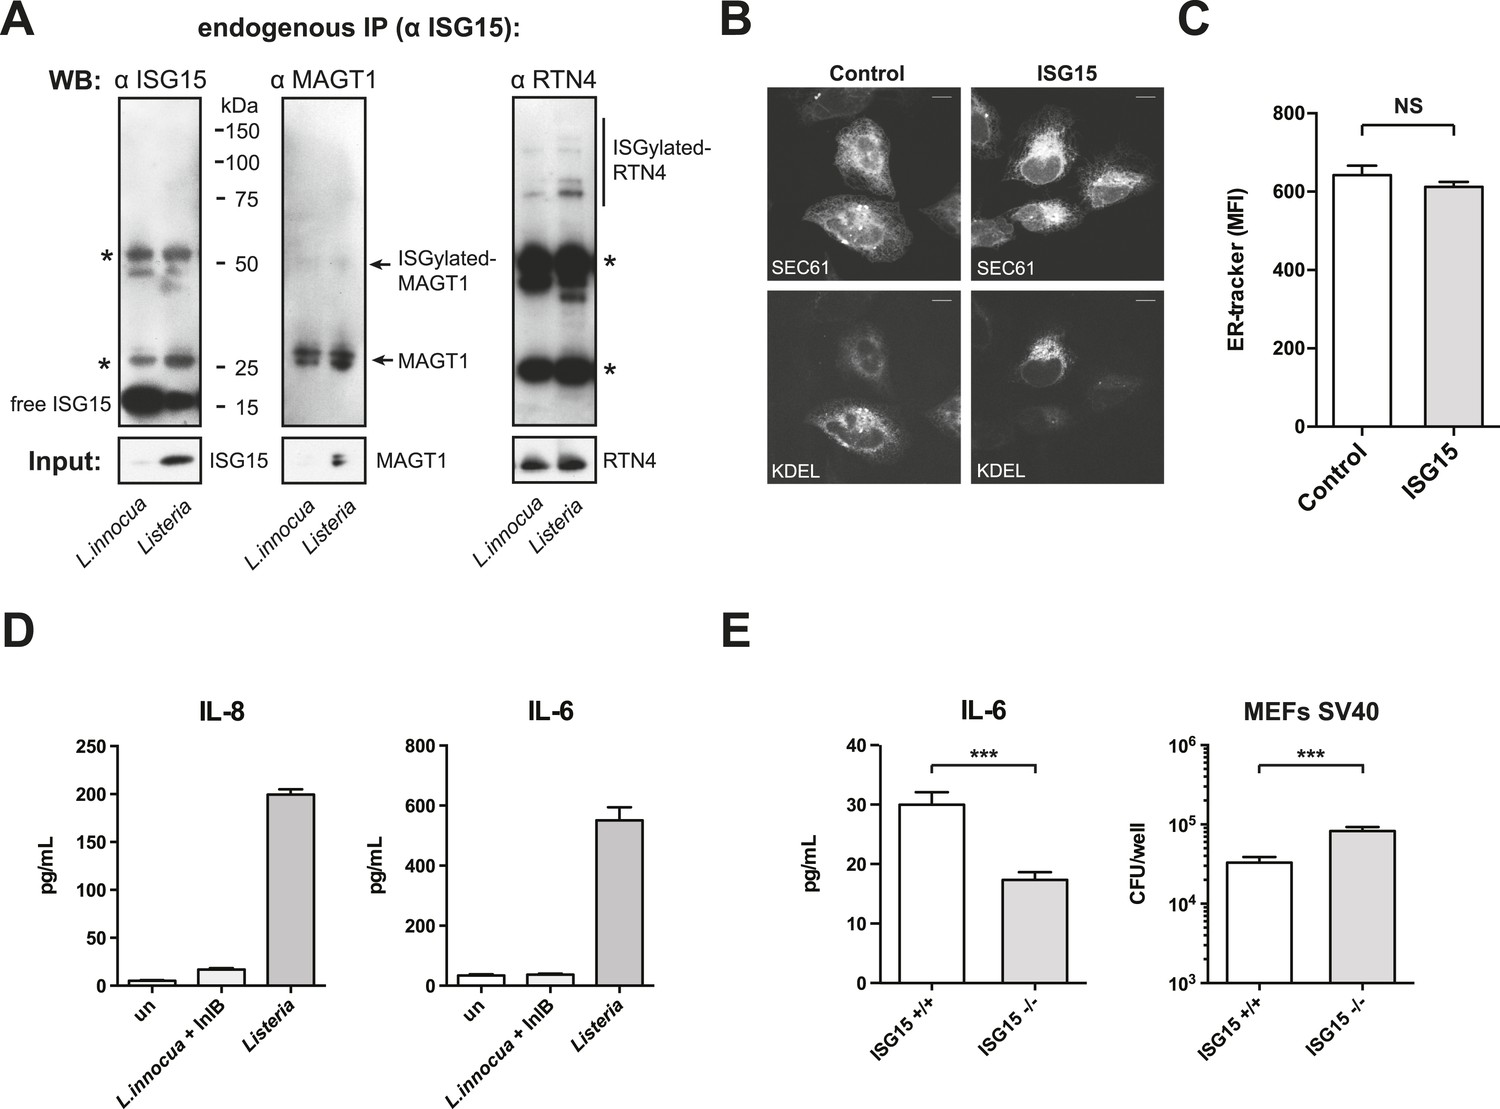
ISG15 covalently modifies RTN4 and MAGT1 following infection.
ISG15-overexpression does not lead to changes in SEC61 or KDEL distribution or to changes in ER mass. Listeria infection increases IL-8 and IL-6 secretion and Isg15−/− MEFs secrete less IL-6 than Isg15+/+ mefs. (A) Cells were infected with L. innocua expressing InlB or Listeria for 24 hr (MOI 10) and harvested for immunoprecipitation (input is 1.5% of IP). Higher molecular weight species corresponding to ISGylated RTN4 or MAGT1 are indicated. Asterisks denote background bands from antibody heavy and light chain. (B) Control or ISG15-overexpressing cells transfected with GFP-SEC61 and BFP-KDEL (scale bar is 10 μm). (C) Mean-fluorescence intensity of ER-tracker staining of control or ISG15-overexpressing cells. (D) IL-8 and IL-6 production in HeLa cells following infection with Listeria or L. innocua expressing InlB. The indicated cells were infected in a 96-well format, supernatants were collected, and 100 μl of supernatant was used for the ELISAs. (E) IL-6 secretion in Isg15+/+ or Isg15−/− MEFs (SV40 transformed) infected with Listeria (MOI 25) for 4 hr; CFUs/well in Isg15+/+ or Isg15−/− MEFs following Listeria infection. Statistical significance determined using a Mann–Whitney test. Statistical significance is indicated as follows: NS, nonsignificant; *p < 0.05; **p < 0.01; ***p < 0.001.
Figure 5—figure supplement 2
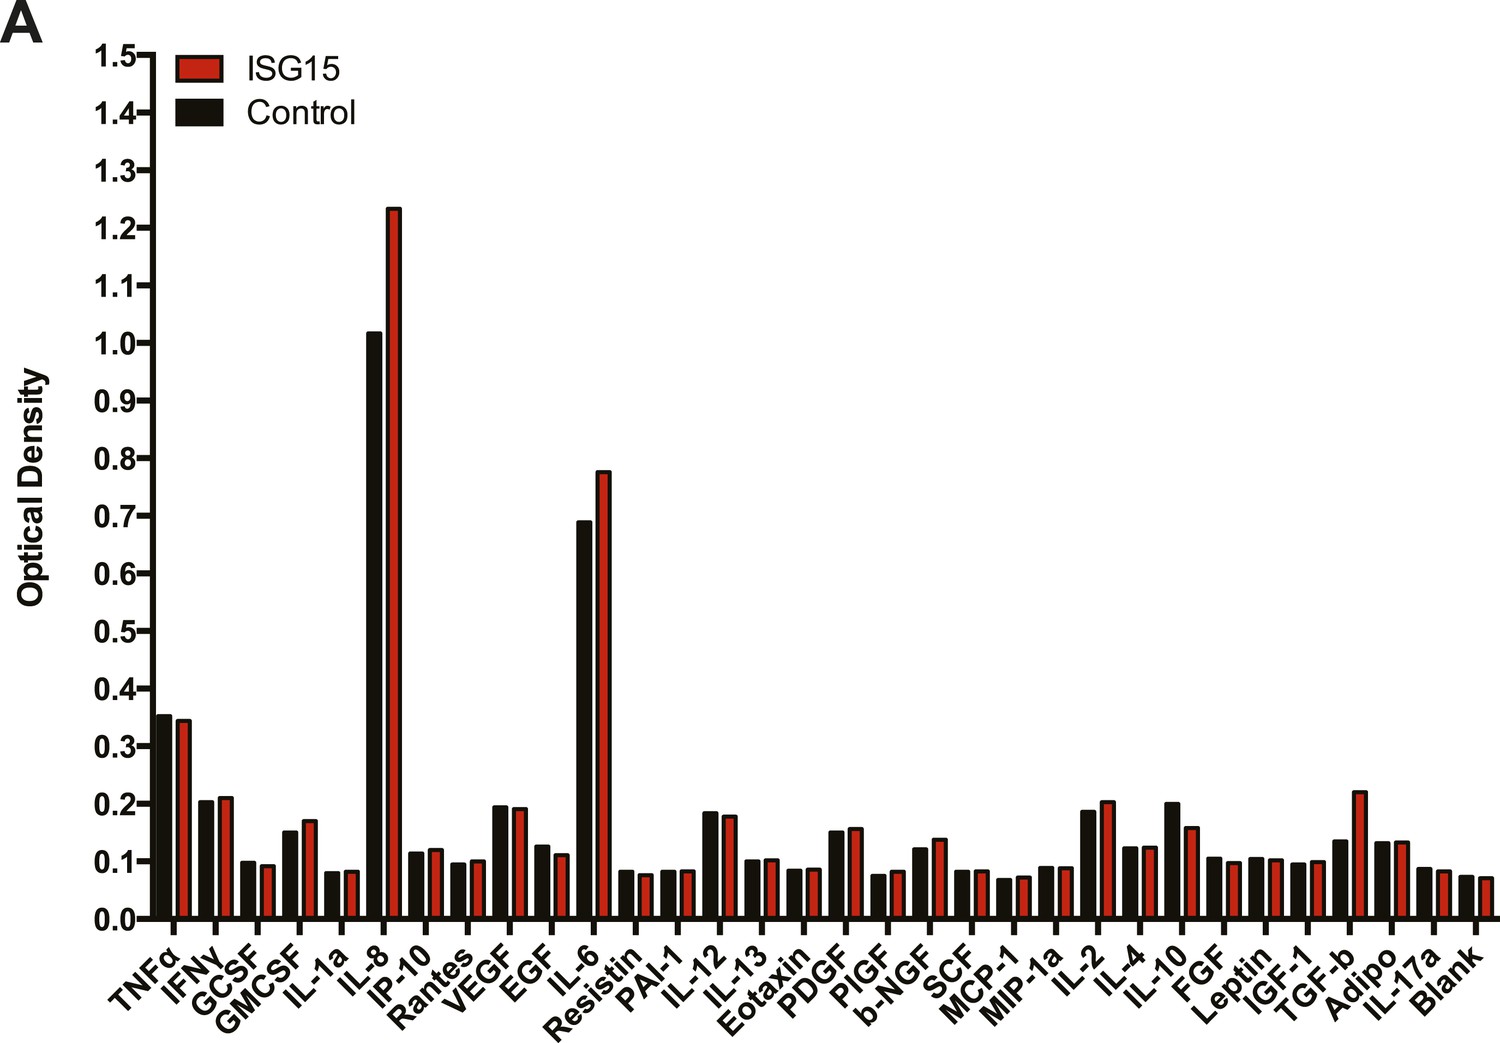
Non-biased assay of 31 cytokines following TNFα treatment in control vs ISG15-overexpressing cells.
(A) Control cells and ISG15-overexpressing cells were treated with 20 ng/ml TNFα for 24 hr. The supernantant was collected and each sample was aliquoted into precoated wells (31) from a commercial human cytokine array (Signosis). ELISAs against the indicated cytokines were performed.
Figure 5—figure supplement 3
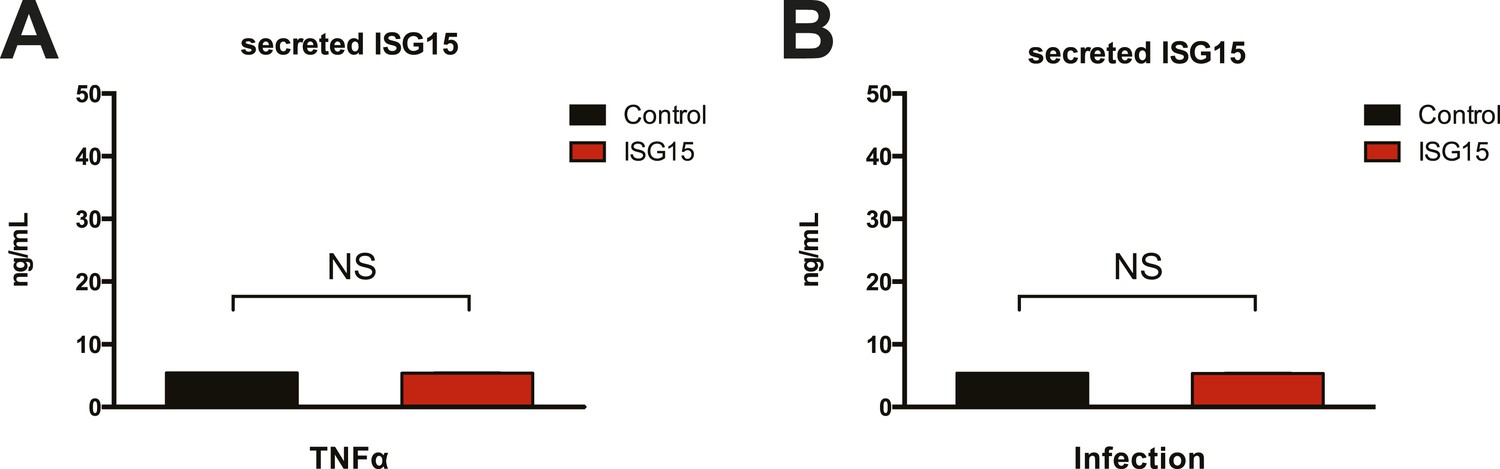
ISG15 is not secreted as a cytokine from HeLa cells following TNFα treatment or Listeria infection.
(A) Control and ISG15-overexpressing cells were treated with 20 ng/ml TNFα for 24 hr. Supernatants were collected and assayed for secreted ISG15. (B) Control and ISG15-overexpressing cells were infected with Listeria for 24 hr, supernantants were collected and assayed for secreted ISG15.
Tables
Table 1
Bacterial strains used in this study
| Bacterial species | Strain |
|---|---|
| Listeria monocytogenes | EGD BUG600 |
| Listeria monocytogenes Δhly | EGD BUG2132 |
| Listeria monocytogenes ΔactA | EGD BUG2140 |
| Listeria innocua | Clip11262 BUG499 |
| Listeria innocua (InlB) | Clip11262 BUG1642 |
| Staphylococcus aureus | SH1000 |
| Salmonella typhimurium | SR-11 |
| Shigella flexneri | M90T |
| Listeria monocytogenes | EGD-e PrfA* BUG3057 |
| Listeria monocytogenes ΔplcA | EGD-e PrfA* BUG3646 |
| Listeria monocytogenes Δhly | EGD-e PrfA* BUG3647 |
| Listeria monocytogenes Δhly ΔplcA ΔplcB | EGD-e PrfA* BUG3648 |
| Listeria monocytogenes | EGD-e BUG1600 |
Download links
A two-part list of links to download the article, or parts of the article, in various formats.
Downloads (link to download the article as PDF)
Open citations (links to open the citations from this article in various online reference manager services)
Cite this article (links to download the citations from this article in formats compatible with various reference manager tools)
ISG15 counteracts Listeria monocytogenes infection
eLife 4:e06848.
https://doi.org/10.7554/eLife.06848


