Synaptic activity regulates AMPA receptor trafficking through different recycling pathways
- University of Chicago, United States
- Marine Biological Laboratory, United States
- University of Auckland, New Zealand
Figures
Figure 1 with 6 supplements
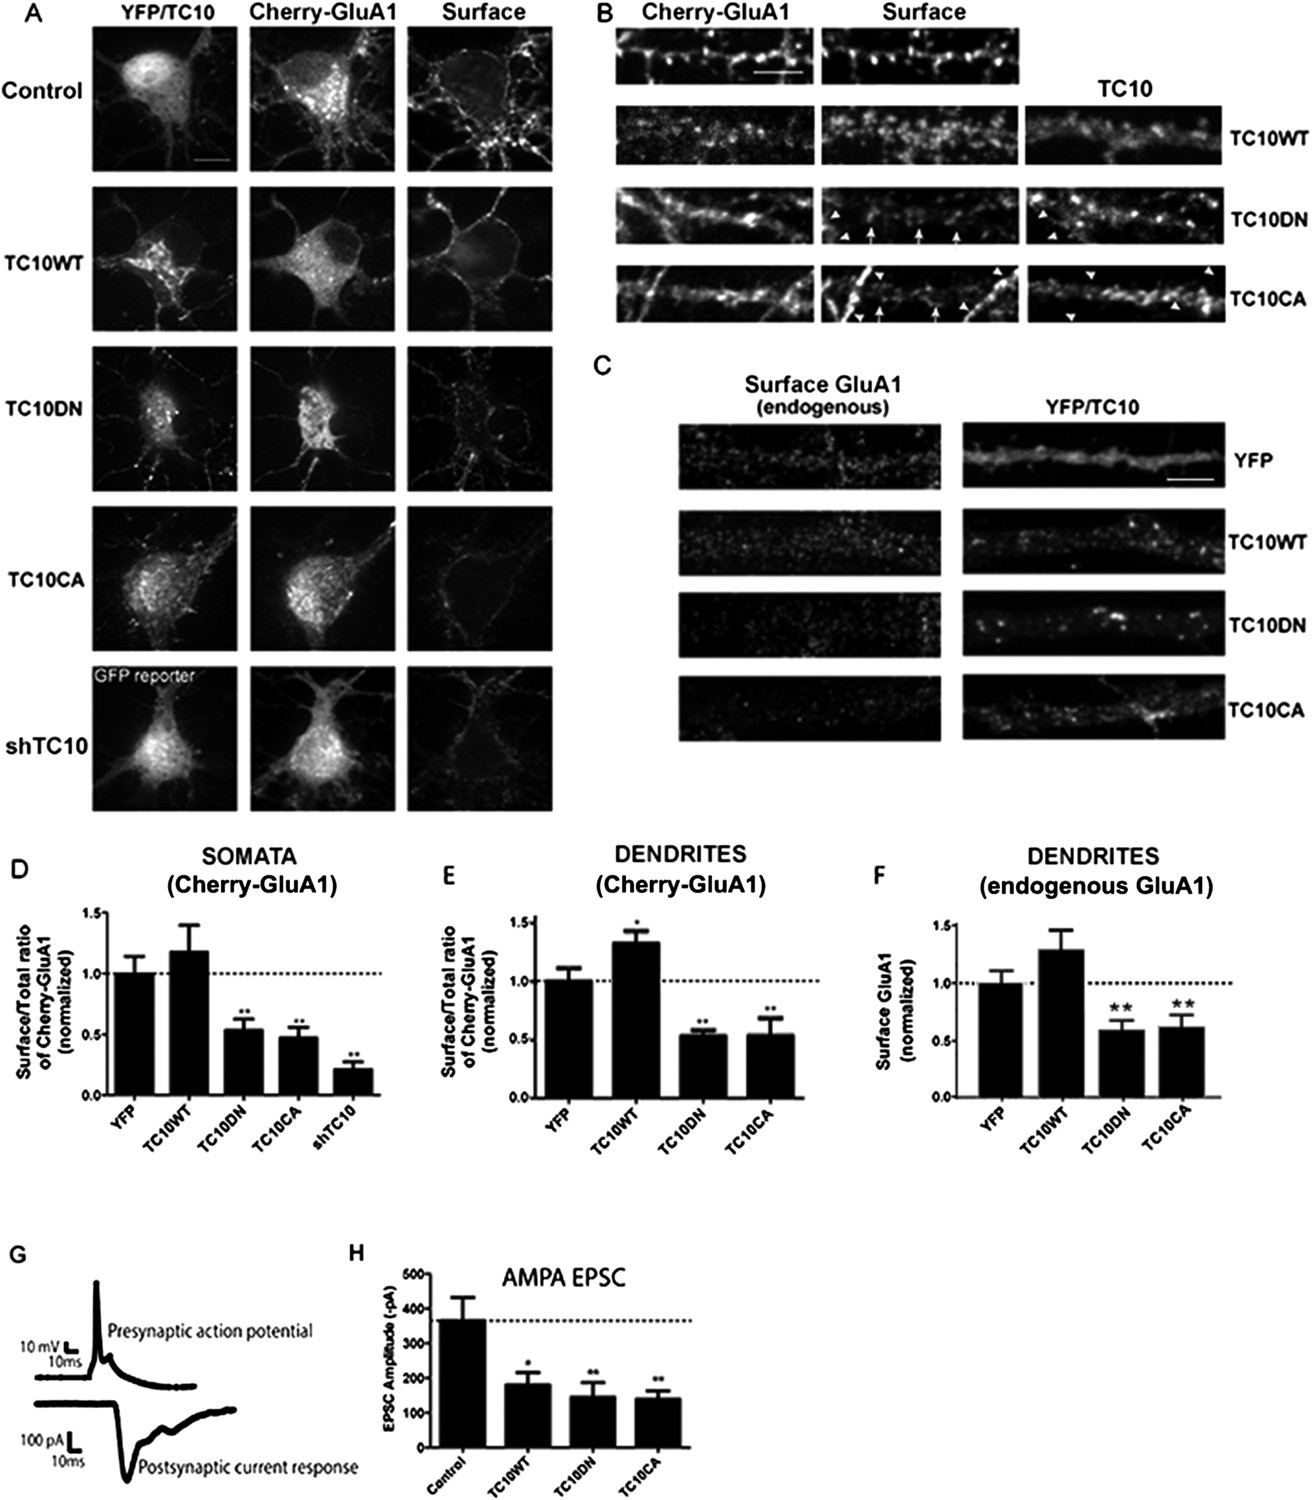
Disrupting TC10 level or function reduced AMPARs on the cell surface.
(A) Representative somata of cultured rat hippocampal neurons (E18) expressing mCherry-tagged GluA1 subunits, free Venus (Control), shTC10RNA or Venus-tagged TC10WT, TC10DN or TC10CA. Intact, live neurons (DIV18) were stained with anti-RFP antibody to visualize surface AMPA-type glutamate receptors (AMPARs) and then fixed and processed. Images of the whole neuron for each of the shown somata are displayed in Figure 1—figure supplement 2. (Scale bar = 10 μm). (B) Representative dendrites of neurons expressing mCherry-GluA1 without TC10 or with TC10WT, TC10DN, or TC10CA. Arrows indicate dendrites expressing TC10 mutants (TC10DN or CA) with weak surface expression of GluA1; arrowheads mark dendrites expressing mCherry-GluA1 without TC10 mutant expression and normal GluA1 surface expression level. (Scale bar = 5 μm). (C) Representative dendrites of intact neurons expressing either free Venus (Control), TC10WT, TC10DN, or TC10CA and labeled with an N-terminal, anti-GluA1 mAb to visualize endogenous, surface GluA1 receptors. (Scale bar = 5 μm). (D) Quantification of the surface/total ratio of mCherry-GluA1 at the somata of transfected cells in (A). Data are shown as ± SEM; control cells (YFP) 100% ± 14%, n = 32; TC10WT cells 118% ± 22%, n = 17; TC10DN cells 53% ± 9%, n = 23; TC10CA cells 47% ± 9%, n = 14; and shTC10 cells 21% ± 7%, n = 10. (**p < 0.03 relative to TC10WT). (E) Quantification of the surface/total ratio of mCherry-GluA1 in dendrites of transfected cells in (B). Data are shown as ± SEM; control cells (YFP) 100% ± 12%, n = 23; TC10WT cells 133% ± 11%%, n = 23; TC10DN cells 53% ± 5%, n = 23; and TC10CA cells 54% ± 15%, n = 8. (*p < 0.03 relative to YFP;**p < 0.02 relative to TC10WT). (F) Quantification of endogenous surface GluA1 on dendrites in (C). Data are shown as mean ± SEM; control cells (YFP) 100% ± 11%; TC10WT cells 130% ± 17%; TC10DN cells 59% ± 8%; and TC10CA cells 62% ± 10% (n = 7–10 cells per group; **p < 0.003 relative to TC10WT). (G) Representative whole-cell patch-clamp paired recordings showing the evoked presynaptic action potential (top) and the post-synaptic AMPAR-mediated current response (below). (H) Average AMPAR-mediated EPSC amplitudes of untransfected neurons (control) 365.2 ± 67 pA, n = 16 and neurons transfected with TC10WT 180.3 ± 36 pA, n = 8; TC10DN 144.5 ± 42 pA, n = 14; or TC10CA 139.2 ± 24 pA, n = 11. (*p < 0.04 relative to control;**p < 0.02 relative to control).
Figure 1—figure supplement 1
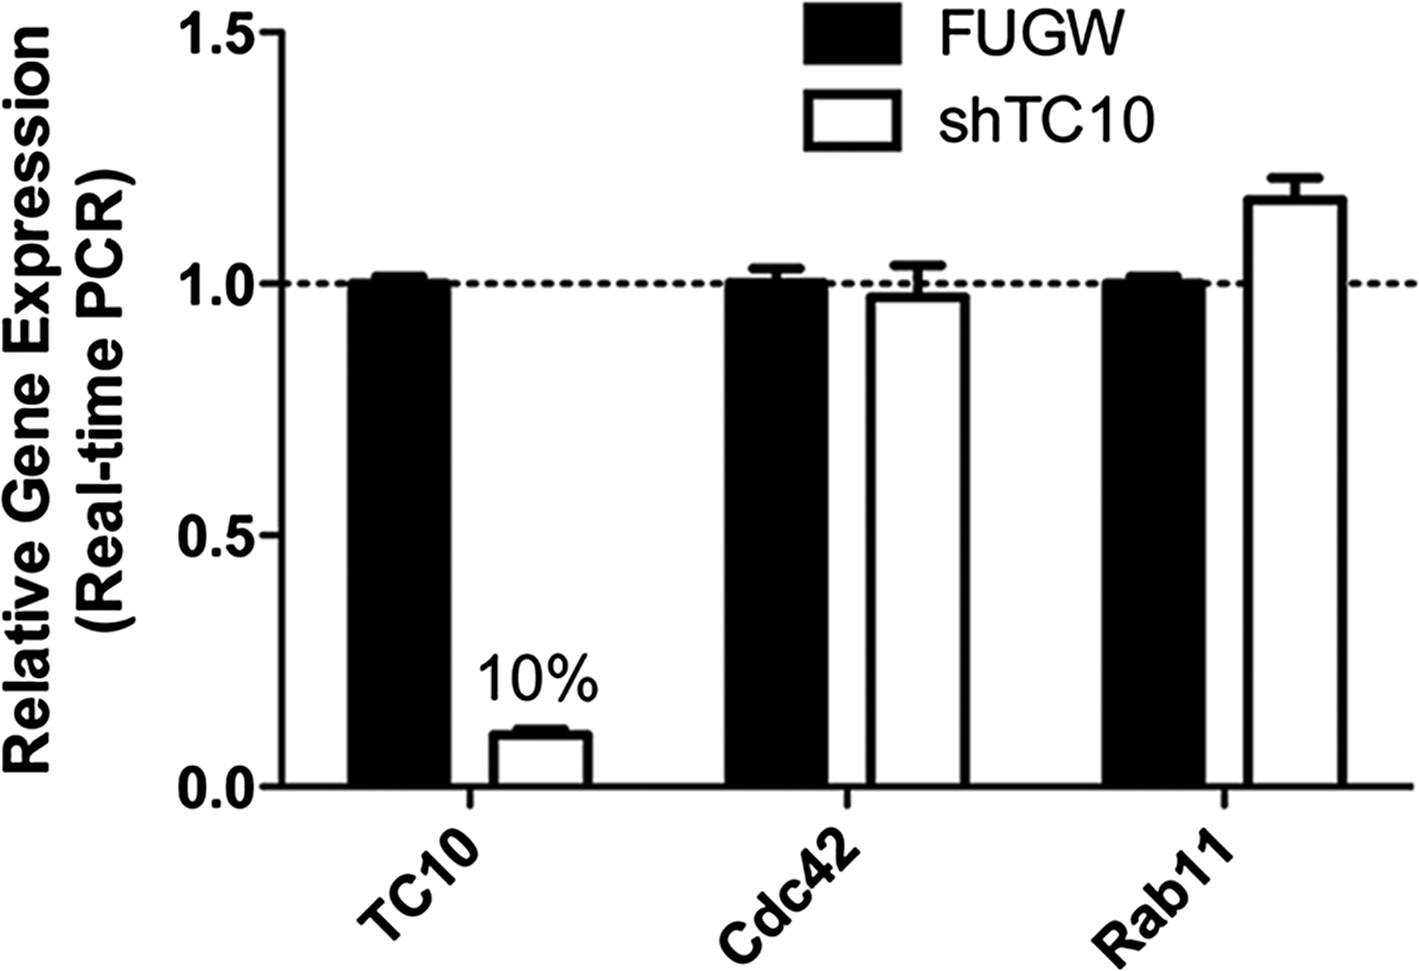
TC10 RNAi (shRNA) knocked down endogenous TC10 expression in neurons.
Cortical neurons were infected with lentivirus encoding FUGW empty vector or TC10 short hairpin RNA construct (shRNA) on DIV7 and lysed for real-time PCR on DIV11. shTC10 specifically knocked down TC10 mRNA level by 90%, but not the expression of Cdc42 and Rab11.
Figure 1—figure supplement 2
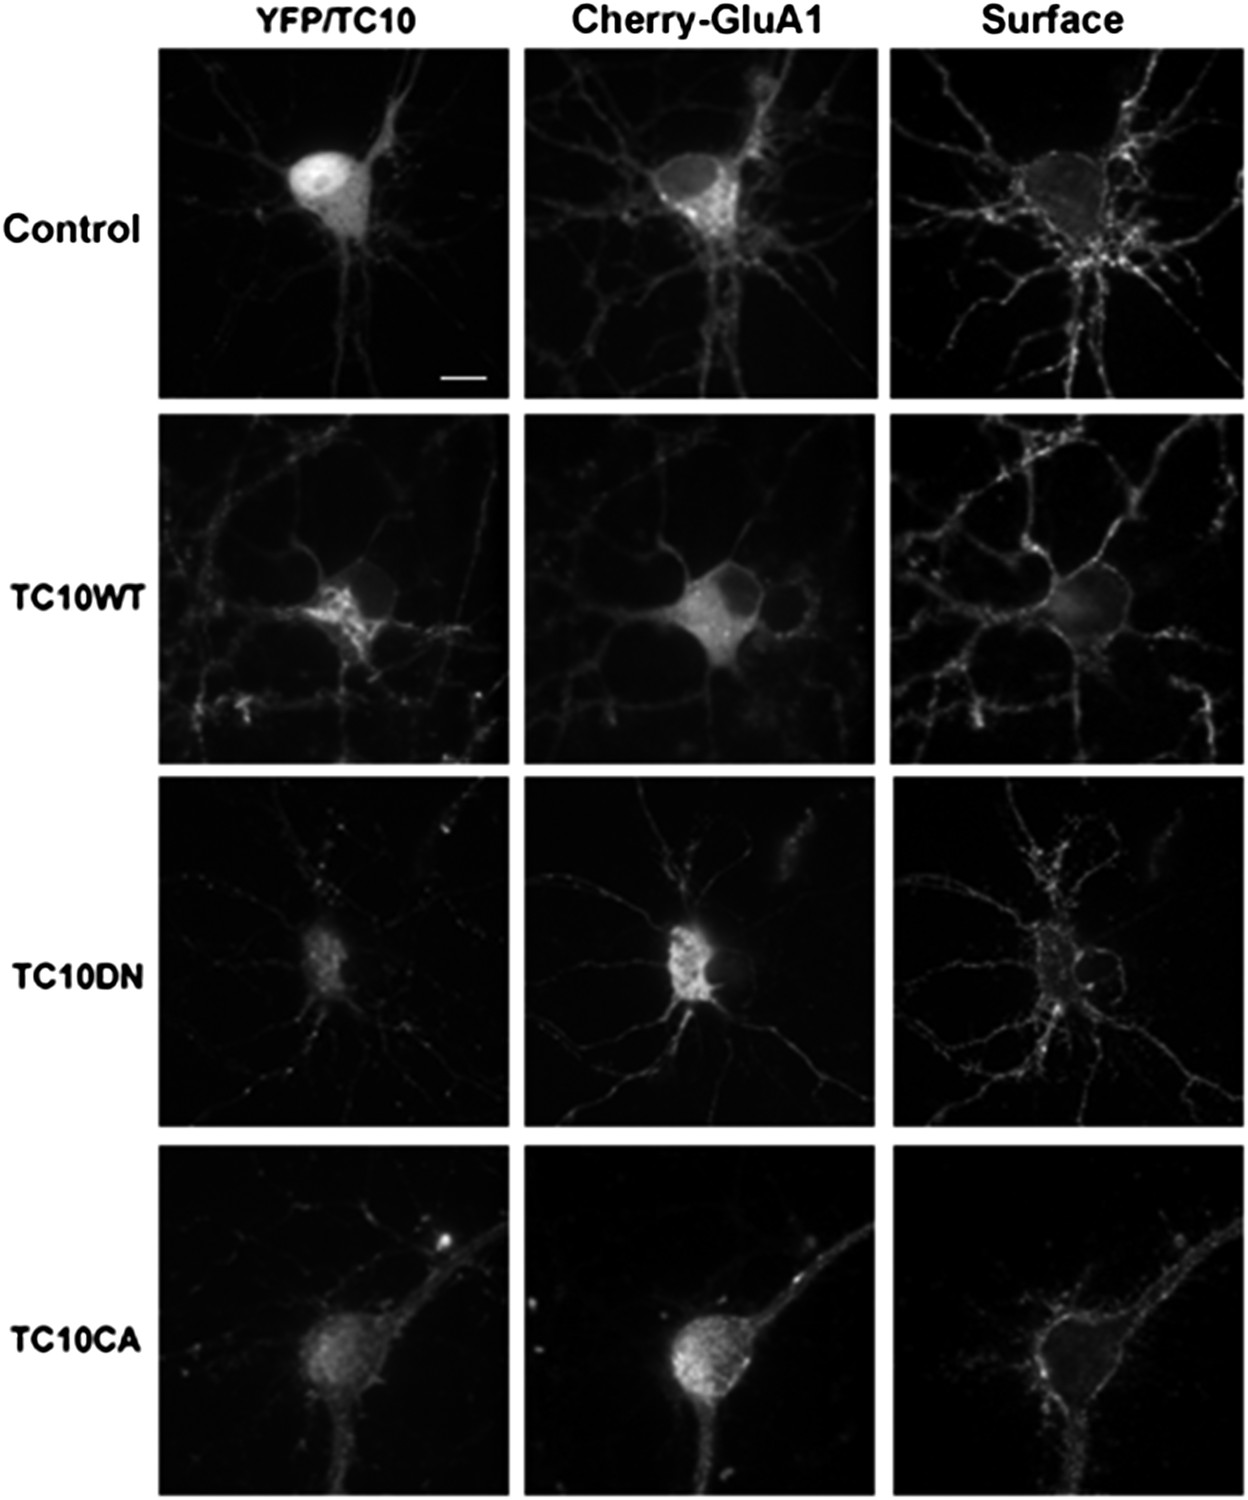
Low-magnification images of cultured rat hippocampal neurons (E18) corresponding to the somata shown in Figure 1A.
Neurons express mCherry-tagged GluA1 subunits and either free Venus (Control), TC10WT, TC10DN, or TC10CA. Intact, live neurons (DIV18) were stained with anti-RFP antibody to visualize surface AMPARs and then fixed and imaged. (Scale bar = 10 um).
Figure 1—figure supplement 3

TC10 mutants do not change synaptic density.
The density of synapsin (SYN) puncta (number of puncta/um) remained unchanged when TC10WT or TC10DN/CA mutants were expressed (n.s. = not significant).
Figure 1—figure supplement 4
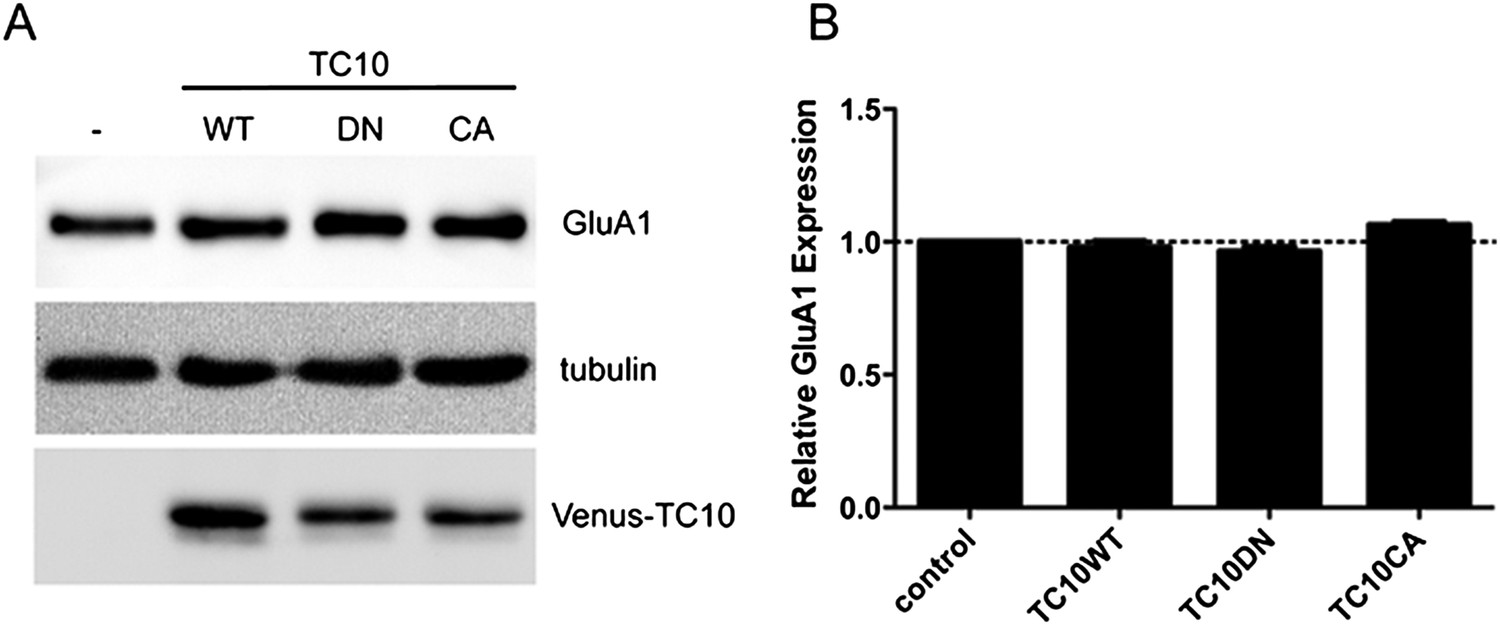
TC10 mutants do not change the expression level of GluA1.
(A) Cortical neurons were infected with lentivirus encoding Venus-TC10WT or TC10DN/CA mutants on DIV1 and assayed for GluA1 expression with Western blot on DIV18. The expression of GluA1 remained unchanged. (B) Quantification of GluA1 expression level in (A), normalized to tubulin (n=3 experiments).
Figure 1—figure supplement 5
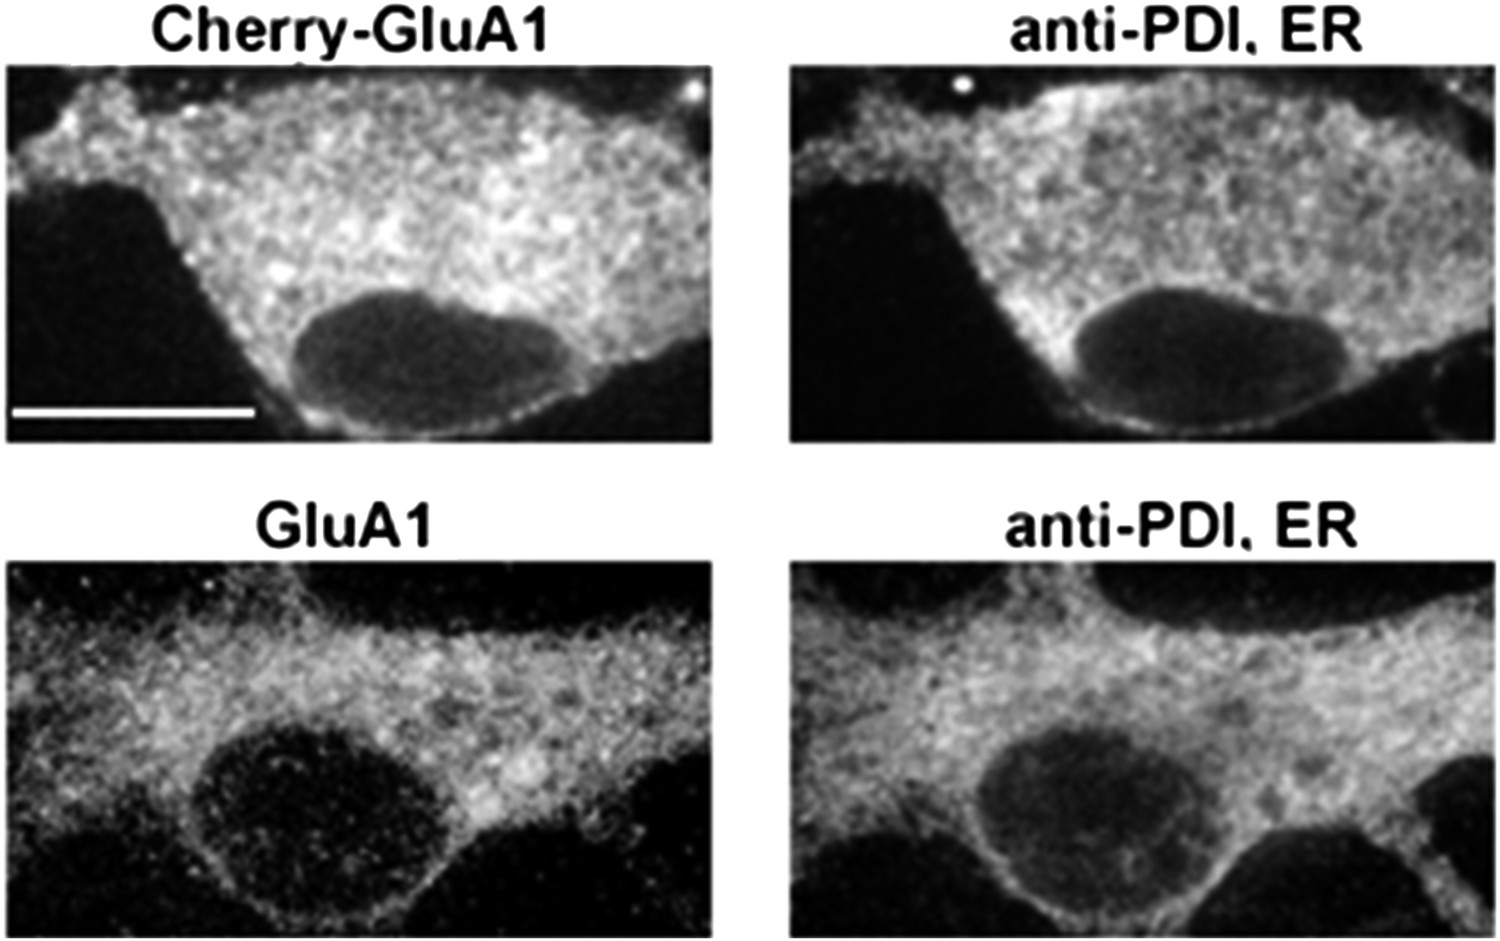
A comparison of somatic ER and the distribution of exogenous mCherry-GluA1 subunits and endogenous GluA1 subunits.
Cultured neurons expressing mCherry-tagged GluA1 (top panel) were stained with an antibody against the endoplasmic reticulum (ER) marker protein, protein disulfide isomerase, and compared against endogenous GluA1 in untransfected cells (bottom panel). Both exogenous and endogenous GluA1 exhibited similar distributions in somatic ER. (Scale bar = 10 um).
Figure 1—figure supplement 6
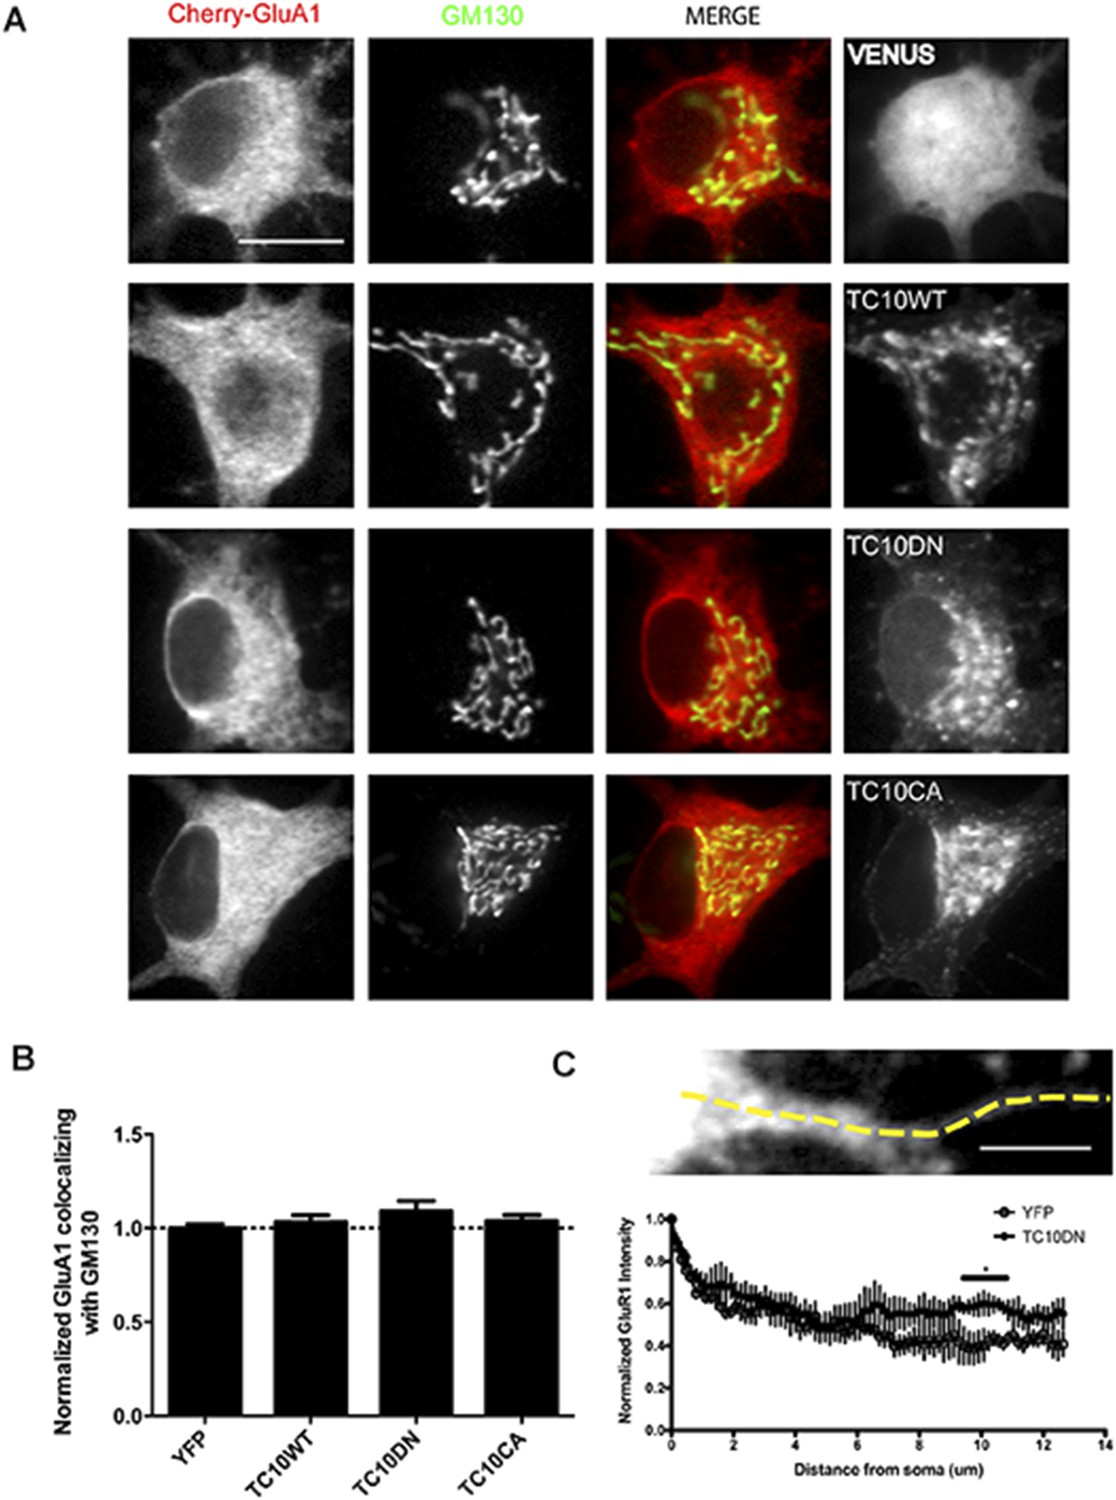
The effects of TC10 mutants on AMPARs in the somatic Golgi and in dendritic shafts.
(A) Cultured hippocampal neurons expressing mCherry-GluA1 with Venus, TC10WT, TC10DN, or TC10CA were fixed and stained for the Golgi marker, GM130 on DIV18. (Scale bar = 10 um). (B) Quantification of the intensity of mCherry-GluA1 co-localizing with GM130 in the somata. Expression of TC10 WT or mutants did not change its distribution: Control cells (normalized) 100% ± 2%, n=11; TC10WT cells 103% ± 3%, n=6; TC10DN cells 109% ± 10%, n=19; TC10CA cells 104% ± 3%, n=15. (C) Line profile of mCherry-GluA1 intensity along the dendrite when co-expressed with Venus or TC10DN. TC10DN expression results in mCherry-GluA1 accumulation in the dendritic shafts and not in the somata. (Scale bar = 5 um, n=4).
Figure 2 with 1 supplement
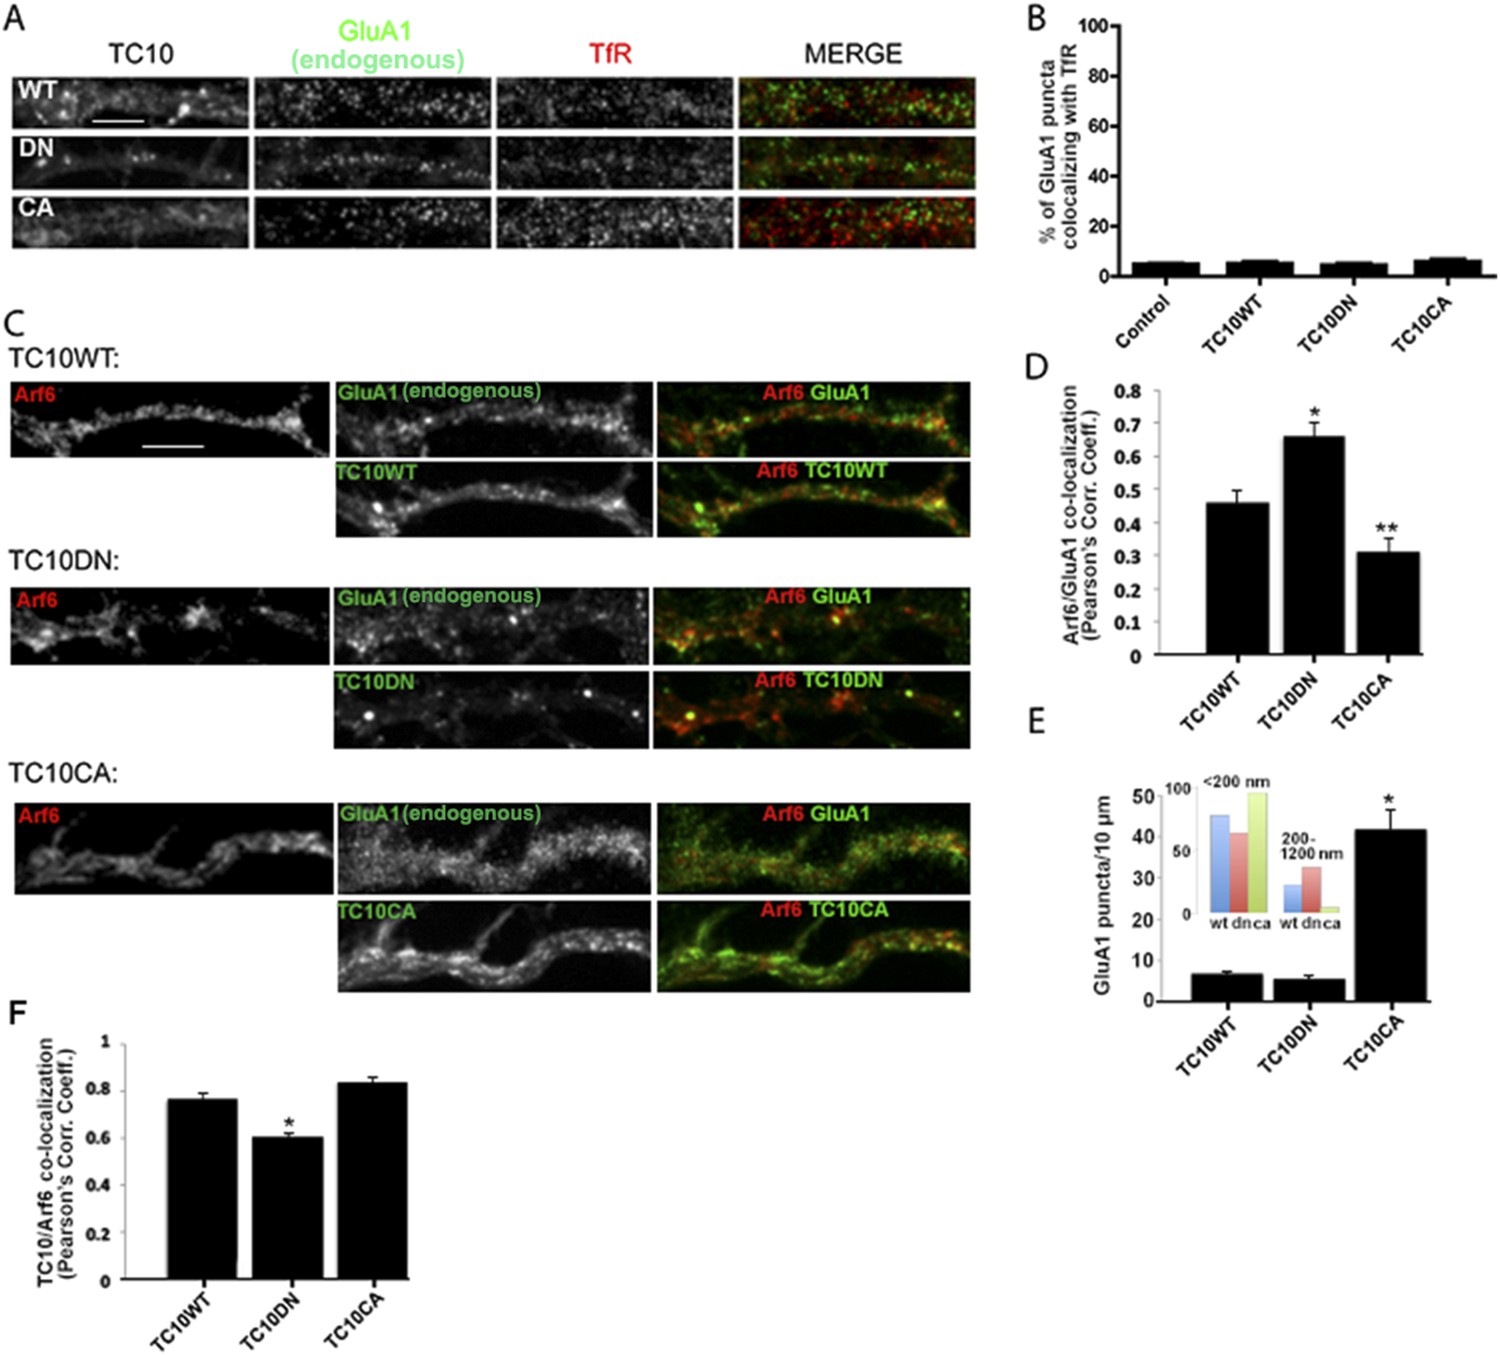
TC10 regulates AMPAR trafficking through an Arf6-containing endocytosis pathway in dendrites.
(A) Effects of TC10 constructs on the co-localization between endogenous GluA1 subunits and transferrin receptors (TfRs). Cultured neurons were transfected with Venus-tagged TC10WT or TC10DN/CA mutants and permeabilized cells stained for total GluA1 and TfR (Tf-Alexa 647). GluA1 showed little co-localization with Tf-labeled endosomes in dendrites. (Scale bar = 5 μm). (B) Quantification of GluA1 and TfR co-localization. Images in A were analyzed to measure the percent of GluA1 puncta co-localizing with TfR puncta. Expression of TC10 constructs did not alter the degree of co-localization. Data are shown as mean ± SEM; control cells 4.6% ± 0.3%; TC10WT cells 4.9% ± 0.8%; TC10DN cells 4.2% ± 0.8%; TC10CA cells 5.6% ± 1%, n = 5 for all groups. (C) Effects of TC10 constructs on the co-localization between GluA1 subunits and Arf6. Neurons were transfected with Arf6-HA and Venus-TC10WT or TC10DN/CA mutants. Cells were permeabilized and stained for Arf6-HA (Rb anti-HA) and total GluA1 (anti-GluA1 mAb). (Scale bar = 5 μm). (D) Quantification of the overlap between GluA1 and Arf6. Images in C were analyzed to measure the Pearson's correlation coefficients (Rr) of GluA1 co-localization with Arf6. Data are shown as mean ± SEM; TC10WT 0.46 ± 0.04; TC10DN 0.66 ± 0.04; TC10CA 0.31 ± 0.04 (n = 7-10 cells per group; *p < 0.02 relative to TC10WT; **p < 0.05 relative to TC10WT). (E) Effects of TC10 constructs on GluA1 puncta density (number of puncta per 10 μm) in dendrites of neurons expressing Venus-TC10WT or TC10DN/CA mutants. Data are shown as mean ± SEM; TC10WT 6.9 ± 0.4; TC10DN 5.6 ± 0.7; TC10CA 41.7 ± 4.8 (n = 5 fields per group; *p < 0.0002 relative to TC10WT). Inset, histogram showing the distribution of small (diameter <200 nm) and large (diameter 200–1200 nm) GluA1 puncta (n = ∼100 puncta per group). (F) Quantification of the overlap (Pearson's correlation coefficients, Rr) between TC10 and Arf6 in (C). Data are shown as mean ± SEM; TC10WT 0.77 ± 0.03; TC10DN 0.60 ± 0.02; TC10CA 0.84 ± 0.02 (n = 7–10 cells per group; *p < 0.0004 relative to TC10WT).
Figure 2—figure supplement 1

Co-distribution of TfR staining and mCherry-Rab11.
Hippocampal cultures were stained for TfR and Rab11 on DIV18. The two markers showed extensive overlap. (Scale bar = 5 um).
Figure 3
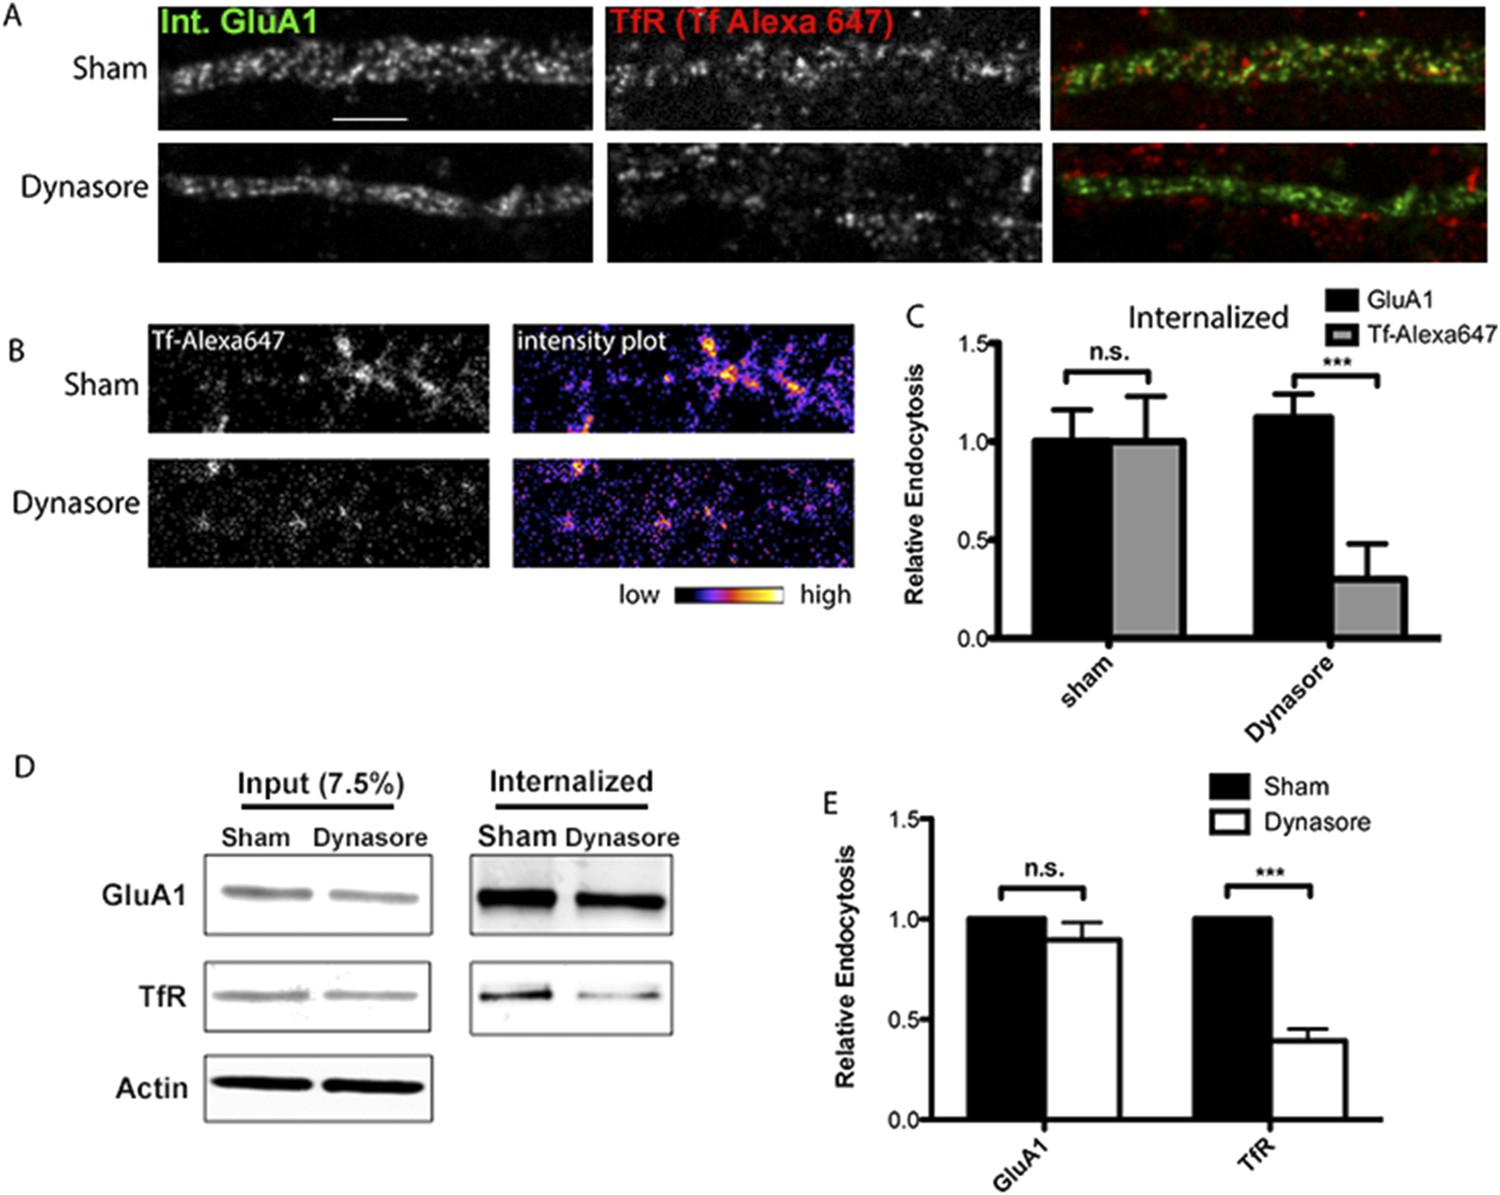
AMPARs undergo dynamin-independent endocytosis.
(A) mCherry-GluA1 and TfR internalization and block of dynamin function. Hippocampal neurons were transfected with mCherry-GluA1, and 1 day post-transfection, treated with 1% DMSO (control group) or 80 μM dynasore (to block dynamin function) for 30 min at 37°C. Neurons were then incubated with anti-RFP antibodies and Tf-Alexa 647 at 37°C for 40 min, acid washed to remove surface antibodies/dye, fixed, permeabilized, and imaged. With sham treatment (control), surface-labeled GluA1 and TfR were both internalized in the dendritic shaft (first row). Dynasore treatment had no effect on GluA1 internalization, but blocked TfR endocytosis (Tf-Alexa 647 labeling confined to surface and not present intracellularly, second row). (B) Intensity plots of internalized TfR (Tf-Alexa 647) with and without (sham) dynasore treatment as in (A). Dynasore greatly inhibited TfR internalization. (C) Quantification of GluA1 and Tf-Alexa647 internalization and block of dynamin function. Data are shown as mean ± SEM; GluA1 endocytosis, sham 100% ± 16%; dynasore 112% ± 12%. For Tf-Alexa647 endocytosis, sham 100% ± 23%; dynasore 30% ± 18%, (n = 5 for all groups; ***p < 0.001). (D) Endogenous GluA1 and TfR internalization and block of dynamin function. As an alternative approach to measure GluA1 and TfR Internalization, cortical neurons were sham treated (with DMSO) or with dynasore as in (A). After, surface proteins were labeled with Sulfo-NHS-SS-biotin and cultured for 40 min at 37°C to allow for endocytosis. Biotin on proteins remaining on the cell surface was removed by glutathione treatment and cells solubilized. Internalized proteins were pulled down with streptavidin beads and analyzed by Western blotting. Displayed are GluA1, TrR, and actin bands (loading control) from whole cell lysates to estimate inputs for sham- or dynasore-treated neurons (left) and GluA1 and TfR bands from the streptavidin pull-downs to estimate internalized receptors for sham- or dynasore-treated neurons (right). (E) Quantification of GluA1 and TfR internalization and block of dynamin function. The levels of GluA1 endocytosis were reduced to 90% ± 9% vs sham treated by dynasore treatment. The levels of TfR endocytosis were reduced to 61% ± 6% (n = 3 experiments; ***p < 0.01) vs sham treated by dynasore treatment. Total protein levels (inputs) for GluA1 and TfR were not affected by dynasore treatment.
Figure 4 with 1 supplement

Synaptic activity alters the endocytosis pathway taken by AMPARs.
(A) Effects of TC10 constructs on chemically inducing LTP (cLTP) and chemically inducing LTD (cLTD). Hippocampal neurons were transfected with mCherry-GluA1 plus Venus, TC10DN, or TC10CA. 1 day post-transfection, cells were stimulated with a mixture of the NMDA receptor agonist, glycine, and GABAA receptors antagonists to induce long-term potentiation (LTP) chemically in hippocampal cultures. Then, surface exposed mCherry-GluA1 was stained live with anti-RFP antibody. In control cells, cLTP treatment caused a 39% increase in surface GluA1 (100% ± 9%, n = 10–139% ± 10%, n = 14). In cells expressing TC10DN and TC10CA, cLTP treatment also caused a 78% (37% ± 7%, n = 13–66% ± 9%, n = 12) and 54% (41% ± 4%, n = 21–63% ± 6%, n = 15) increase in surface GluA1, respectively. In parallel, transfected cells were treated with NMDA to chemically induce long-term depression (LTD) as well. Control cells showed a 62% decrease of surface GluA1 (100% ± 10%, n = 10–38% ± 3%, n = 11), while TC10DN and TC10CA expressing cells showed a 31% (67% ± 7%, n = 13–46% ± 3%, n = 10) and 55% (60% ± 5%, n = 5–27% ± 4.2%, n = 6) reduction, respectively. (B) Effects of TC10 constructs on cLTP and cLTD. Data in (A) replotted and normalized to respective sham values in order to compare the changes with cLTP and cLTD. (C) Effects of TC10 constructs on synaptically induced LTD. Left: AMPAR-EPSC amplitudes, expressed as a percentage of baseline AMPAR-EPSC amplitude (10 min), before and after the induction of LTD by electrical LFS for 5 min (gap). Right: Bar graph of the average AMPAR-EPSC amplitude depression measured 20 min after LFS. Control cells showed a 52.4% ± 0.5% reduction in AMPAR-EPSC amplitude after LTD induction; TC10DN and TC10CA showed a 27.5% ± 1.0% and 48.3% ± 1.0% reduction in AMPAR-EPSC amplitude, respectively. (D) mCherry-GluA1 internalization after cLTP. Neurons were sham or cLTP treated and imaged for internalized mCherry-GluA1 and either TfR or HA-Arf6. GluA1 internalization increased by 24% ± 5% when treated with cLTP (n = 6; **p < 0.01). (E) mCherry-GluA1 co-localization with TfR (left) and Arf6 (middle) after cLTP. Co-localization of internalized GluA1 with TfR increased with cLTP: sham-treated 21% ± 2%, n = 15; cLTP 56% ± 2%, n = 23 (***p < 0.0001). Co-localization of internalized GluA1 with Arf6 did not significantly change: sham treated 52% ± 2%, n = 12; cLTP 47% ± 3%, n = 5. Left panel displays the distribution of GluA1 co-localization with TfR, Arf6, or neither marker for sham treated and cLTP conditions.
Figure 4—figure supplement 1
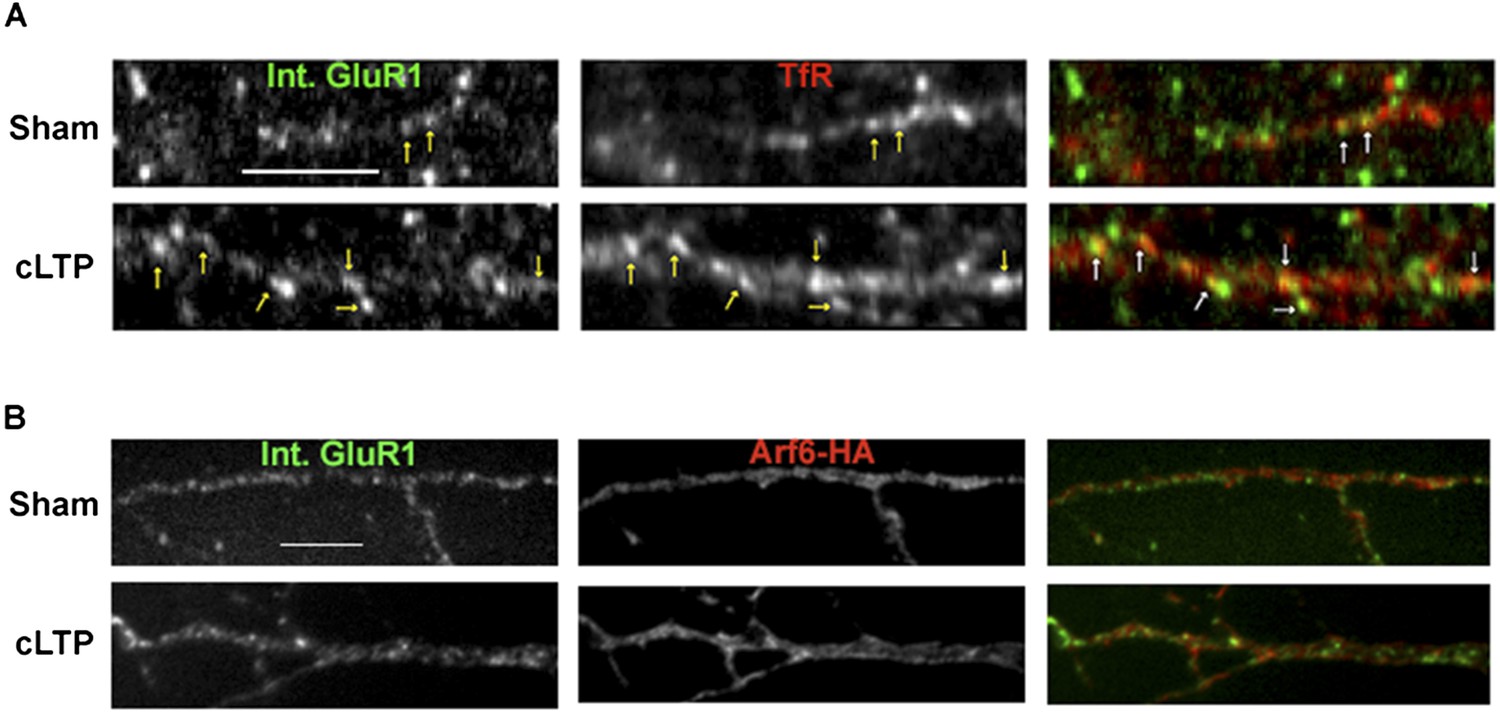
Synaptic activity alters the endocytosis pathway taken by AMPARs.
Representative images for the quantification displayed in Figure 4D, E. Neurons were sham or cLTP treated and imaged for internalized mCherry-GluA1 and either TfR (A) or Arf6-HA (B). cLTP treatment caused an increase in the co-localization between internalized GluA1 and TfR, while co-localization with Arf6 didn't change (arrows indicate co-localizing puncta). (Scale bar = 5 um).
Figure 5
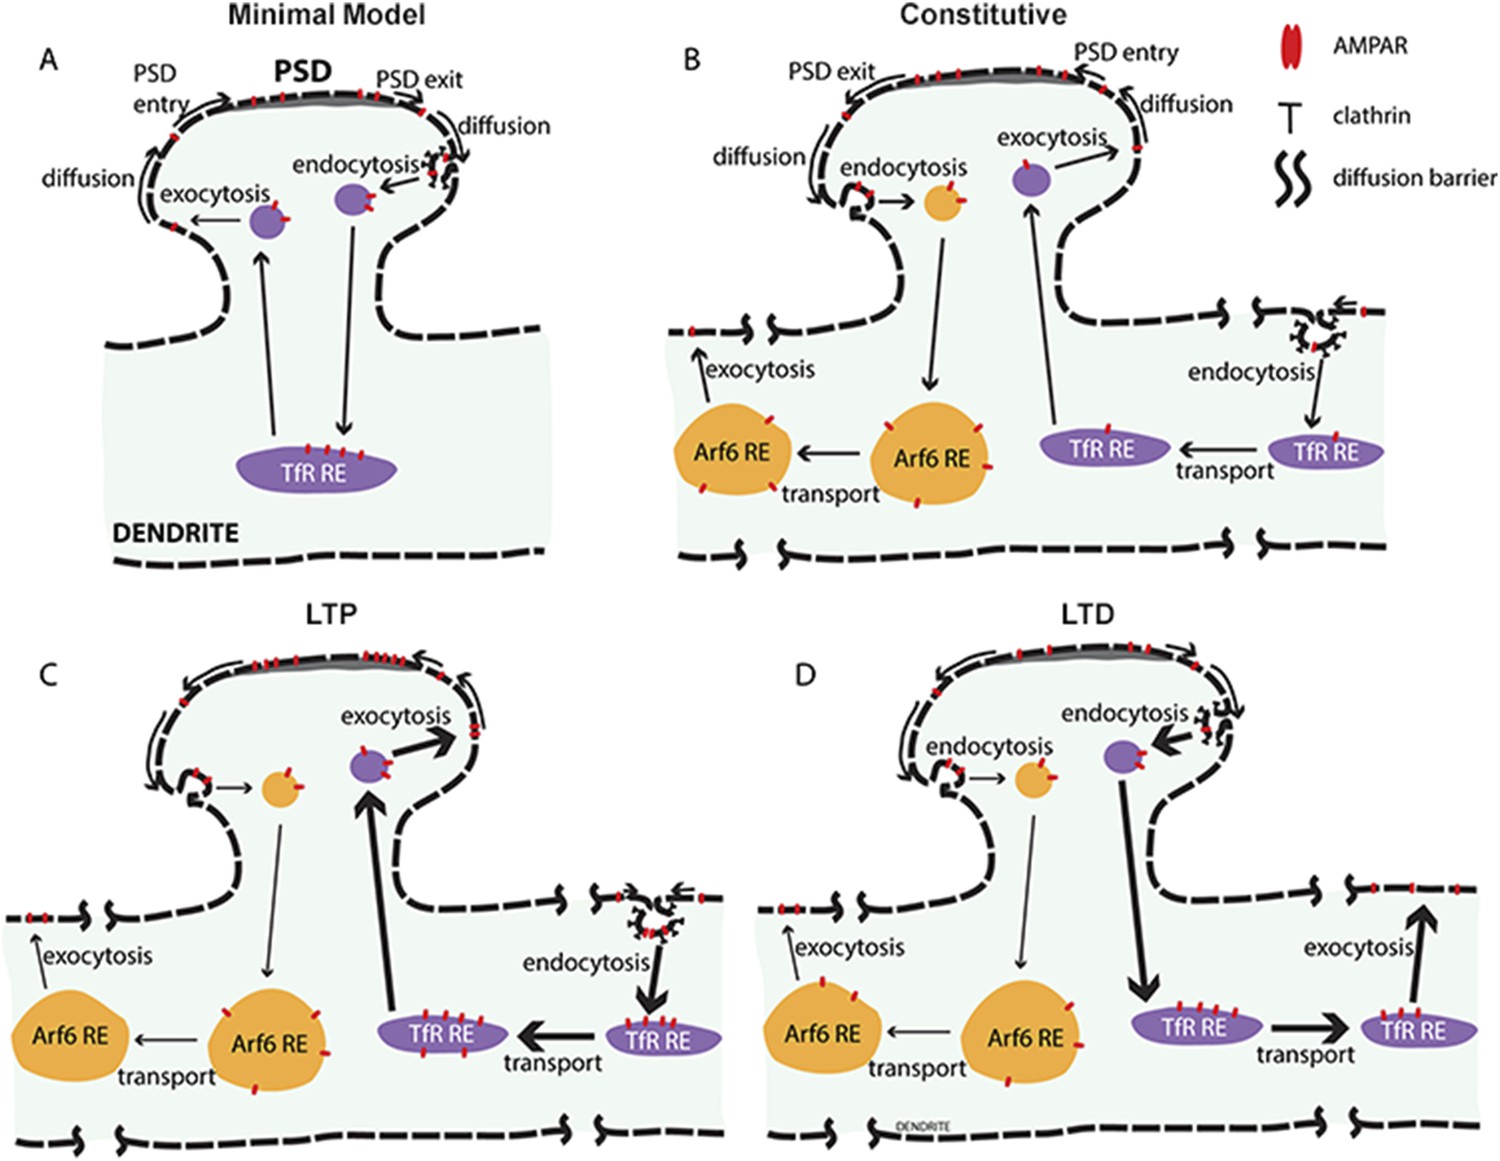
New model for AMPAR constitutive and activity-dependent recycling.
(A) Conventional ‘single-synapse’ AMPAR recycling model. AMPARs exit post-synaptic densities (PSDs) by lateral diffusion and are endocytosed into clathrin-coated pits at sites near PSDs. After, endocytosed AMPARs are sorted into recycling endosomes (REs), the same pathway used by TfR for recycling back to the cell surface, where AMPARs diffuse to and could be trapped in PSDs. An underlying assumption of the model is that AMPAR recycling is restricted to single spines and the endosomal membranes in the spine and dendrite neighboring the spine. Activity during LTP increases AMPAR exocytosis and transport from REs without altering its endocytosis thereby decreasing AMPAR levels in REs. (B) AMPAR recycling model with two AMPAR-recycling pathways under constitutive conditions. Based on evidence in this study, at least two different AMPAR-recycling pathways exist for AMPAR recycling. AMPARs largely recycle through the Arf6- and TC10-dependent recycling pathway, which originates at sites near the PSD and endocytose at clathrin- and dynamin-independent sites. This recycling pathway acts to move AMPARs from sites near the PSD to sites distant from the synapse such that AMPARs cannot return via membrane diffusion. Smaller numbers of AMPARs endocytose at sites distant from the spine via clathrin-coated pits using dynamin. Endocytosed AMPARs traffic into REs in the same pathway as TfRs. This recycling pathway acts to move AMPARs from distant sites to sites accessible to PSDs so that AMPARs can diffuse into PSDs to balance the loss via the Arf6-dependent recycling pathway. (C) AMPAR recycling after cLTP. Activity-dependent events during cLTP increase AMPAR recycling through the dynamin-dependent pathway, trafficking AMPARs from clathrin-coated pits distant from the stimulated synapse to sites accessible to the stimulated PSD. Endocytosed AMPARs are transported in the REs with the net effect of trafficking more AMPARs into the stimulated PSD. AMPAR recycling through the Arf6- and TC10-dependent recycling pathway continues unchanged after cLTP. (D) AMPAR recycling after cLTD. Similar to what is observed after cLTP, activity-dependent events during cLTP increase AMPAR recycling through the dynamin-dependent pathway except with the net effect of trafficking AMPARs out of PSDs and away from the stimulated spines. AMPAR endocytosis occurs at clathrin-coated pits near stimulated PSD and AMPARs transported in REs away from the cLTD spines and recycling to the cell surface at distant sites. The Arf6- and TC10-dependent recycling pathway, shown in (B), is also unchanged during cLTD, and overall traffic AMPARs out of synaptic spines.
Author response image 1
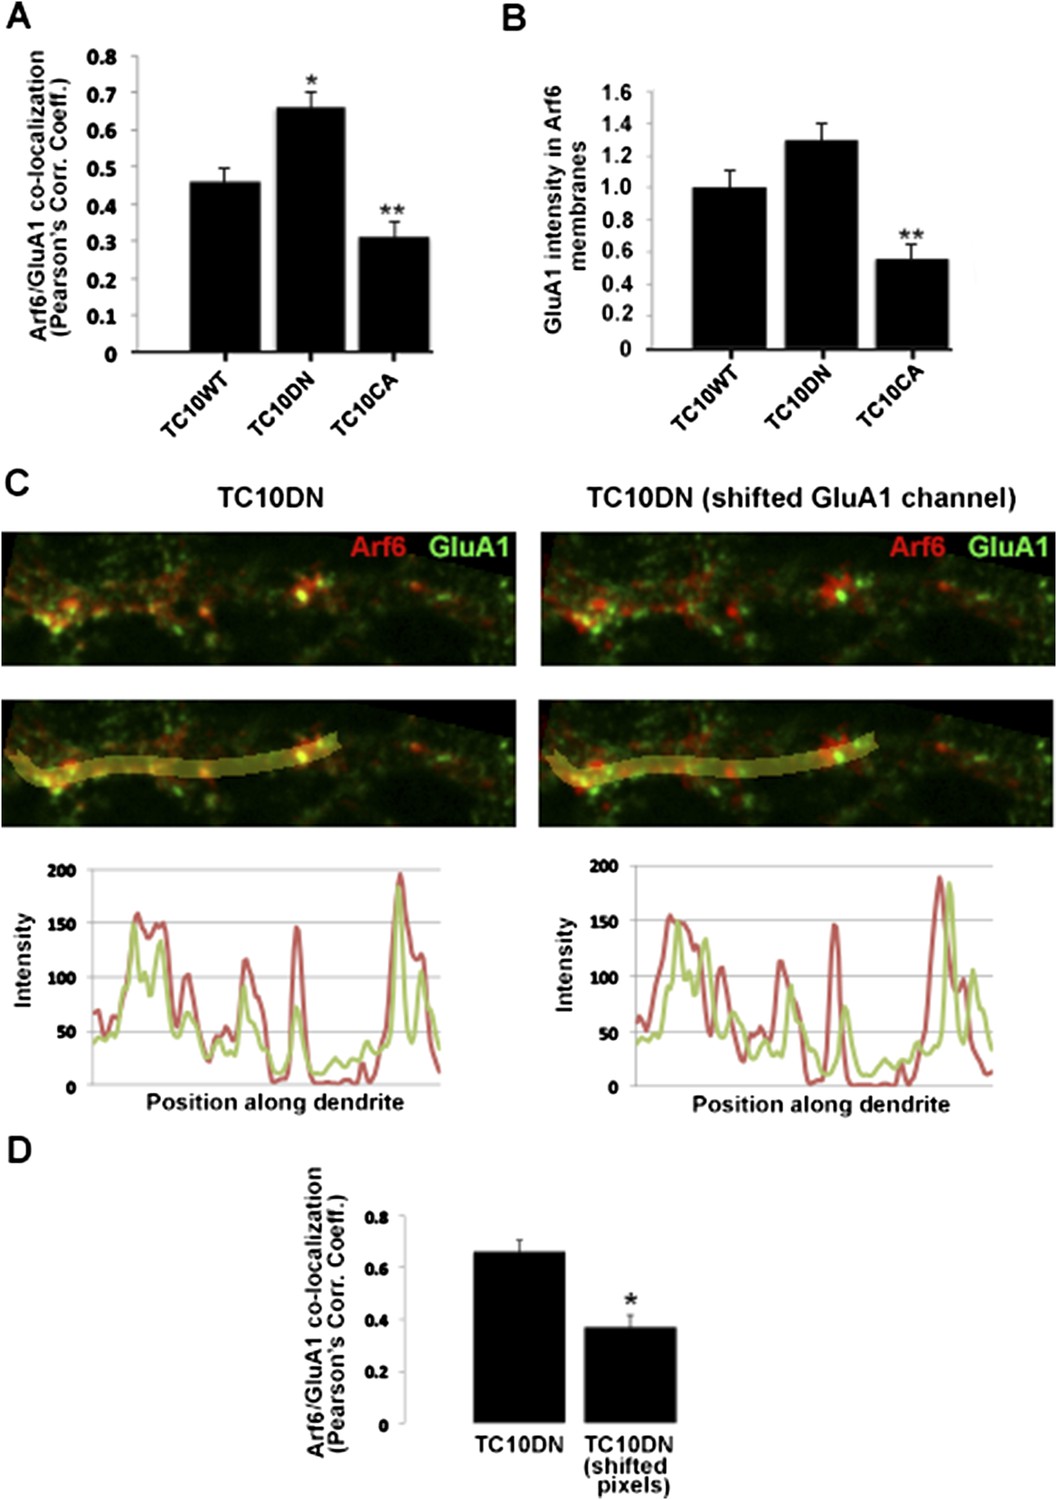
Improved co-localization analysis. A. Quantification of the overlap between GluA1 and Arf6. Newly acquired images (examples in Figure 2C) were analyzed to measure the Pearson's correlation coefficients (Rr) of GluA1 co-localization with Arf6. Data are shown as mean ± SEM; TC10WT 0.46 ± 0.04; TC10DN 0.66 ± 0.04; TC10CA 0.31 ± 0.04 (n= 7-10 cells per group; *p<0.02 relative to TC10WT; **p<0.05 relative to TC10WT). B. A second method of analysis. GluA1 pixel intensity was measured in thresholded and masked Arf6 sub-compartments. Data are shown as mean ± SEM (normalized to TC10WT); TC10WT 1.0 ± 0.11; TC10DN 1.3 ± 0.10; TC10CA 0.56 ± 0.09 (n= 8-10 cells per group; **p<0.03 relative to TC10WT. C, Representative image of Arf6-HA and GluA1 in the dendritic shaft of a TC10DN expressing neuron (left panels), and with the GluA1 channel shifted along the central axis of the dendrite by ∼500nm (right panels). Bottom panels display line scans of pixel intensities for both channels along the yellow line in the dendrite. D, Change in Pearson's correlation coefficients following lateral shift of GluA1 channel in (C). Data are shown as mean ± SEM; TC10DN 0.66 ± 0.04; TC10DN shifted pixels 0.37 ± 0.05 (n=7 cells per group; *p<0.002).
Download links
A two-part list of links to download the article, or parts of the article, in various formats.
Downloads (link to download the article as PDF)
Open citations (links to open the citations from this article in various online reference manager services)
Cite this article (links to download the citations from this article in formats compatible with various reference manager tools)
Synaptic activity regulates AMPA receptor trafficking through different recycling pathways
eLife 4:e06878.
https://doi.org/10.7554/eLife.06878


