Identification of a lipid scrambling domain in ANO6/TMEM16F
- Emory University School of Medicine, United States
Figures
Figure 1
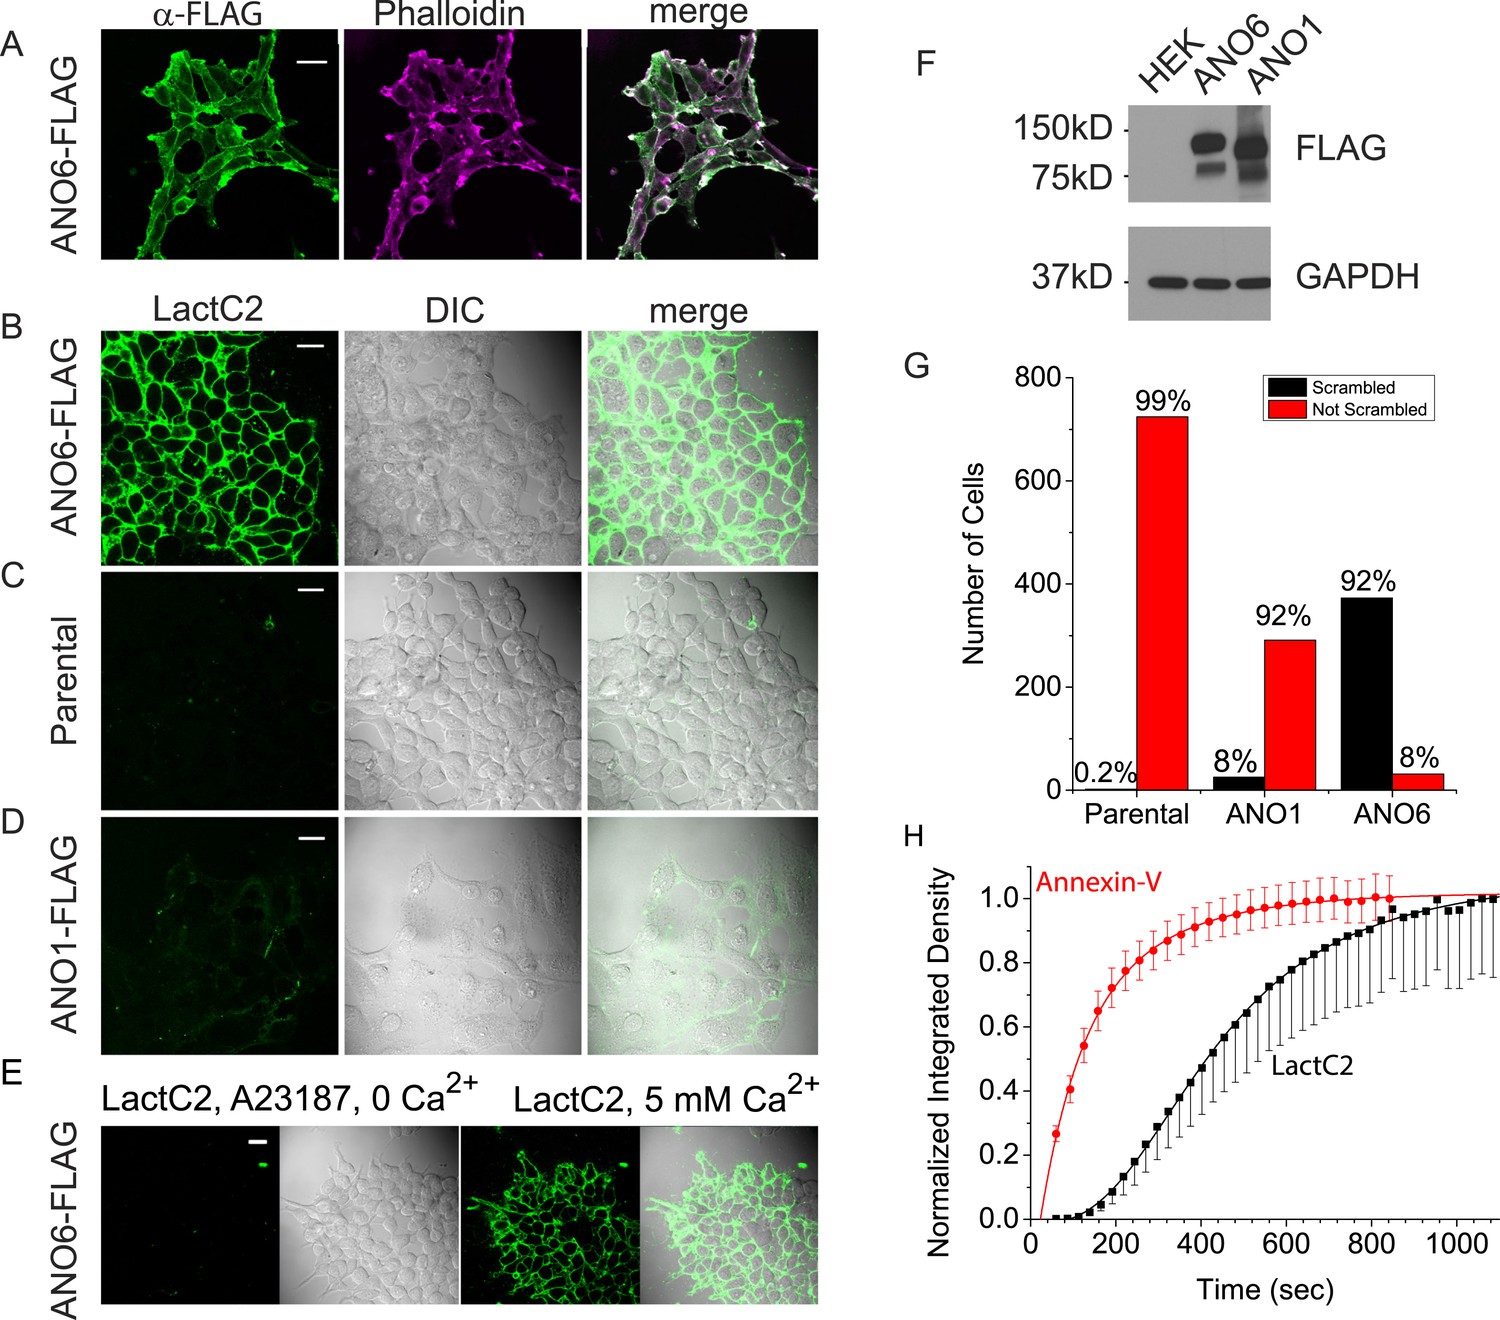
Expression of ANO6 in HEK cells stimulates Ca2+-dependent phospholipid scrambling (PLS).
(A) Images of HEK cells stably transfected with ANO6-FLAG3X fixed and stained with anti-FLAG (green) and phalloidin (magenta). (B–D) Images of live cells after exposure to 10 μM A23187 in zero-Ca2+ solution for 5 min followed by solution containing 5 mM Ca2+ and 3 µg/ml LactC2-Clover for 12 min as described in ‘Materials and methods’. Green channel: LactC2-Clover. DIC channel: differential interference contrast. (B) HEK cells stably expressing ANO6-FLAG3X. (C) Parental HEK cells not expressing ANO6. (D) HEK cells stably transfected with ANO1-FLAG3X. (E) A23187 in zero Ca2+ does not stimulate LactC2 binding. The first two panels show LactC2-Clover binding in cells incubated in A23187 in zero Ca2+ containing LactC2 for 15 min. The second two panels show the same cells 10 min after adding 5 mM Ca2+. (F) Level of expression of ANO1 and ANO6 in stably expressing HEK cells. Extracts of cells in B–D were immunoblotted with anti-FLAG and anti-GAPDH to quantify protein expression. (G) Numbers of cells binding Annexin-V (‘scrambled’) or not binding Annexin-V (‘not scrambled’) for parental HEK cells, ANO6-FLAG3X, and ANO1-FLAG3X expressing cells. (H) Time course of Annexin-V and LactC2 binding to HEK cells expressing ANO6-FLAG3X. Images of the same field of 30–100 cells were acquired at ∼20 s intervals. Annexin-V: mean ± SEM of seven independent experiments, LactC2: mean ± SEM of five independent experiments. Means at the end of the recordings were normalized to 1. Scale bars = 20 μm.
Figure 2
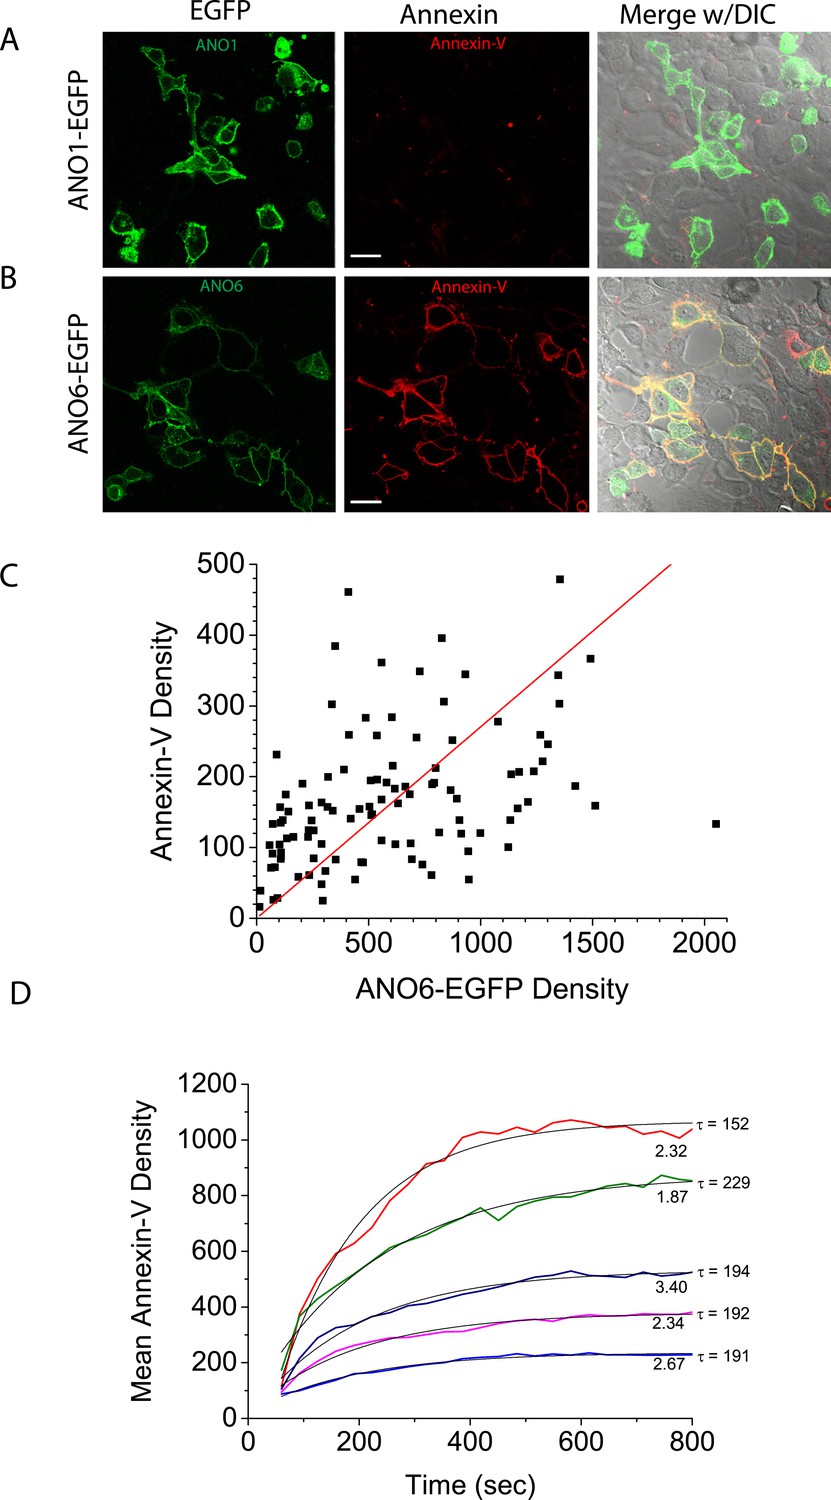
Characteristics of PLS linked to ANO6.
Intracellular Ca2+ was elevated by A23187, as in Figure 1, in polyclonal lines of HEK cells expressing (A) ANO1-EGFP or (B) ANO6-EGFP. (C) The relationship between ANO6-EGFP expression (mean EGFP pixel density of each cell) and AnnexinV-Alexa568 binding (mean pixel density in the Annexin-V channel masked by the EGFP channel). The line is the best fit to a straight line with Pearson's correlation coefficient r = 0.84. (D) Examples of the time course of Annexin-V binding to five individual cells in a typical experiment. The numbers at the end of the trace represent the relative EGFP density of the cell and τ is the time constant of a mono-exponential fit (light black line) of the data.
Figure 3
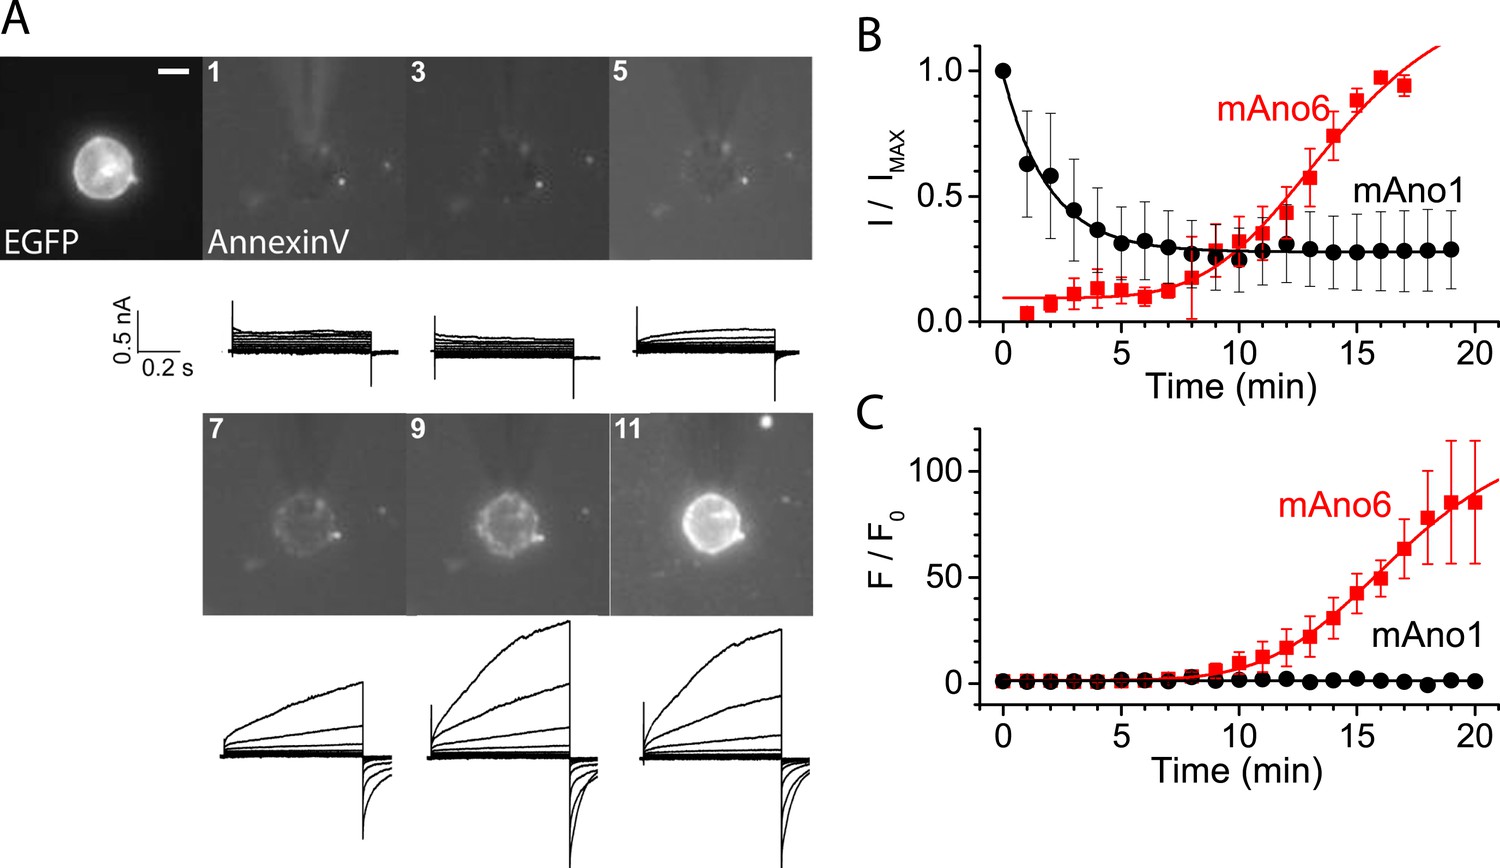
ANO6 current activates coincidently with PLS.
HEK cells transiently expressing ANO6-EGFP were patch clamped in the presence of Annexin-V-Alexa-568 in the bath. The EGFP fluorescence image was obtained before establishing whole-cell recording and Fo was determined immediately after establishing whole-cell recording. Annexin-V fluorescence images were acquired immediately after obtaining each I-V curve by voltage clamp at 1 min intervals. The patch pipet contained 200 μM free Ca2+. I-V curves were obtained by voltage steps from −100 mV to +100 mV in 20 mV increments. (A) Representative images and currents of one of 20 experiments. The first image shows ANO6-EGFP fluorescence. The patch pipet can be seen entering the field from 12 o'clock. Scale bar 10 µm. (B) Average current amplitudes normalized to maximum current for cells expressing ANO6 (red square) or ANO1 (black circles) plotted vs time after establishing whole-cell recording. (C) Average Annexin-V fluorescence normalized to maximum fluorescence for the same cells as in B (n = 6).
Figure 4
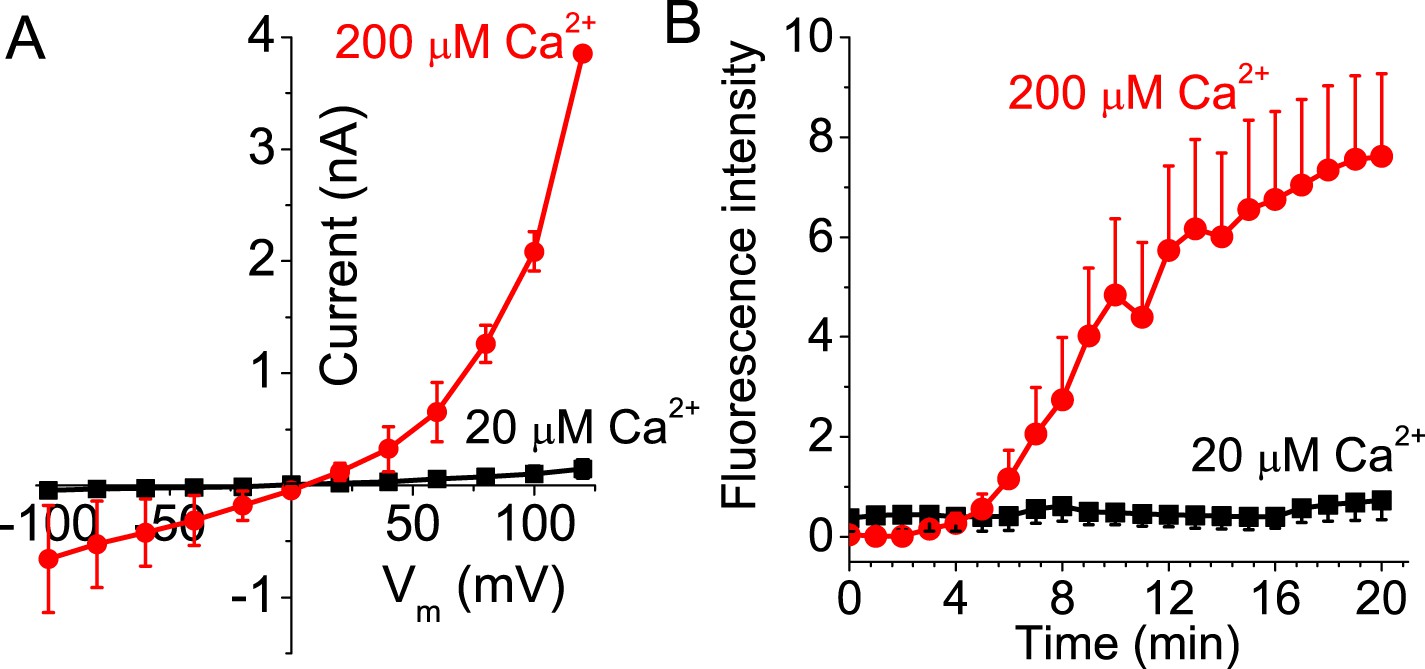
Activation of ANO6 current and PLS requires high intracellular Ca2+ concentrations.
(A) Average current–voltage relationships of currents recorded ∼20 min after establishing whole-cell recording in Ano6-expressing cells patched with 20 μM (black squares, N = 6) or 200 μM Ca2+ (red circles, N = 10) in the patch pipet. (B) Annexin-V binding in Ano6-expressing cells patched with 20 μM (black squares, N = 5) and 200 μM (red circles, N = 15) Ca2+ in the patch pipet. Error bars are S.E.M.
Figure 5
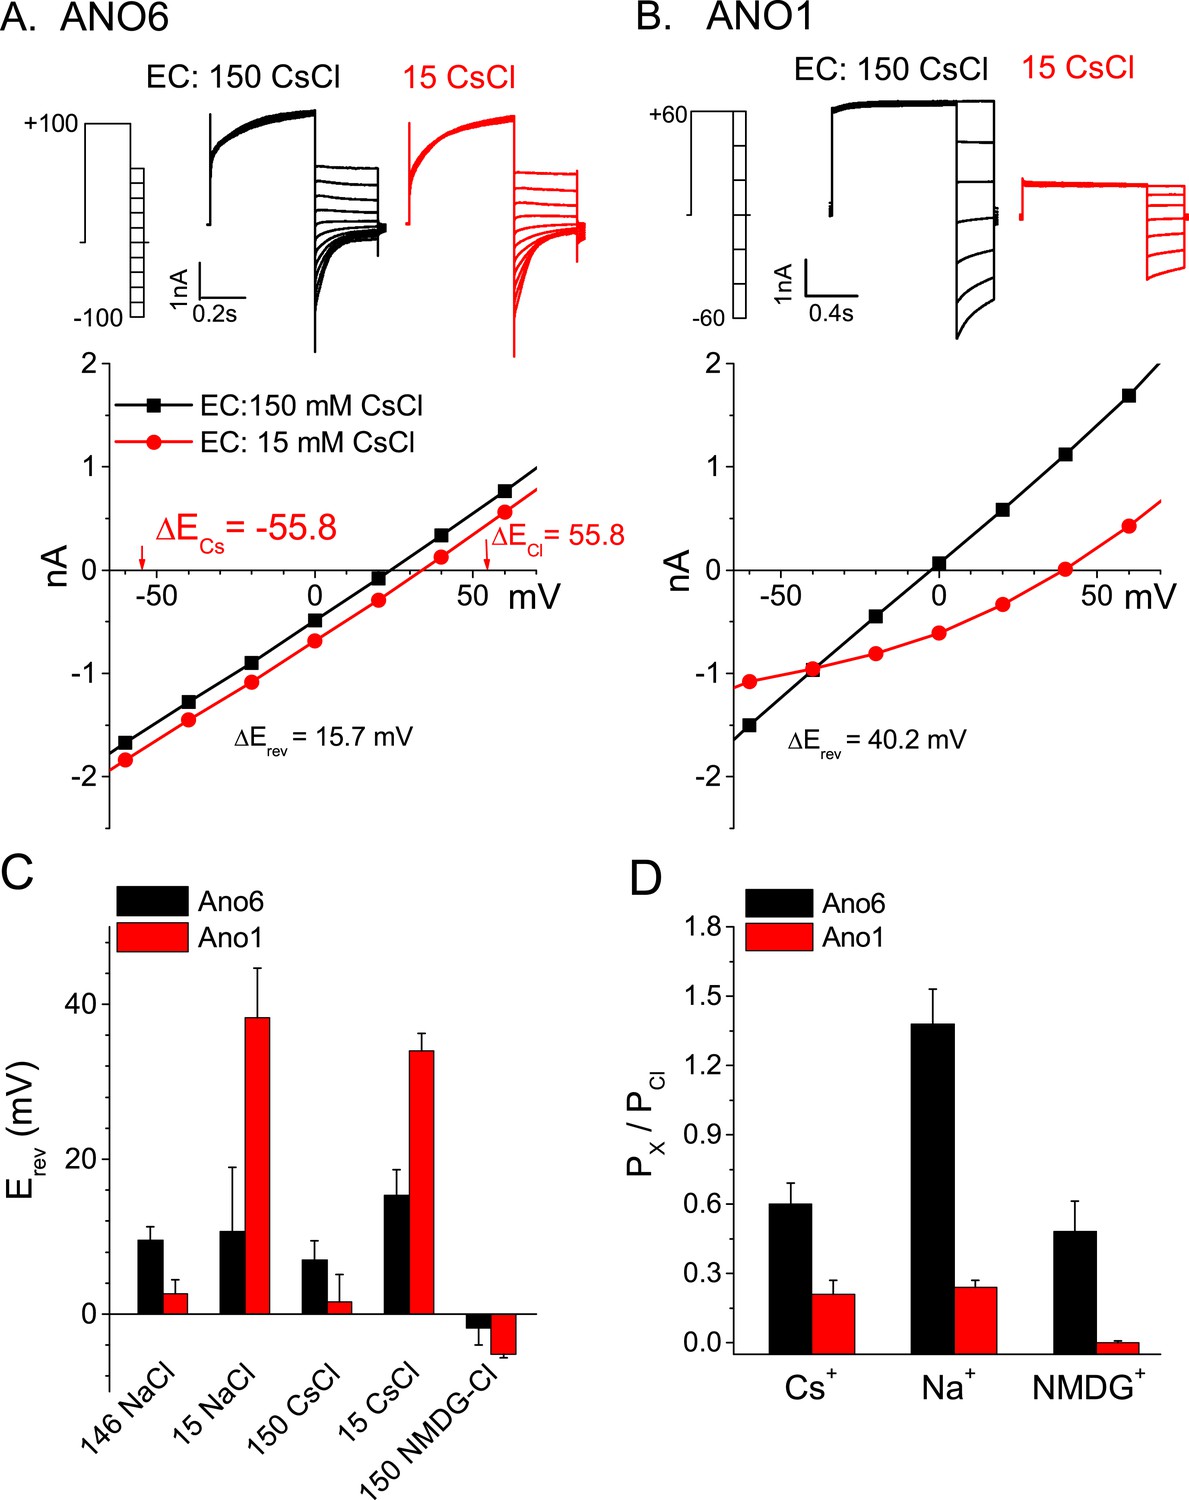
Ionic selectivity of ANO6 currents.
Representative whole-cell patch-clamp recordings and current–voltage relationships from (A) ANO6 and (B) ANO1 expressing cells with 200 μM [Ca2+]i. Currents were recorded in 150 mM or 15 mM extracellular CsCl. The reversal potentials (Erev) shift very little with ANO6-expressing cells, while the shift is large for ANO1-expressing cells. (C) Average Erev values for ANO6 or ANO1 expressing cells bathed in 146 NaCl, 150 CsCl, 15 NaCl, 15 CsCl, or 150 NMDG-Cl. (D) Relative permeabilities calculated from the Goldman-Hodgkin-Katz equation. N = 6–17.
Figure 6 with 5 supplements

Identification of a PLS domain in ANO6.
(A) Site-specific Type II divergence scores were calculated by comparing ANO1 and ANO6 sequences from 24 mammalian species, binned over a 15-amino acid window, and normalized to the maximum value. Horizontal lines at top indicate transmembrane domains. Vertical lines indicate individual amino acids with high Type II Divergence Scores. (B) Summary of 1-6-1 chimeras. Black line represents ANO1 sequence with TMDs 2–10 labeled. Colored horizontal lines represent ANO1 sequence that was replaced with the corresponding ANO6 sequence. Numbers refer to ANO1 sequence. Green: ANO1-like currents, no scrambling. Red: scrambling. Grey: weak plasma membrane expression, but no currents or scrambling. Orange: some plasma membrane expression, no currents or scrambling. (C) Scrambling domain (SCRD). The sequences of ANO1 (535–601) and ANO6 (506–572) are aligned with TMD 4 and TMD5 indicated. Amino acids are colored according to Rasmol. SCRD shows region associated with PLS. Asterisks show amino acids that are essential for PLS in ANO6. Figure 6—figure supplement 1 lists sequence accession numbers used for Diverge analysis. Figure 6—figure supplement 2 shows alignment of mANO1 and mANO6 used for chimeric construction. Figure 6—figure supplement 3 tabulates the properties of all of the 1-6-1 chimeras. Figure 6—figure supplement 4 shows a confocal image of scrambling by the 1-6-1_(554-588) chimera. Figure 6—figure supplement 5 summarizes properties of mutations in ANO6 SCRD.
Figure 6—figure supplement 1
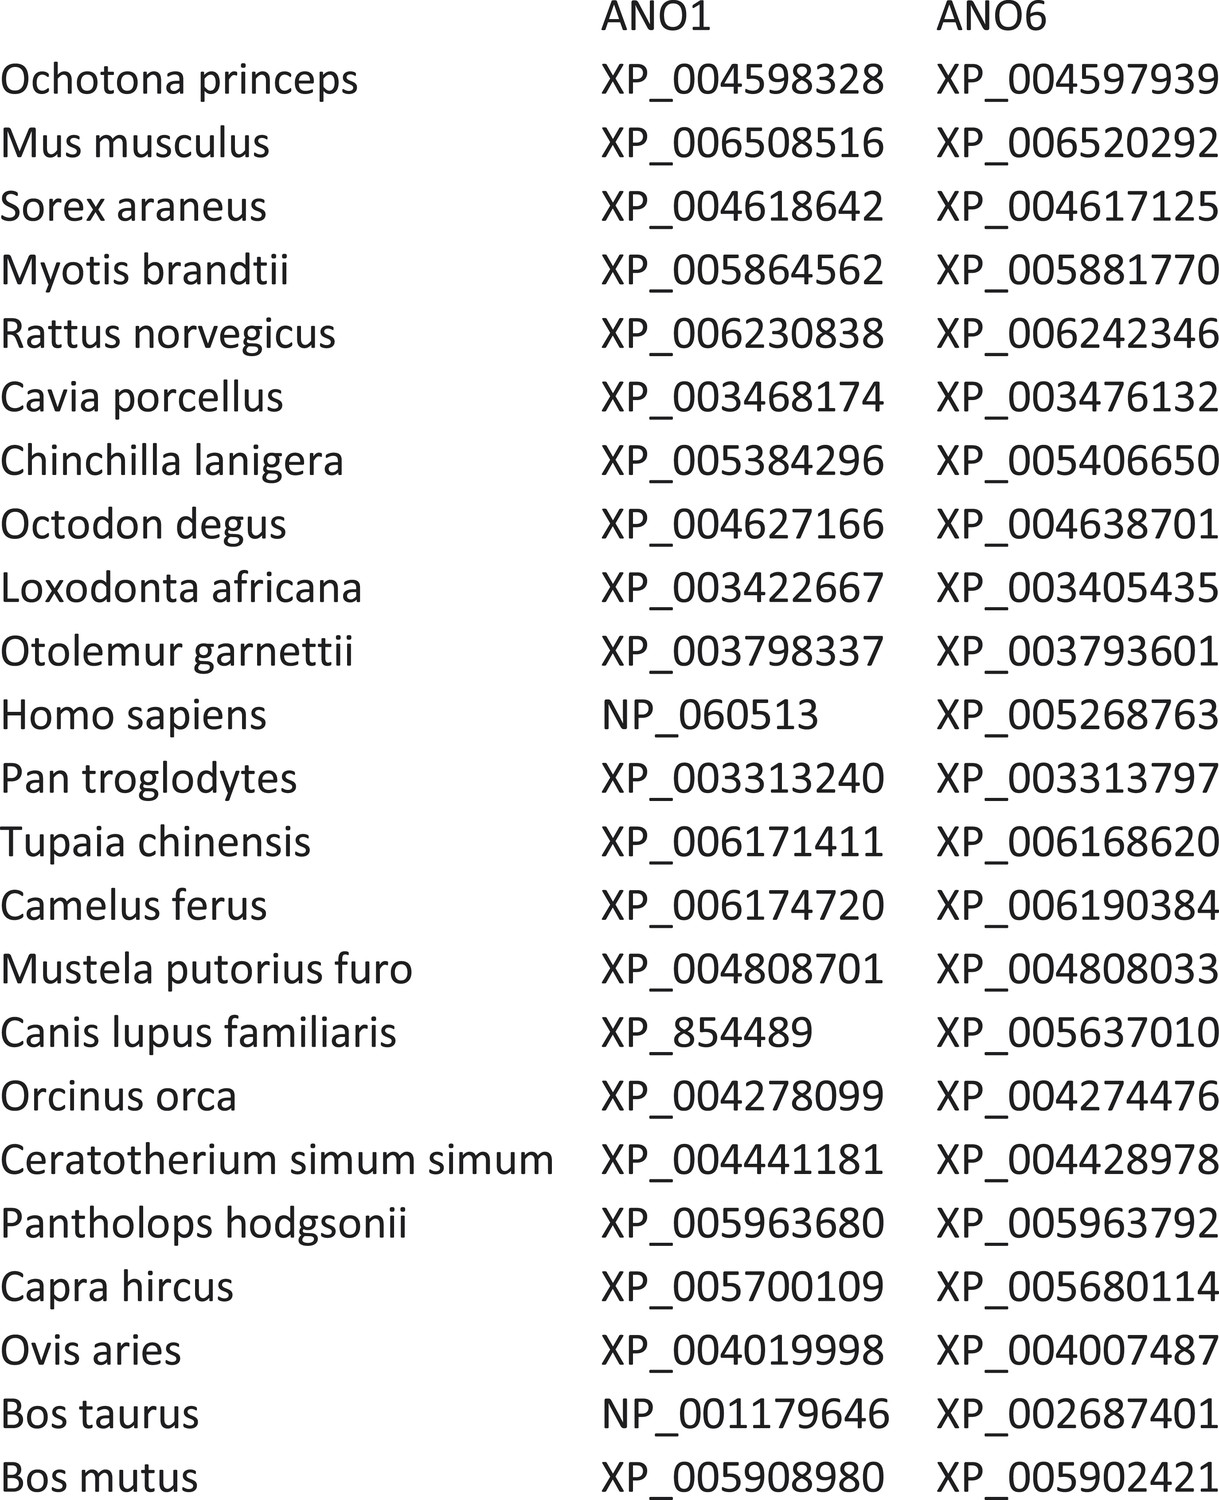
Genbank accession numbers of sequences of mammalian species ANO1 and ANO6 used for DIVERGE analysis.
https://doi.org/10.7554/eLife.06901.009
Figure 6—figure supplement 2
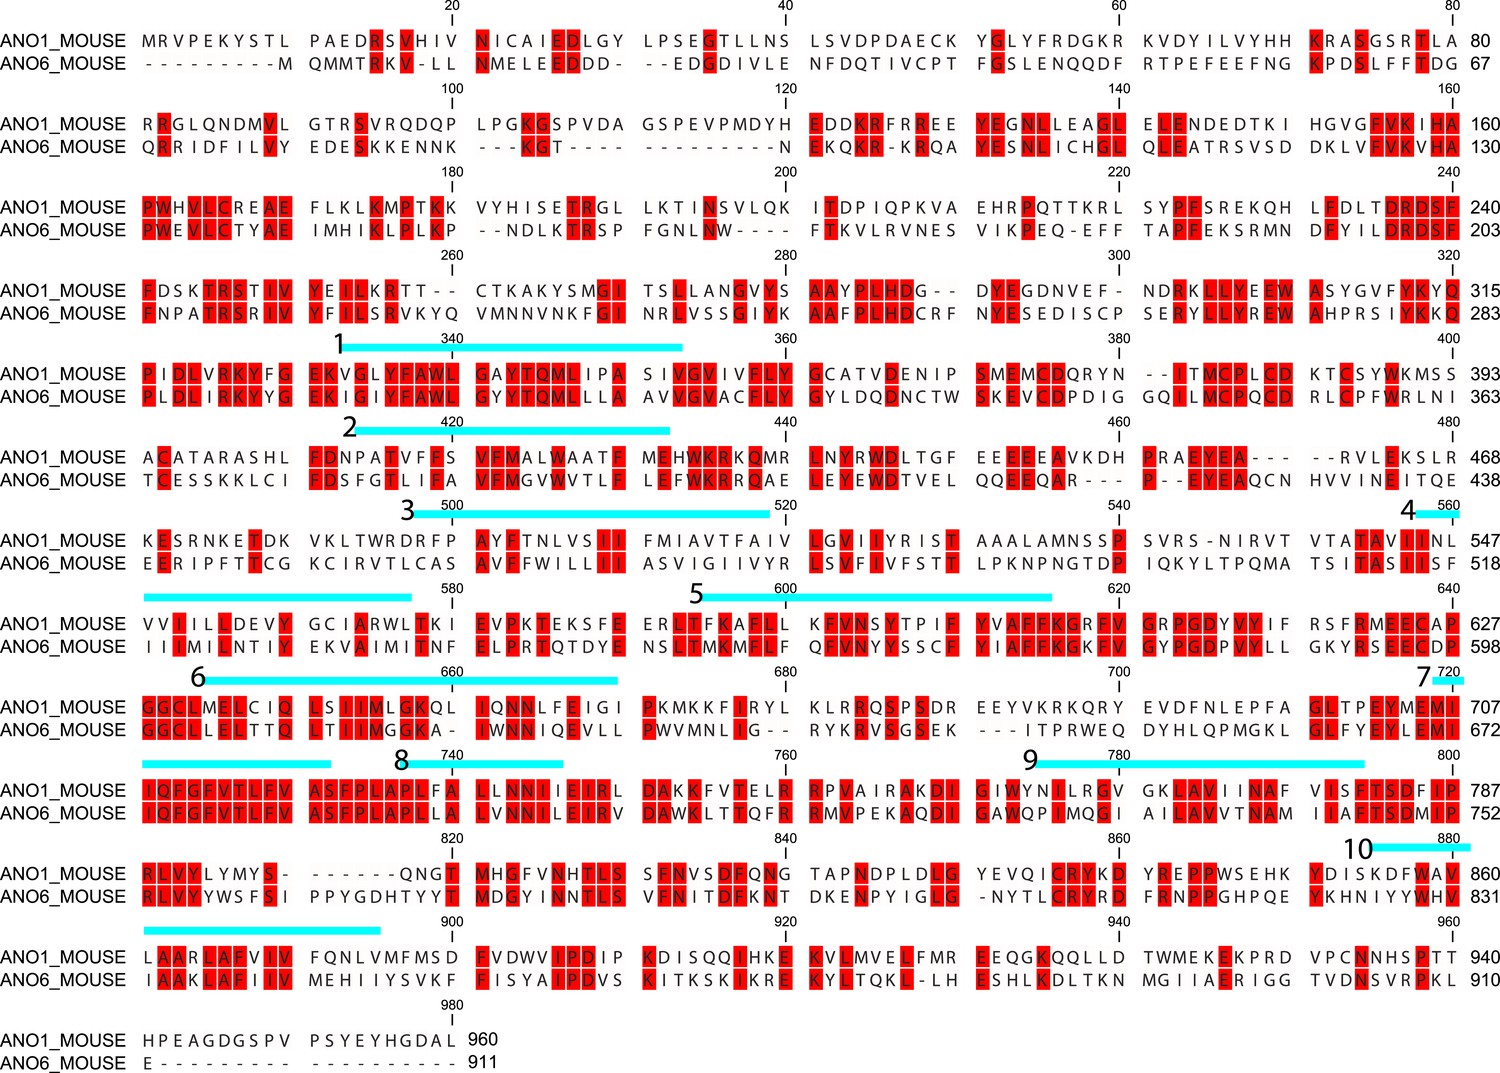
MUSCLE alignment (McWilliam et al., 2013) of mANO1(ac) and mANO6 used for constructing chimeras.
Blue lines indicate membrane helices 1–10 determined by a homology model based on nhTMEM16 (Brunner et al., 2014).
Figure 6—figure supplement 3
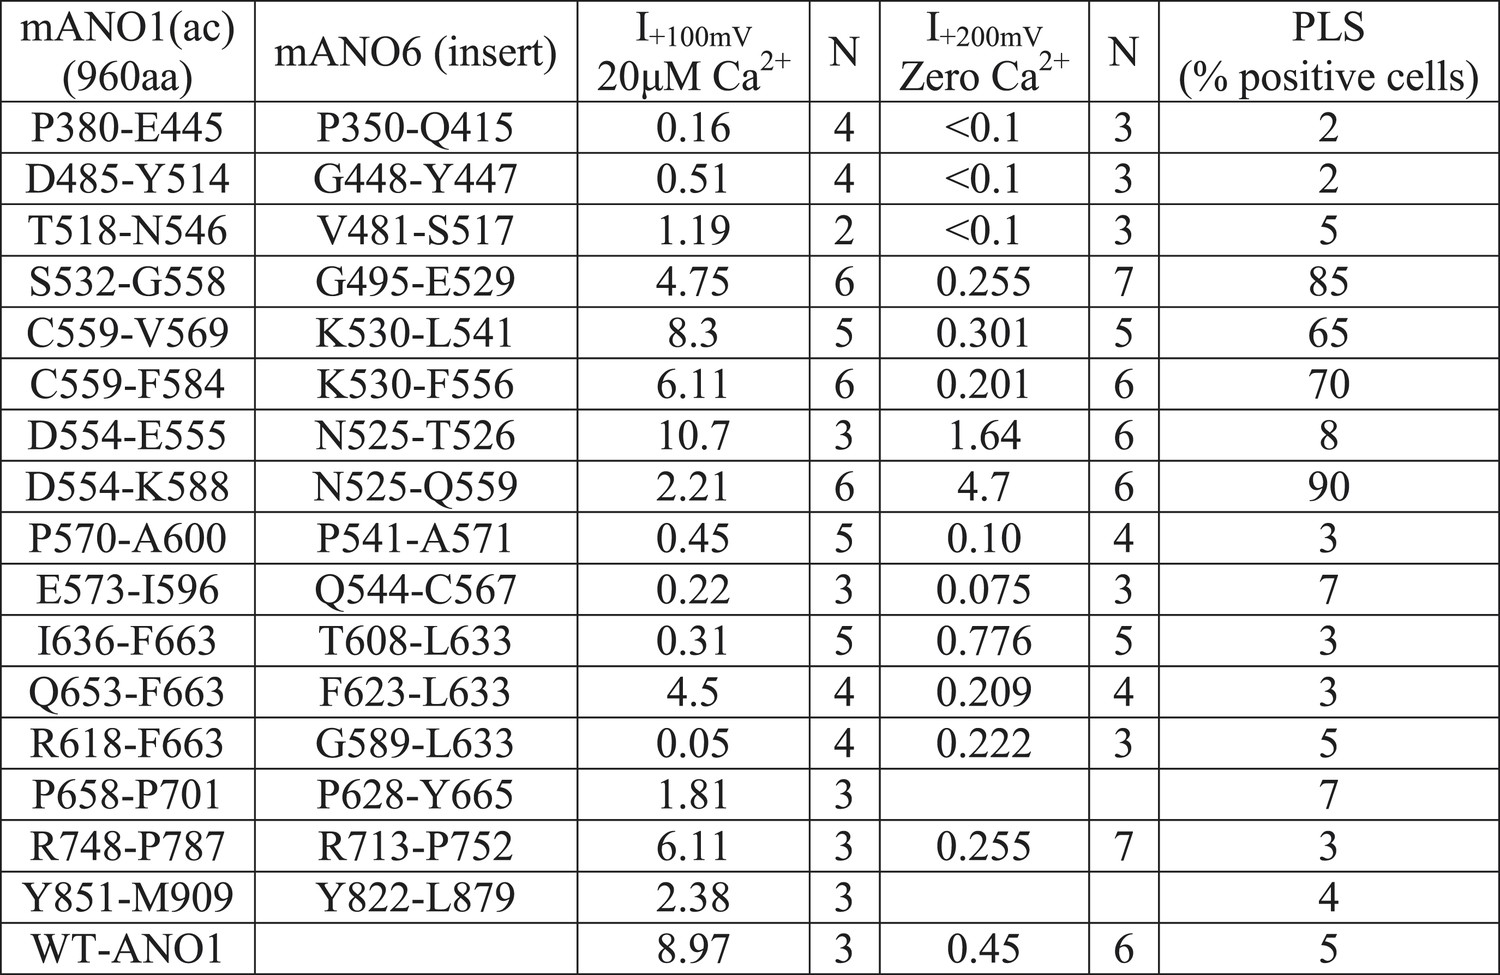
Properties of 1-6-1 chimeras that trafficked to the plasma membrane and generated ionic currents.
Cells were transiently transfected with the indicated constructs in which the indicated amino acids of mANO1(ac) were replaced with the corresponding amino acids of mANO6 (as determined by the alignment shown in Figure 5—figure supplement 2). Currents were measured with 20 µM free Ca2+ in the patch pipet at +100 mV or with zero Ca2+ in the patch pipet at +200 mV. PLS was measured by Annexin-V-Alexa568 binding to cultures of cells 10 min after addition of 10 µM A23187 and 1 µM thapsigargin. PLS was assessed in >3 independent experiments, counting >100 cells.
Figure 6—figure supplement 4

Properties of 1-6-1 chimeras in which pairs or triplets of amino acids were mutated.
None of these chimeras exhibited PLS.
Figure 6—figure supplement 5

Properties of ANO6 with mutations in the SCRD.
Various mutations in the SCRD abolish PLS and ionic currents.
Figure 7 with 1 supplement
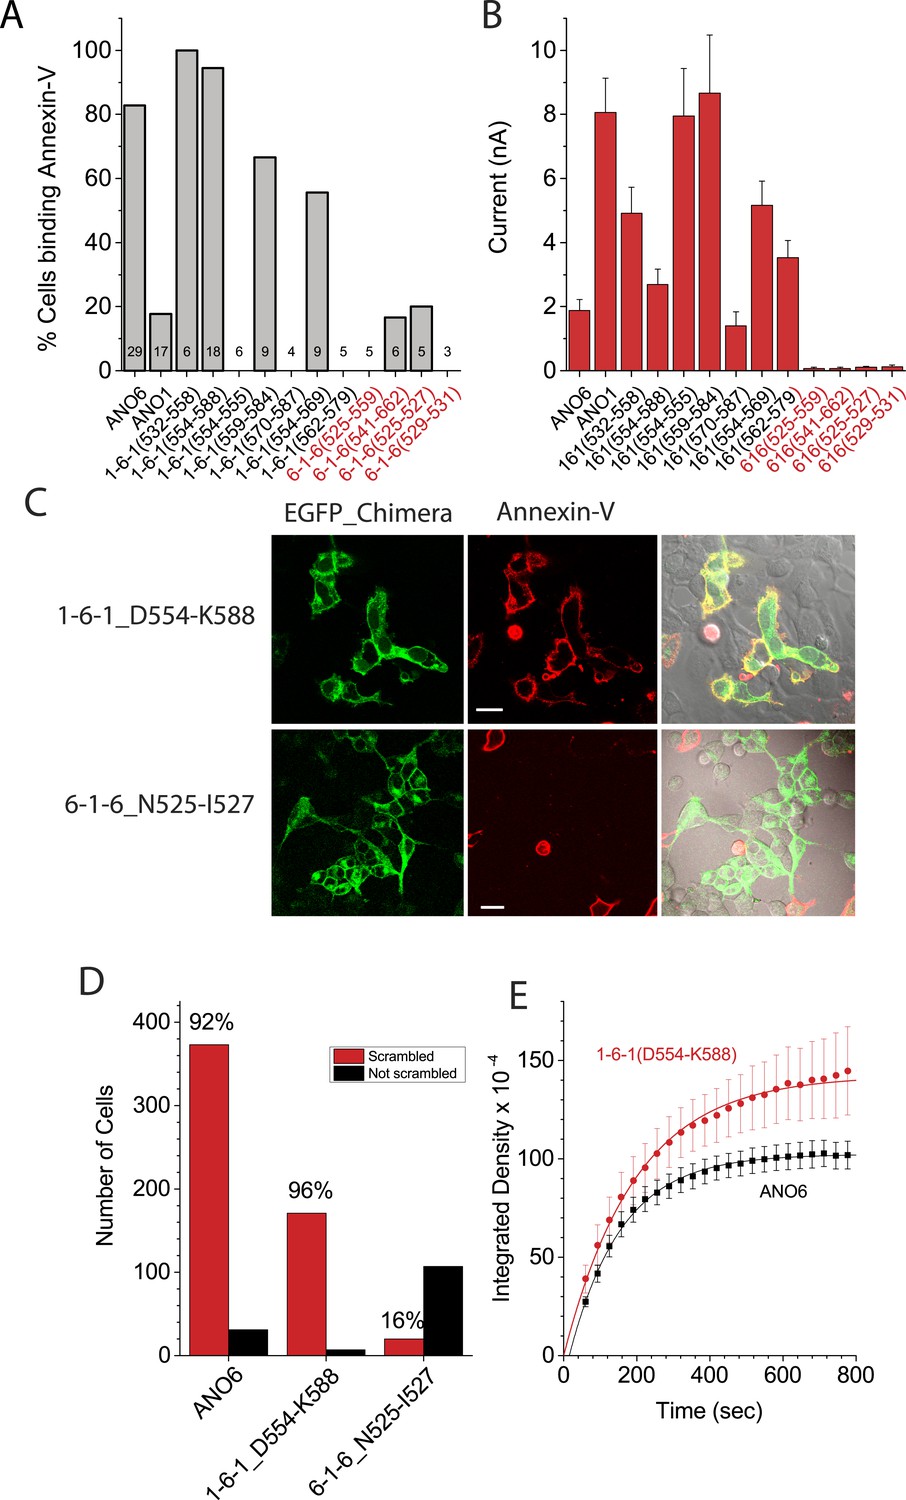
Properties of chimeras of ANO1 and ANO6.
(A, B) Patch clamp analysis of PLS (A) and ionic currents (B) in ANO1-ANO6 chimeras. Cells were patch clamped with 200 μM Ca2+ in the pipet and PLS was monitored by Annexin-V binding and currents measured by voltage steps from 0 mV to +100 mV. (C) Confocal imaging of Annexin-V binding to HEK cells transfected with the 1-6-1_D554-K588 or the 6-1-6_N525-I527 chimeras 10 min after elevating Ca2+ with A231187. (D) Number of cells binding Annexin-V (‘scrambled’) or not binding Annexin-V (‘not scrambled’) 10 min after elevation of Ca2+ with A23187 (N = 3 experiments each). (E) Time course of Annexin-V binding to cells expressing the 1-6-1_D554-K588 chimera (red) compared to the time course of Annexin binding to ANO1-expressing cells (black).
Figure 7—figure supplement 1
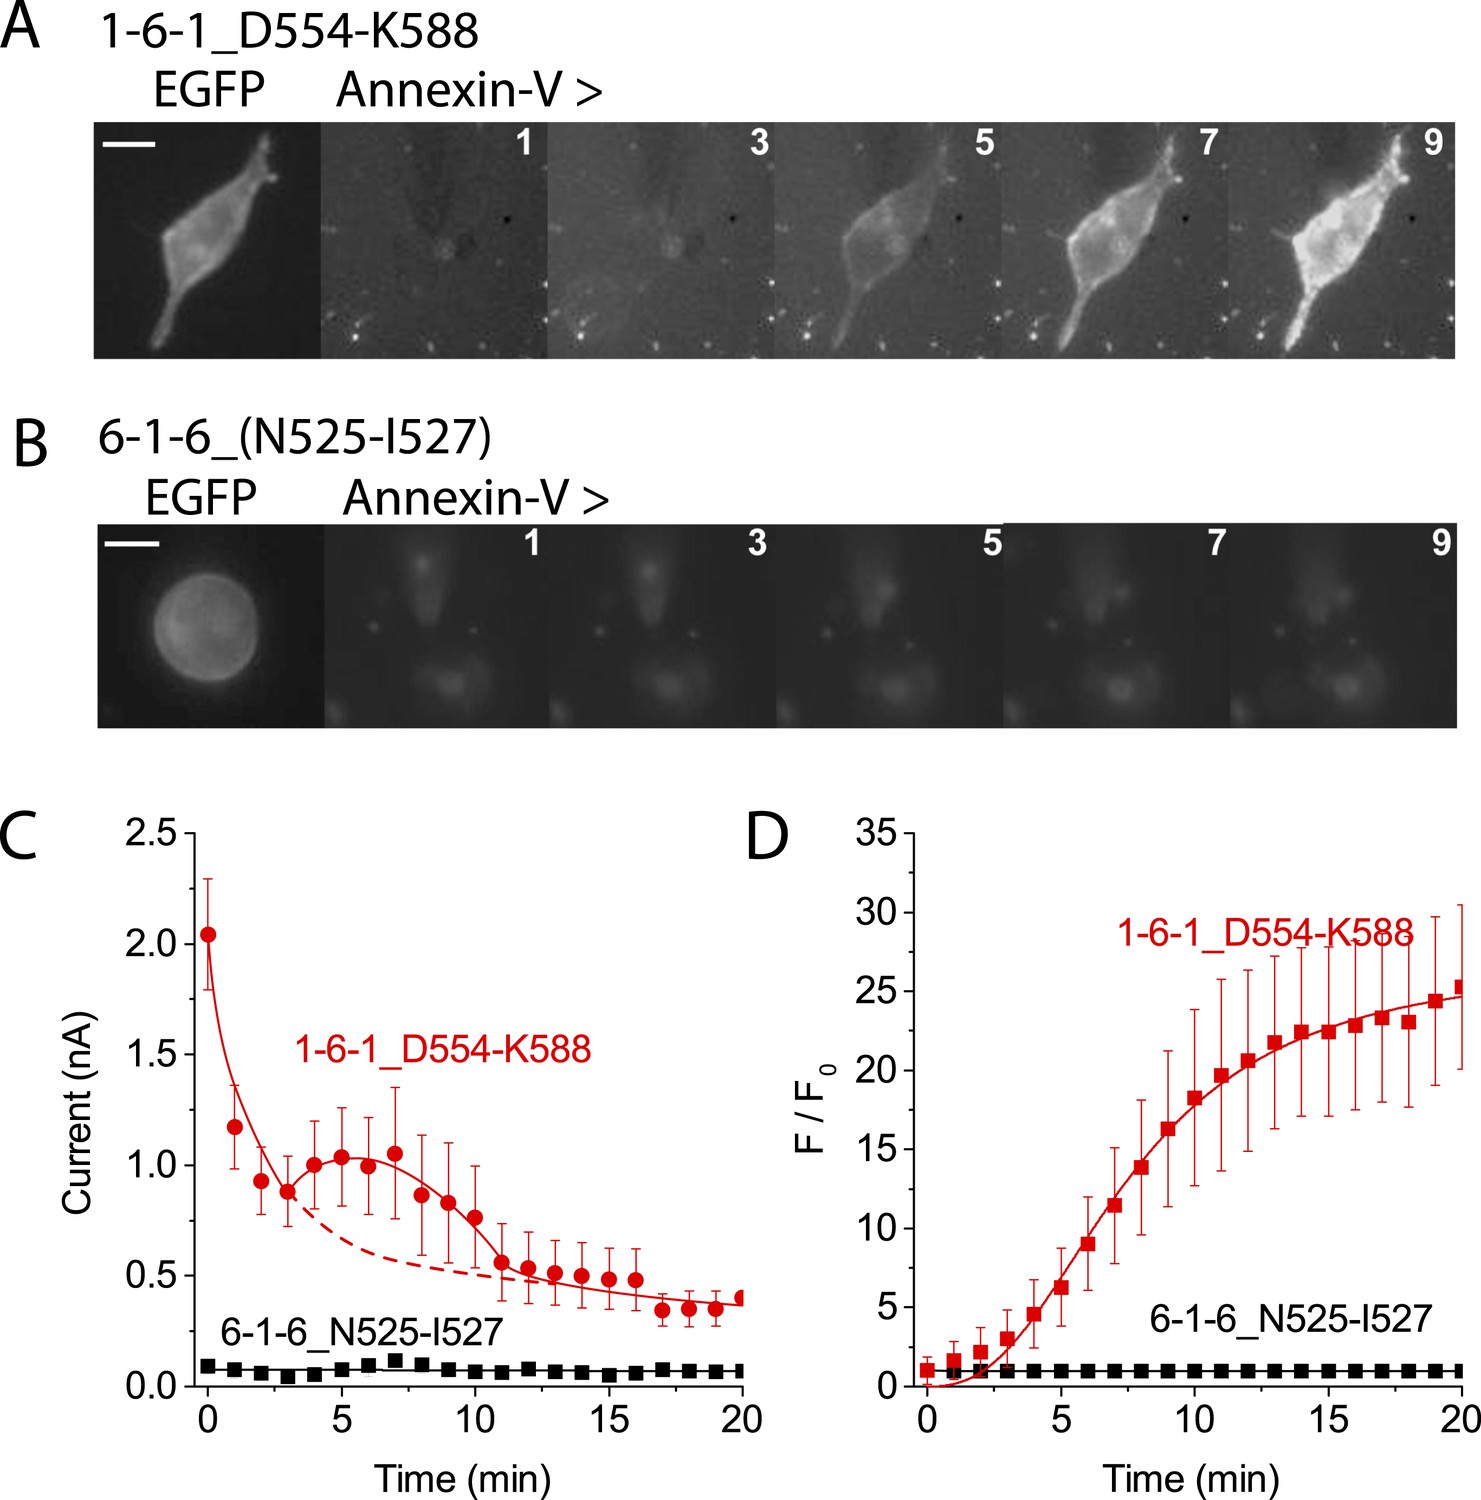
Patch clamp analysis of ANO1-ANO6 chimeras.
HEK cells expressing (A) 1-6-1_D554-K588 or (B) 6-1-6_N525-I527 were patch clamped in the presence of Annexin-V-Alexa-568 in the bath. The first image shows ANO6-EGFP fluorescence obtained before establishing whole-cell recording. Fo was determined immediately after establishing whole-cell recording. Annexin-V fluorescence images were acquired immediately after obtaining each I-V curve by voltage clamp at 1 min intervals. The patch pipet contained 20 μM free Ca2+ for 1-6-1_D554-K588 and 200 μM for 6-1-6_N525-I527. I-V curves were obtained by voltage steps from −100 mV to +100 mV in 20 mV increments. Scale bars 10 µm. (C) Average current amplitudes ± SEM at +100 mV for 1-6-1_D554-K588 (red circles) and 6-1-6_N525-I527 (black squares) plotted vs time after establishing whole-cell recording. The red curve was drawn by hand as the sum of an exponential and a Gaussian with the dashed portion of the curve representing the exponential curve in the absence of the Gaussian component. (D) Average Annexin-V fluorescence divided by the initial fluorescence ± SEM for the same cells as in C (n = 5).
Figure 8

Ion channel properties of ANO1-ANO6 chimeras.
(A) Inhibition of currents by MONNA. ANO1 is nearly completely blocked by 10 μM MONNA, while ANO6 and the 1-6-1 chimeras that scramble are not affected. (B) Effects of MONNA on currents associated with the 1-6-1_D554-K588 chimera. MONNA blocks the Ca2+-independent current elicited by depolarization to +100 mV (blue triangles), but has no effect on the Ca2+-activated current after scrambling has occurred (red squares). In contrast, before scrambling has occurred, MONNA partially blocks the Ca2+-activated current (open circles). (C–F) The ionic selectivity of currents associated with the 1-6-1_D554-K588 chimera (C–D) and the 1-6-1_S532-G558 chimera (E, F) were determined by the dilution method (see ‘Materials and methods’) by measuring reversal potentials with external solutions containing either 150 mM (black line) or 15 mM (red line) CsCl. (C) Ca2+-independent (zero ) and (D) Ca2+-activated currents associated with the 1-6-1_S532-G558 chimera. Currents recorded (E) before and (F) after scrambling with the 1-6-1_S532-G558 chimera. N = 3–7. Error bar represents SEM.
Figure 9 with 1 supplement
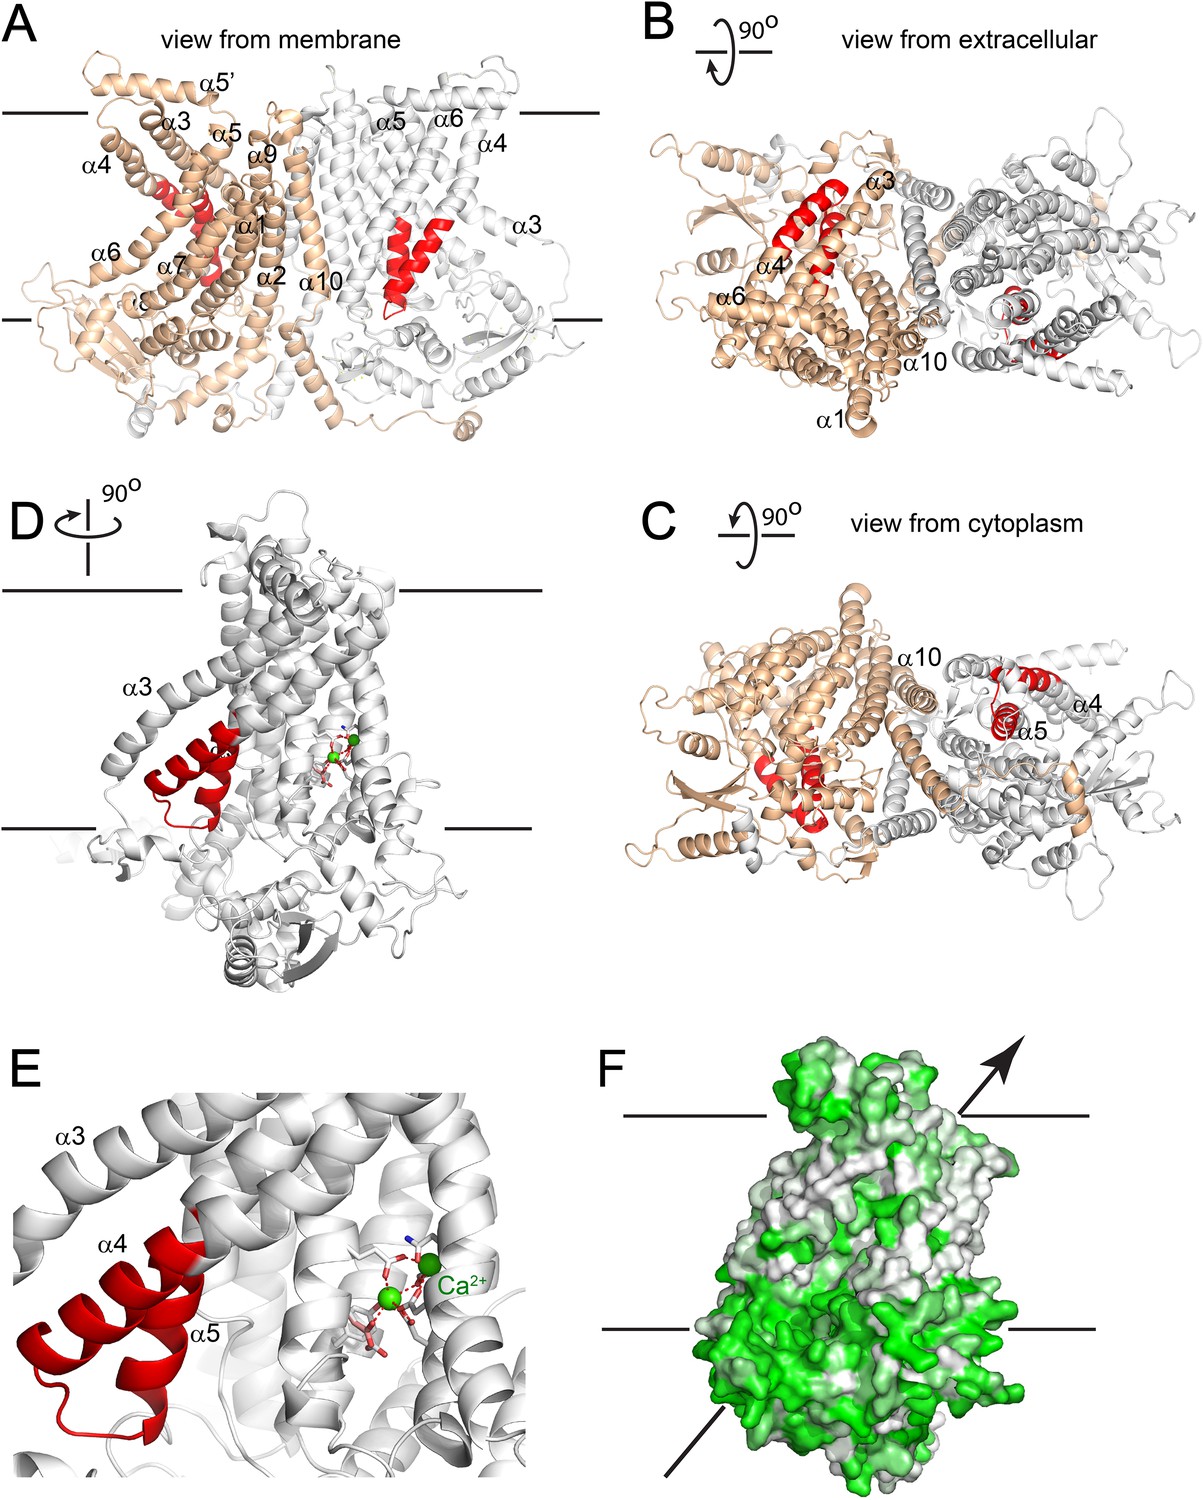
Homology model of ANO6.
(A) Side view from the membrane. ANO6 is shown as a dimer with the left subunit in gold and the right subunit in grey. The SCRD is colored red. Transmembrane helices are numbered. (B) View from extracellular side. (C) View from cytoplasm. (D) A view from the membrane looking towards the hydrophilic cleft showing the SCRD in red and the Ca2+ binding site in stick representation. Residues conserved between ANO6 and TMEM16 that coordinate Ca2+ (green) are shown as white sticks (C = white, O = red). ANO6 contains GXXX (pink), which is a D503 in TMEM16. (E) Close-up view of D. (F) Same view as D with surface colored to show hydrophilicity. Green: hydrophilic. White: hydrophobic.
Figure 9—figure supplement 1
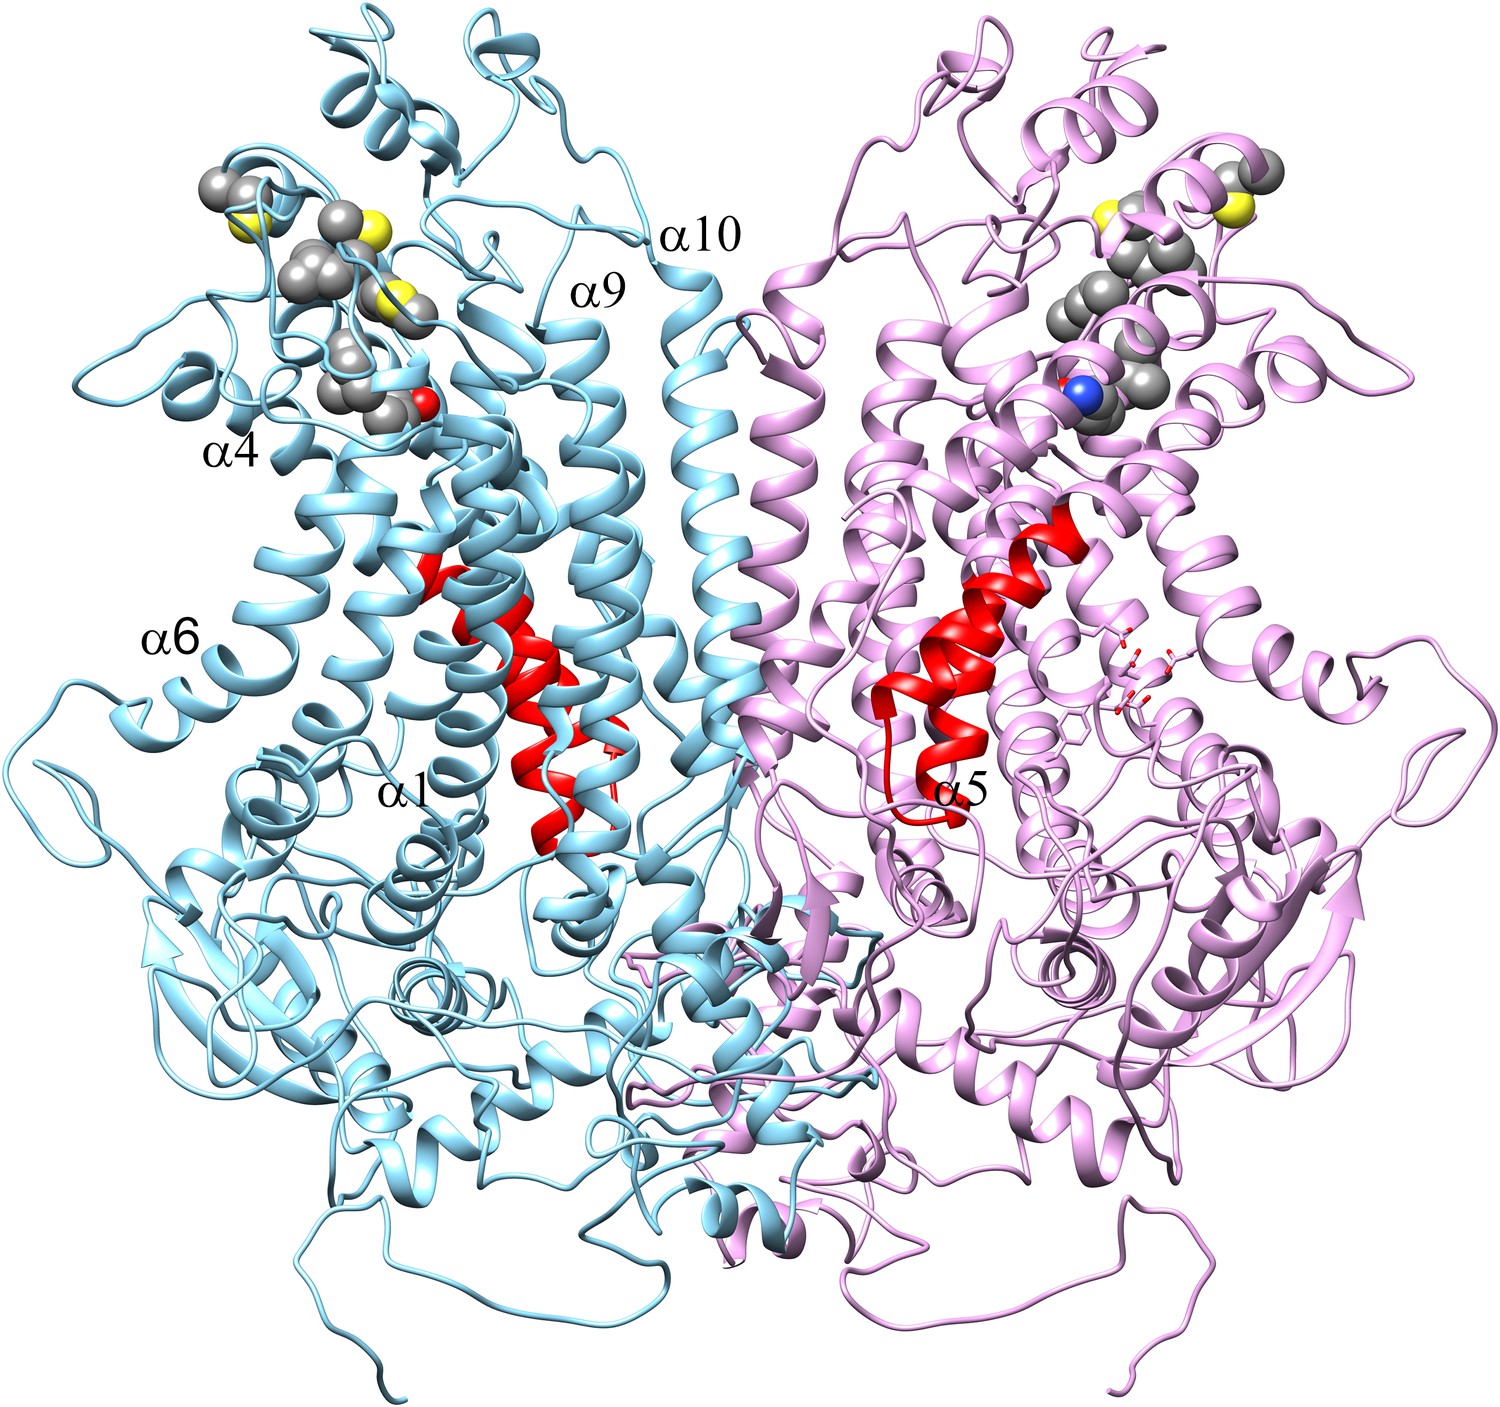
Homology model of ANO1 dimer.
The SCRD homology domain is colored red. The Ca2+ binding site is shown in stick representation in the right monomer. Residues identified by Yu et al. (2012) as forming the vestibule of the ion conduction pathway of ANO1 are shown in spacefill (C625, G628-M632, I636-Q637).
Download links
A two-part list of links to download the article, or parts of the article, in various formats.
Downloads (link to download the article as PDF)
Open citations (links to open the citations from this article in various online reference manager services)
Cite this article (links to download the citations from this article in formats compatible with various reference manager tools)
Identification of a lipid scrambling domain in ANO6/TMEM16F
eLife 4:e06901.
https://doi.org/10.7554/eLife.06901


