The activation of IgM- or isotype-switched IgG- and IgE-BCR exhibits distinct mechanical force sensitivity and threshold
- Collaborative Innovation Center for Diagnosis and Treatment of Infectious Diseases, China
- Chinese Academy of Science, China
- Chinese Academy of Sciences, China
Figures
Figure 1 with 1 supplement
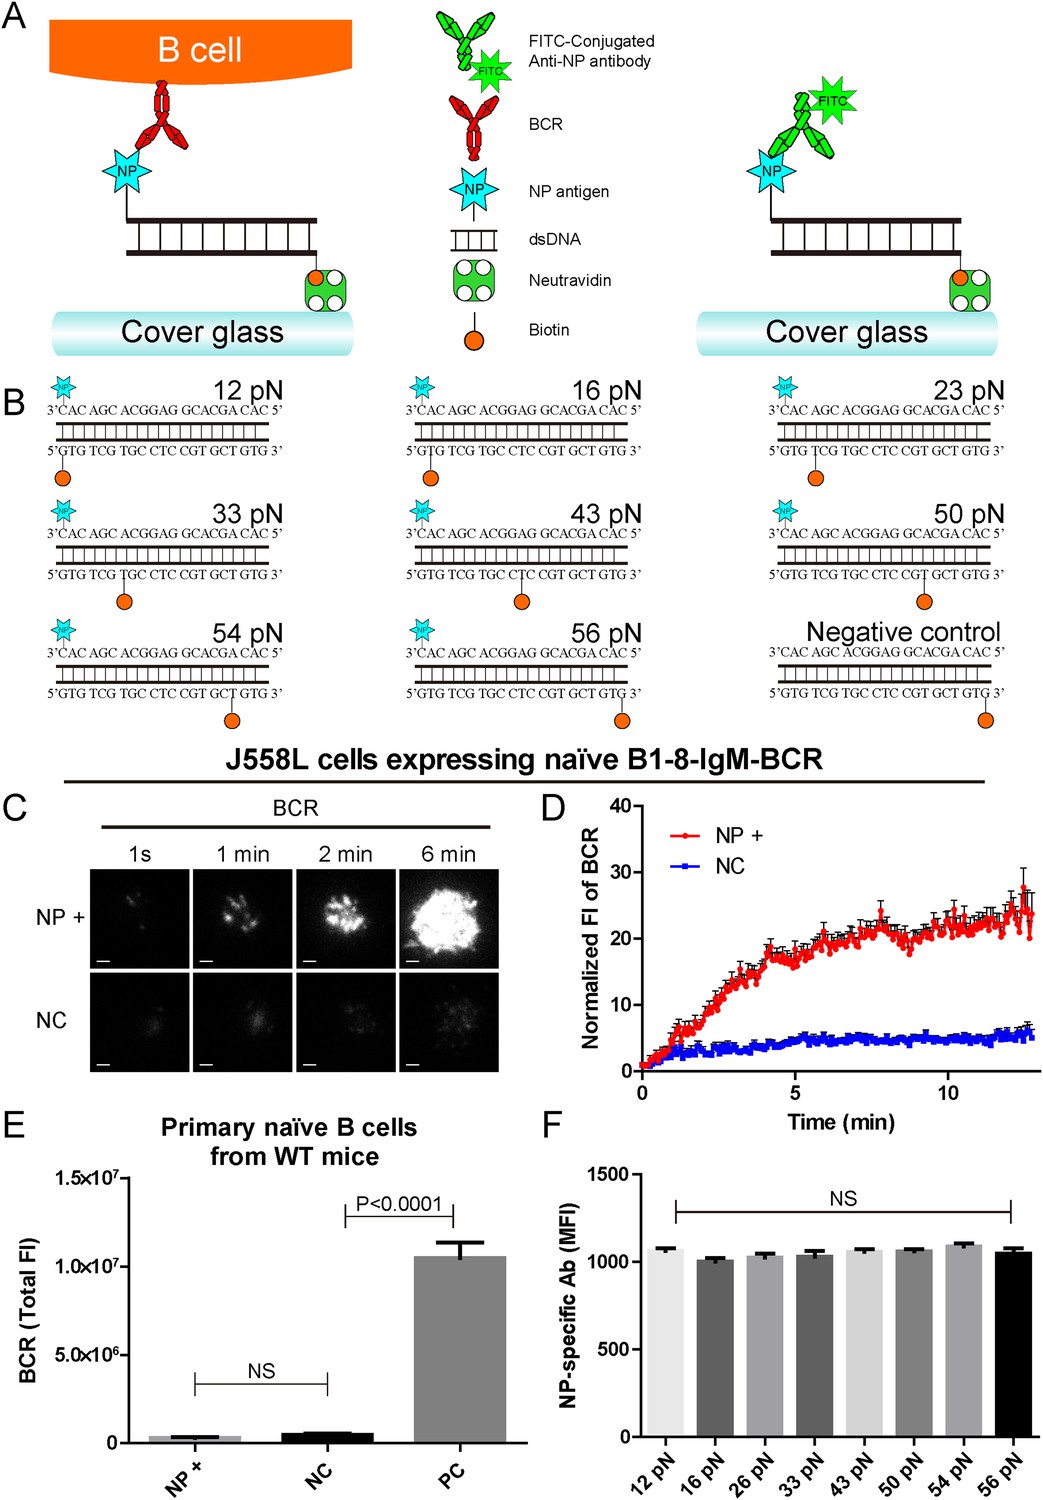
The construction of B1-8-BCR-specific NP-TGT mechanical force sensor system.
(A) Schematic representation of the NP-TGT and NP-specific B1-8-BCR expressing B cells. NP-TGT molecule is immobilized on the surface of coverslip, which will get ruptured if the mechanical force applied by the B1-8-BCR is larger than the predefined tension force of a certain NP-TGT (for example 56 pN is depicted in the figure). FITC-conjugated anti-NP antibody is used to quantify the molecule density of each different type of NP-TGT sensors tethered on coverslip. (B) The dsDNA geometries and predefined tension force of all eight NP-conjugated TGT sensors and one control TGT without NP conjugation. (C) Representative TIRFM images showing the dynamics of the synaptic accumulation of BCRs from J558L cells expressing B1-8-IgM-BCR in contact with coverslip presenting 56 pN NP-TGT sensor or control TGT (NC) at the indicated time points. Scale bar is 1.5 μm. (D) Comparisons of averaged traces showing the dynamic accumulation of BCRs as demonstrated in (C) in a 13 min TIRFM imaging time course. Bars represent mean ±SEM. Data were from at least 20 cells over three independent experiments. (E) Primary mature naive B cells from wild-type C57BL/6 mice expressing non-NP-specific IgM-BCR did not initiate the activation when encountering 56 pN NP-TGT sensor compared to the response of the same B cells encountering 56 pN TGT sensor without NP conjugation. Biotin-conjugated goat anti-mouse IgM surrogate antigens were used as a positive control to efficiently drive the synaptic accumulation of IgM-BCRs in B cell activation. Bars represent mean ±SEM. Two-tailed t tests were performed for the statistical comparisons. Data were from at least 30 cells over three independent experiments. (F) Quantification of the mean fluorescence intensity (MFI) of FITC-conjugated NP-specific antibodies on the surface of coverslip tethering the same amount of NP-TGT sensors. Bars represent mean ±SEM. Two-tailed t tests were performed for the statistical comparisons. The surface density is 29.0 molecule/µm2, seeing more in Figure 2—figure supplement 1.
Figure 1—figure supplement 1
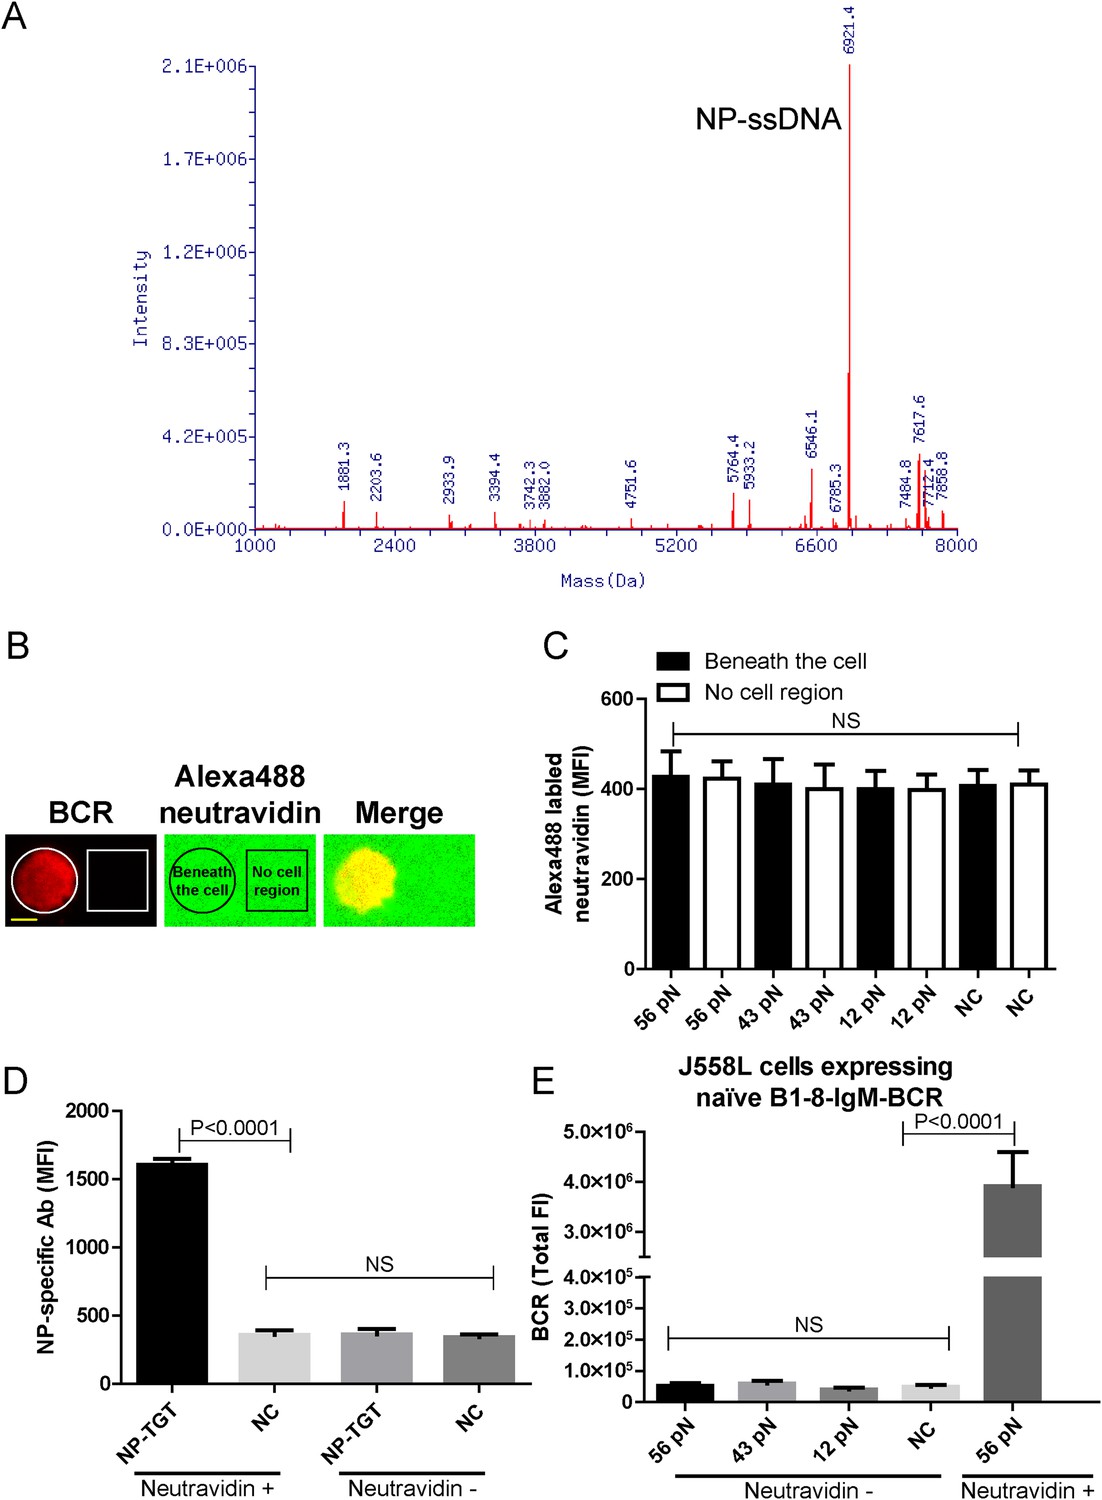
The quality control of NP-TGT sensor based experimental system.
(A) The quality control of the purified NP-ssDNA by mass spectrum. (B, C) No obvious dissociation of the neutravidin was detected in a 10 min incubation time course. In B, two-color TIRF images showing the formation of a typical immunological synapse (IS) of a single B cell (BCR, red color) and the corresponded Alexa488-conjugated neutravidin within the B cell IS. Also given are control neutravidin TIRF images from an area without B cells. Scale bar is 5 μm. In C, the statistical analyses of the MFI of Alexa488-conjugated neutravidin from the area on coverslip without B cells (no cell region) vs the case within the area of B cell IS (beneath the cell) that were induced by 12 pN, 43 pN or 56 pN NP-TGT sensors and a negative control 56 pN TGT without NP conjugation (NC). (D) Statistical analyses for the MFI of FITC-conjugated NP-specific antibodies to show that NP-TGT can only be coated to coverslip in a neutravidin-dependent manner. (E) Quantification of the synaptic accumulation of IgM-BCRs in J558L cells expressing naive B1-8-IgM-BCR to show that non-specific NP-TGT that were tethered on coverslip in a neutravidin-independent manner cannot activate B cells. J558L cells expressing naive B1-8-IgM-BCR were either placed on neutravidin-coated coverslip that were incubated with 56 pN NP-TGT sensor or placed on neutravidin-non-coated coverslip that were incubated with indicated types of NP-TGT sensors. NC represents 56 pN TGT sensor without NP conjugation. In figure C, D, and E, bars represent mean ±SEM. Two-tailed t tests were performed for the statistical comparisons. Data were from at least 30 cells or 20 measurements in each group of two independent experiments.
Figure 2 with 2 supplements
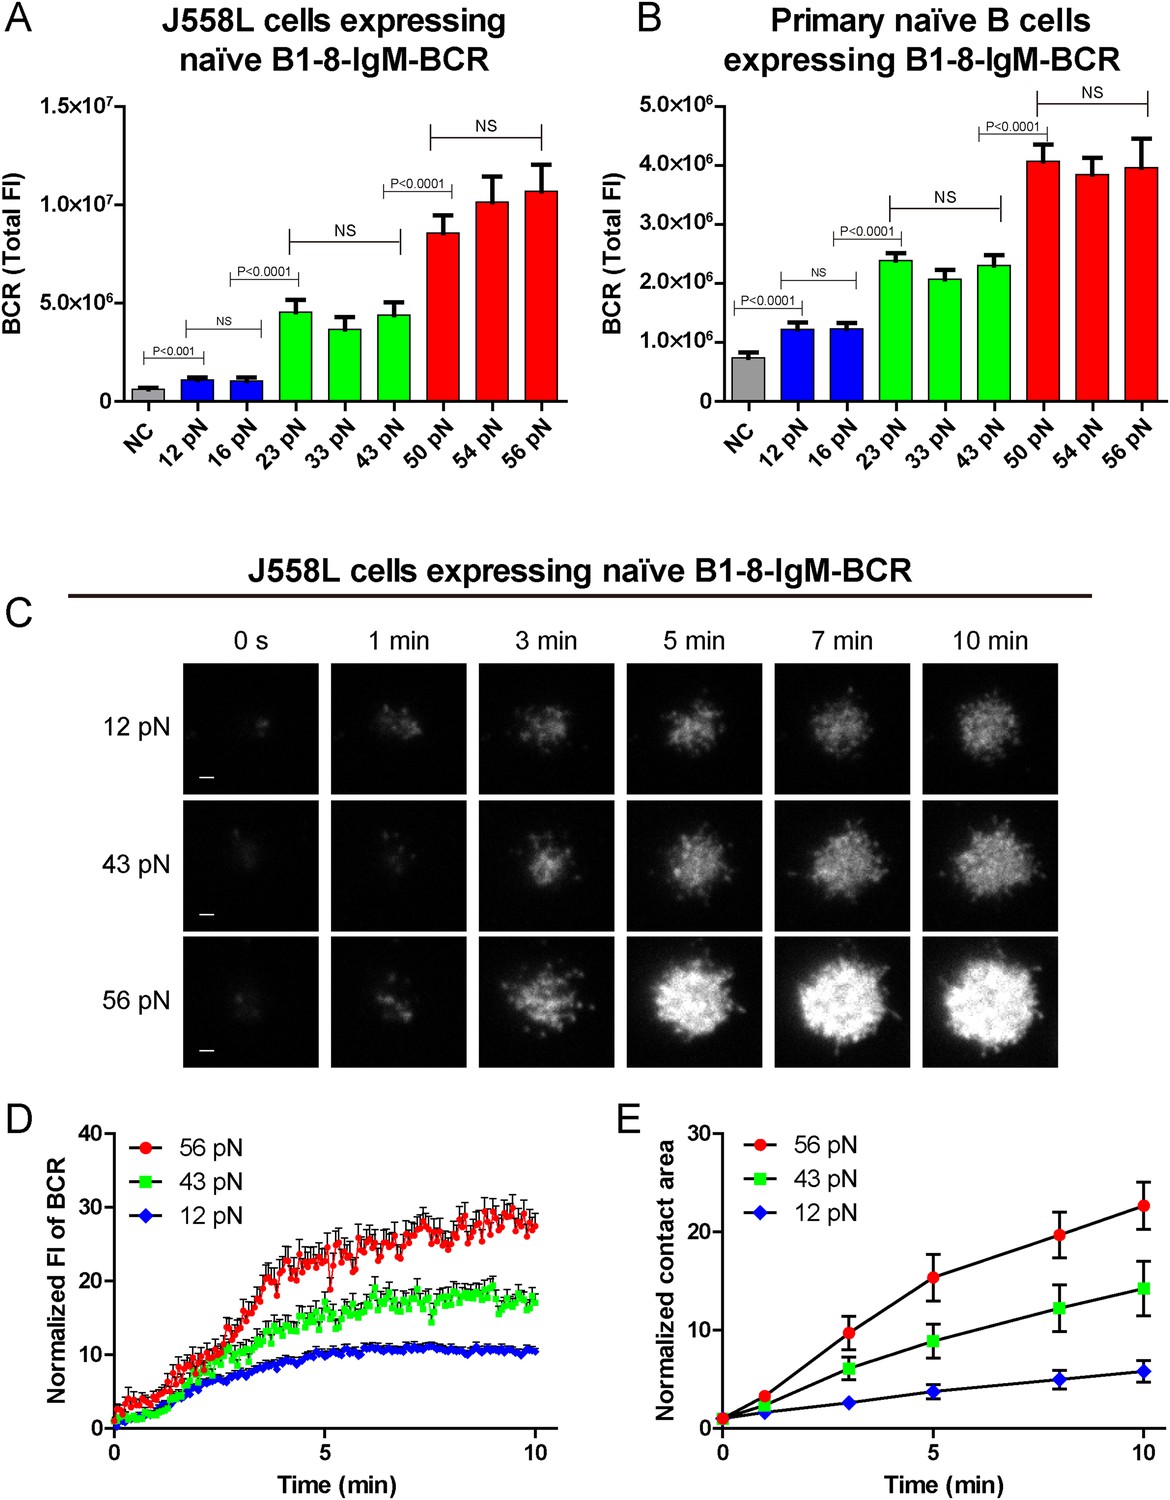
The synaptic accumulation of the IgM-BCRs is dependent on mechanical forces and exhibits a multi-threshold effect.
(A, B) Statistical quantification of the synaptic recruitment of IgM-BCR in J558L cells expressing naive B1-8-IgM-BCR (A) and primary naive B cells expressing B1-8-IgM-BCR (B). Bars represent mean ±SEM. Two-tailed t tests were performed for the statistical comparisons. Data are from at least 40 cells over three independent experiments. (C) Representative TIRFM images showing the dynamics of the synaptic accumulation of IgM-BCRs from J558L cells expressing naive B1-8-IgM-BCR in contact with coverslip presenting 12 pN, 43 pN or 56 pN NP-TGT sensors at the indicated time points. Scale bar is 1.5 μm. (D, E) Comparisons of averaged traces showing the dynamic accumulation of naive IgM-BCRs into the immunological synapse (D) and the growing features of the size of contact area (E) for J558L cells expressing naive B1-8-IgM-BCR as demonstrated in (C) in a 10 min TIRFM imaging time course. Bars represent mean ±SEM. Two-tailed t tests were performed for the statistical comparisons. Data are from at least 20 cells over two independent experiments.
Figure 2—figure supplement 1
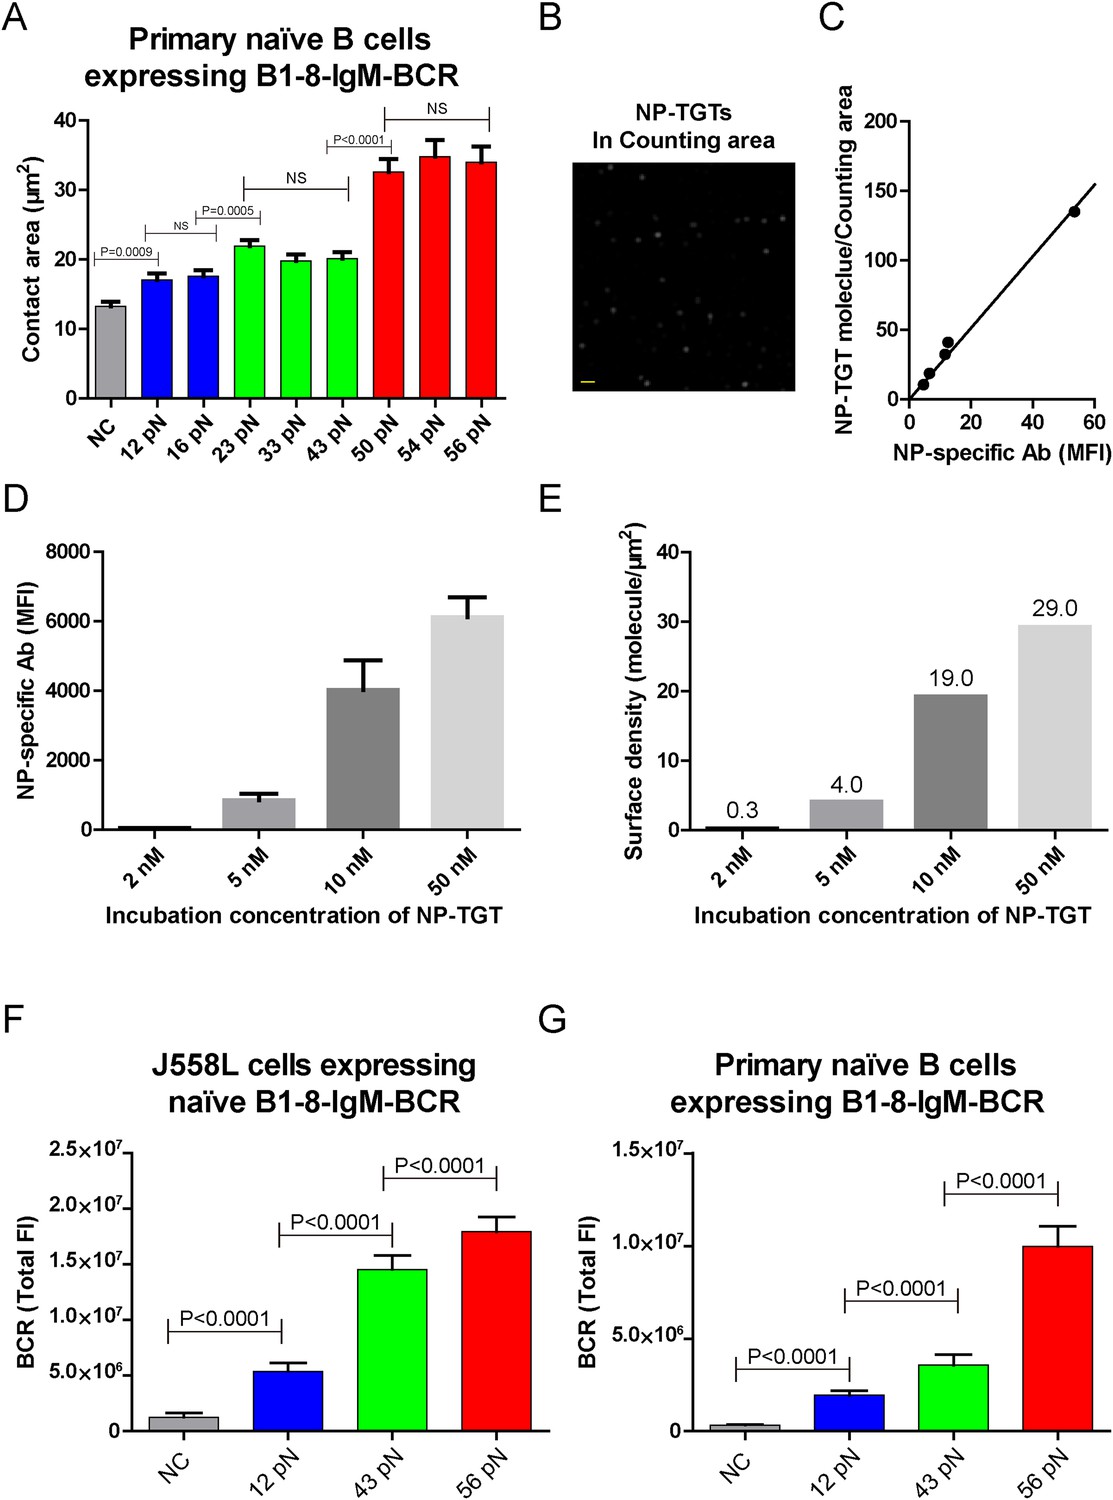
The contact area after IgM-BCR activation is dependent on mechanical forces with multi-threshold effects and such a pattern is still evident at low density of NP-TGT sensor.
(A) Statistical analyses of the size of the contact area of primary naive B cells expressing B1-8-IgM-BCR from B1-8 Tg mice when encountering of the indicated types of NP-TGT sensors. (B) The representative image of NP-TGT molecule indicated by FITC-conjugated NP-specific antibodies within a counting area (473.1 μm2). Scale bar is 1.5 μm. (C) The conversion and strong linear correlation between the MFI and the density of FITC-conjugated NP-specific antibody on coverslip. NP-specific antibody was used to indicate the density of NP-TGT sensor on coverslip. The surface density is quantified at the appropriate incubation concentration of NP-TGT sensor to achieve well-separated and approximately round spots in TIRF imaging (B), which were subsequently analyzed by a Matlab supported 2D Gaussian fitting code (Source code 1) to perform the counting as reported in our previous studies (Liu et al., 2010a). The equation of the fitted linear regression is: Surface density (per counting area, about 473.1 μm2) = 2.42 × MFI, R square value for the linear fitting is 0.99. (D) Quantification of the MFI of NP-specific antibody on the coverslip at different incubation concentration of NP-TGT sensor. (E) Surface density of NP-TGT sensors at different incubation concentration when were coated on coverslip as calculated by combining the data in C and D. (F, G) Quantification of the synaptic accumulation of IgM-BCRs in J558L cells expressing naive B1-8-IgM-BCR (F) or primary naive B cells expressing B1-8-IgM-BCR (G) that were placed on coverslip coated with surface density of 4.0 molecule/μm2 of 12 pN, 43 pN, and 56 pN NP-TGT sensors. Bars represent mean ±SEM. Two-tailed t tests were performed for the statistical comparisons. Data were from at least 30 cells over three independent experiments.
Figure 2—figure supplement 2
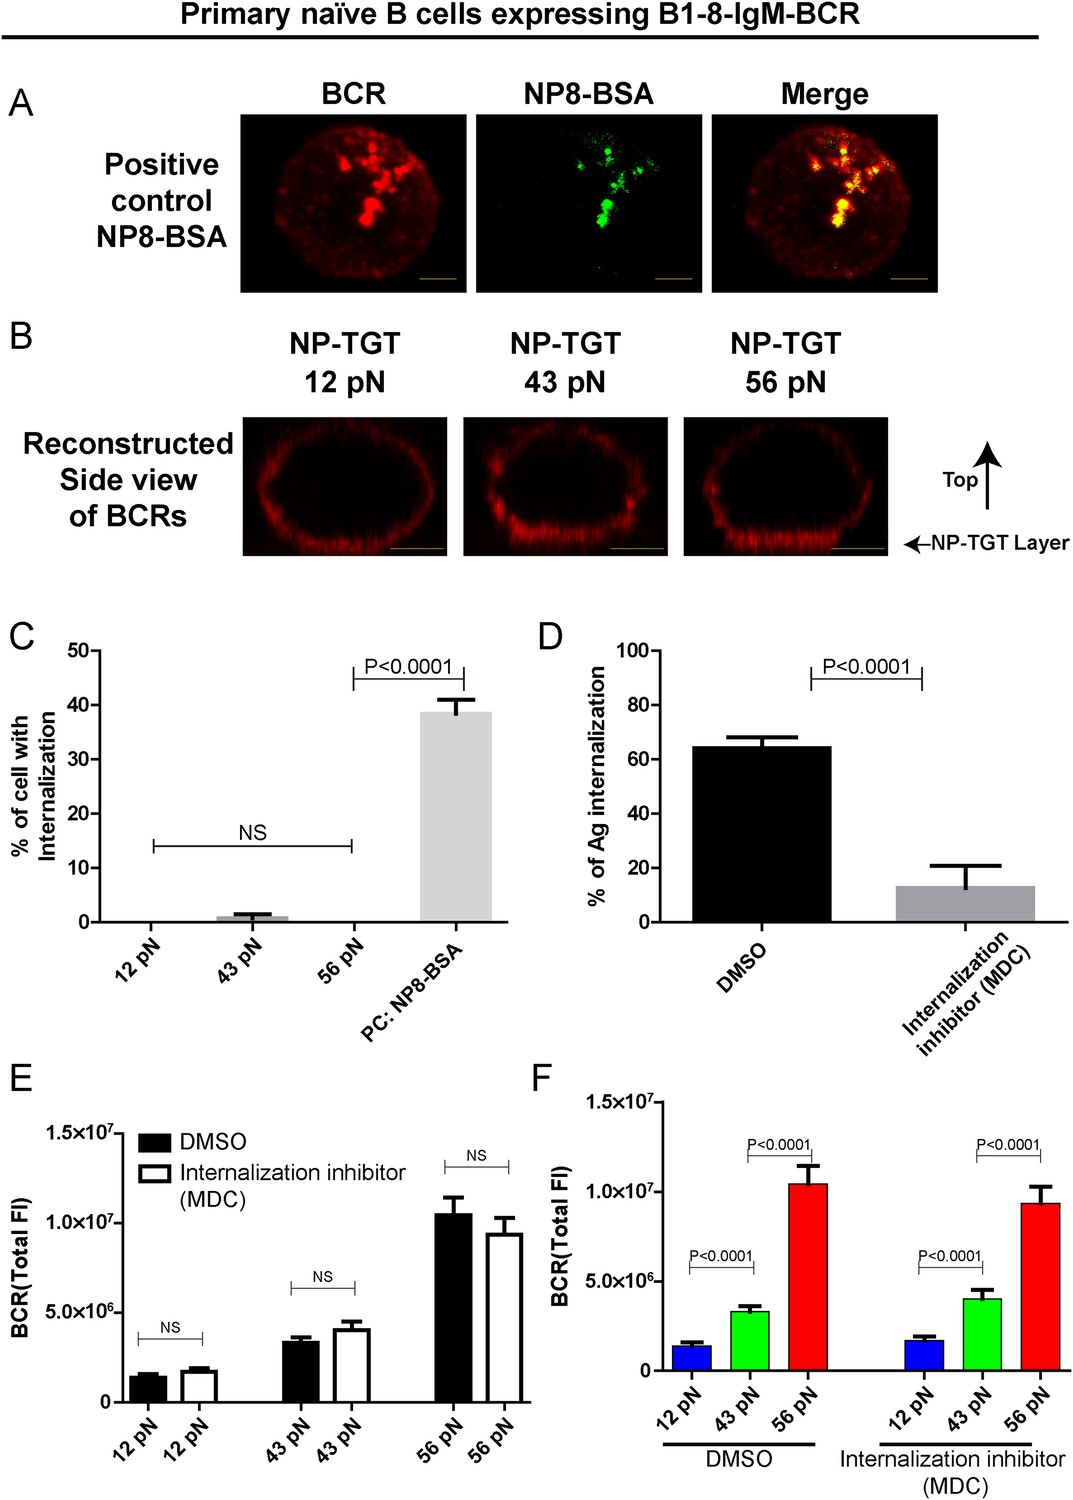
The patterned dependence on the mechanical forces of IgM-BCR activation does not rely on BCR internalization.
(A) Representative confocal images showing the efficient internalization of BCR and antigen molecules in primary naive B cells expressing B1-8-IgM-BCR from B1-8 Tg mice that were interacted with soluble NP8-BSA for 10 min. Scale bar is 1.5 μm. (B) Side view confocal images showing the lack of internalization of the pre-stained BCR molecules in primary naive B cells expressing B1-8-IgM-BCR from B1-8 Tg mice that were placed on coverslip presenting 12 pN, 43 pN or 56 pN NP-TGT sensors for 10 min. B cells were pre-stained with DyLight 649 AffiniPure Fab Fragment Goat Anti-Mouse IgM, µ Chain Specific antibodies before the imaging experiment. Scale bar is 2 μm. (C) Statistical quantification of the percentage of B cells with internalization of BCRs as represented in A and B. (D) Statistical quantification to show that B cell internalization can be blocked by MDC inhibitor in the condition that the B cells were pretreated by MDC before were activated for 10 min by soluble NP8-BSA as represented in A. (E, F) The synaptic accumulation of IgM-BCRs in primary naive B cells expressing B1-8-IgM-BCR from B1-8 Tg mice in contact with the indicated types of NP-TGT sensors. In this experiment, B cells were pretreated with either DMSO or MDC following a protocol as detailed in ‘Materials and methods’ section. Cross comparison strategy were used in these figures. In all of these plots, bars represent mean ±SEM. Two-tailed t tests were performed for the statistical comparisons. Data were at least from 30 cells or 15 measurements in each group of three independent experiments.
Figure 3
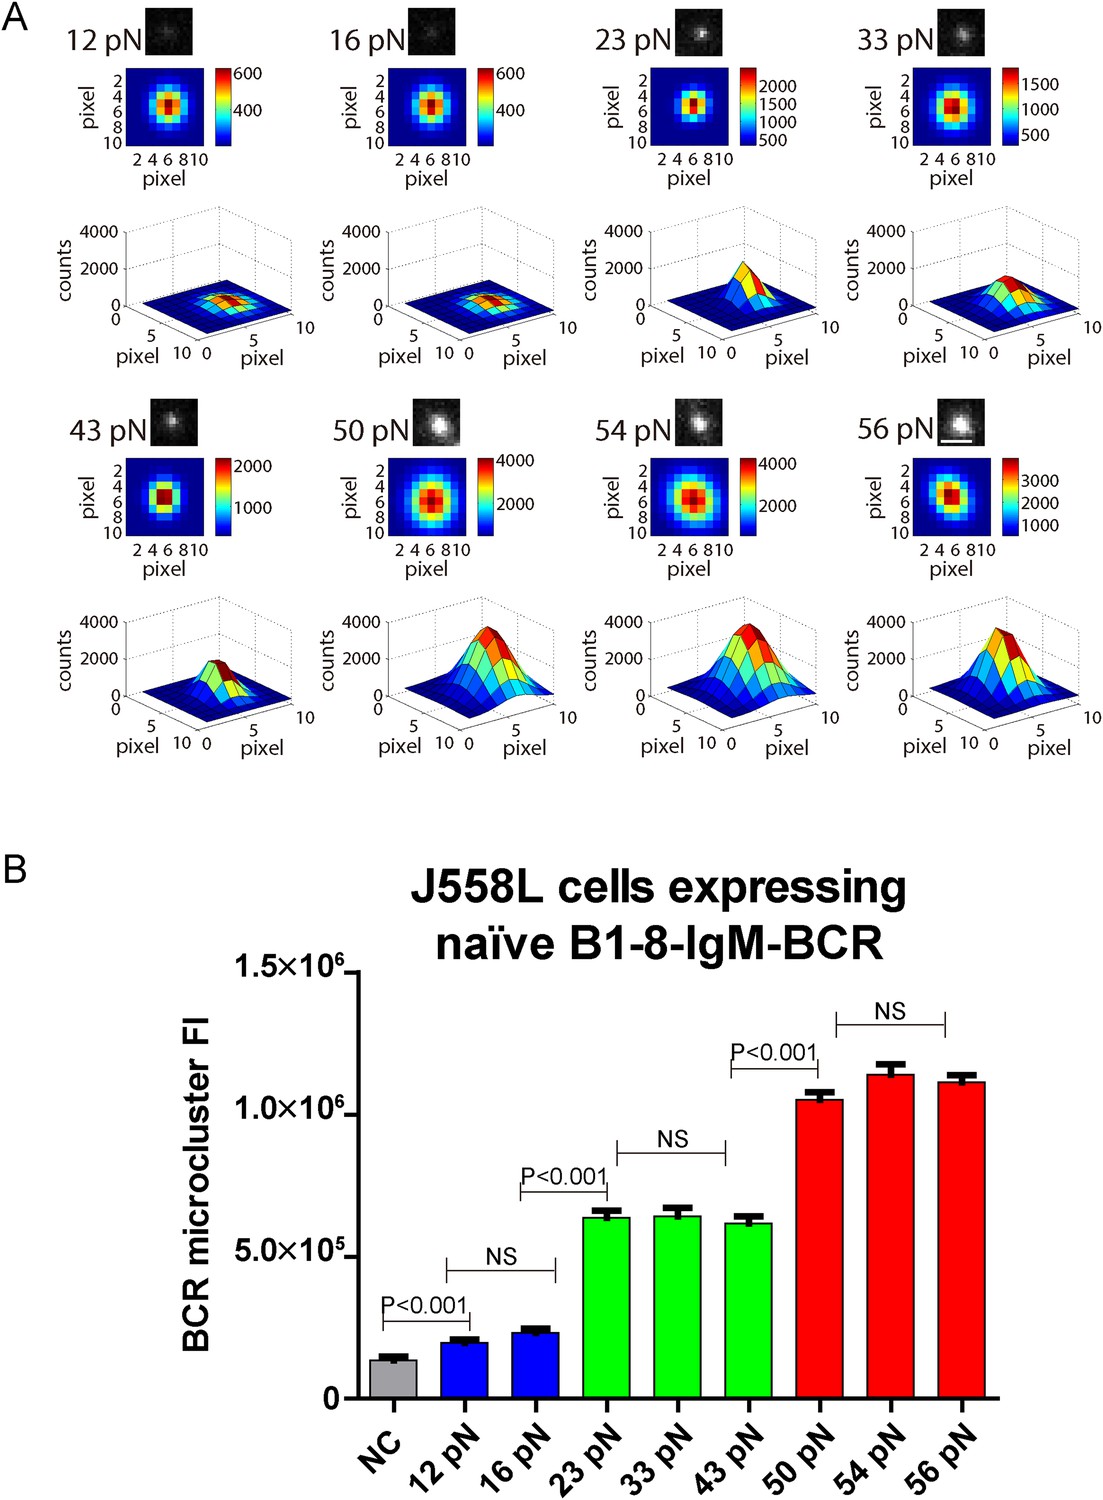
The volume of the IgM-BCR microcluster produced by different NP-TGT sensors is dependent on mechanical forces and exhibits a similar multi-threshold effect.
(A) Representative original (top panel), pseudo-colored 2D (middle panel), and 2.5D Gaussian images (bottom panel) of typical BCR microclusters induced by 12, 16, 23, 33, 43, 50, 54, and 56 pN NP-TGT sensors. Scale bar is 1.5 μm. (B) Statistical comparison of FI of hundreds of BCR microclusters in the immunological synapse in J558L cells expressing naive B1-8-IgM-BCR encountering NP-TGT sensors with indicated tension force. Bars represent mean ±SEM. Two-tailed t tests were performed for the statistical comparisons. Data are from at least 30 cells over three independent experiments.
Figure 4
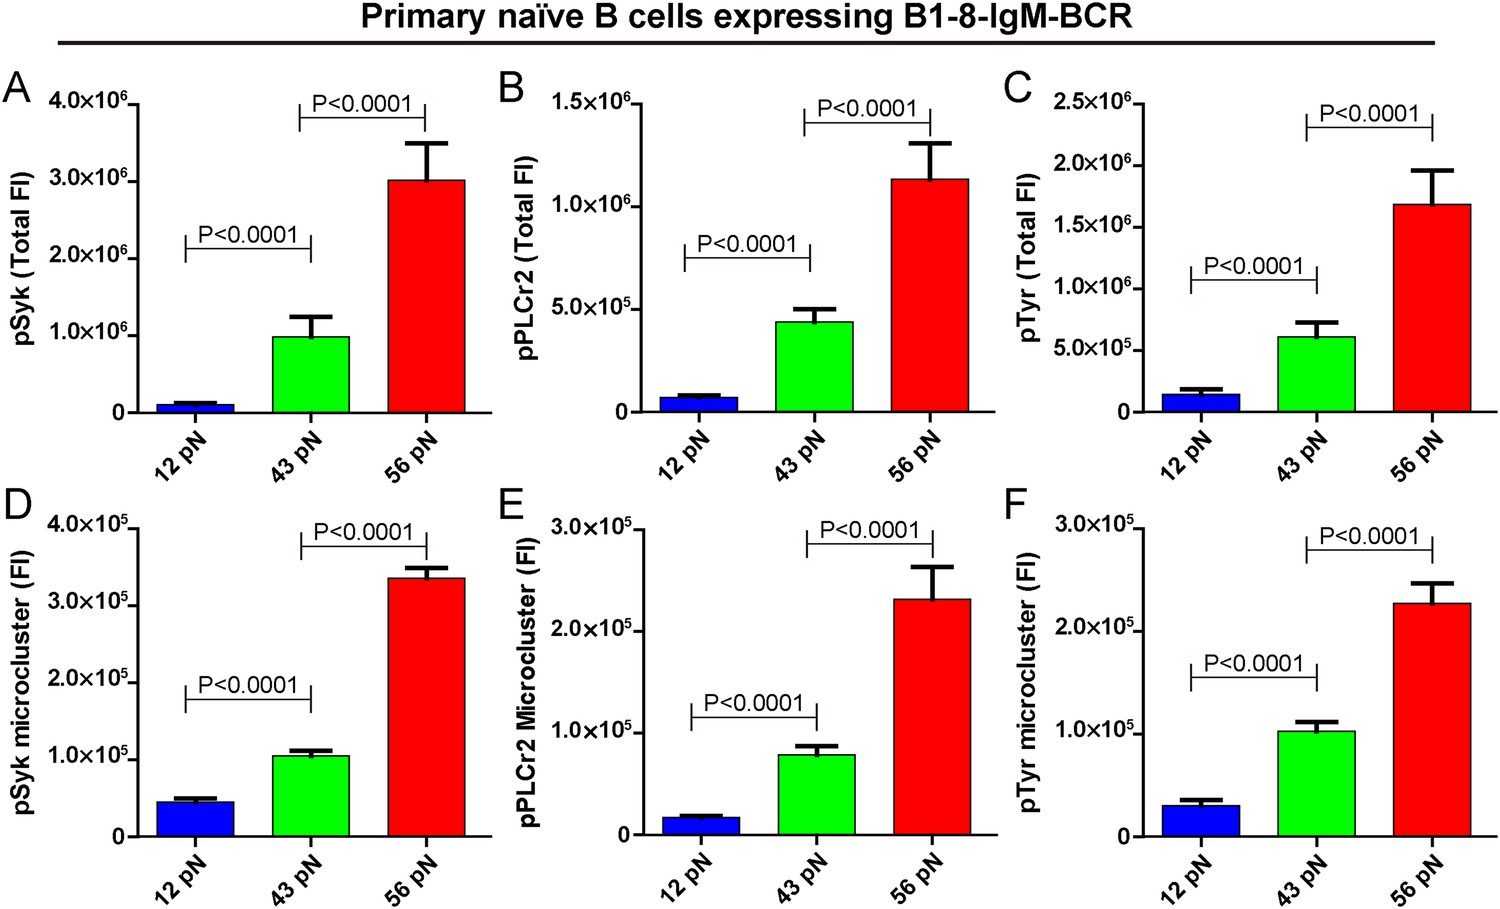
The strength of IgM-BCR signaling is dependent on mechanical forces.
(A–C) Statistical quantification of the synaptic recruitment of pSyk (A), pPLCγ2 (B), and pTyr (C) in primary naive B cells expressing B1-8-IgM-BCR that were placed on coverslip presenting 12 pN, 43 pN or 56 pN NP-TGT sensors. (D–F) Statistical comparison of the volume of pSyk (D), pPLCγ2 (E), or pTyr (F) microclusters in J558L cells expressing naive B1-8-IgM-BCR that were produced by 12 pN, 43 pN, or 56 pN NP-TGT molecules. In all of these plots, bars represent mean ±SEM. Two-tailed t tests were performed for the statistical comparisons. Data were at least from 30 cells of three independent experiments.
Figure 5 with 1 supplement

The patterned dependence on the mechanical forces of IgM-BCR activation does not rely on LFA-1 mediated adhesion and dynein, and is only partially dependent on myosin IIA.
(A, B) The synaptic accumulation of IgM-BCRs in primary naive B cells expressing B1-8-IgM-BCR in contact with the indicated types of NP-TGT sensors with or without ICAM-1 co-tethering. Cross comparison strategy were used in these figures. (C–H) The synaptic accumulation of IgM-BCRs in primary naive B cells expressing B1-8-IgM-BCR in contact with the indicated types of NP-TGT probes. In this experiment, primary naive B cells expressing B1-8-IgM-BCR were pretreated with DMSO as a control in combination with FAK inhibitor (C, D), myosin IIA inhibitor (E, F) or dynein inhibitor (G, H) following a protocol that was detailed in ‘Materials and methods’ section. Cross comparison strategy were used in these figures. In all of these plots, bars represent mean ±SEM. Two-tailed t tests were performed for the statistical comparisons. Data were at least from 30 cells in each group of three independent experiments.
Figure 5—figure supplement 1
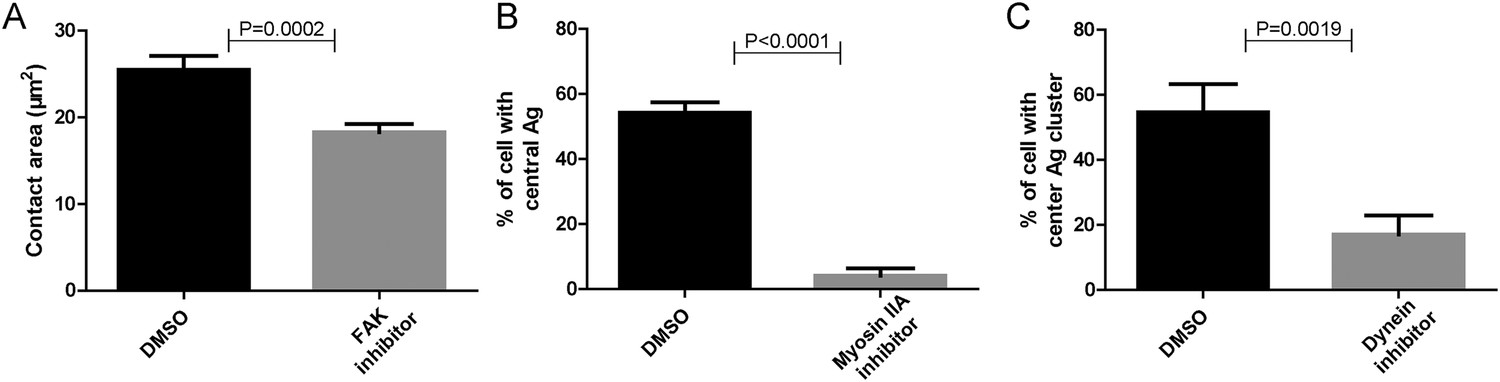
Functional test of pharmaceutical inhibitors.
(A–C) Positive control experiments were performed to show that each inhibitor used in Figure 5 is working. These experiments showed that FAK inhibitor significantly reduced the size of the contact area of B cells that were placed on coverslip presenting antigens, consistent with the reported function of FAK inhibitor (Mlinaric-Rascan and Yamamoto, 2001) (A); Myosin IIA inhibitor dramatically reduced the proportion of B cells with internalized Alexa488-conjugated NP8-BSA antigen in the soluble format after reaction for 30 min, consistent with the reported function of Myosin IIA inhibitor (Vascotto et al., 2007) (B); Dynein inhibitor dramatically reduced the formation of cSMAC structure in B cell that were placed on planar lipid bilayers presenting antigens for 20 min, consistent with the reported function of Dynein inhibitor (Schnyder et al., 2011) (C). In all of these plots, bars represent mean ±SEM. Two-tailed t tests were performed for the statistical comparisons. Data were at least from 30 cells or at least 15 measurements in each group of three independent experiments.
Figure 6 with 1 supplement
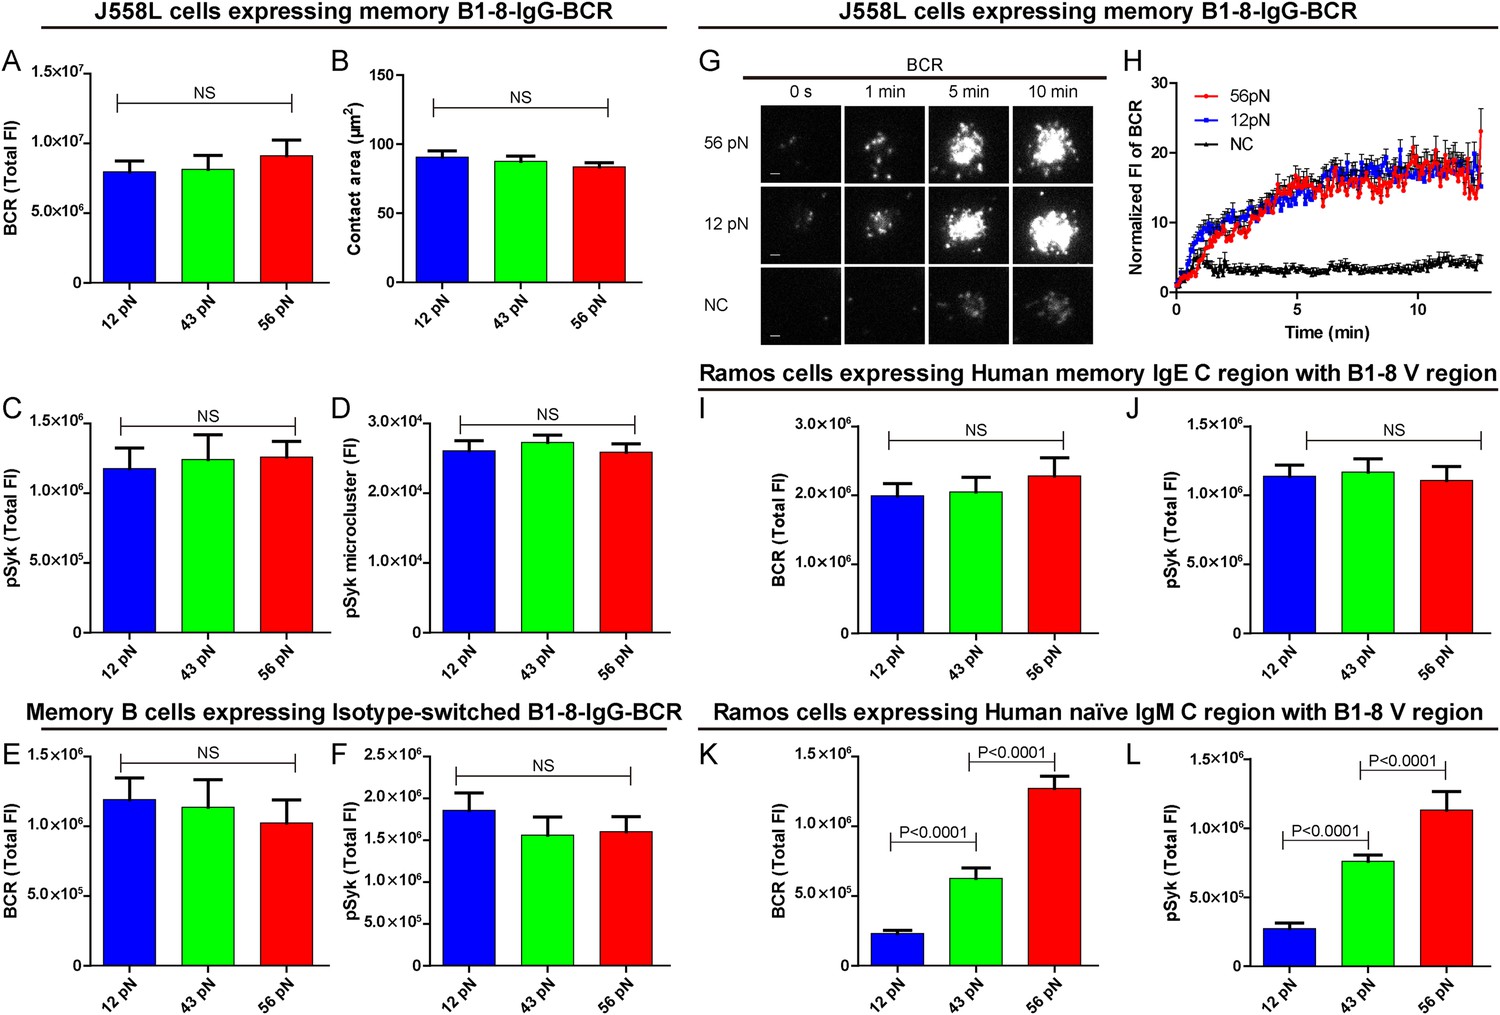
The activation of isotype-switched IgG-BCRs or IgE-BCRs on memory B cells requires either no tension or a mechanical force below 12 pN.
(A, B) Statistical quantification of the synaptic accumulation of IgG-BCR and the volume of the contact area of J558L cells expressing memory B1-8-IgG-BCR encountering 12 pN, 43 pN, or 56 pN NP-TGT sensors. (C, D) Statistical analyses of synaptic accumulation of pSyk accumulation (C) and the volume of pSyk microcluster (D) in response to 12 pN, 43 pN, or 56 pN NP-TGT sensors. (E, F) Quantification of the synaptic accumulation of IgG-BCRs (E) or pSyk (F) in memory B cells expressing isotype-switched B1-8-IgG-BCR from B1-8 Tg mice that were placed on coverslip presenting 12 pN, 43 pN, or 56 pN NP-TGT probes. (G) Representative TIRFM images showing the dynamics of the synaptic accumulation of IgG-BCRs from J558L cells expressing memory B1-8-IgG-BCR in contact with coverslip presenting 12 pN, 56 pN NP-TGT sensor, or control TGT (NC) molecule at the indicated time points. Scale bar is 1.5 μm. (H) Comparisons of averaged traces showing the dynamic accumulation of memory IgG-BCRs as demonstrated in (G) in a 13 min TIRFM imaging time course. Bars represent mean ±SEM. Data were from at least 20 cells over three independent experiments. (I–L) Statistical analyses of the synaptic accumulation of two types of chimeric BCRs and pSyk, Human mIgE heavy chain (I, J), or Human mIgM heavy chain (K, L) with mouse B1-8 variable region in human Ramos B cells encountering 12 pN, 43 pN, or 56 pN NP-TGT sensors. In all of these plots, bars represent mean ±SEM. Two-tailed t tests were performed for the statistical comparisons. Data were from at least 30 cells in each group of three independent experiments.
Figure 6—figure supplement 1
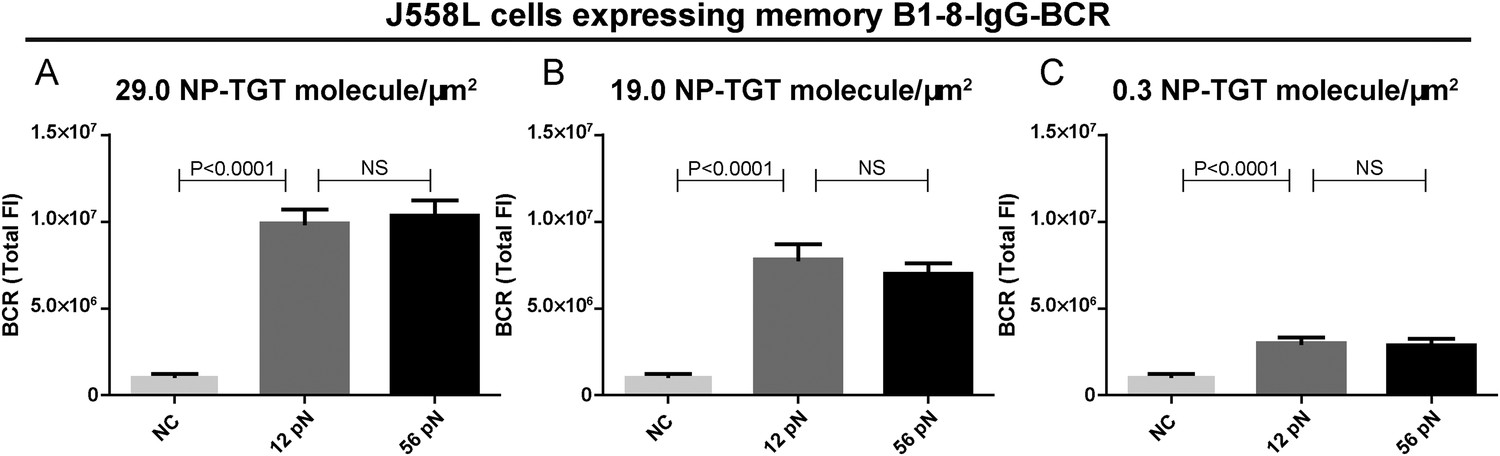
Quantification of the accumulation of IgG-BCR in recognition of NP-TGT sensors at different surface density.
(A–C) Quantification of the synaptic accumulation of IgG-BCRs in J558L cells expressing memory B1-8-IgG-BCR that were placed on coverslip coated with NP-TGT sensors at a density of 29.0 molecule/μm2 (A), 19.0 molecule/μm2 (B), and 0.3 molecule/μm2 (C). 12 pN NP-TGT, 56 pN NP-TGT, and 56 pN TGT molecule without NP conjugation (NC) were used in the experiment. Bars represent mean ±SEM. Two-tailed t tests were performed for the statistical comparisons. Data were from at least 30 cells over three independent experiments.
Figure 7
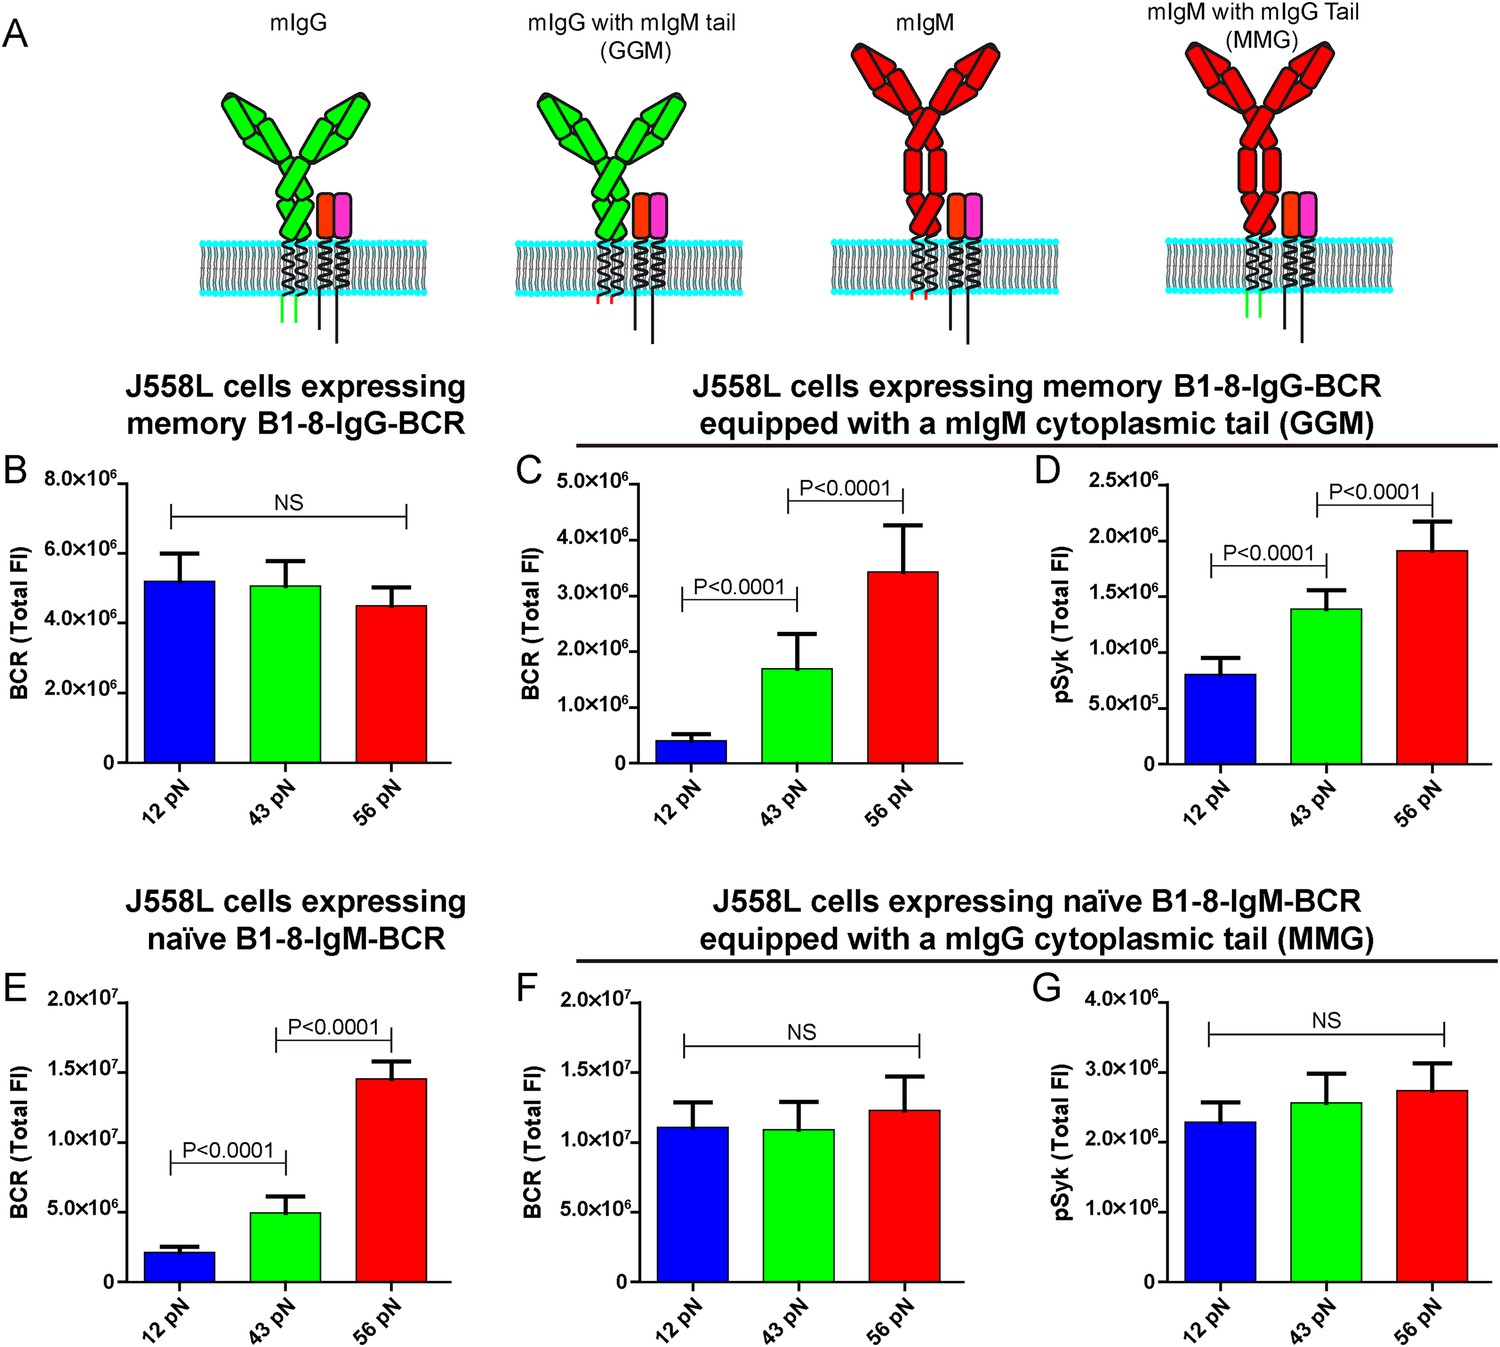
The lower mechanical force threshold of IgG-BCR activation is dependent on its cytoplasmic tail.
(A) Schematic illustration of the strategy of swapping the cytoplasmic tail of B1-8-IgG- or B1-8-IgM-BCRs. (B–G) Quantification of the synaptic accumulation of BCRs in J558L cells expressing memory B1-8-IgG-BCR (B), J558L cells expressing memory B1-8-IgG-BCR equipped with a mIgM cytoplasmic tail, termed GGM (C), J558L cells expressing naive B1-8-IgM-BCR (E) and J558L cells expressing naive B1-8-IgM-BCR equipped with a mIgG cytoplasmic tail, termed MMG (F). Also given are the synaptic accumulations of pSyk in GGM (D) and MMG cells (G). In all of these plots, bars represent mean ±SEM. Two-tailed t tests were performed for the statistical comparisons. Data were from at least 30 cells in each group of three independent experiments.
Author response image 1

Videos
Video 1
Time lapse images showing the dynamics of the synaptic accumulation of BCRs from J558L cells expressing naive B1-8-IgM-BCR in contact with coverslip presenting 56 pN NP-TGT or control TGT (NC) sensor.
Scale bar is 1.5 μm. The video was recorded with a 4-s time interval and is shown at 30 frames per second. Related to Figure 1C.
Video 2
Representative time lapse TIRFM images showing the dynamics of the synaptic accumulation of IgM-BCRs from J558L cells expressing naive B1-8-IgM-BCR in contact with coverslip presenting 12 pN, 43 pN, or 56 pN NP-TGT sensor.
Scale bar is 1.5 μm. The video was recorded with a 4-s time interval and is shown at 30 frames per second. Related to Figure 2C.
Video 3
Time lapse images showing the dynamics of the synaptic accumulation of IgG-BCRs from J558L cells expressing memory B1-8-IgG-BCR in contact with coverslip presenting 12 pN, 56 pN NP-TGT or control TGT (NC) sensor at the indicated time points.
Scale bar is 1.5 μm. The video was recorded with a 4-s time interval and is shown at 30 frames per second. Related to Figure 6G.
Additional files
-
Source code 1
Matlab supported 2D Gaussian fitting code.
- https://doi.org/10.7554/eLife.06925.018
Download links
A two-part list of links to download the article, or parts of the article, in various formats.
Downloads (link to download the article as PDF)
Open citations (links to open the citations from this article in various online reference manager services)
Cite this article (links to download the citations from this article in formats compatible with various reference manager tools)
The activation of IgM- or isotype-switched IgG- and IgE-BCR exhibits distinct mechanical force sensitivity and threshold
eLife 4:e06925.
https://doi.org/10.7554/eLife.06925


