Transgenic shRNA pigs reduce susceptibility to foot and mouth disease virus infection
- Shihezi University, China
- Xinjiang Academy of Animal Science, China
- Jilin University, China
Figures
Figure 1

Design and screening of shRNA expression vector.
(A) Schematic diagram of shRNA expression vector (pXL-EGFP-NEO) used. This vector includes a mouse H1 RNase promoter driving ubiquitous expression of shRNA and a cytomegalovirus-immediate early (CMV) promoter driving GFP and neomycin fusion expression. The arrows denote the PCR primers spanning H1 promoter, shRNA and GFP elements used to identify transgene integration in cloned pigs. (B) Relative expression of viral RNA in shRNA-transfected BHK cells. Data are means of three replicates ±SD.
Figure 2 with 1 supplement
Analysis of shRNA transgene in cloned pigs.
(A) PCR for detecting shRNA expression cassette. PCR products spanned H1 promoter, shRNA and GFP cassette. P: plasmid as positive control. Non-TG: non-TG pig as negative control. 11, 19, 24, 45, 49, 69, 78 and 101: cloned pigs. (B) EGFP fluorescence of transgenic pigs. (C) The copy numbers of transgene were determined by real-time PCR. (D) Analysis of siRNA expression in fibroblast cells of all transgenic pigs. (E) Analysis of siRNA expression in various tissues of TG 69 and 101. Data are presented as means of three replicates ±SD.
Figure 2—figure supplement 1
Pictures of transgenic pigs and EGFP expression in the fibroblast cells.
(A) EGFP of transgenic pigs (red arrows) under natural light. (B) Expression of EGFP in ear fibroblasts isolated from transgenic pigs.
Figure 3
shRNA transgene resistance to FMDV infection in fibroblast cells of transgenic pigs.
(A) Relative expression of viral RNA in fibroblast cells after FMDV infection. Data are presented as means ±SD. (B) Fibroblast cells were observed for development of cytopathogenic effect by bright-field microscopy at 12, 24 and 36 hr post-infection.
Figure 4 with 1 supplement
Transgenic shRNA pigs resisted FMDV infection.
(A) Clinical sign of TG and non-TG pigs challenged with O serotypes of FMDV. Body temperature was detected every day after infection. Body temperature 38–39.5°C (no fever); body temperature up to 39.5–40°C (mild fever); body temperature over 40°C (high fever). Lesion score based on the appearance of vesicles on the feet and nose (see ‘Materials and methods’). None of vesicles on the feet and nose (−). (B) Relative expression of viral RNA in serum of the infected animals. Data are presented as means ±SD. (C) Relative expression of viral RNA in various tissues of the infected animals. Data are presented as means ±SD. (D) HE staining of tissue sections from non-TG and TG pigs. HE staining revealed that there was hepatic multifocal necrosis in non-TG pigs and interstitial pneumonia and severe congestion in the lung of non-TG pigs.
Figure 4—figure supplement 1
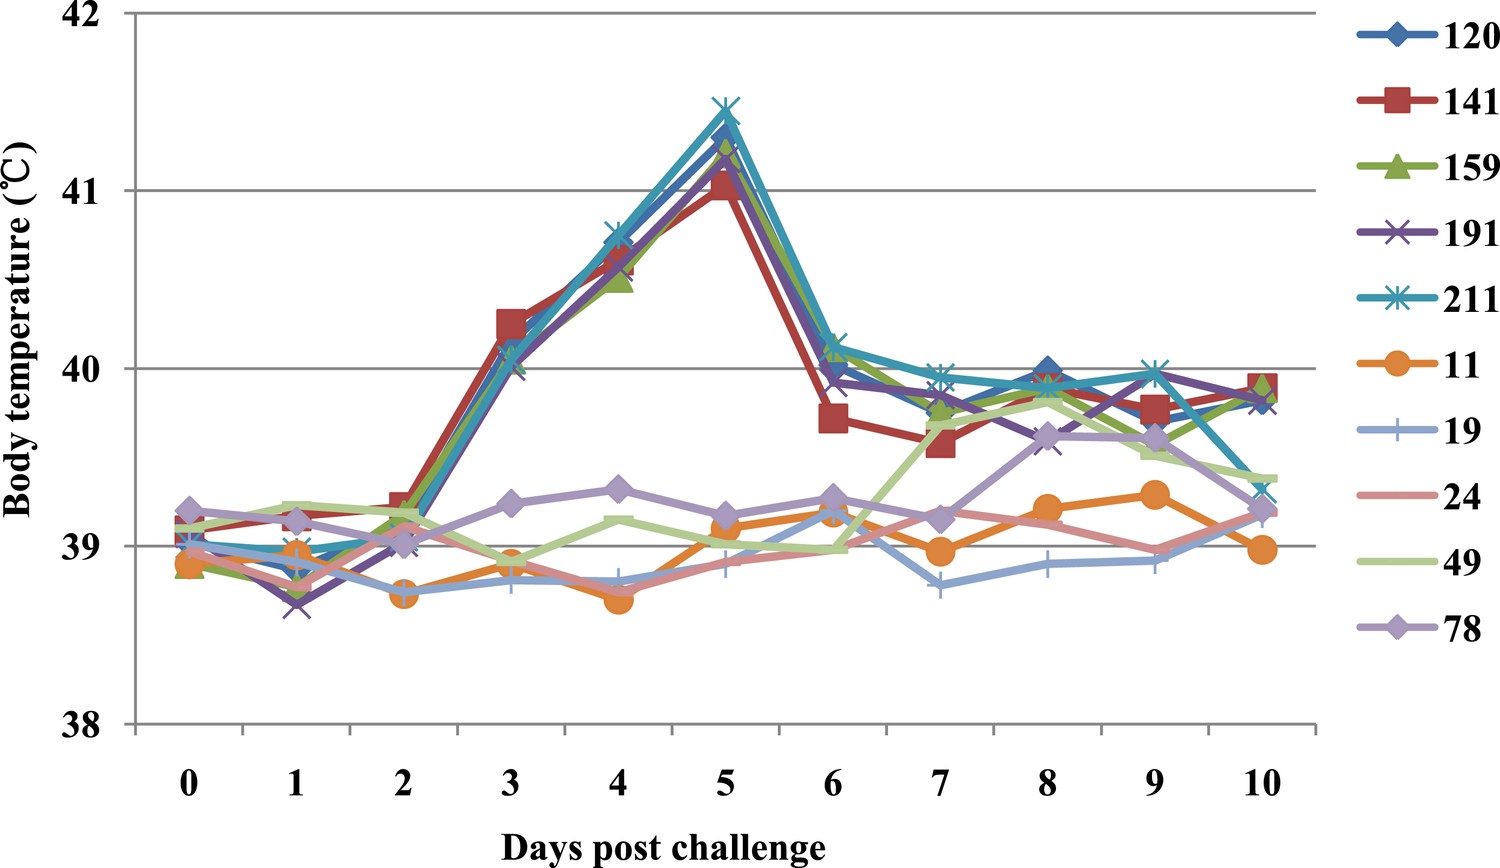
Body temperature curve of all infected pigs.
The body temperatures of non-TG (120, 141, 159, 191 and 211) and TG pigs (11, 19, 24, 49 and 78) were measured at 24 hr intervals before FMDV challenge until the end of the experiment.
Additional files
-
Supplementary file 1
Target sequences of shRNA used in this study.
- https://doi.org/10.7554/eLife.06951.009
Download links
A two-part list of links to download the article, or parts of the article, in various formats.
Downloads (link to download the article as PDF)
Open citations (links to open the citations from this article in various online reference manager services)
Cite this article (links to download the citations from this article in formats compatible with various reference manager tools)
Transgenic shRNA pigs reduce susceptibility to foot and mouth disease virus infection
eLife 4:e06951.
https://doi.org/10.7554/eLife.06951


