The ER Stress Surveillance (ERSU) pathway regulates daughter cell ER protein aggregate inheritance
- Univeristy of California, San Diego, United States
Figures
Figure 1
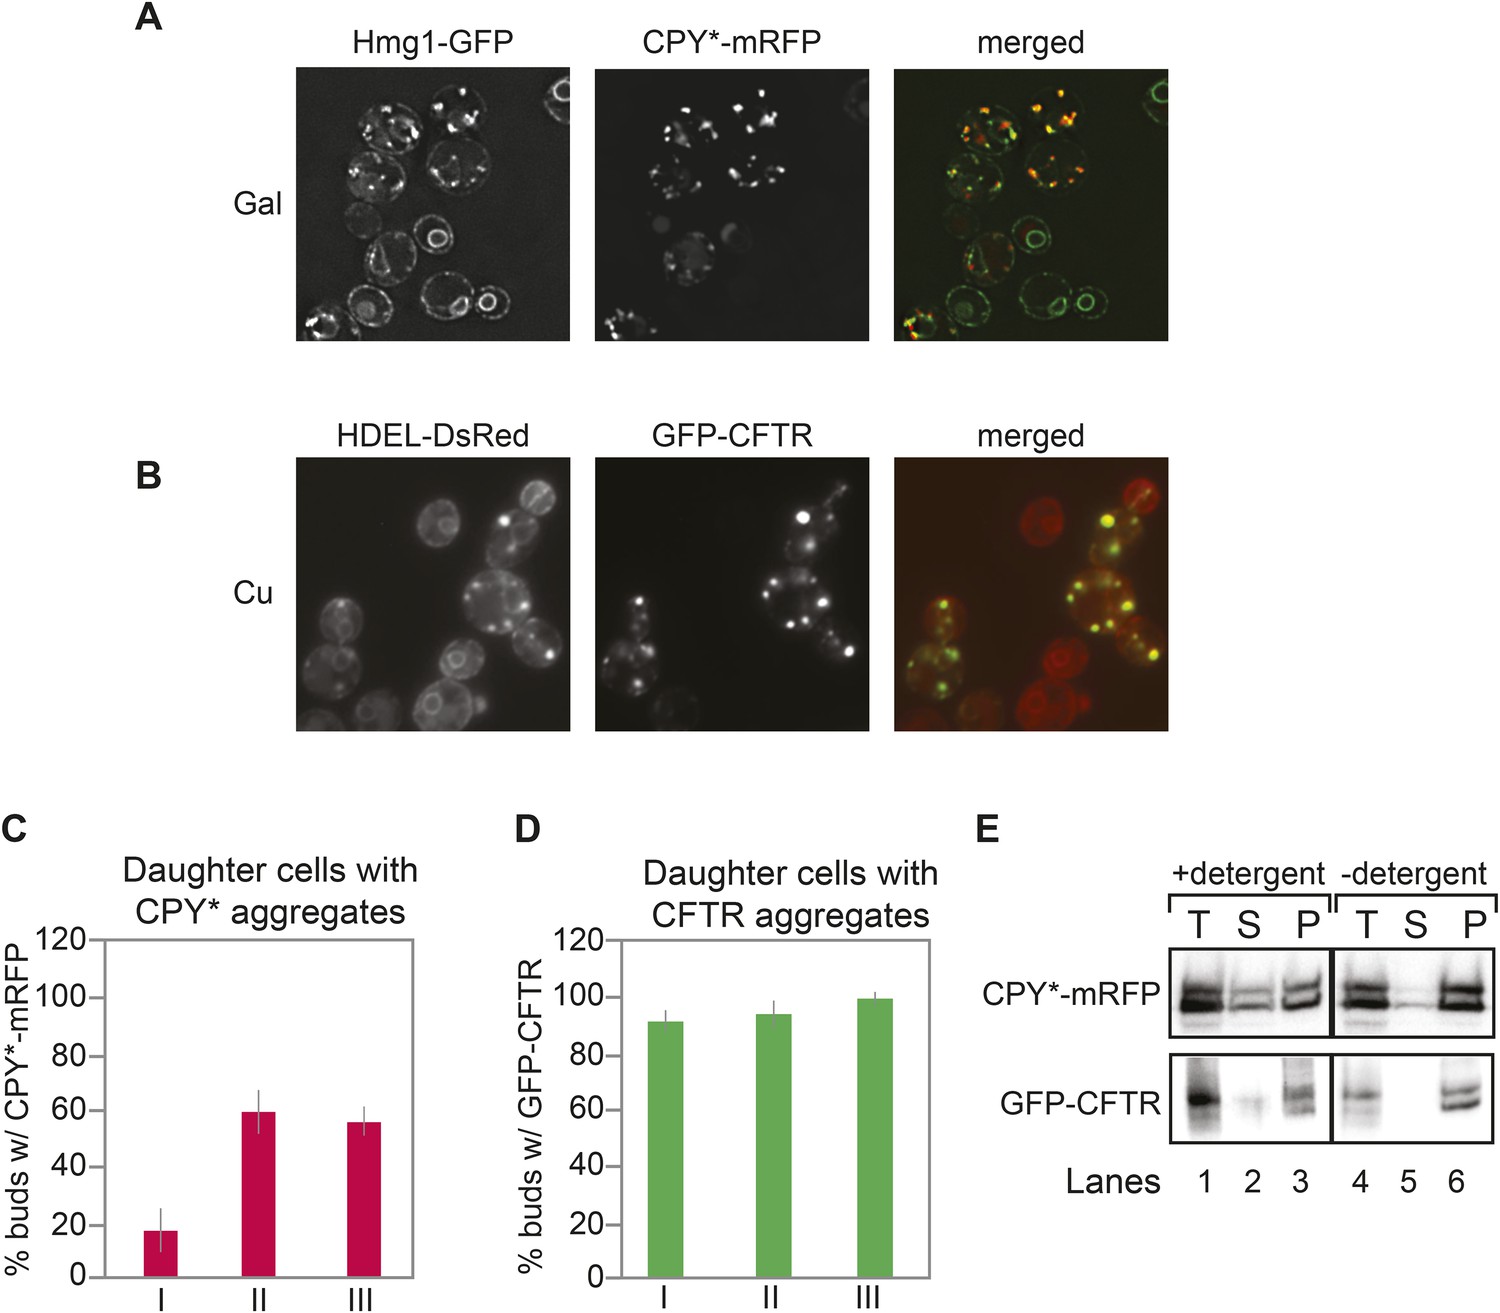
Inheritance of CPY* and CFTR aggregates by daughter cells.
(A) Wild-type (WT) cells expressing galactose (Gal)-inducible CPY*-mRFP and the endoplasmic reticulum (ER) marker Hmg1-GFP were grown in 2% (w/v) Gal for 2 hr and then visualized by microscopy. Note that some Hmg1-GFP foci co-localized with CPY*-mRFP foci. (B) Cells expressing copper-inducible GFP-CFTR and the ER marker DsRed-HDEL were grown in copper-containing medium for 2 hr and then visualized. Note that DsRed-HDEL also co-localized with Cystic Fibrosis Transmembrane conductance Regulator (CFTR) foci. (C and D) Quantification of daughter cells containing CPY*-mRFP (C) or GFP-CFTR (D) foci at different stages of the cell cycle (small-budded cells, less than 2-µm length [class I]; medium-budded cells, greater than 2-µm length [class II], and large-budded cells containing nuclear ER [class III]). Error bars represent the standard deviation (SD) and were generated from at least three independent experiments with n > 100 cells. (E) CPY*-mRFP and GFP-CFTR foci are detergent insoluble and are present in the pellet fraction after detergent extraction. (T) Total, (S) supernatant, (P) pellet. These tests were previously utilized to characterize protein aggregates in cells (Alberti et al., 2010) and thus, we termed CPY*-mRFP and GFP-CFTR foci as aggregates throughout our study.
Figure 2 with 3 supplements
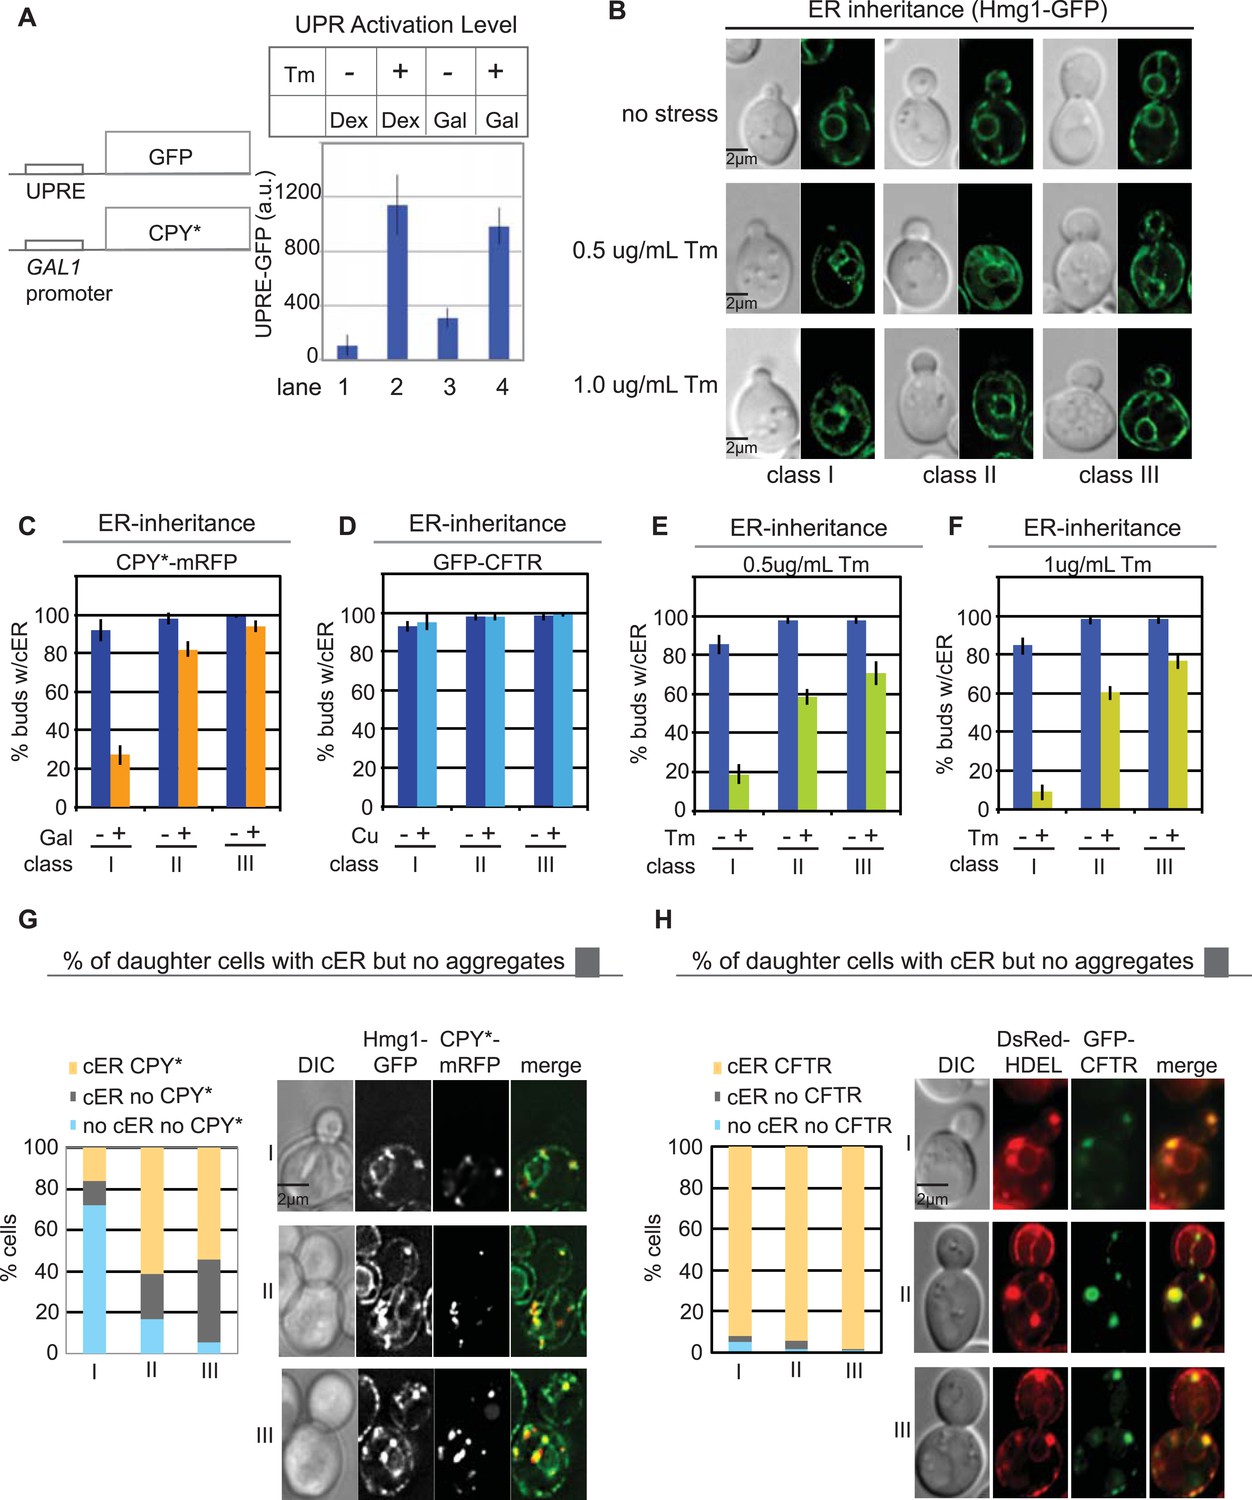
Differential inheritance of CPY* and CFTR aggregates and cER by daughter cells.
(A) CPY*-mRFP expression activates the unfolded protein response (UPR) pathway. WT cells expressing CPY*-mRFP and the UPR reporter UPRE-GFP were incubated alone or with 1.0 μg/ml Tm, and GFP expression was quantified in individual cells. N > 100 cells per experiment; error bars (SD) were generated from at least three independent experiments. Dex: dextrose control medium, Gal; galactose-containing medium. (B) Quantitation of cortical ER (cER) in the buds of unstressed cells or cells treated with 0.5 or 1.0 μg/ml Tm for 3 hr cER inheritance was grouped by bud size: small-budded cells (class I), medium-budded cells (class II), and large-budded cells containing nuclear ER (class III). (C) CPY*-mRFP expression for 2 hr blocks cER inheritance. (D) GFP-CFTR expression for 2 hr in copper-containing media does not block cER inheritance. (E and F) Exposure to mild ER stress with 0.5 μg/ml Tm (E) blocks cER inheritance (induces the ER Stress Surveillance (ERSU) pathway) to a similar extent as does 1.0 μg/ml Tm (F). (G) Distribution (%) of cells at different stages of the cell cycle in which the daughter cells contain both cER and CPY*-mRFP aggregates (yellow), cER but not CPY*-mRFP aggregates (gray), and neither cER nor CPY*-mRFP aggregates (pale blue). Panel shows representative images of the most abundant cell types with CPY*-mRFP and Hmg1-GFP. (H) Same as G except that cells expressed GFP-CFTR and DsRed-HDEL. n > 100 cells were counted per experiment, repeated at least 3 times to generate error bars representing SD.
Figure 2—figure supplement 1
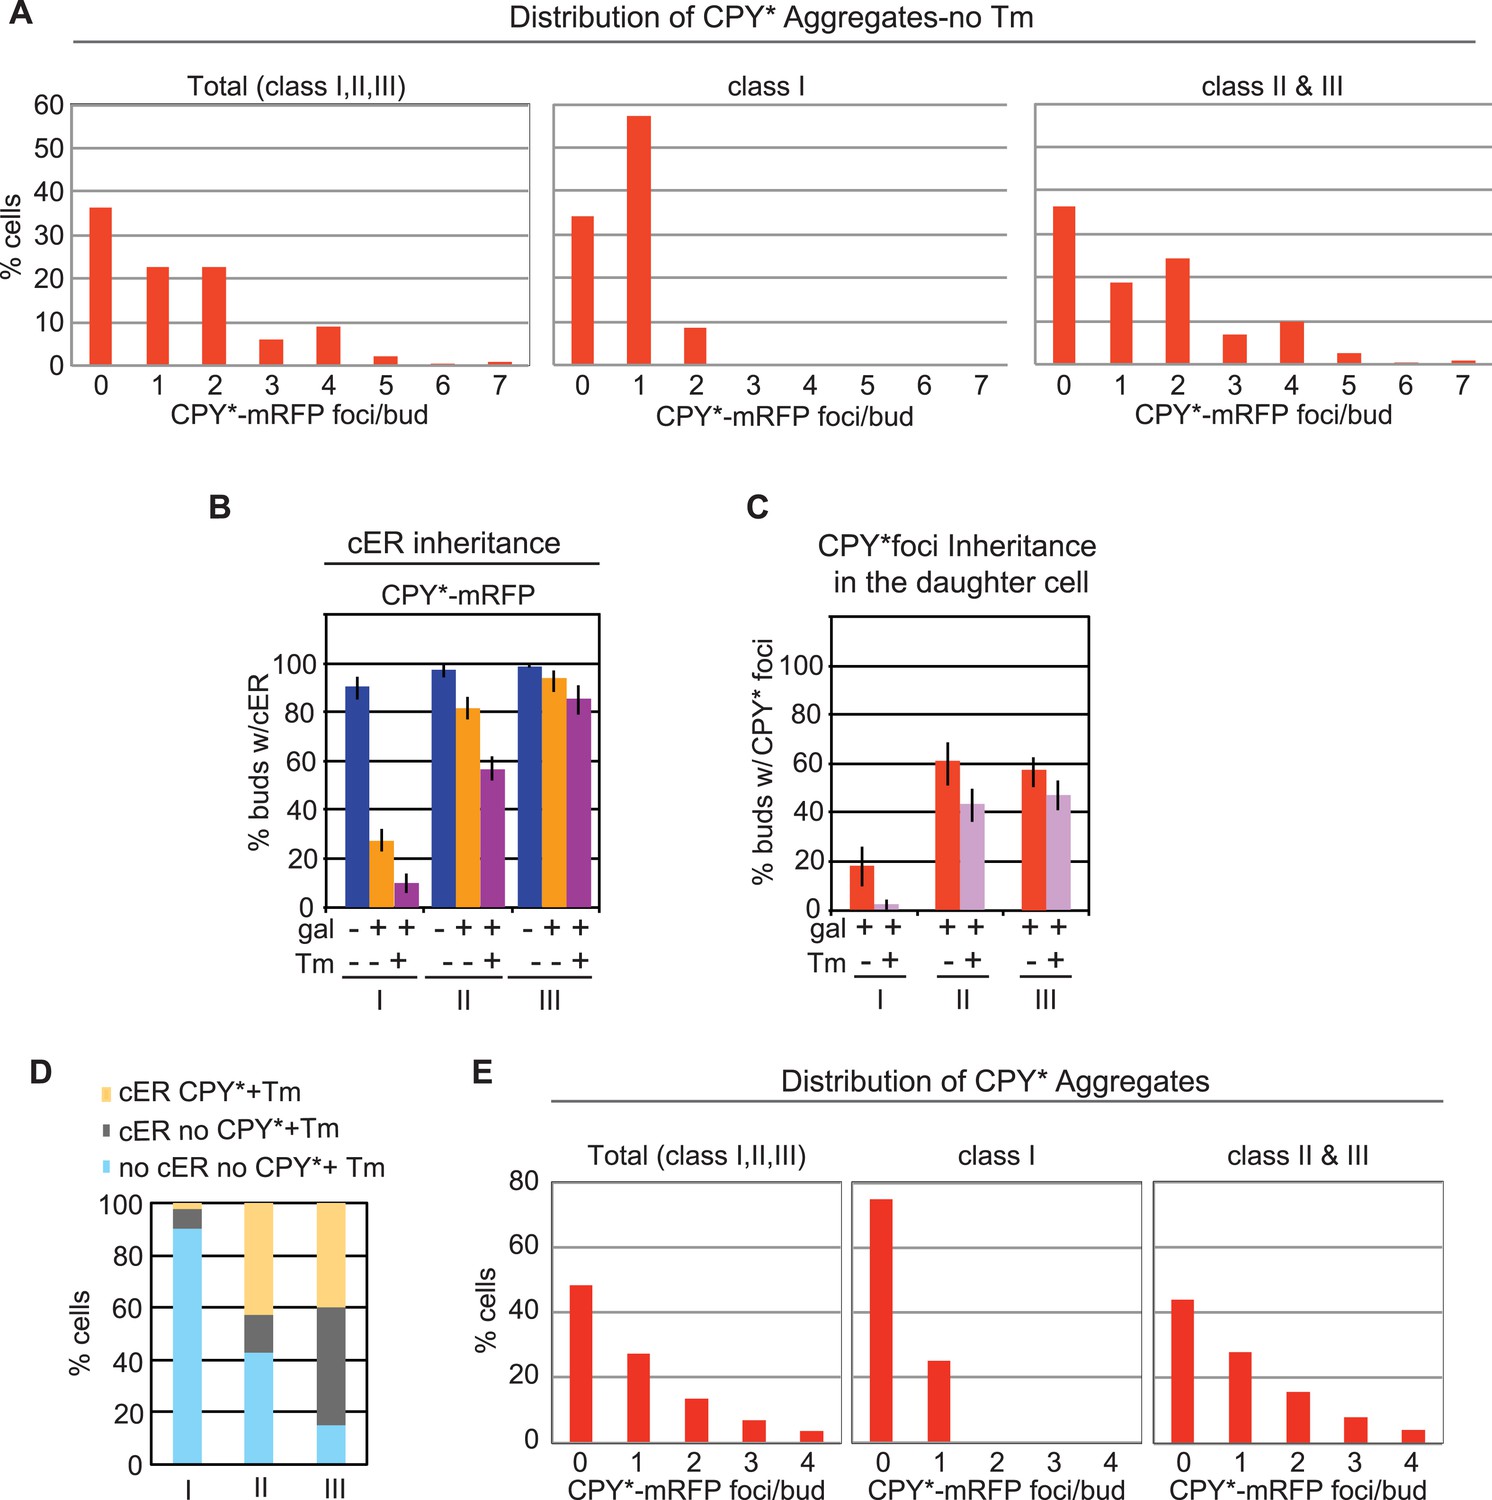
Inheritance of the ER and CPY* aggregates at different stages of the cell cycle.
(A) Distribution of CPY*-mRFP aggregates per bud in all (Total), class I, and class II + III, and unstressed cells (without Tm). (B) cER inheritance by different classes of WT cells expressing CPY*-mRFP and left untreated or subjected to additional ER stress with Tm (1 μg/ml, 2 hr). (C) Percentage of daughter cells containing CPY*-mRFP aggregates following incubation with or without Tm. (D) Percentage of daughter cells containing cER and CPY*-mRFP aggregates (yellow), cER but no CPY*-mRFP aggregates (gray), and neither cER nor CPY*-mRFP aggregates (blue) for each class of cells. (E) Distribution of CPY*-mRFP aggregates per bud in all (Total), class I, and class II + III Tm-treated cells.
Figure 2—figure supplement 2
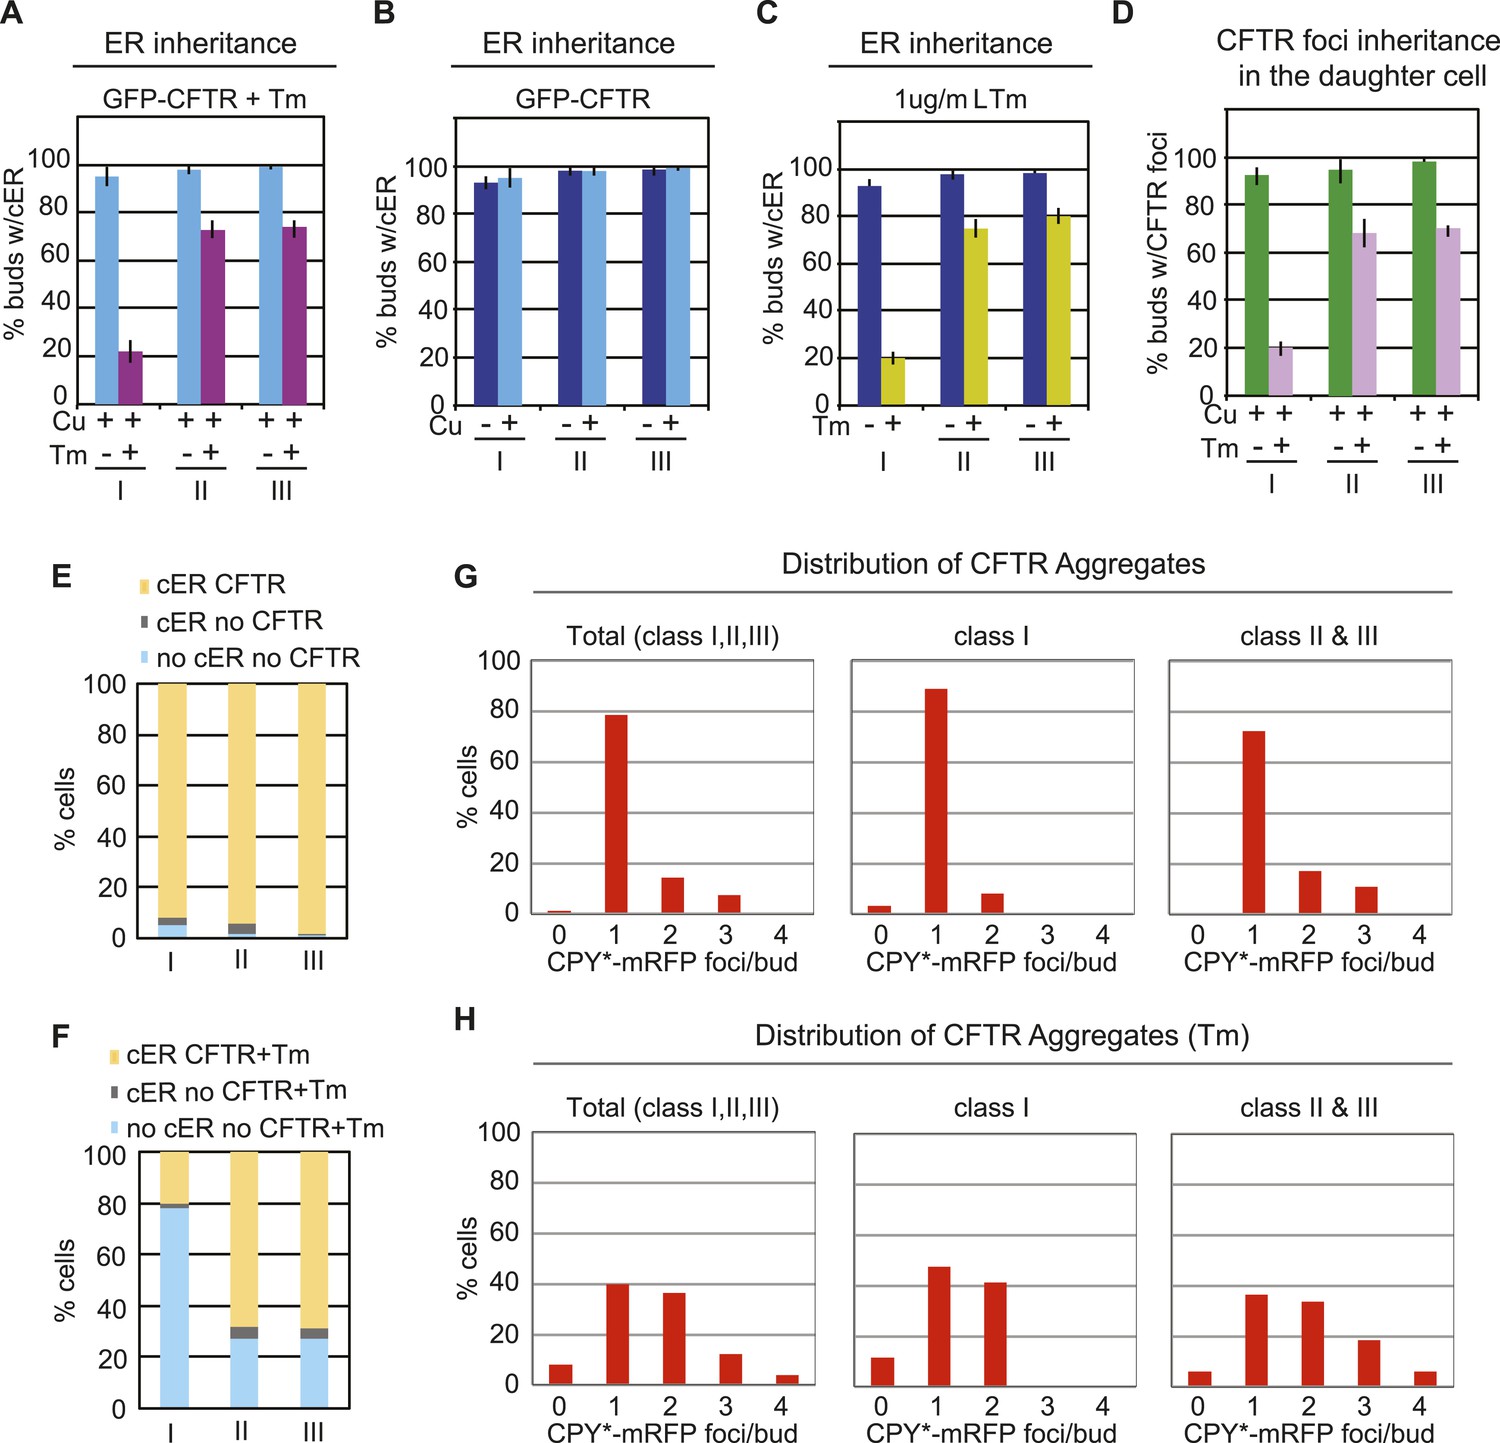
Inheritance of cER and CFTR aggregates at different stages of the cell cycle.
(A) cER inheritance by different classes of WT GFP-CFTR-expressing cells treated without or with Tm (1 μg/ml, 2 hr). GFP-CFTR expression was induced by incubation in copper-containing medium (Cu). Graphs (B) and (C) are the same as those in Figure 2D,F but are shown again for comparison. (D) Percentage of daughter cells containing GFP-CFTR aggregates following incubation with or without Tm. (E and F) Percentage of daughter cells containing cER and GFP-CFTR aggregates (yellow), cER but no GFP-CFTR aggregates (gray), and neither cER nor GFP-CFTR aggregates (blue) for each class of cells. Cells were untreated (E) or treated with 1 μg/ml Tm (F). (E) The graph shown is the same as Figure 2H and is presented for comparison. (G and H) Distribution of GFP-CFTR aggregates per bud in all (Total), class I, and class II + III cells untreated (G) or treated with Tm (H).
Figure 2—figure supplement 3
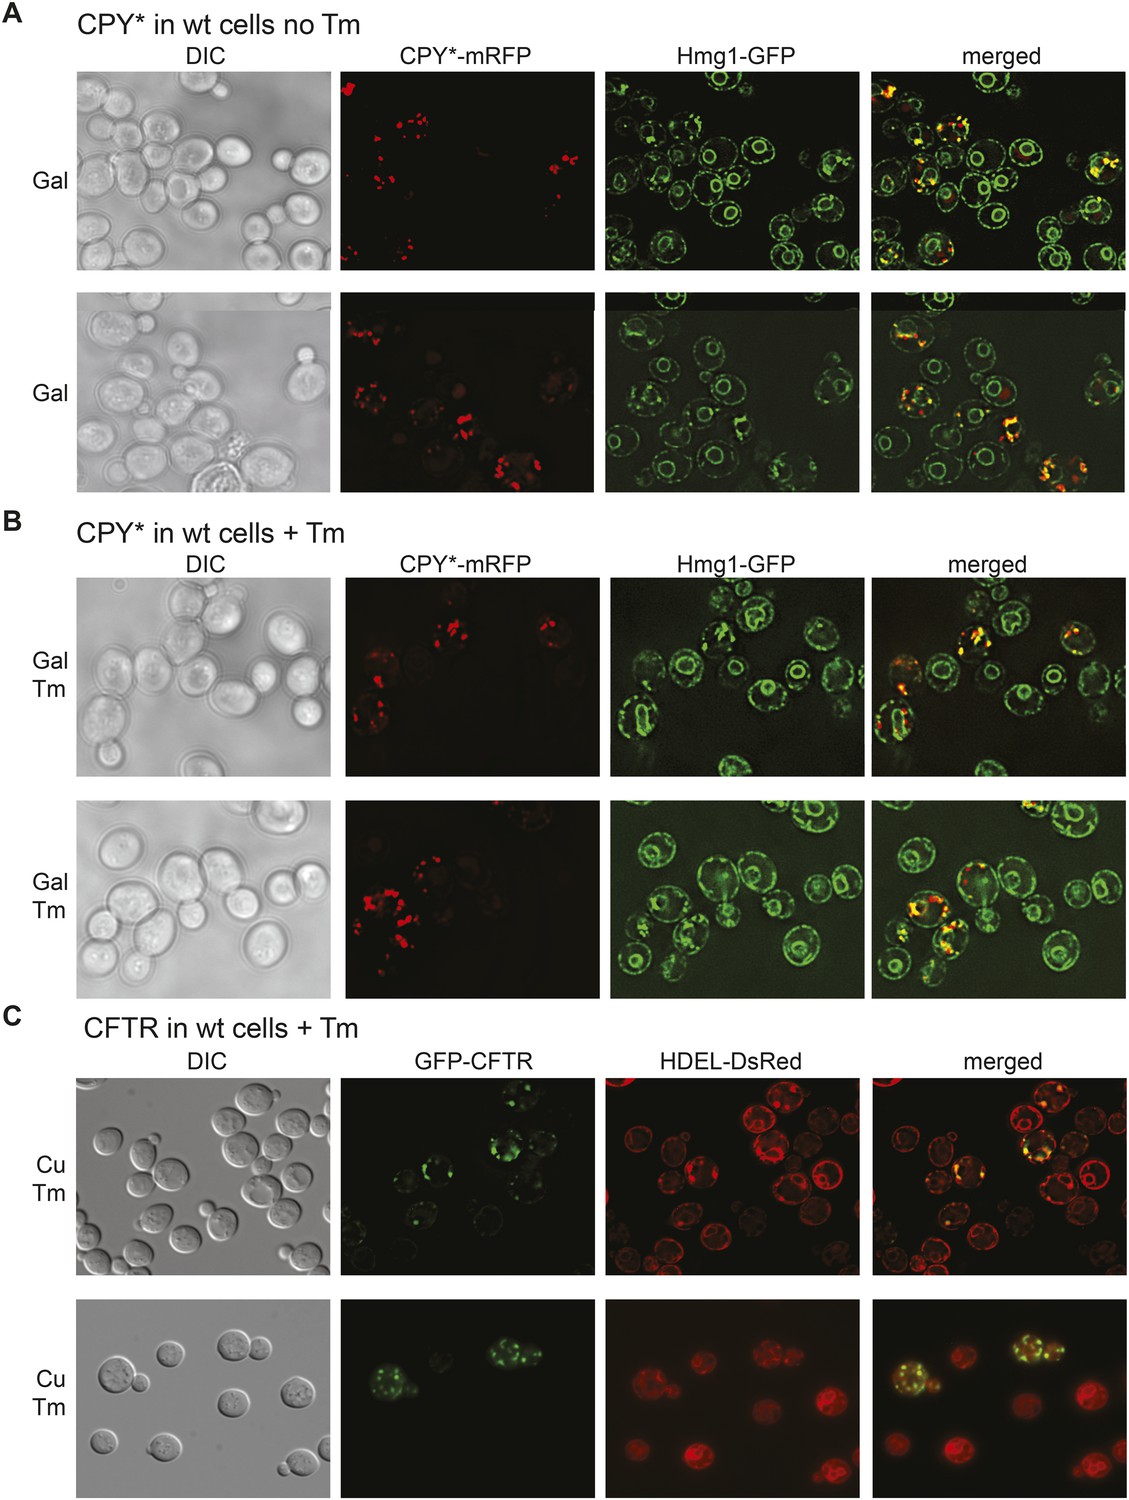
Colocalization of cER and CPY* or CFTR aggregates.
(A) Two representative fields of cells expressing the ER marker Hmg1-GFP and treated with galactose (Gal) for 2 hr to induce expression of CPY*-mRFP. (B) Representative field of Hmg1-GFP-expressing cells treated with galactose (Gal) and Tm for 2 hr to induce expression of CPY*-mRFP. (C) Representative field of cells expressing the ER marker DsRed-HDEL and treated with 100 μM copper (Cu) and Tm for 2 hr to induce expression of GFP-CFTR.
Figure 3 with 1 supplement

Inheritance of ER protein aggregates is ERSU dependent.
(A) cER inheritance was not blocked in slt2Δ cells upon ER stress induction with CPY*-mRFP for 2 hr. (Compare to cER inheritance in CPY*-mRFP expressed WT cells [Figure 2C]). (B) GFP-CFTR expression for 2 hr has no impact on cER inheritance in slt2Δ cells. (C) GFP-CFTR expression for 2 hr in the presence of 1 µg/ml Tm does not block cER inheritance in slt2Δ cells. (D) Distributions (%) of slt2Δ cells that contain cER and CPY*-mRFP aggregates in daughter cells (yellow), cER but not CPY* aggregates (gray), and no cER and no aggregates (light blue) in different stages of cell cycle. (E and F) Distributions (%) of slt2Δ cells that contain cER and GFP-CFTR aggregates in daughter cells (yellow), cER but not GFP-CFTR aggregates (gray), and no cER and no aggregates (light blue) in different stages of cell cycle treated with (F) or without (E) Tm (1.0 µg/ml). (G) Representative images of slt2Δ cells in class I, II, and III with CPY*-mRFP and Hmg1-GFP to mark the ER. (H) Representative images of slt2Δ cells in class I, II, and III with GFP-CFTR and DsRed-HDEL ER marker.
Figure 3—figure supplement 1
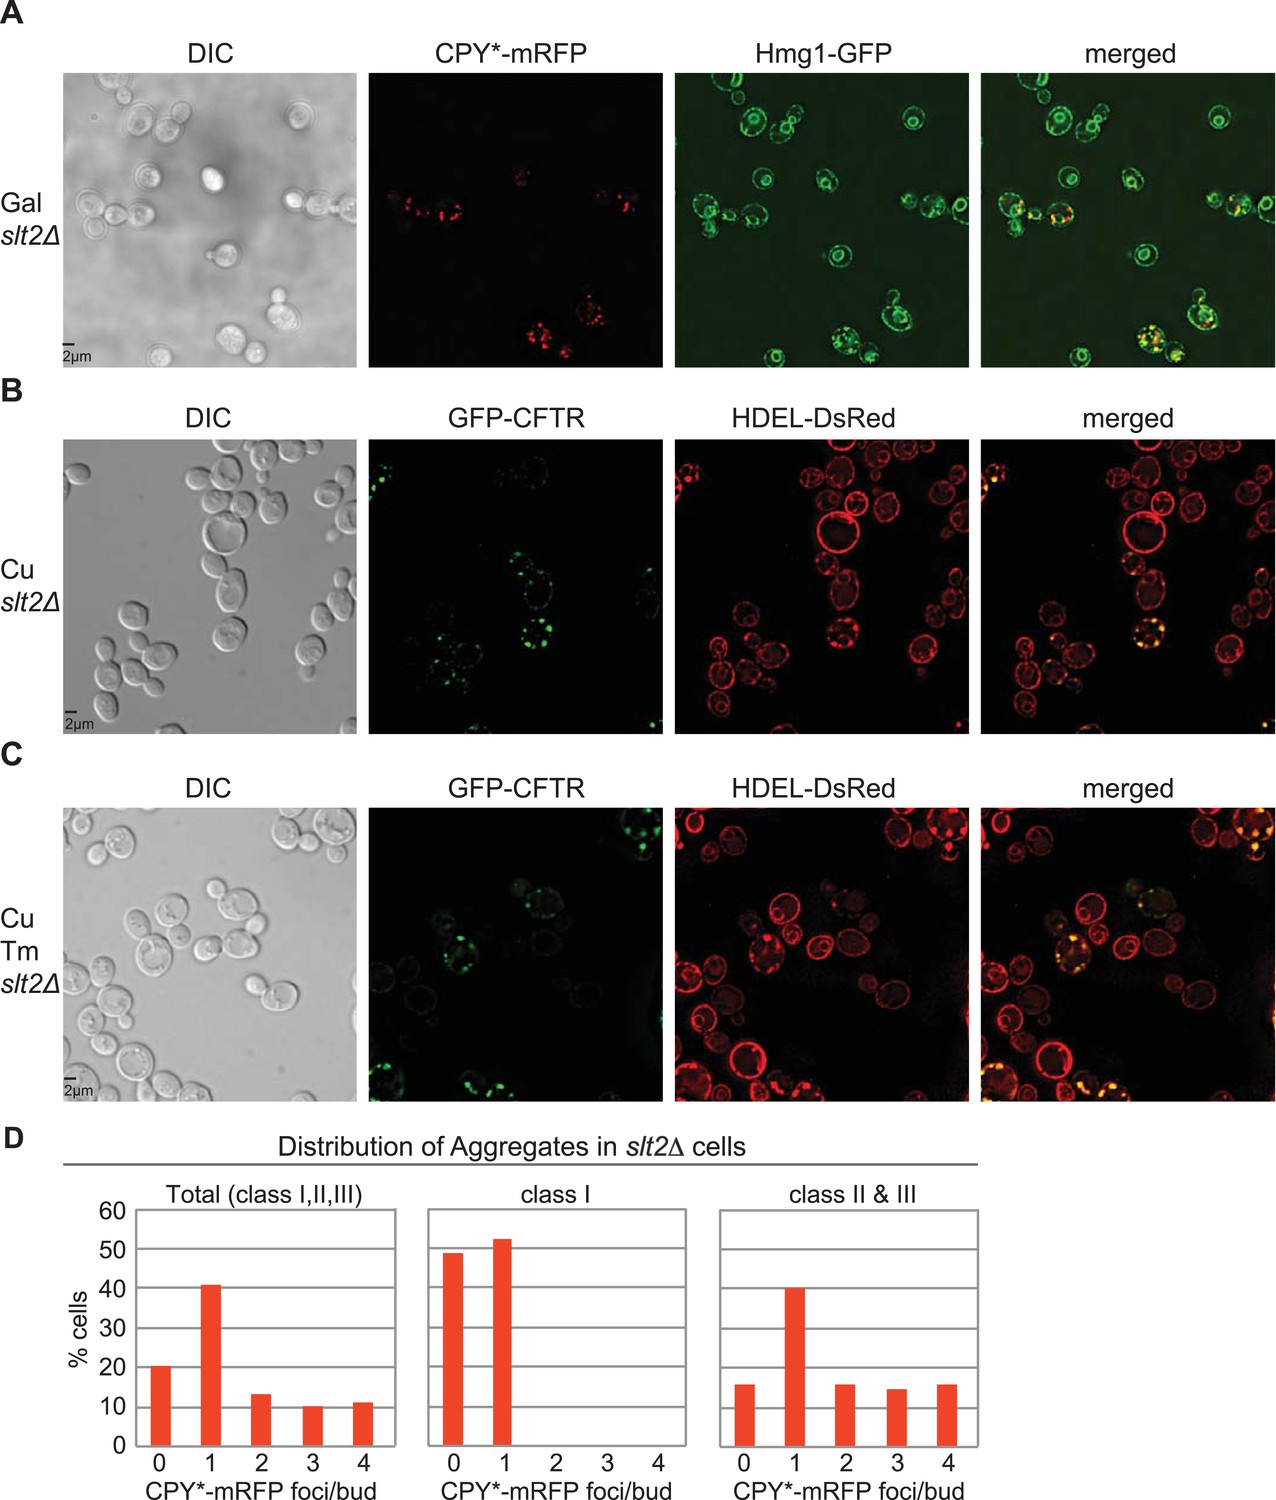
Colocalization of ER and CPY* or CFTR in slt2Δ cells.
(A) Representative field of Hmg1-GFP-expressing slt2Δ cells treated with galactose (Gal) for 2 hr to induce expression of CPY*-mRFP. (B) Representative field of DsRed-HDEL-expressing cells treated with 100 μM copper (Cu) for 2 hr to induce expression of GFP-CFTR. (C) Representative field of DsRed-HDEL-expressing cells treated with 100 μM copper (Cu) and Tm for 2 hr to induce expression of GFP-CFTR. Note that slt2Δ cells do not exhibit a block in ER inheritance under ER stress. (D) Distribution of CPY*-mRFP aggregates per bud in all (Total), class I, and class II + III cells.
Figure 4
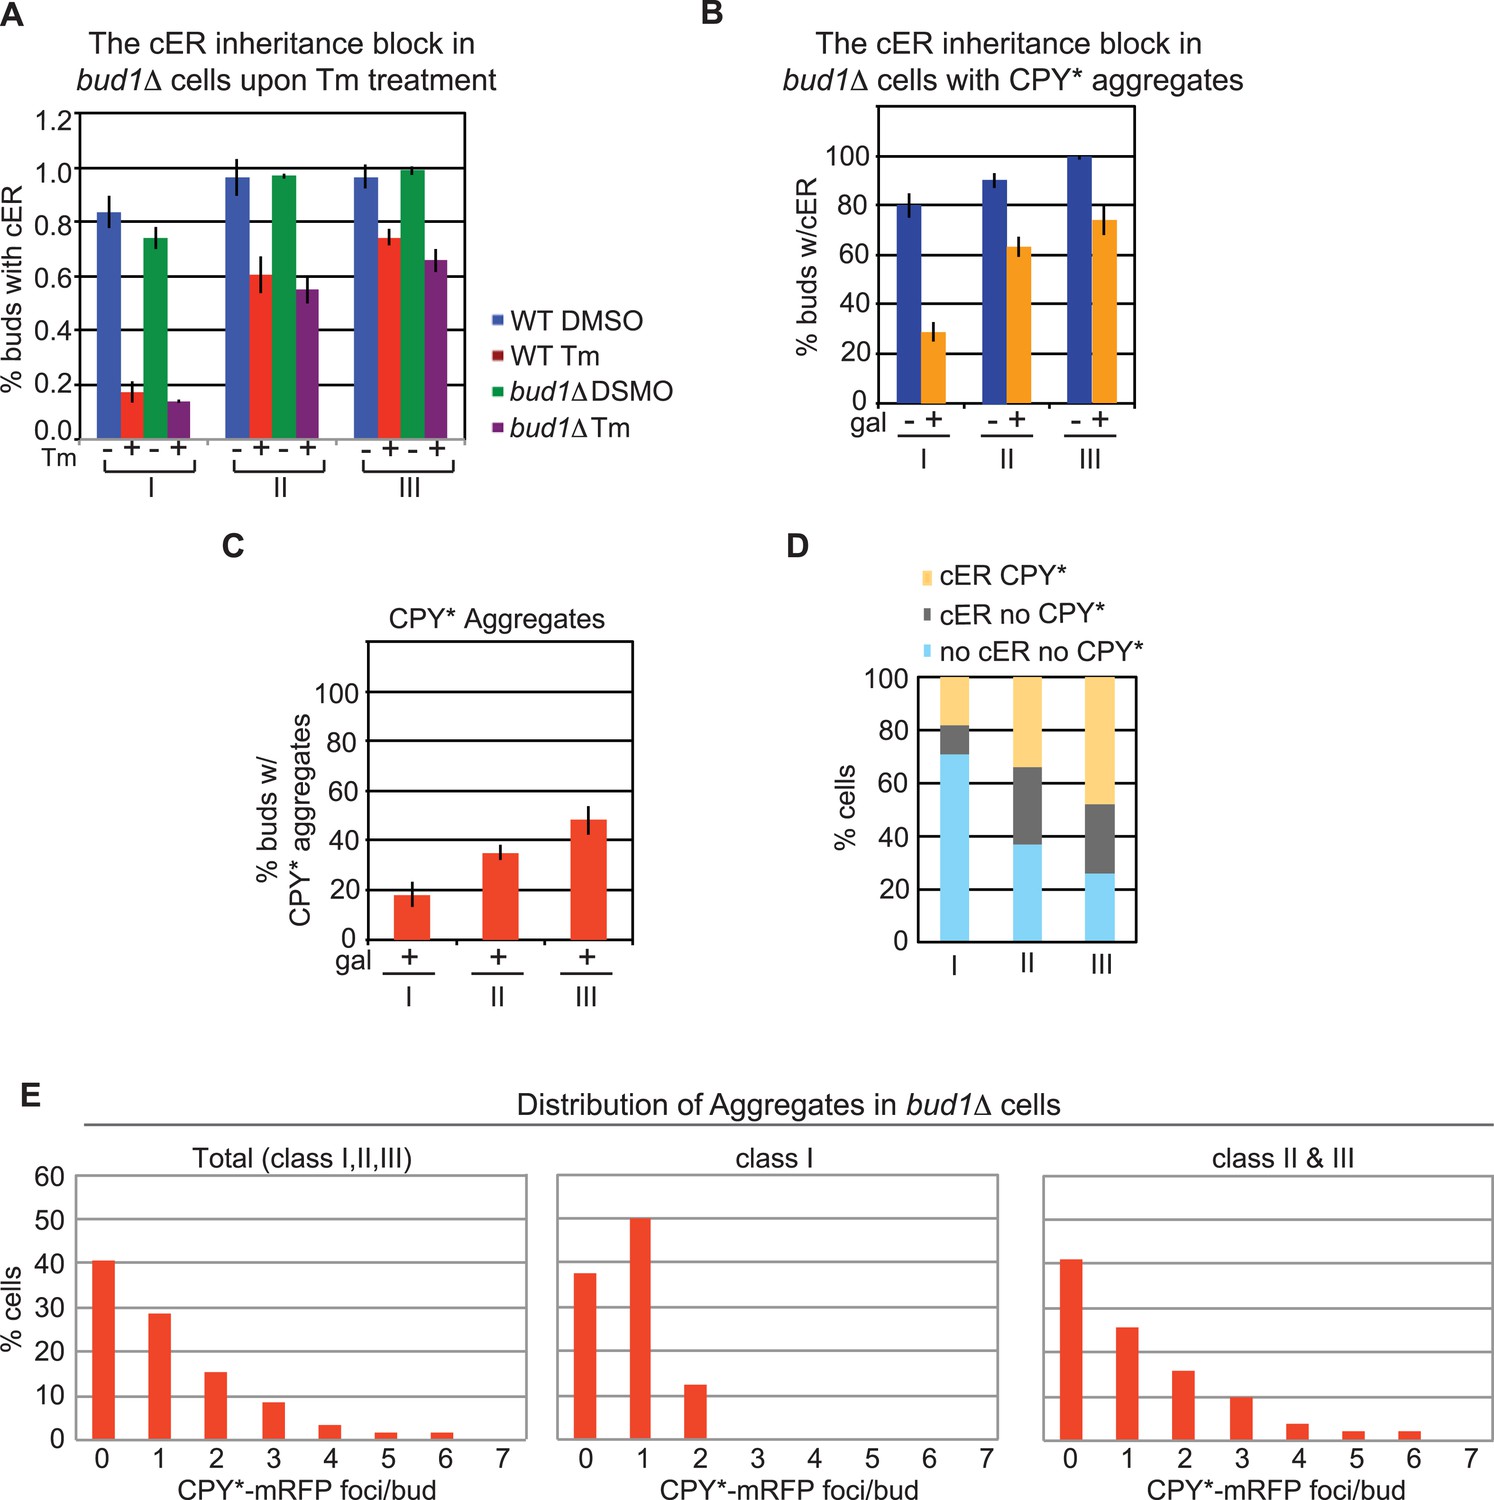
BUD1 deletion has no effect on inheritance of the ER and CPY* aggregates.
(A) cER inheritance is blocked to similar extents in WT and bud1Δ cells upon ER stress induction (1 μg/ml Tm for 3 hr). (B) bud1Δ cells display a normal block in ER inheritance upon exposure to ER stress induced by CPY*-mRFP expression for 2 hr. (C) Percentage of bud1Δ daughter cells containing CPY*-mRFP aggregates in class I, II, and III cells. (D) Distribution (%) of cells at different stages of the cell cycle in which daughter cells contain cER and CPY*-mRFP aggregates (yellow), cER but not CPY*-mRFP aggregates (gray), and neither cER nor CPY*-mRFP aggregates (light blue). (E) Distribution of CPY*-mRFP aggregates per bud in all, class I, and class II + III bud1Δ cells.
Figure 5 with 5 supplements
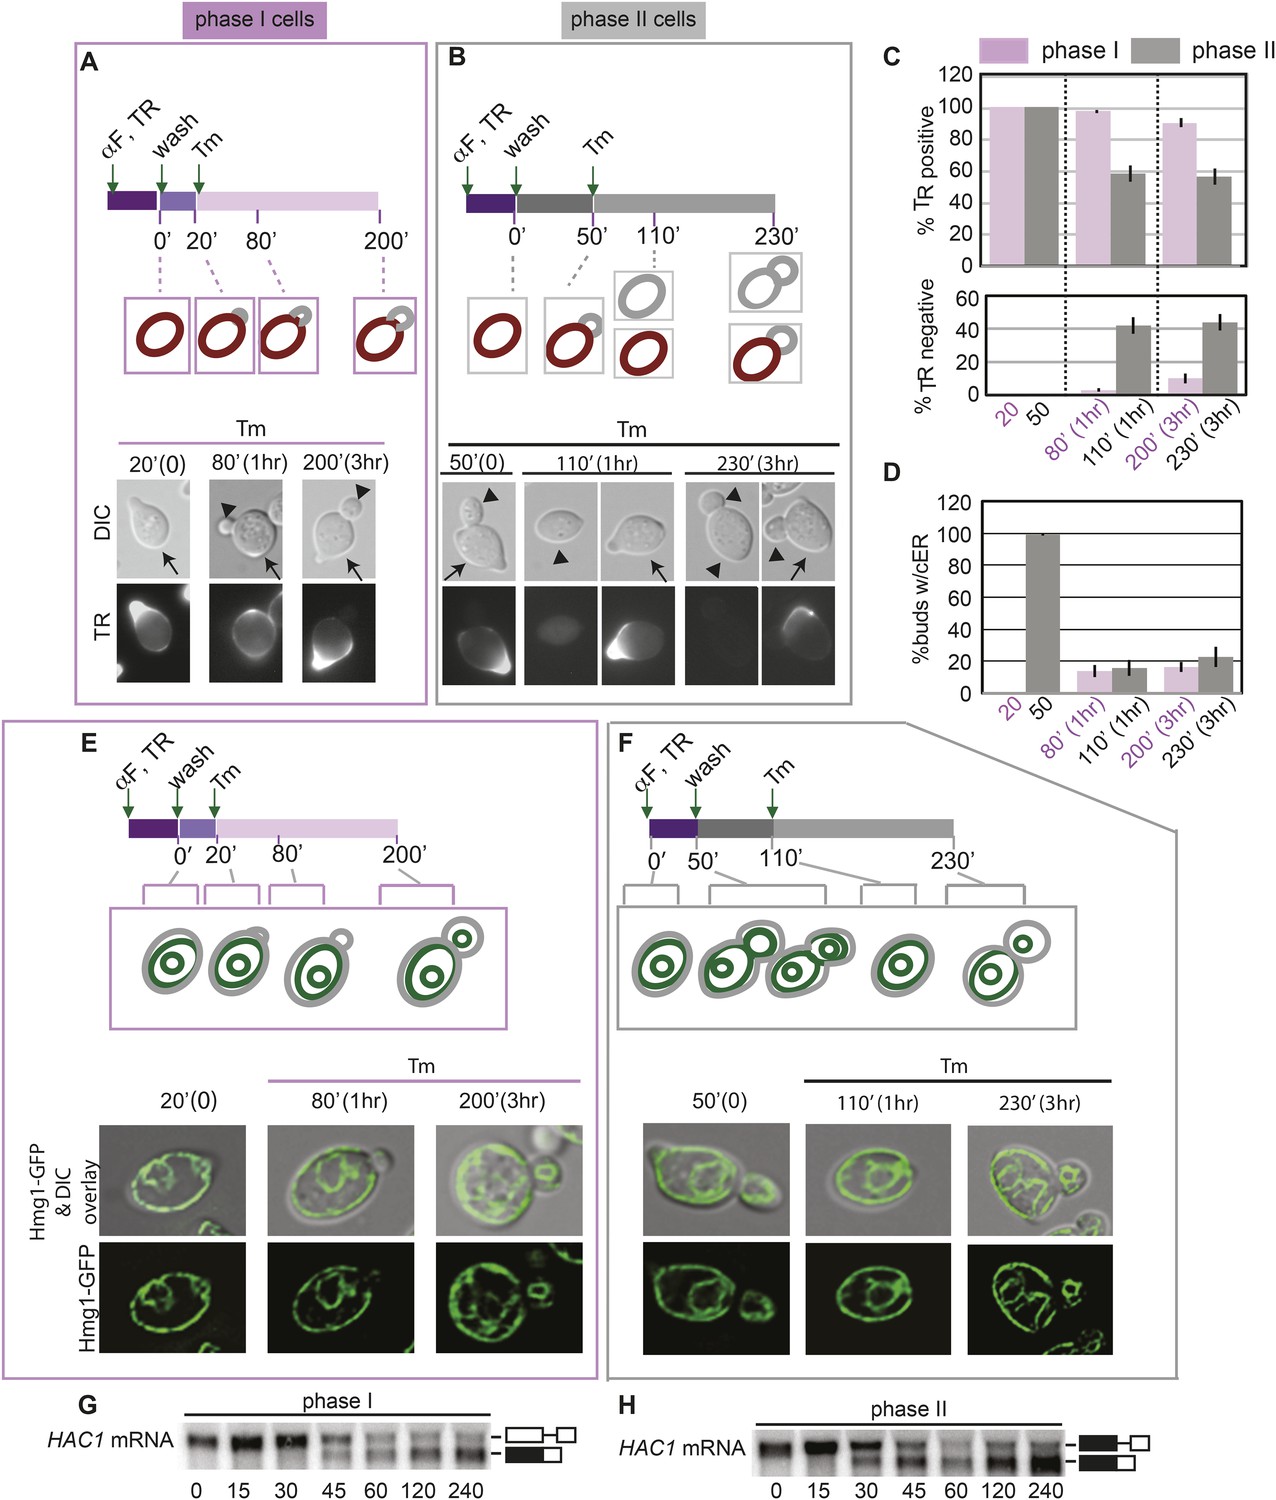
Activation of the ERSU pathway varies with the cell cycle stage.
(A) ER stress was induced by treating synchronized WT cells (phase I: 20 min after α-factor release) with 1 μg/ml Tm. Cells were incubated with Texas Red (TR)-ConA during the α-factor treatment and then washed before exposure to Tm. Mother cells (TR-positive, arrows) can thus be distinguished from daughter cells emerging after induction of ER stress (TR-negative, arrowheads), as shown in the upper schematic. Cells were analyzed by DIC and fluorescence microscopy at the indicated times prior to and after addition of Tm. (B) As described for A, except that Tm was used to induce ER stress in phase II cells (50 min after α-factor release). Many cells underwent cytokinesis, as evident from the presence of unbudded TR-positive and TR-negative cells. (C) Quantification of TR-positive and TR-negative phase I (purple) and phase II (gray) cells at the time points indicated. (D) Quantification of cER inheritance by the daughters of phase I (E) and phase II (F) cells upon Tm treatment for the indicated times. (E and F) Hmg1-GFP-expressing phase I (E) and phase II (F) cells were treated as shown in A and B, and cER inheritance was evaluated at the indicated times. (G and H) UPR induction occurred regardless of the time of addition of Tm. HAC1 mRNA splicing was measured as an indicator of UPR induction in phase I (G) and phase II (H) cells. Northern blotting of HAC1 mRNA was performed at the indicated times after Tm treatment. Positions of the spliced and unspliced HAC1 mRNA are indicated.
Figure 5—figure supplement 1
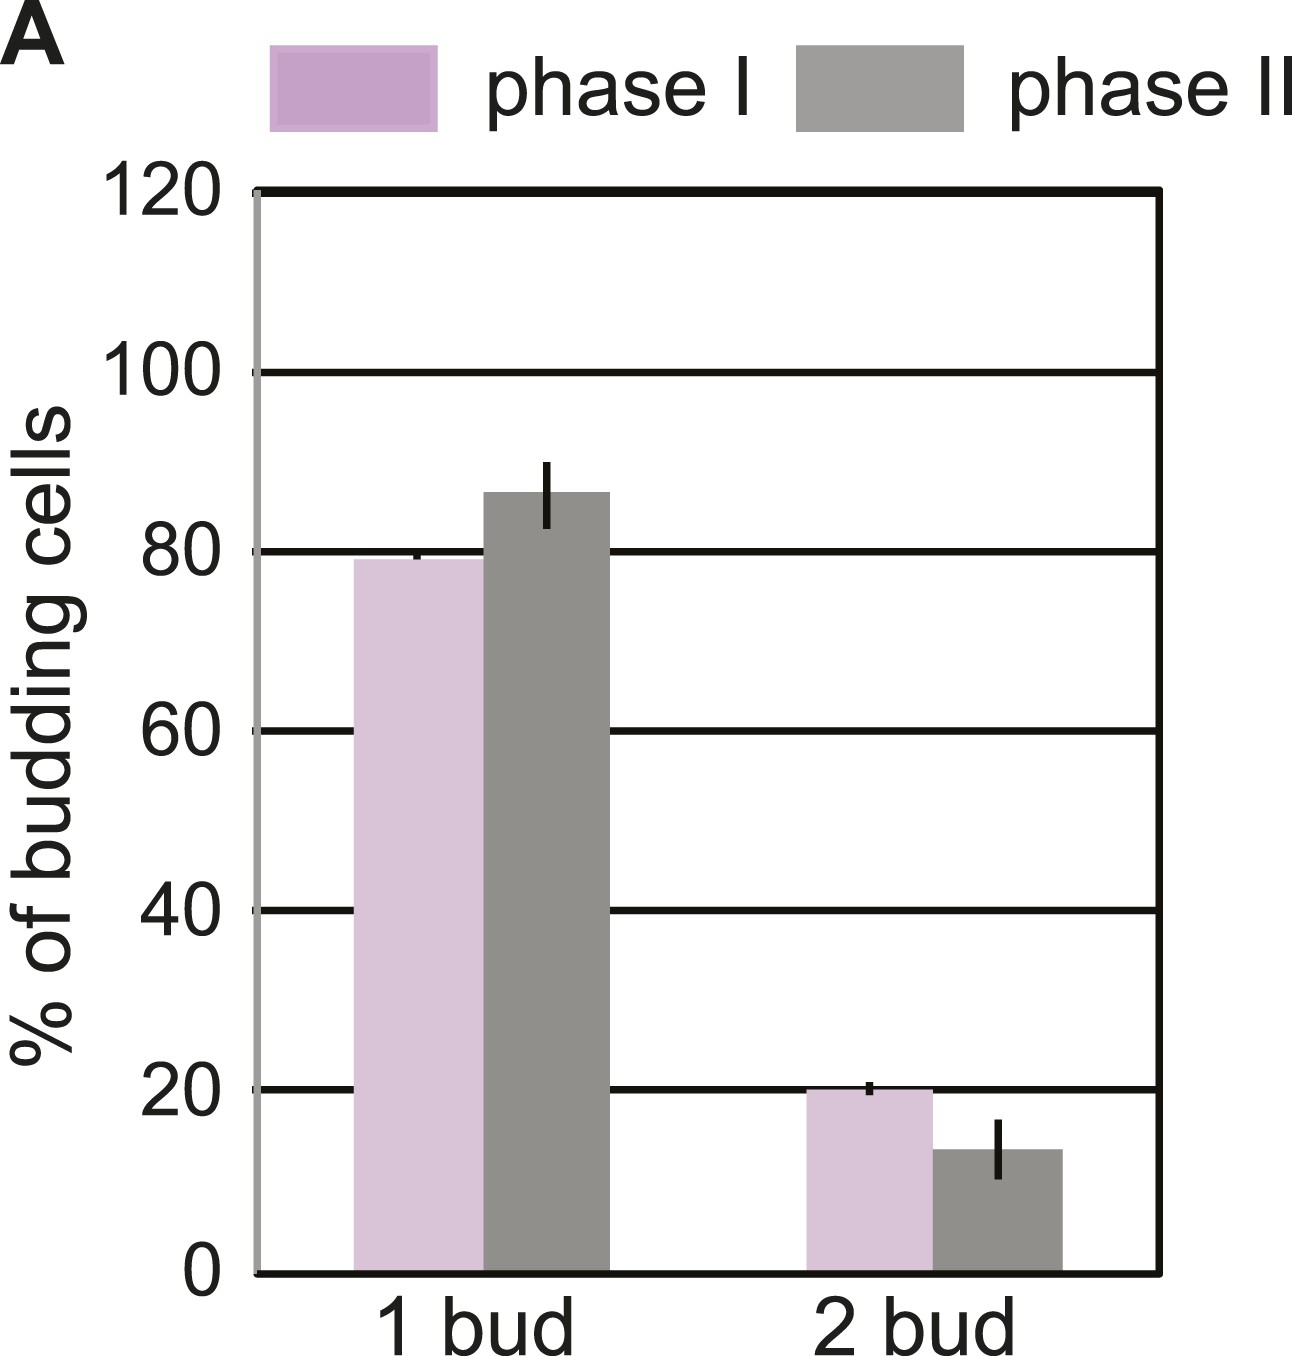
Phase I and phase II cells activate the ERSU pathway.
(A) Percentage of phase I (purple) and phase II (gray) cells that showed one bud or two buds after Tm treatment. Error bars indicate SD from three independent experiments.
Figure 5—figure supplement 2
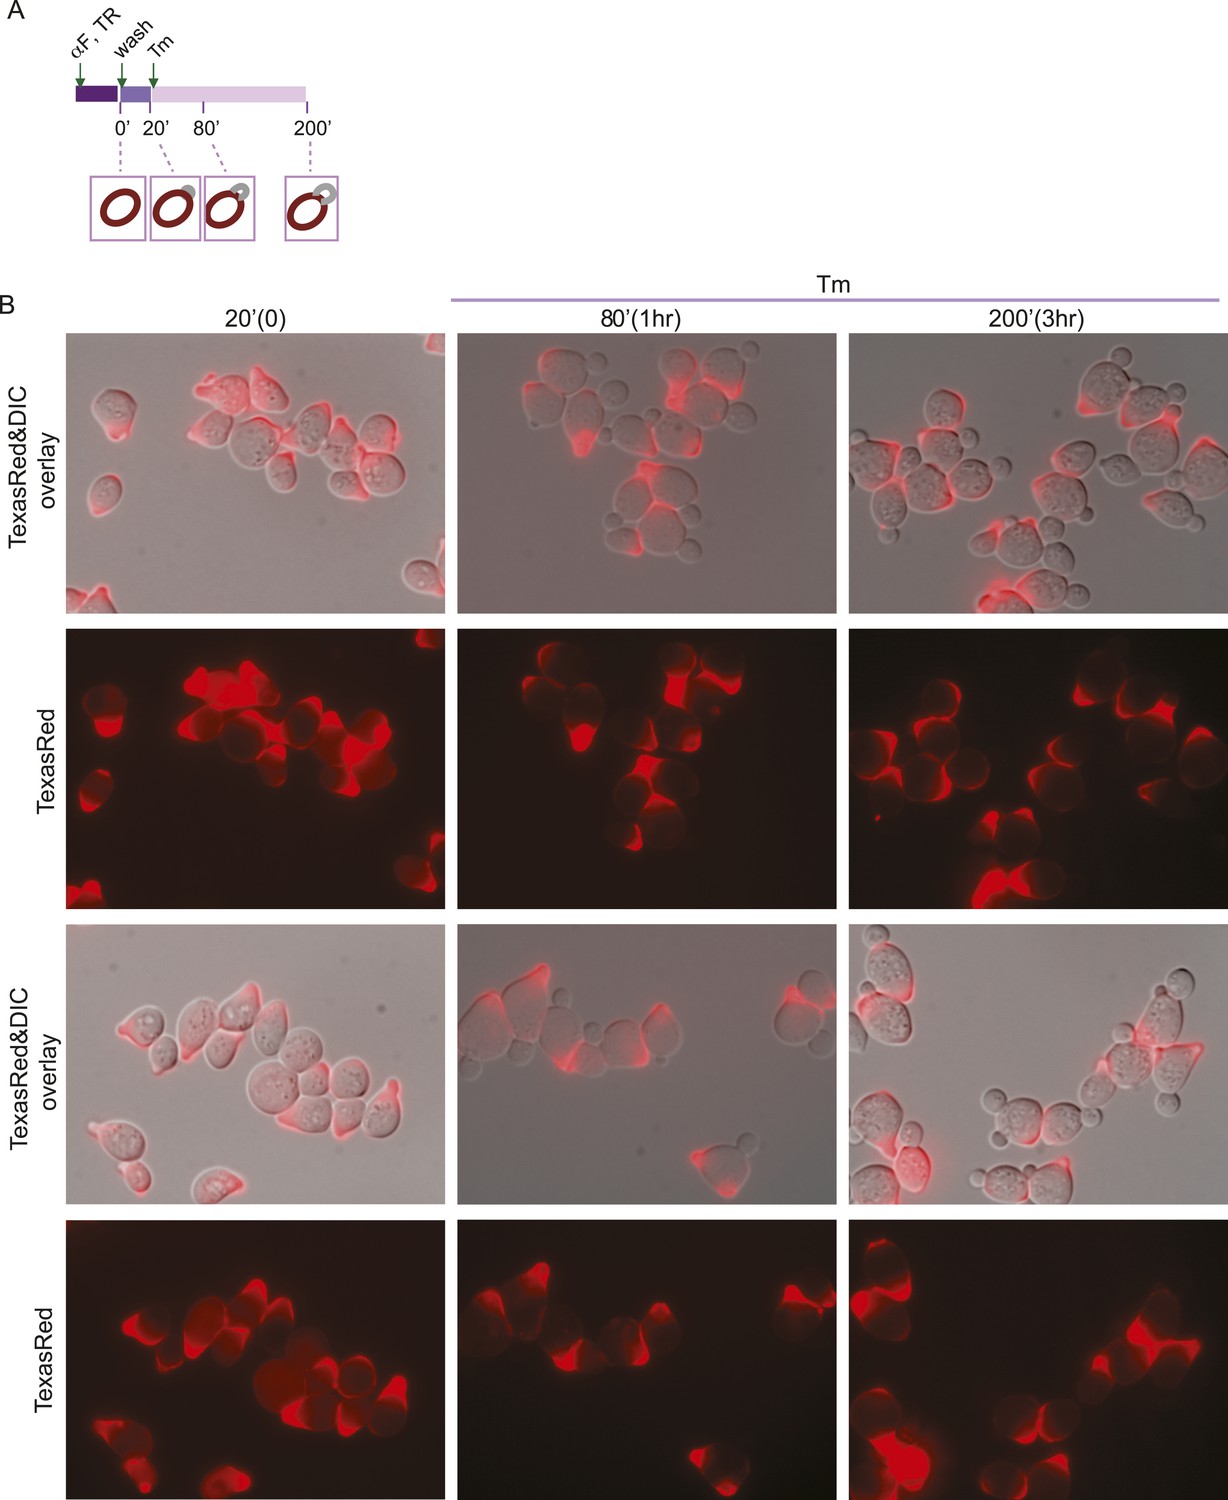
ER stress induction in cells at an early stage of the cell cycle.
(A) A schematic diagram of the experimental set-up for examination of phase I cells. WT cells were synchronized with α-factor, washed, and treated with 1 μg/ml Tm 20 min later (phase I: 20 min after α-factor release). (B) Representative fields of cells treated as in (A) and incubated with Texas Red (TR)-ConA during the α-factor treatment. Mother cells (TR-positive) can thus be distinguished from daughter cells emerging after induction of ER stress (TR-negative).
Figure 5—figure supplement 3
Activation of the ERSU pathway varies with the cell cycle stage.
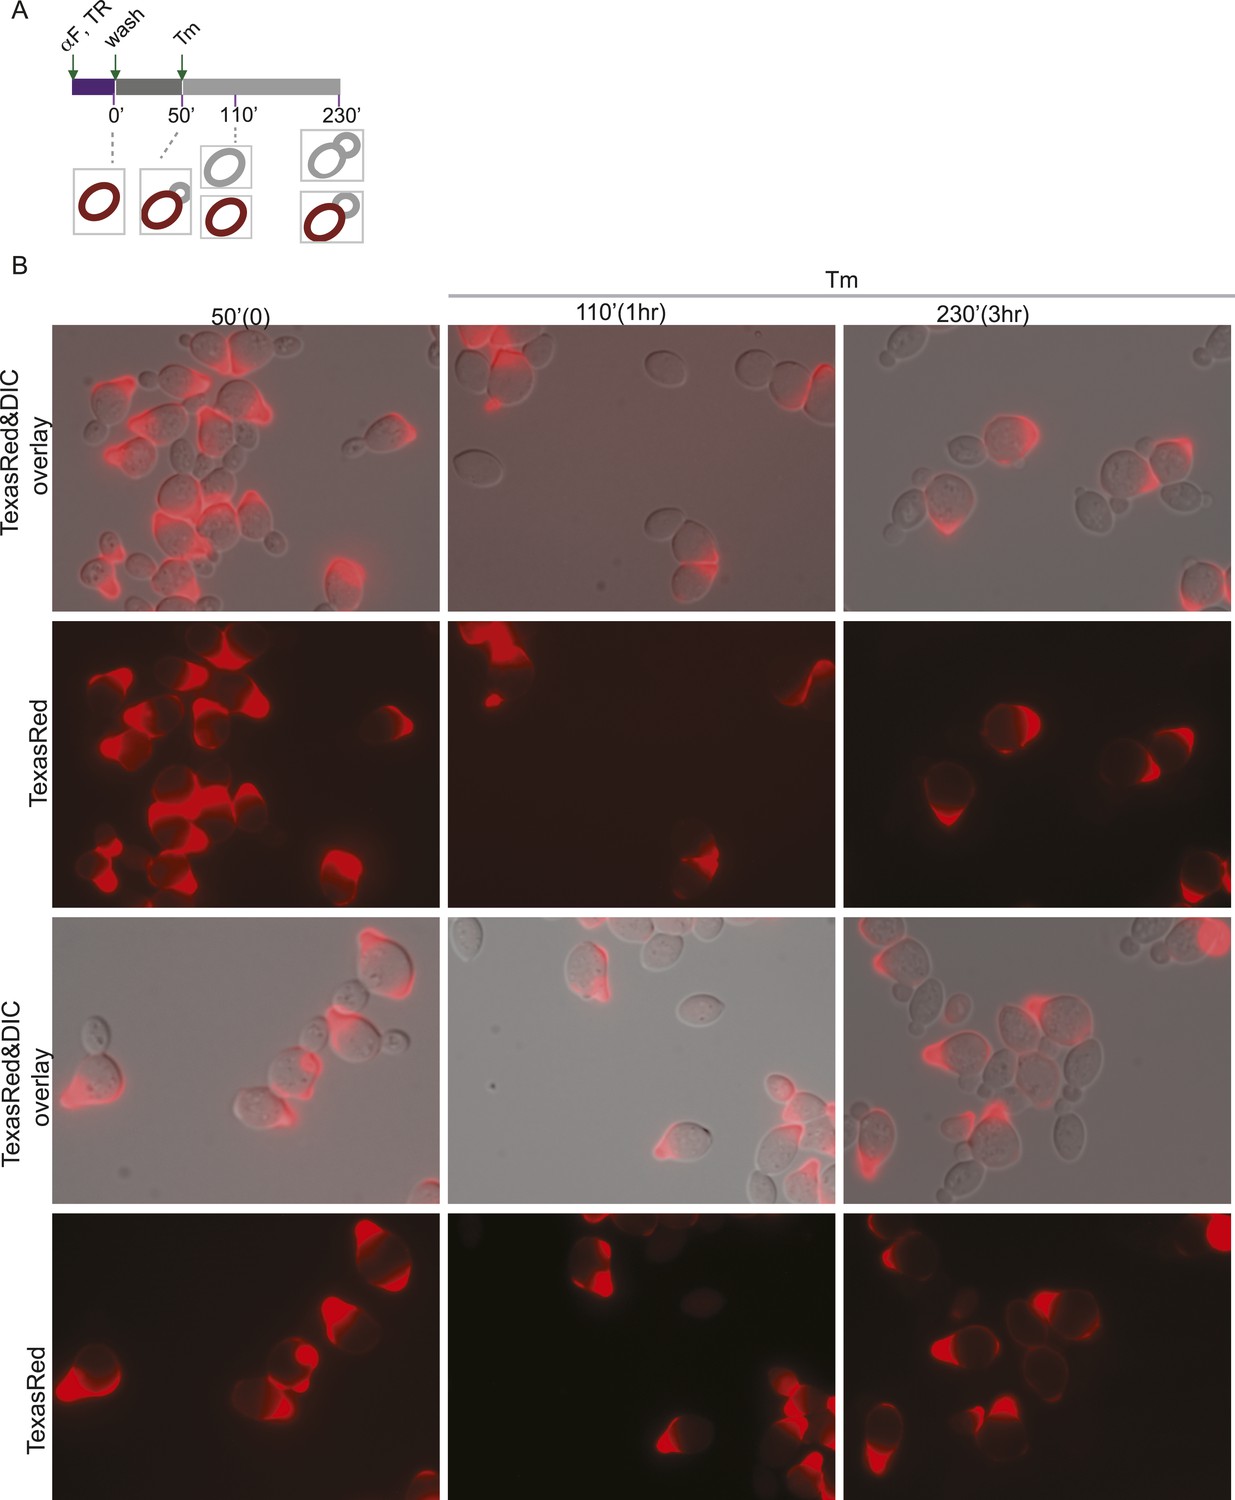
(A) A schematic diagram of the experimental set-up for examination of phase II cells. WT cells were synchronized with α-factor, washed, and treated with 1 μg/ml Tm 50 min later (phase II: 50 min after α-factor release). (B) Representative fields of cells treated as in (A) and incubated with Texas Red (TR)-ConA during the α-factor treatment. Mother cells (TR-positive) can thus be distinguished from daughter cells emerging after induction of ER stress (TR-negative). Many cells underwent cytokinesis, as evident from the presence of TR-positive and TR-negative cells at 110 and 230 min.
Figure 5—figure supplement 4
Activation of the ERSU pathway in cells at an early stage of the cell cycle.
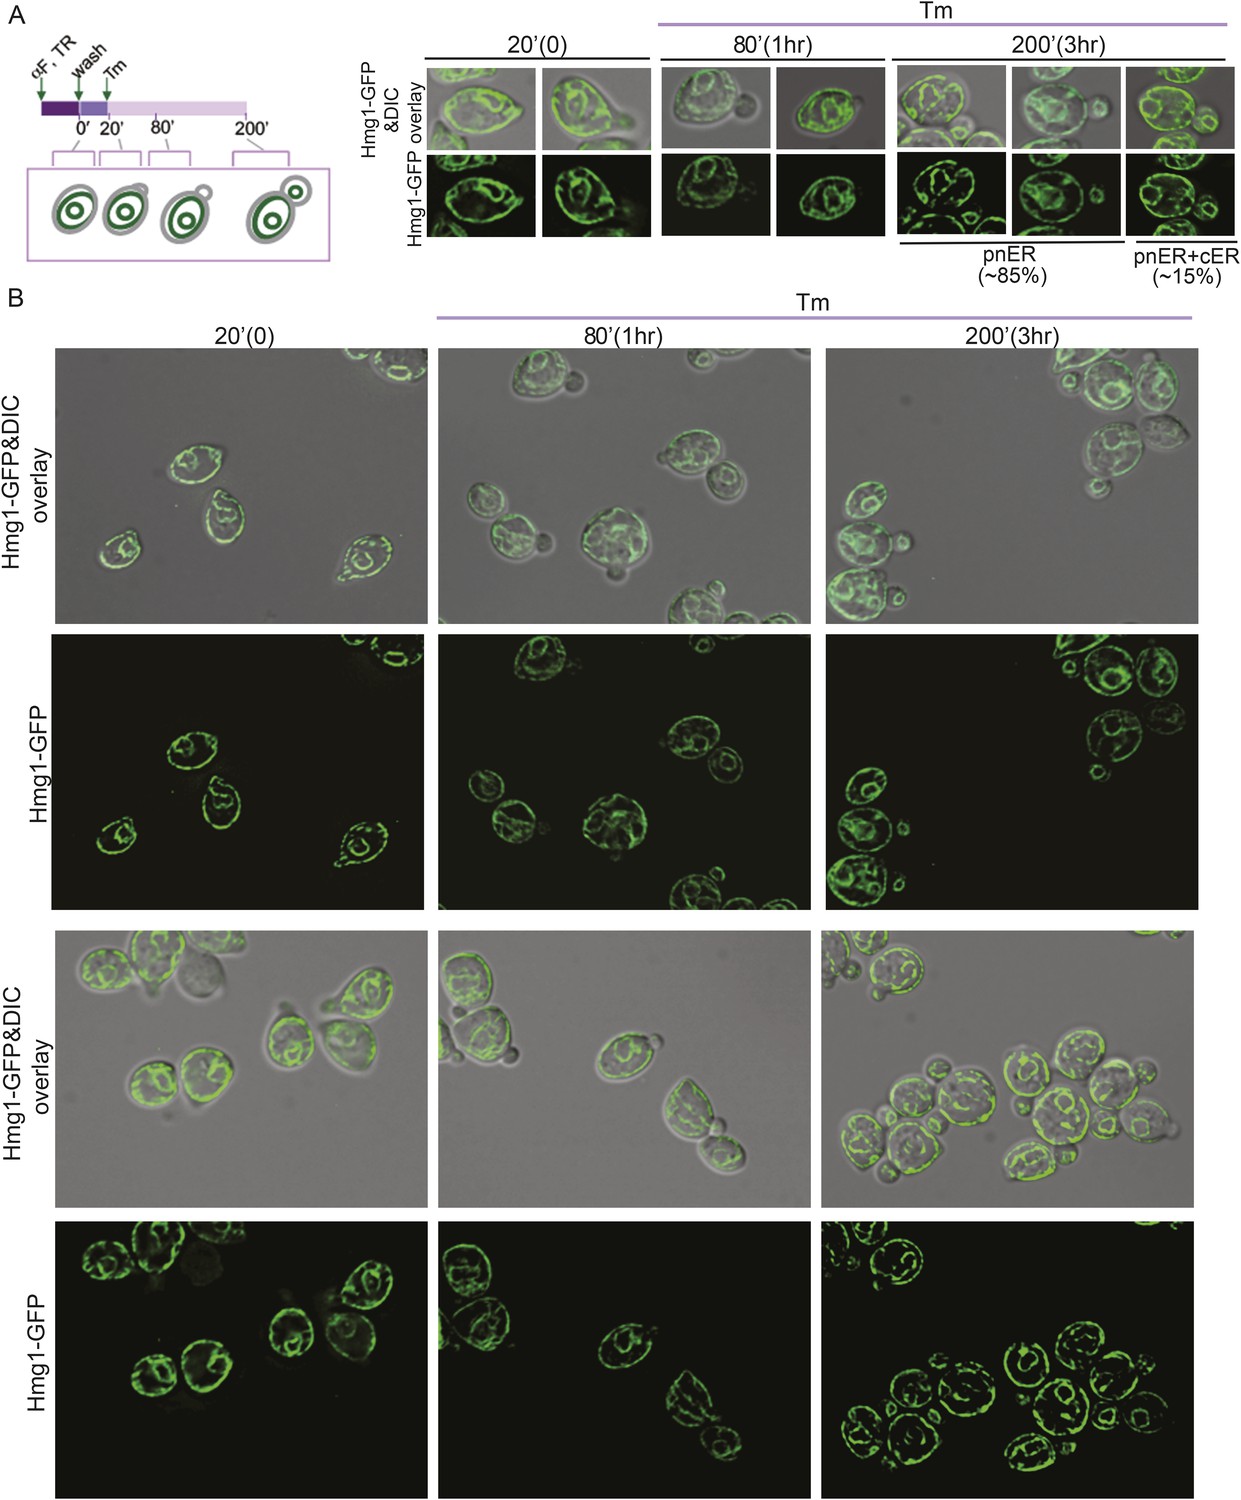
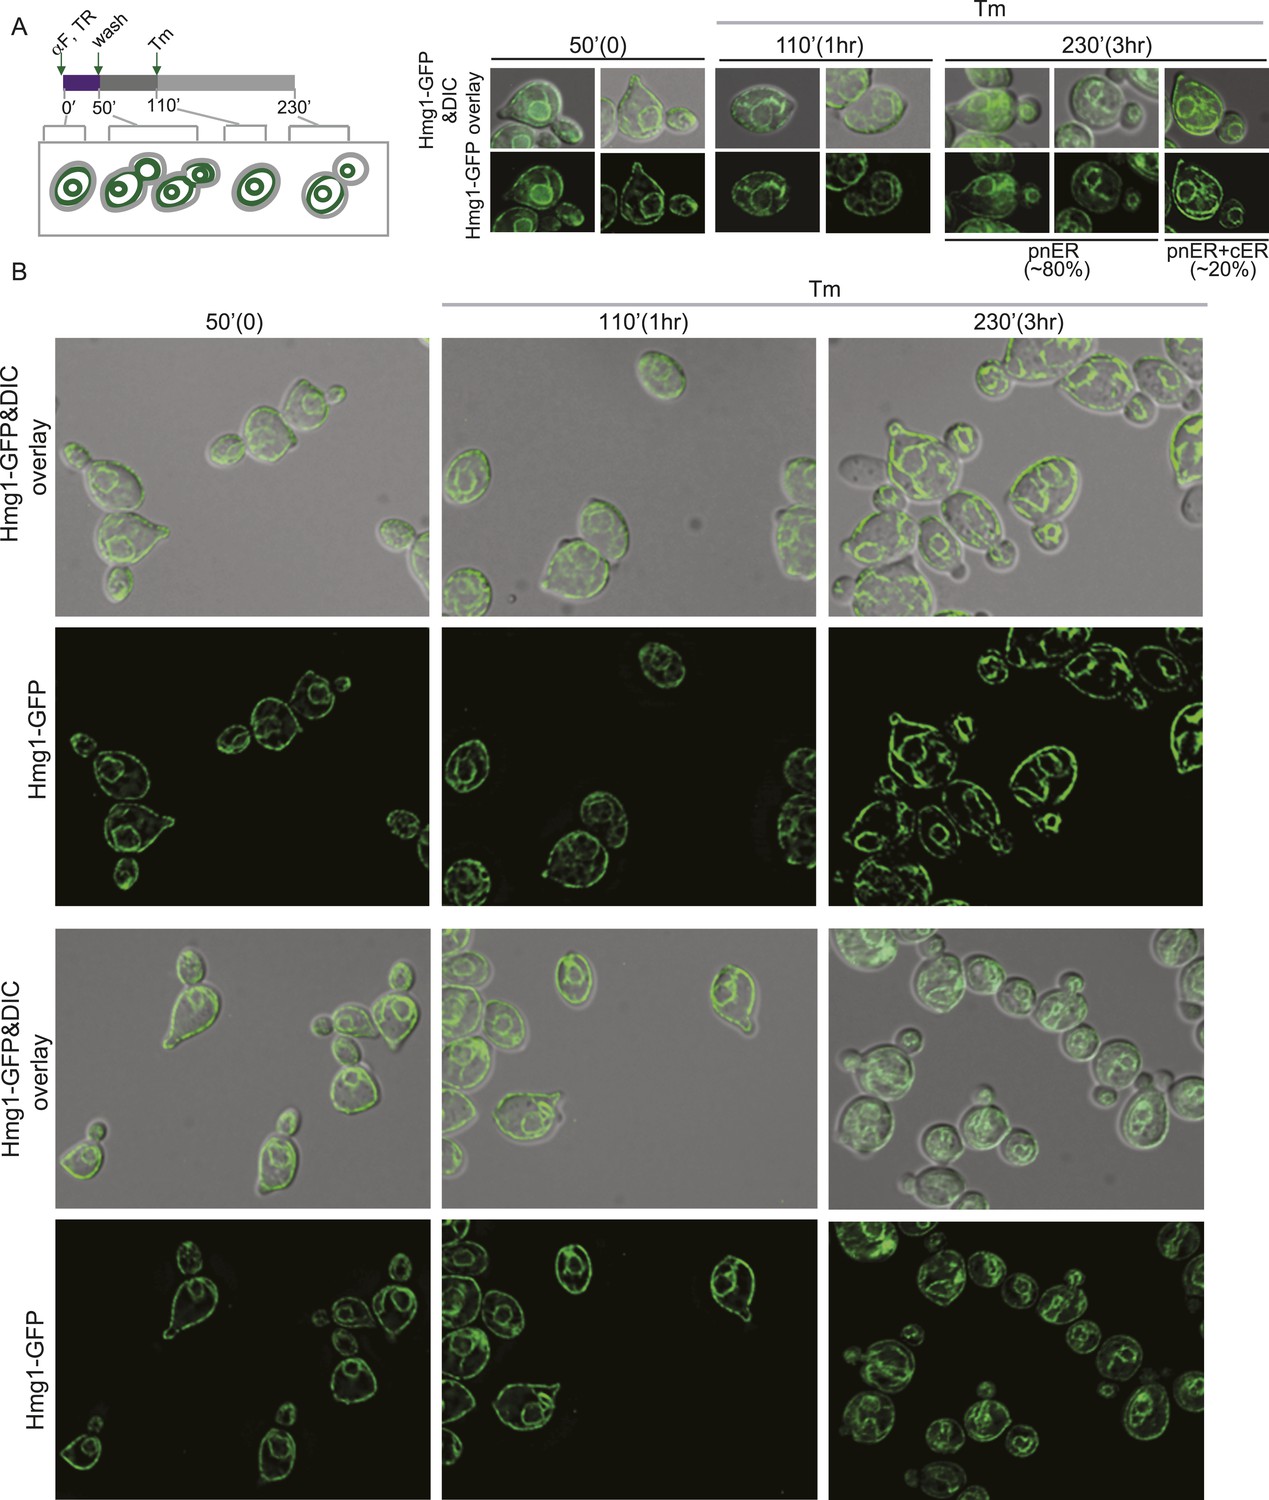
(A) A schematic diagram of the experiment shown in Figure 5E, shown again here for clarity. ER stress was induced by treating α-factor-synchronized Hmg1-GFP-expressing WT cells (phase I: 20 min after α-factor release) with 1 μg/ml Tm, and cER inheritance was evaluated at the indicated time points. Two representative cells at each time point are shown. For the 200 min time point (3 hr after addition of Tm), representative daughter cells containing only the pnER (85% of total cells) or both the pnER and cER (15% of total cells) are shown for comparison. Another set of representative cells is shown in Figure 5E. (B) Two representative fields of cells are shown for each time point.
Figure 5—figure supplement 5
Activation of the ERSU pathway in cells at a later stage of the cell cycle.
(A) A schematic diagram of the experiment shown in Figure 5F, shown again here for clarity. ER stress was induced by treating α-factor-synchronized Hmg1-GFP-expressing WT cells (phase II: 50 min after α-factor release) with 1 μg/ml Tm, and cER inheritance was evaluated at the indicated time points. Cells underwent cytokinesis, as evident from the presence of unbudded cells at 110 min (also see Figure 5B,C). Two representative cells at each time point are shown. For the 230 min time point (3 hr after addition of Tm), representative daughter cells containing only the pnER (80% of total cells) or both the pnER and cER (20% of total cells) are shown for comparison. Another set of representative cells is shown in Figure 5F. (B) Two representative fields of cells are shown for each time point.
Figure 6

Mother and daughter cells display similar degrees of cortical and perinuclear ER stress.
(A) Quantification of ER stress was performed by fluorescence recovery after photobleaching (FRAP) of cells labeled with the ER chaperone Kar2/BiP-sfGFP. Cells were exposed to DMSO or Tm (1 μg/ml) and then discrete regions of cER (indicated by the black rectangles) in mother (blue) and daughter (red) cells were photobleached and recovery was monitored. (B) Cells were treated as in A, except that FRAP was monitored in the indicated regions of the perinuclear ER (pnER; rectangles). cER and pnER stress, as indicated by the rate of FRAP, was comparable in untreated or Tm-treated mother and daughter cells. The results are the average of three independent experiments, each of which analyzed at least seven independent cells under both DMSO and Tm-treated conditions.
Tables
Table 1
Yeast strains used in this study
| Strain name | Genotype | Reference |
|---|---|---|
| MNY1037 | MATa, leu2-3,112, trp1-1, can1-100, ura3-1::HMG1-GFP:URA3, ade2-1, his3-11,15::UPRE-lacZ:HIS3 | (Babour et al., 2010) |
| MNY2215 | MATa, leu2-3,112, trp1-1, can1-100, ura3-1, ade2-1, his3-11,15::HIS3, bar1Δ::LEU2, DsRed-HDEL::ADE2 | (Babour et al., 2010) |
| MNY1000 | MATa, leu2-3,112, trp1-1, can1-100, ura3-1, ade2-1, his3-11,15 | (Cox et al., 1993) |
| MNY1002 | MATa, leu2-3,112, trp1-1, can1-100, ura3-1::HMG1-GFP::URA3, ade2-1, his3-11, bar1Δ::LEU2 | (Bicknell et al., 2007) |
| MNY2119 | MATa, leu2-3,112, trp1-1, can1-100, ura3-1, ade2-1, his3-11,15::UPRE-lacZ:HIS3 KAR2sfGFP::KanMX | This study |
| MNY2702 | MATa, leu2-3,112, trp1-1, can1-100, ura3-1::4xUPRE-GFP::URA3, ade2-1, his3-11,15 | This study |
| MNY1043 | MATa, leu2-3,112, trp1-1, can1-100, ura3-1::HMG1-GFP:URA3, ade2-1, his3-11,15::UPRE-lacZ:HIS3 slt2Δ::KanMX | (Babour et al., 2010) |
| MNY2112 | MATa, leu2-3,112, trp1-1, can1-100, ura3-1::HMG1-GFP:URA3, ade2-1, his3-11,15::UPRE-lacZ:HIS3 bud1Δ::KanMX | This study |
| MNY2825 | MATa, leu2-3,112, trp1-1, can1-100, ura3-1, ade2-1, his3-11,15::HIS3, bar1Δ::LEU2, DsRed-HDEL::ADE2 slt2Δ::KanMX | This study |
Table 2
Plasmids used in this study
| Plasmid name | Construct | Reference |
|---|---|---|
| pFJP1 | pFA6a-sfGFP-HDEL::KanMX6 | This study |
| pRH1209 | 4XUPRE-GFP::URA3 (pJCI86-GFP) | (Cox et al., 1993) |
| pCU426CUP1/EGFP-CFTR | pRS426-CUP1-EGFP-CFTR | (Fu and Sztul, 2003) |
| pFJP10 | pRS425-GAL1-CPY*-mRFP | This study |
Download links
A two-part list of links to download the article, or parts of the article, in various formats.
Downloads (link to download the article as PDF)
Open citations (links to open the citations from this article in various online reference manager services)
Cite this article (links to download the citations from this article in formats compatible with various reference manager tools)
The ER Stress Surveillance (ERSU) pathway regulates daughter cell ER protein aggregate inheritance
eLife 4:e06970.
https://doi.org/10.7554/eLife.06970


