Chromerid genomes reveal the evolutionary path from photosynthetic algae to obligate intracellular parasites
- King Abdullah University of Science and Technology, Saudi Arabia
- Wellcome Trust Genome Campus, United Kingdom
- University of Alberta, Canada
- University of British Columbia, Canada
- Czech Academy of Sciences, Czech Republic
- University of South Bohemia, Czech Republic
- CSIR National Chemical Laboratory, India
- Institut de Biologie de l'Ecole Normale Supérieure, CNRS UMR8197 INSERM U1024, France
- University of Pennsylvania, United States
- University of Ostrava, Czech Republic
- University of Melbourne, Australia
- Seattle Biomedical Research Institute, United States
- CSIC/Universidad Autónoma de Madrid, Spain
- IE Business School, IE University, Spain
- University of Copenhagen, Denmark
- European Bioinformatics Institute (EMBL-EBI), Wellcome Genome Campus, Hinxton, United Kingdom
- University of Glasgow, United Kingdom
- Broad Institute of MIT and Harvard, United States
- Monash University, Australia
- Weill Cornell Medical College, United States
- Nagasaki University, Japan
- University of Cambridge, United Kingdom
- Canadian Institute for Advanced Research, Canada
Figures
Figure 1
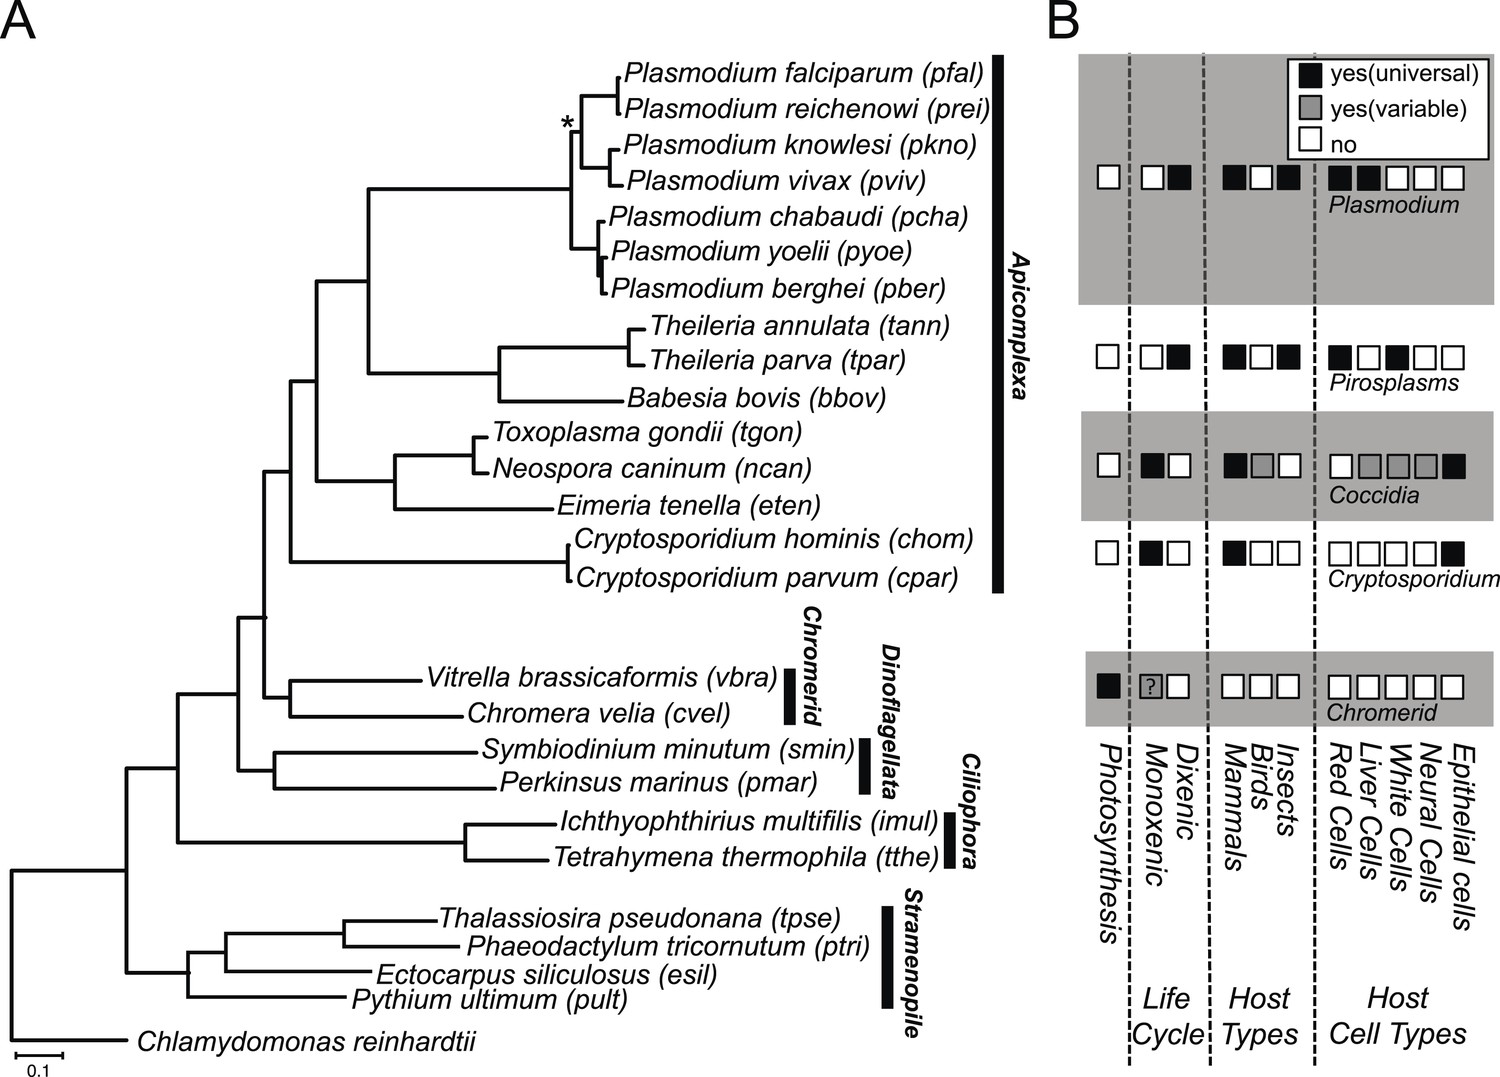
Phylogenetic, parasitological, and genomic context of chromerids.
(A) Phylogenetic tree of 26 alveolate and outgroup species (see Figure 1—source data 1 for the list of species). Multiple sequence alignments of 101 genes, which have 1:1 orthologs across all species (Figure 1—source data 2) were concatenated to a single matrix of 33,997 aligned amino acids. A maximum likelihood tree was inferred using RAxML with 1000 bootstraps, with Chlamydomonas reinhardtii as an outgroup. All clades are supported with bootstrap values of 100% except one node (*) with 99%, and also with 1.00 posterior probability from a bayesian phylogenetic tree based on PhyloBayes (Lartillot and Philippe, 2004) (CAT-GTR). (B) Lifestyles of the apicomplexan and chromerid species under investigation. ‘?’: uncertainty due to lack of relevant data.
-
Figure 1—source data 1
List of 24 species excluding Chomera and Vitrella used in this study and their data sources.
- https://doi.org/10.7554/eLife.06974.004
-
Figure 1—source data 2
A list of 101 shared orthogroups with a single gene in all of the 26 species, used for the species phylogenetic tree.
- https://doi.org/10.7554/eLife.06974.005
Figure 2 with 5 supplements
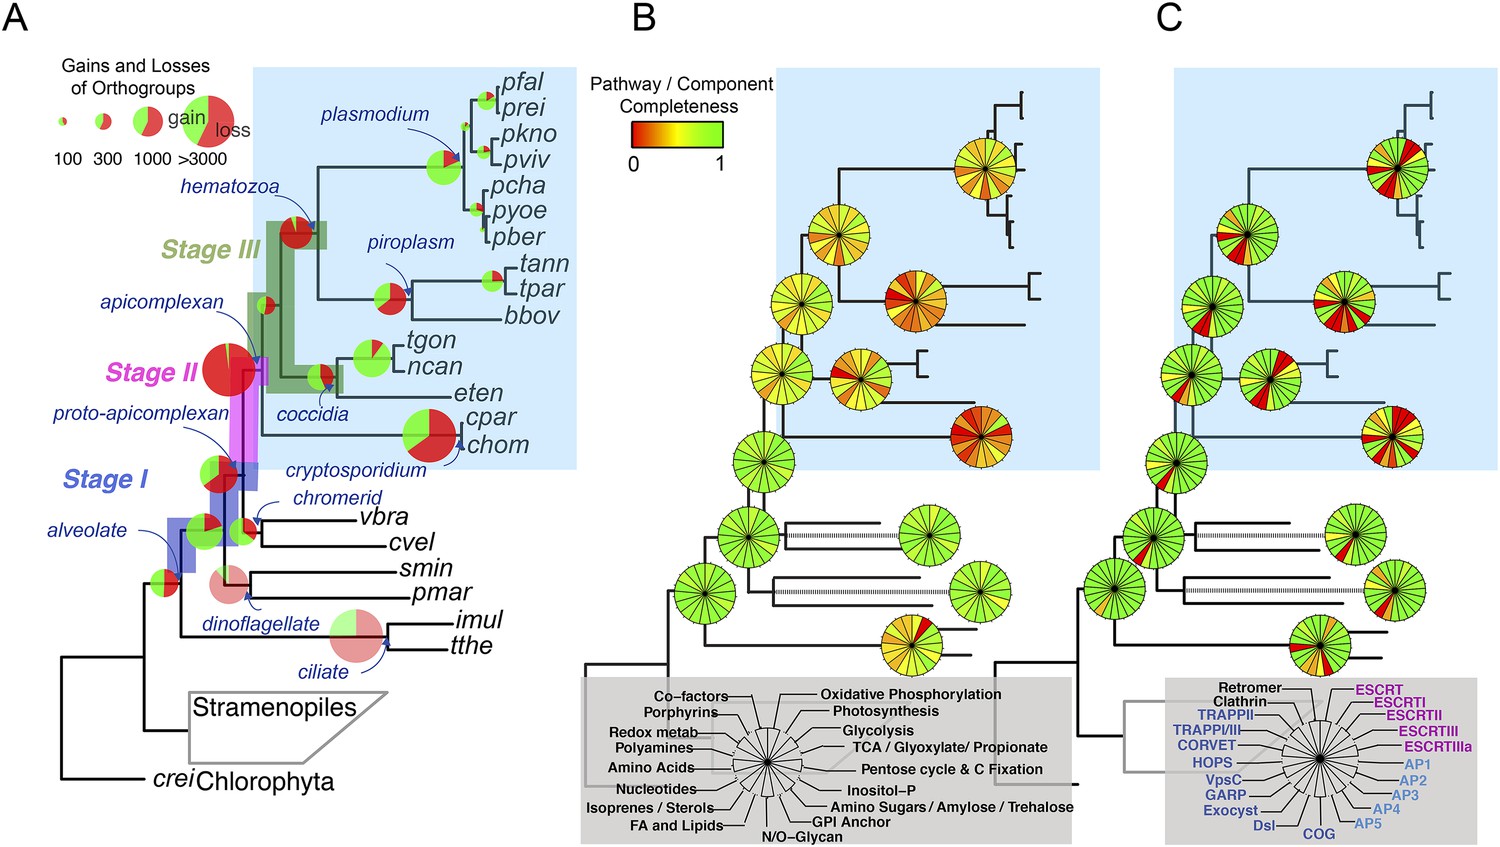
Gene content changes during apicomplexan evolution.
(A) Gains and losses of orthogroups inferred based on Dollo parsimony (Csuros, 2010). Analysis based on a gene birth-and-death model provided similar results (Figure 2—figure supplement 1A). Stages I, II, and III (shown in blue, pink and green, respectively) represent groups of branches from the alveolate ancestor to apicomplexan lineage ancestors. Stage III could not be determined for Cryptosporidium lineage because of sparse taxon sampling. The area of a green or red section in a pie is proportional to the number of gained or lost orthogroups, respectively. (B, C) Overview of metabolic capabilities (B) and endomembrane components (C) in apicomplexan and chromerid ancestors. Gains and losses of enzymes and components were inferred, based on Dollo parsimony (Csuros, 2010). The pie charts are color-coded based on the fraction of enzymes or components present. Additional results from analysis of individual components and enzymes can be found in Figure 2—figure supplements 2,3,4,5, Supplementary file 3. Individual components and enzymes are listed in Figure 2—source data 1, 2. Similar analyses were performed for components encoding flagellar apparatus (Figure 2—figure supplement 5B).
-
Figure 2—source data 1
Distribution of enzymes based on KEGG.
This Excel spread sheet provides mapping of the curated set of extracellular numbers (and/or gene names when an extracellular number is not available) to each metabolic pathway listed for each of the 26 species that are compared here. All the extracellular numbers shown in black font color were assigned automatically by the KEGG pathway mapping tool. The ones shown in red font color were added after manual inspection and verification by orthology, or based on evidence from literature. Blank cells denote absence of the enzyme. See Figure 1—source data 1 for full species names corresponding to the abbreviations in the figure.
- https://doi.org/10.7554/eLife.06974.007
-
Figure 2—source data 2
Genes encoding subunits of the endomembrane trafficking system.
- https://doi.org/10.7554/eLife.06974.008
-
Figure 2—figure supplement 5—source data 1
Genes encoding components of the flagellar apparatus in the 26 species.
- https://doi.org/10.7554/eLife.06974.014
Figure 2—figure supplement 1
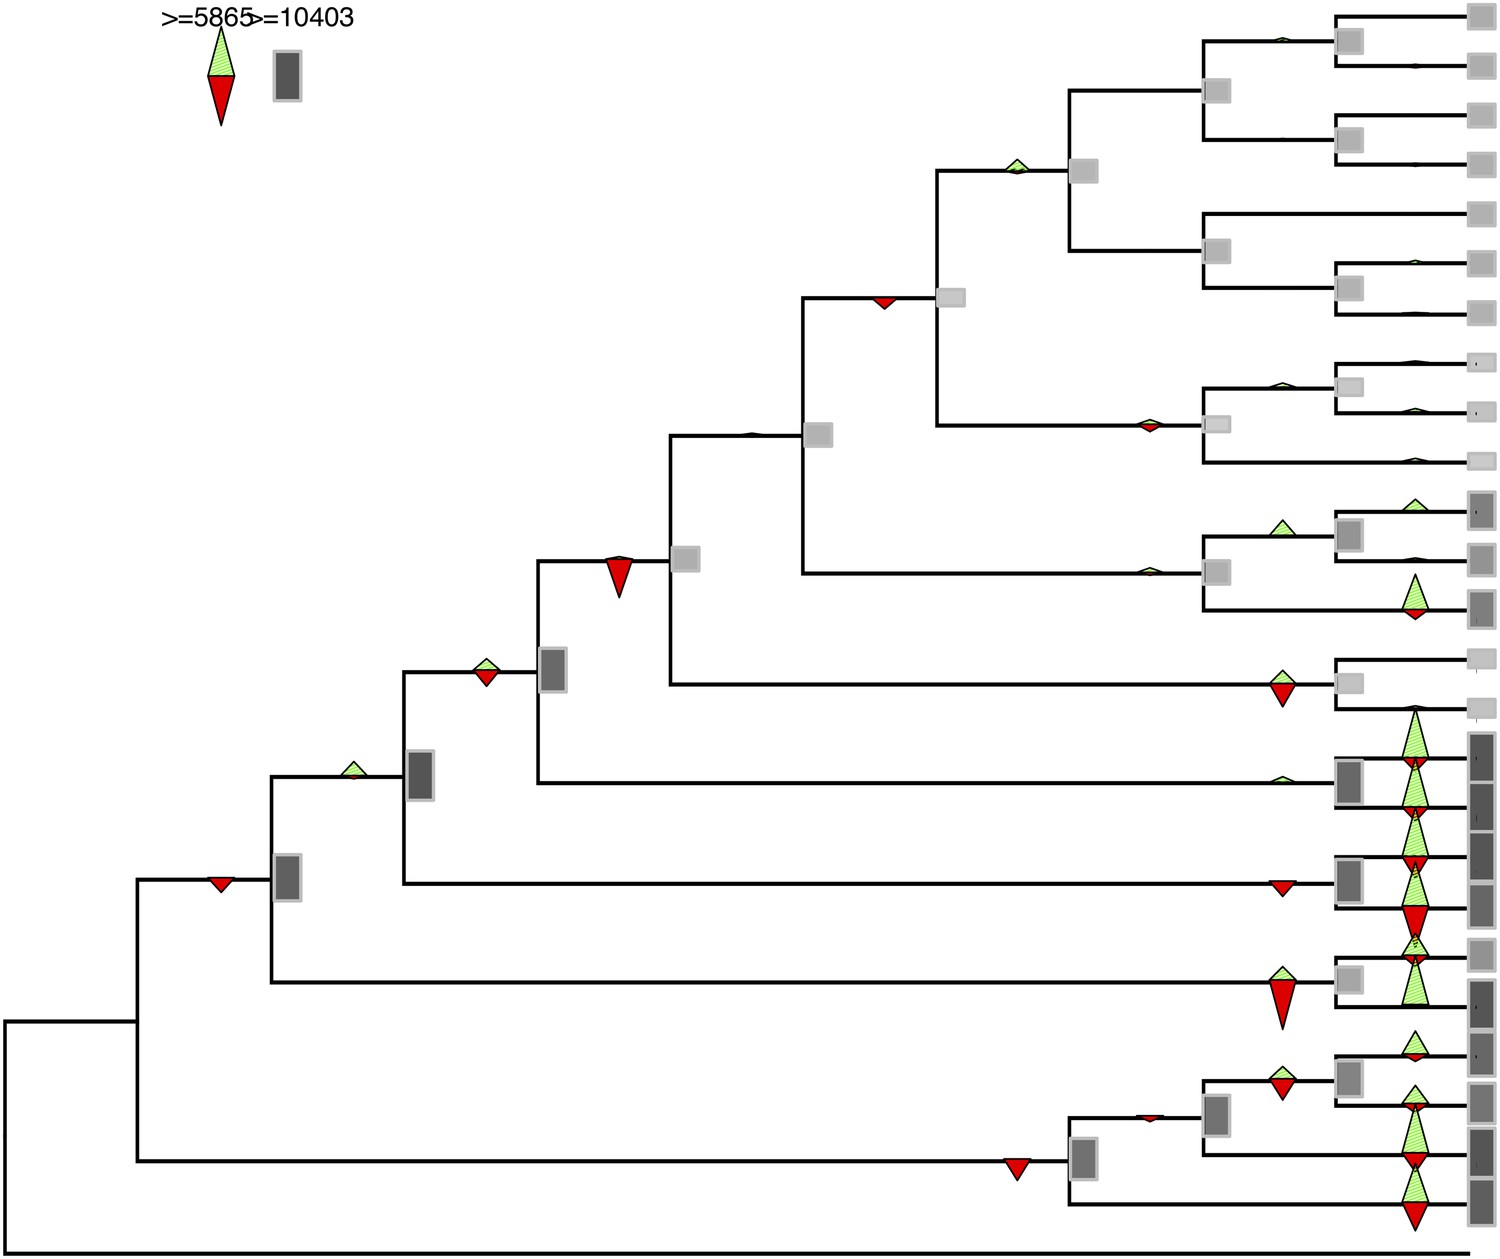
Gene gains and losses across the hypothetical ancestors of the 26 species under study.
Triangles pointing upward indicate gains, triangles pointing downward losses, and the total number of orthogroups at that particular node are proportional to the length or the darkness of the shade of the gray boxes. Gene gains and losses were inferred with gene birth-and-death model with posterior probability >0.3 (‘Materials and methods’).
Figure 2—figure supplement 2
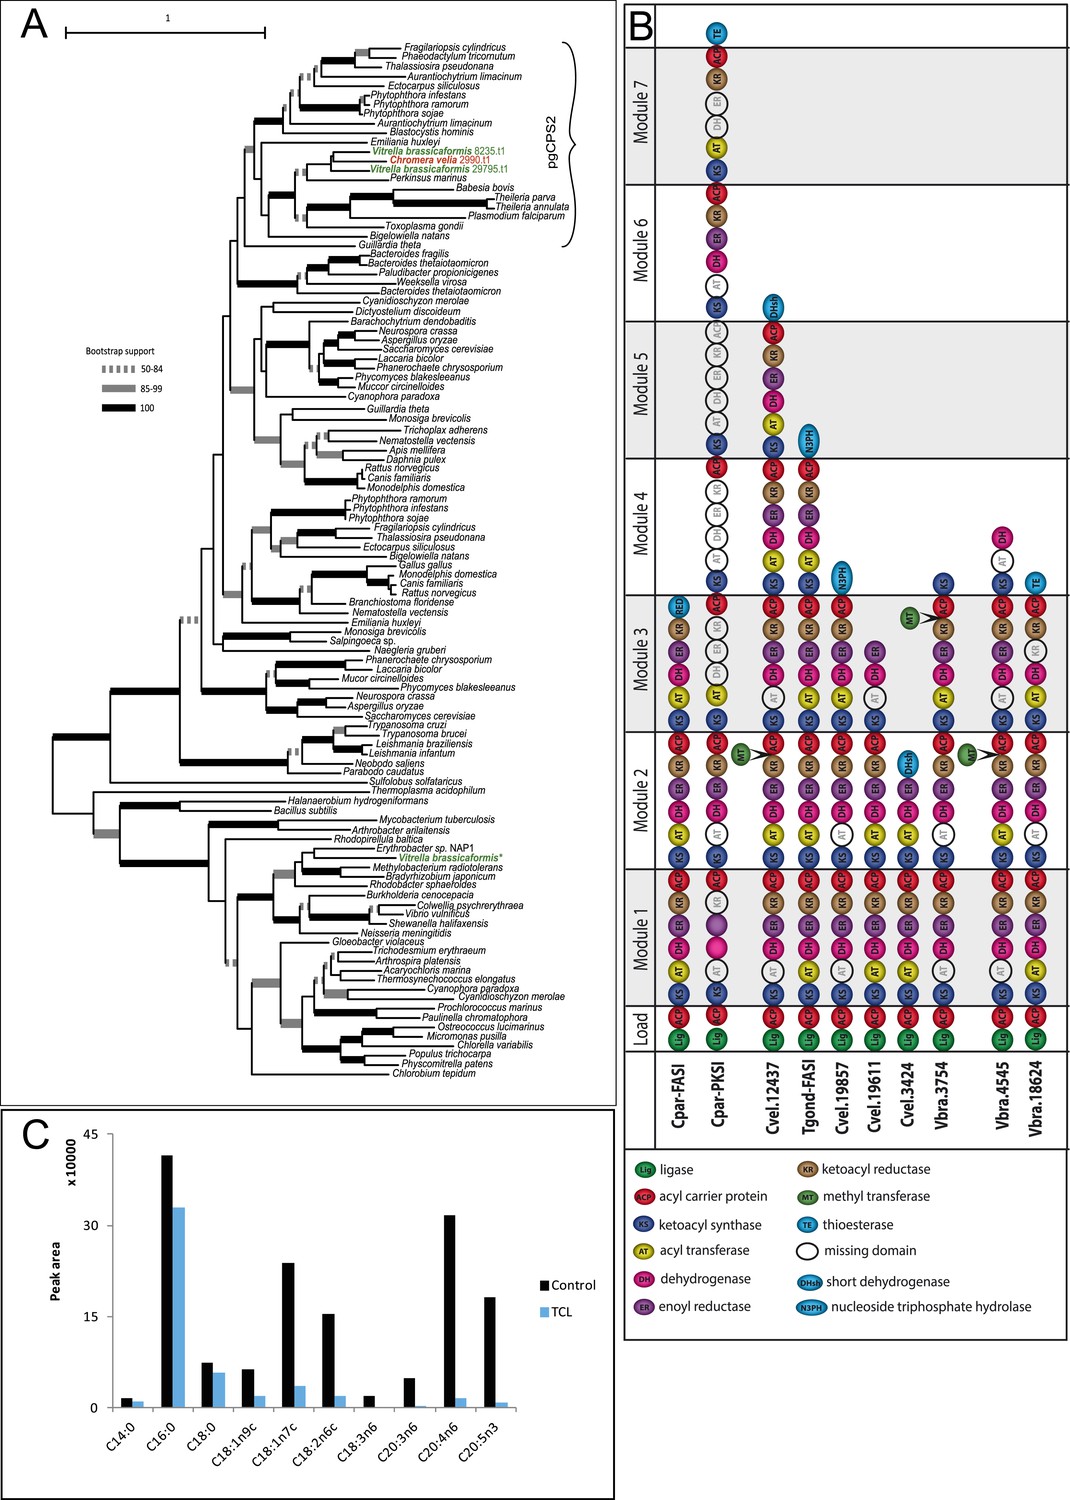
Overview of chromerid Carbamoyl Phosphate Synthetase (CPS) and Fatty Acid Synthase I (FAS I).
(A) Phylogenetic tree of CPS amino acid sequences demonstrates that Chromera and Vitrella contain only cytosolic CPS involved in pyrimidine biosynthesis, which has been duplicated in Vitrella. An additional gene coding for CPS was identified only in the Vitrella genome assembly (marked by *) was found to be bacterial contamination. None of the sequences encode a mitochondrial leader at the N-terminus of the corresponding protein. (B) Structures of selected multi-modular enzymes in Apicomplexa and chromerids. (C) Treatment of Chromera by Triclosan, an inhibitor of FASII. FASI is responsible for synthesis of short saturated FAs, while FASII mediates their modifications and synthesis of structural lipids. Production of short unsaturated FAs (C14:0; C16:0; C18:0) was not affected by Triclosan, suggesting that, in Chromera, short saturated FAs are produced by FASI and are likely modified by FASII.
Figure 2—figure supplement 3
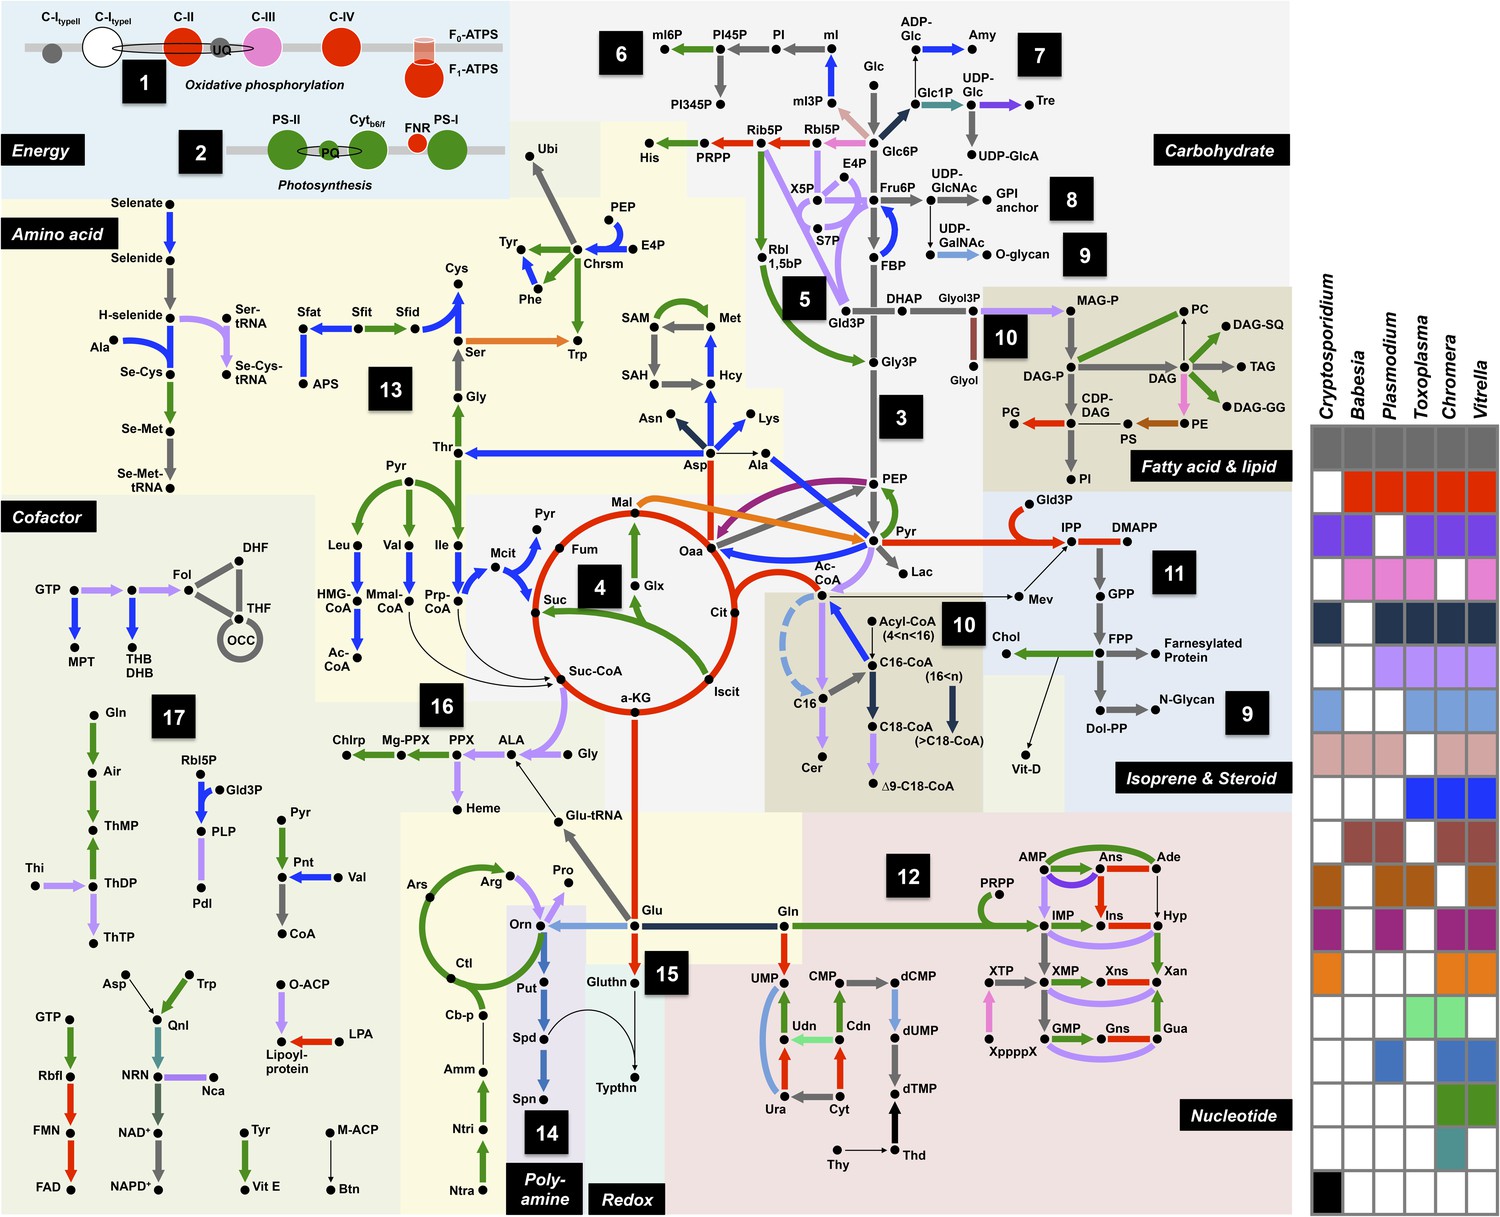
Summary of metabolic pathways based on KEGG Assignments.
Schematic comparison of metabolism between Chromera, Vitrella, and selected species from Apicomplexa. Phyletic patterns for conservation of metabolic function are color-coded as shown in the panel on the right. A key for the abbreviations and the details of each enzymatic reaction are found in Appendix 2 and Figure 2—source data 1.
Figure 2—figure supplement 4
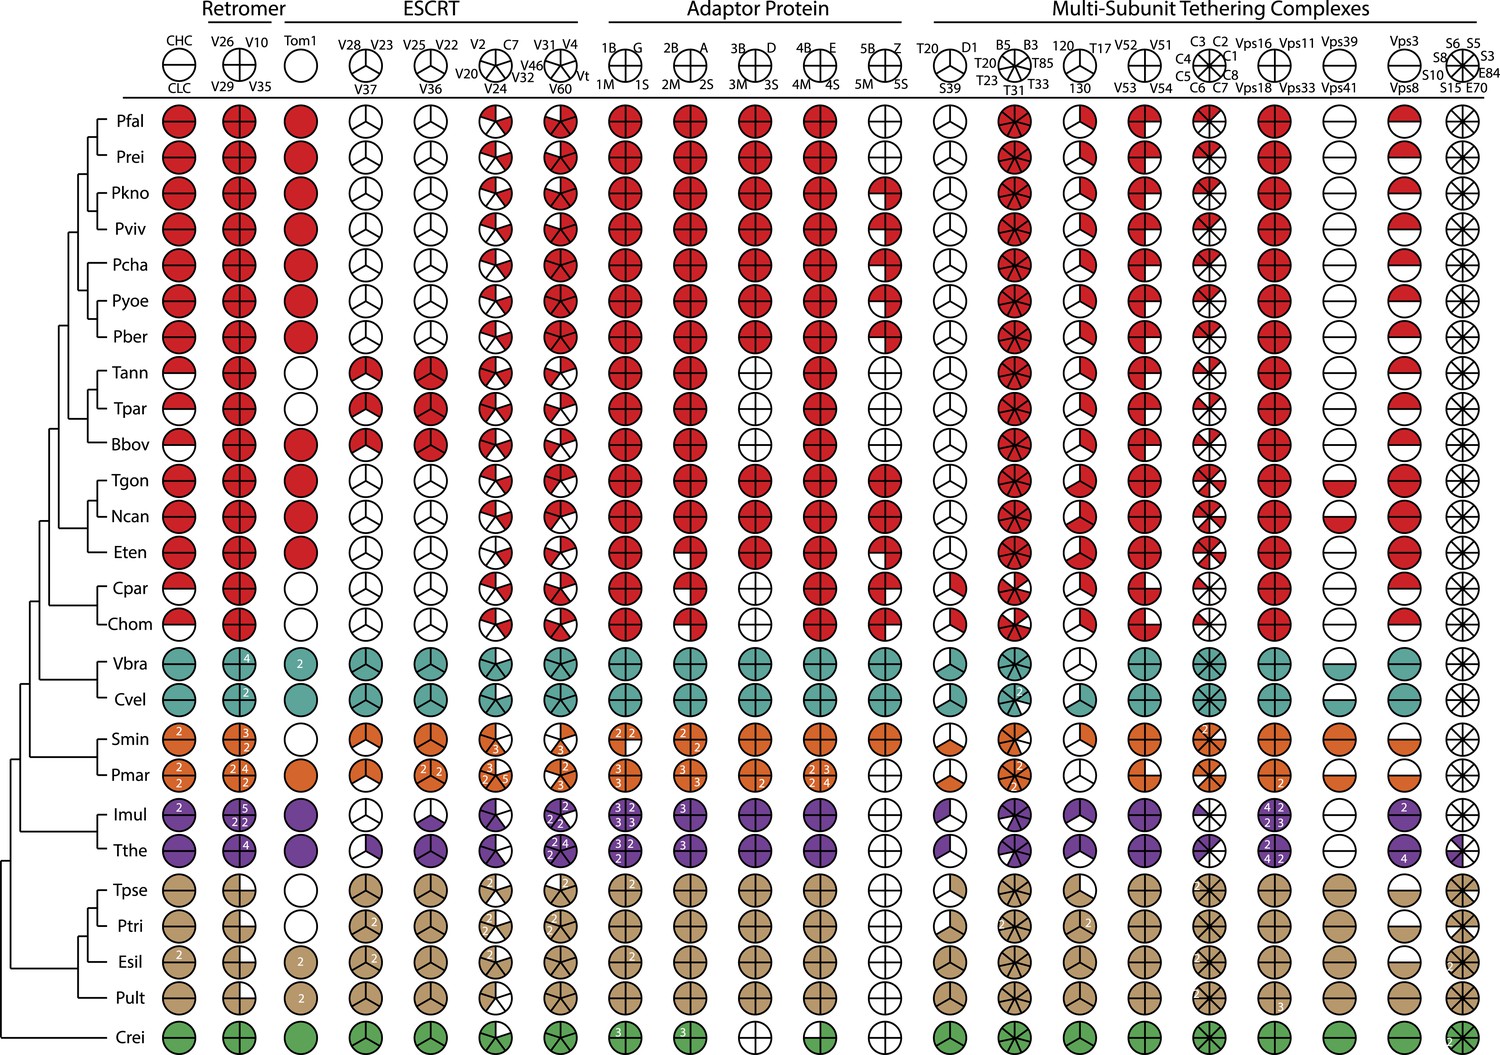
An overview of endomembrane trafficking components.
Coulson plot representation of the retention/loss of genes encoding trafficking gene complement of the Retromer, Clathrin, ESCRT, AP, and MTC family proteins amongst the 26 species. The fill colors indicate different phyla, for example, red Coulson plots for apicomplexans. Legends at the top of each column denote subunit components of complexes. For each organism, filled sectors of the pie represent presence of the corresponding protein, whereas empty sectors represent a failure to identify the corresponding protein in the genome (the method is described in Appendix 3). In cases where multiple copies of the protein are present, and can confidently be ascribed to unique genes, numbers indicate relevant paralog counts. The 26 species are shown on the left side with a phylogenetic tree. For simplicity, all subunits are listed as per yeast nomenclature, and only revert to human nomenclature when no homologous yeast gene exists. Abbreviations: CHC, Clathrin heavy chain; CLC, Clathrin light chain; V, Vps; C, CHMP; Vt, Vta1; B, Beta, M, Mu; S, Sigma, G, Gamma; A, Alpha; D, Delta; E, Epsilon; Z, Zeta; T20, Tip20; D1, Dsl1; S39, Sec39; T, Trs; T17, Tca17; C, COG; S, Sec; E, Exo; ESCRT, Endosomal Sorting Complex Required for Transport; MCT, multi-subunit tethering complex; AP, Adaptor Protein. IDs of genes encoding the components are listed in Figure 2—source data 2.
Figure 2—figure supplement 5
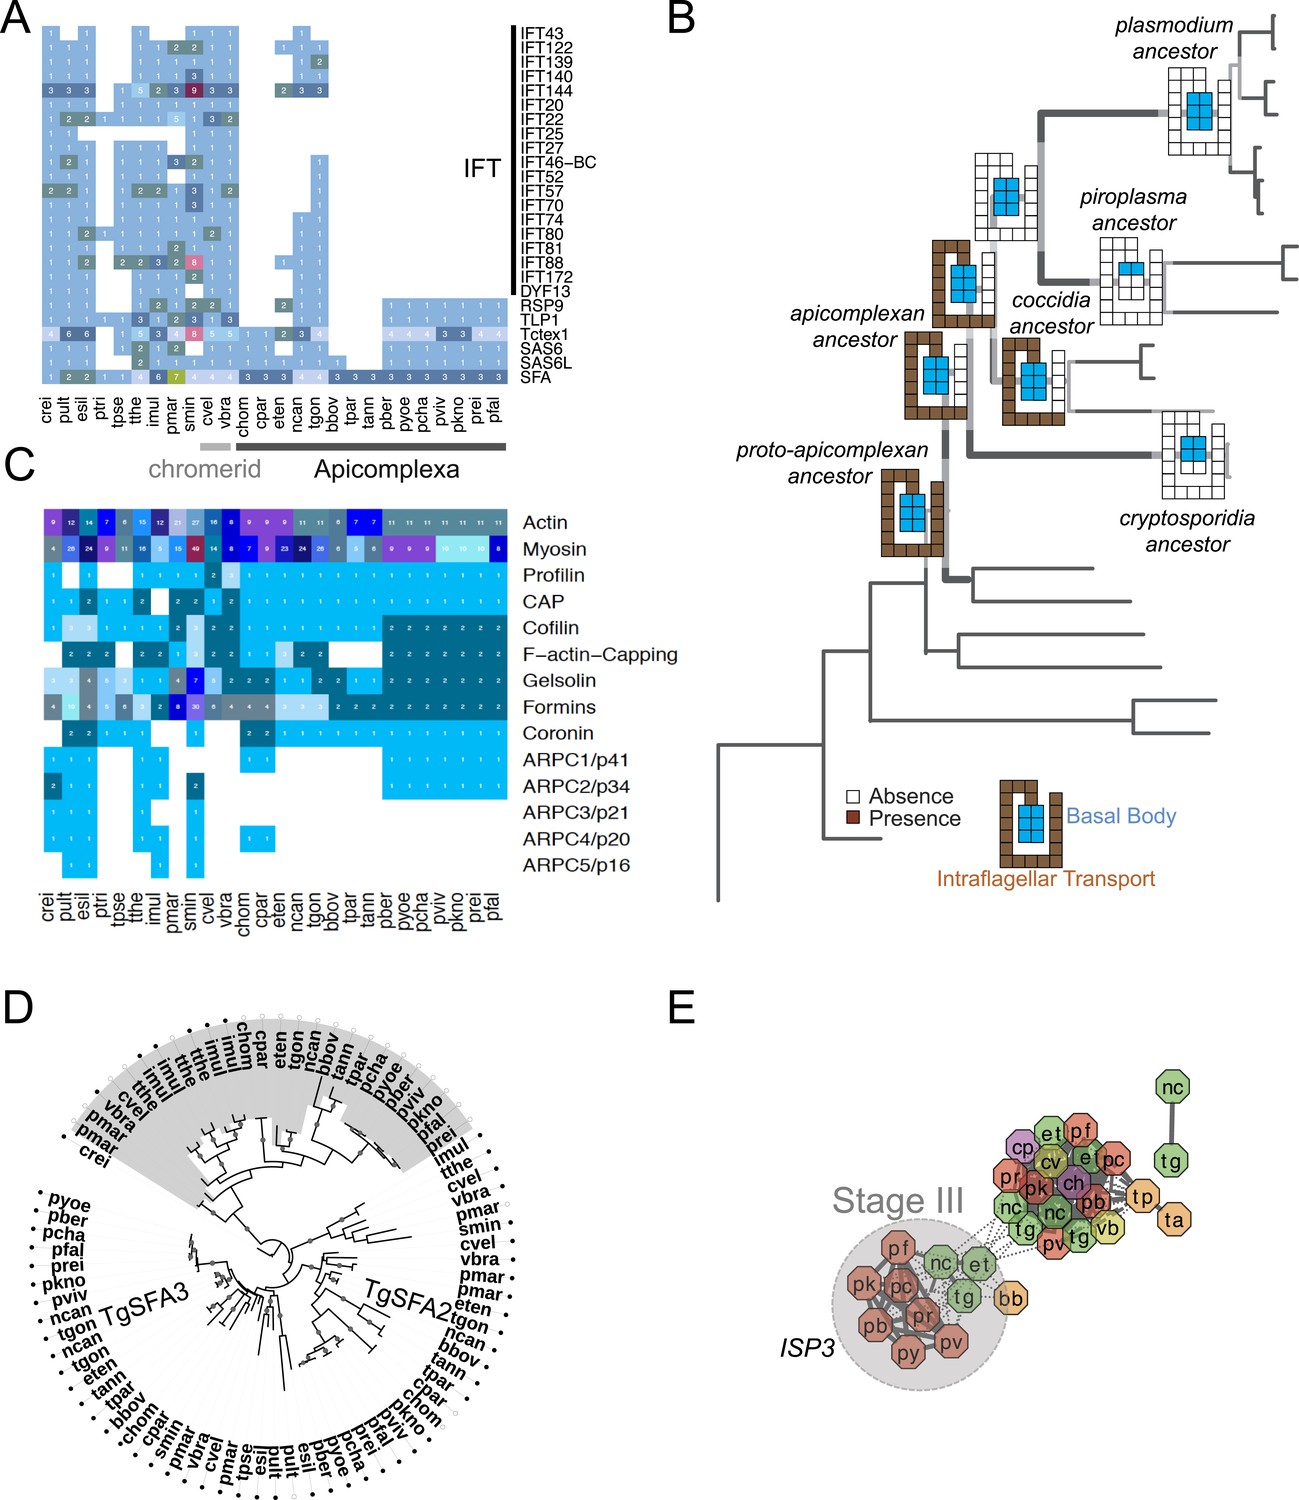
Evolutionary history of genes encoding cytoskeleton across 26 species.
(A) Heatmap showing the phyletic pattern of 25 known flagella-related genes (vertical) across the 26 species (horizontal). Gene copy numbers are displayed as numerals on each cell. Black, blue, and orange bars on the right indicate intraflagellar transport, basal body, and striated fiber assemblin (SFA), respectively. The IDs of genes encoding flagellar components are listed in Figure 2—figure supplement 5—source data 1. (B) Schematic representation of losses along the evolutionary paths. See Figure 2B,C for legend. Blue and Brown colored boxes denote presence of basal body and IFT proteins. (C) Heatmap showing distribution of actin and actin-regulatory proteins across the 26 species. They were annotated based on previously defined classification rules with Pfam domain or based on orthology (OrthoMCL clustering) with known actin and actin-related genes. The numbers of genes are shown as numerals within each cell. (D) Phylogenetic tree of SFA genes, identified with the canonical SF-assemblin domain (PF06705) (closed circles) and those with the variant SF-assemblin domain (open circles) for our downstream analyses in Figure 4. The variant SF-assemblin domain, where some amino acid sequences were rearranged, was confirmed by manual inspection of the alignment (data not shown). The gray shade indicates alveolate-specific SFAs. (E) A network view of amino acid sequence homology between ISP family genes. Edges are drawn depending on the strength of the sequence homology: dotted (BLASTP E value <10−20) or solid (BLASTP E value <10−30). The two letters within the node refer to acronyms of the species name and the node color species group: red (Plasmodium); green (coccidians); magenta (Cryptosporidia); orange (piroplasms); yellow (chromerids); and navy (dinoflagellates). ISP3 has been duplicated and diverged from ISP1 after the common ancestor of coccidians, piroplasms, and Plasmodium spp. split from Cryptosporidia.
Figure 3 with 4 supplements

Evolutionary history of Plasmodium falciparum and Toxoplasma gondii genes.
Violin plots showing distribution of evolutionary ages of genes (Y-axis: from species-specific (bottom) to deeply conserved (top)) in P. falciparum (A) and T. gondii (B). Evolutionary age of a gene is defined as the earliest node on the evolutionary path of the phylogenetic tree where homolog can be detected (‘Materials and methods’). The horizontal thickness of a violin is proportional to the number of genes (gray) or the fraction of genes (yellow) in a functional category (X-axis) out of all with the same evolutionary age. Selected functional sub-categories are overlaid with red, green, or blue violin plots. The maximum width of each violin is scaled to be uniform across categories. Inner boxes in the gray violins indicate inter-quartile ranges and circles indicate medians. Colored shades along the X-axis indicate Stages I–III (Figure 2). Extracellular proteins include proteins targeted to host cytoplasm, nucleus, and plasma membrane (‘exportome’) and all other proteins, which are secreted or localized on the parasite surface (‘others’). Cytoskeletal proteins include proteins associated with ‘actomyosin motor complex’ and ‘IMC’. All extracellular and cytoskeletal proteins are listed in Figure 3—source data 1, 2. Nucleic acid-binding proteins are predicted in silico based on presence of DNA-binding domains (DBDs) and RNA-binding domains (RBDs). See ‘Materials and methods’ for details on how these genes are defined and compiled. Domain architectures of representative extracellular proteins in apicomplexans and chromerids are displayed as schematics in Figure 3—figure supplement 4. Sequence homology networks (Figure 2—figure supplement 5E and Figure 3—figure supplements 1B, 2B, 3B) and gene gains and losses on the phylogenetic tree (Figure 3—figure supplements 1A, 2A, 3A) provide complementary views on the evolutionary history of these genes.
-
Figure 3—source data 1
Genes encoding extracellular proteins in P.falciparum and T. gondii.
Details regarding how these genes are defined and compiled are provided in the ‘Materials and methods’ section.
- https://doi.org/10.7554/eLife.06974.016
-
Figure 3—source data 2
Genes encoding cytoskeletal components in the 26 species.
Most of components in the actomyosin complex were predicted in silico with some manual curation for P. falciparum and T. gondii. Definitions of the categories and details of how these genes are compiled are provided in the materials and method section.
- https://doi.org/10.7554/eLife.06974.017
Figure 3—figure supplement 1
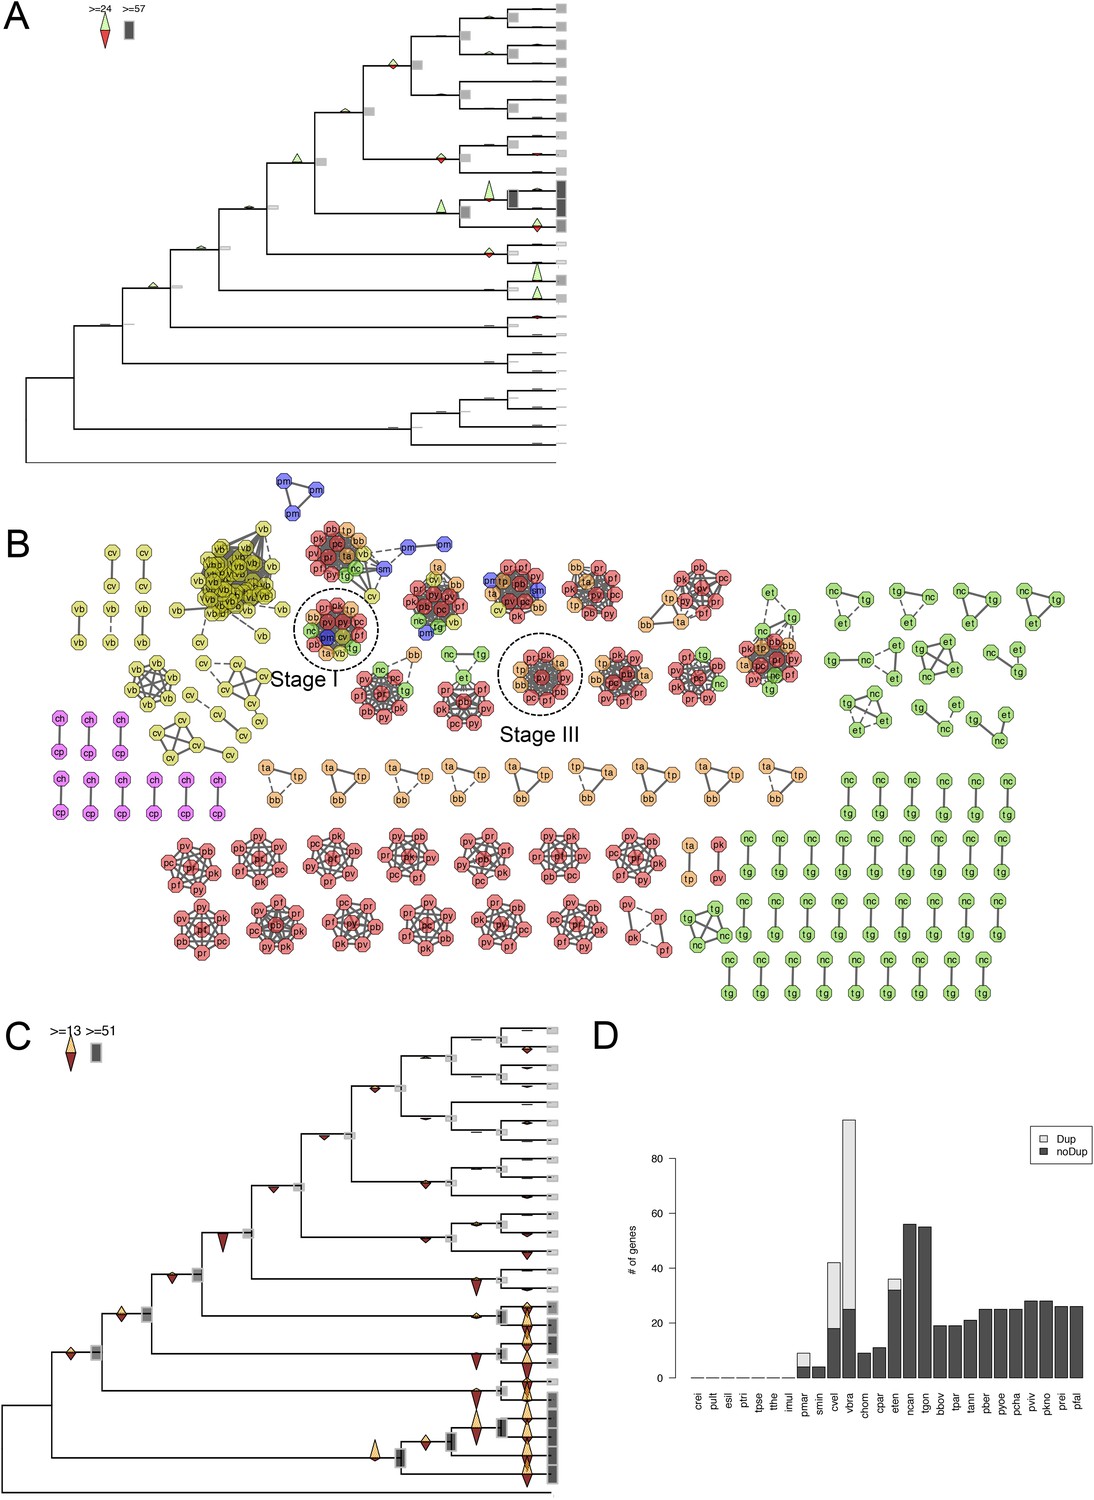
Evolutionary history of apiAP2 genes.
(A) Gains and losses of apiAP2 genes inferred with Dollo parsimony. Triangles pointing upward indicate gains, triangles pointing downward losses, and the total number of orthogroups at that particular node are proportional to the length or the shade thickness of the gray boxes. (B) Network view of amino acid sequence homology among all apiAP2. Edges are drawn depending on the strength of the sequence homology: dotted (BLASTP E value <10−20) or solid (BLASTP E value <10−30). The two letters within the node refer to acronyms of the species name and the node color species group: red (Plasmodium); green (coccidians); magenta (Cryptosporidia); orange (piroplasms); yellow (chromerids); and navy (dinoflagellates). For example, nodes from P. falciparum are shaded red and lettered with ‘pf’. Connected nodes with different or the same species names indicate putative orthologs or paralog, respectively. Nodes without any edges, likely to be species-specific genes without other paralogs, were not displayed. Connections between nodes of different colors indicate deep evolutionary conservation. For example, connections between red and yellow nodes indicate orthologs shared between Plasmodium spp. and chromerids, which means that they have been gained by the proto-apicomplexan ancestor after its split from dinoflagellates (Stage I). (C) Gains and losses of DBD genes, excluding apiAP2, inferred with Dollo parsimony. (D) Bar chart showing putative apiAP2 paralogs (light gray), and singletons (black). We note a paucity of duplicate apiAP2 genes in apicomplexans compared to their abundance in chromerids.
Figure 3—figure supplement 2
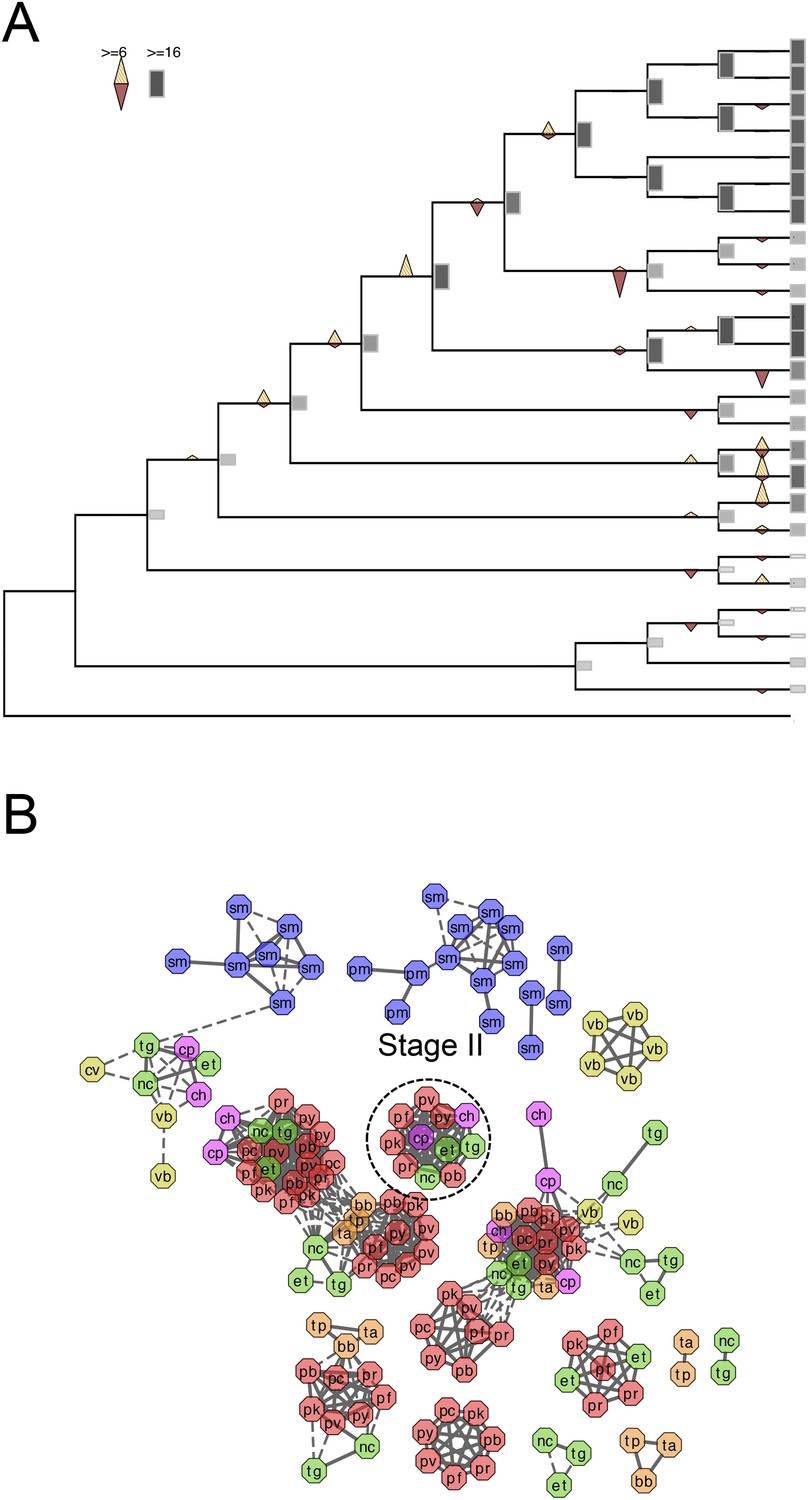
Evolutionary history of alveolins.
(A) Gains and losses of alveolins inferred with Dollo parsimony. Triangles pointing upward indicate gains, triangles pointing downward losses, and the total number of orthogroups at that particular node are proportional to the length or the shade thickness of the gray boxes. (B) Network view of amino acid sequence homology among all alveolins. Edges are drawn depending on the strength of the sequence homology: dotted (BLASTP E value <10−20) or solid (BLASTP E value <10−30). The two letters within the node refer to acronyms of the species name and the node color species group: red (Plasmodium); green (coccidians); magenta (Cryptosporidia); orange (piroplasms); yellow (chromerids); and navy (dinoflagellates).
Figure 3—figure supplement 3
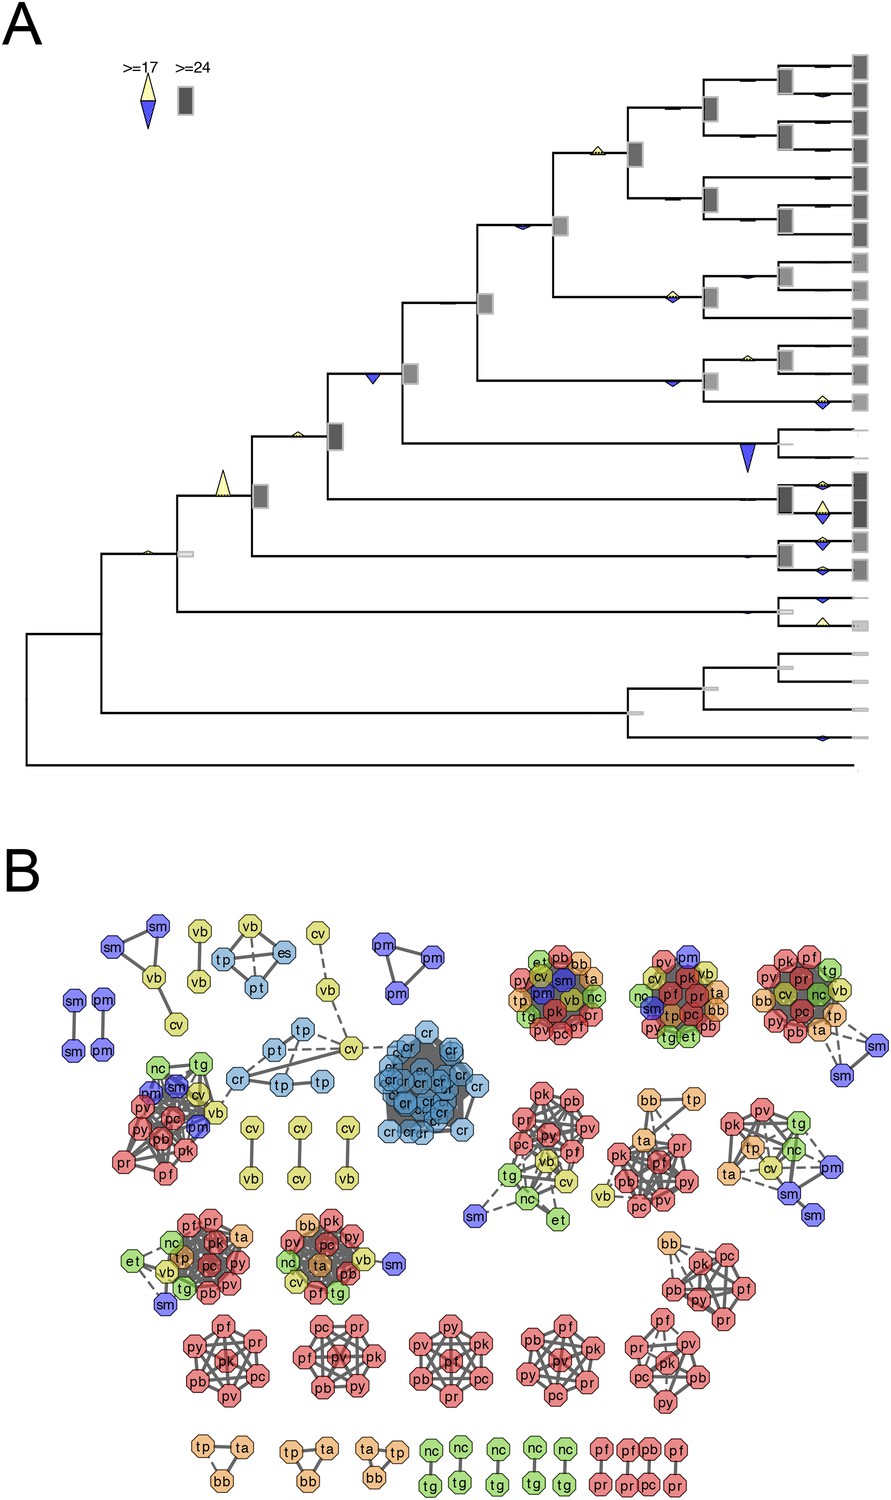
Evolutionary history of RAP genes.
(A) Gains and losses of RAP genes inferred with Dollo parsimony. Triangles pointing upward indicate gains, triangles pointing downward losses, and the total number of orthogroups at that particular node are proportional to the length or the shade thickness of the gray boxes. (B) Network view of amino acid sequence homology among all RAP genes. Edges are drawn depending on the strength of the sequence homology: dotted (BLASTP E value <10−20) or solid (BLASTP E value <10−30). The two letters within the node refer to acronyms of the species name and the node color species group: red (Plasmodium); green (coccidians); magenta (Cryptosporidia); orange (piroplasms); yellow (chromerids); and navy (dinoflagellates).
Figure 3—figure supplement 4

Domain architectures of extracellular proteins in chromerids and apicomplexans.
Examples of domain architectures of predicted chromerid and apicomplexan extracellular proteins and their phyletic distribution. (A) Extracellular proteins with apparent orthologs in coccidians (for example, Toxoplasma) and Cryptosporidium. (B) Extracellular proteins shared with Cryptosporidium, but not identified in Toxoplasma and other apicomplexans. (C) Extracellular proteins conserved as apparent orthologs throughout the Apicomplexa. (D) An example of an apparent alveolate extracellular protein conserved in chromerids, Perkinsus and ciliates, but absent in apicomplexans. (E) Lineage-specific extracellular proteins identified only in one or both chromerids. (F) Examples of the diversity of domain architectures within chromerids for CRMP family proteins. (G) Examples of apicomplexan-specific extracellular proteins. Descriptions of domains and representative genes are provided in Appendix 5. A yellow rectangle indicates predicted signal peptide sequence. TM and GPI denote predicted transmembrane domain and glycosylphosphatidylinositol (GPI anchor), respectively. Protein lengths are not drawn to scale.
Figure 4 with 1 supplement

Conserved transcriptional programs in apicomplexans and chromerids.
(A) Boxplot showing the extent of evolutionary conservation of transcriptional programs for all orthogroups or those with RAP domains. X-axis: ‘All’ (all orthogroups excluding RAP); ‘RAP’ (orthogroups with RAP domains). Y-axis: log-transformed odds-ratio, representing, for each orthogroup, the degree of overlap between its co-expressed orthogroups in Chromera and those in P. falciparum. (B) Bar chart showing the fraction of orthogroups (Y-axis) predicted to be targeted to mitochondria in both species (‘Materials and methods’). The number of genes are displayed below each bar. X-axis: ‘All’ (all orthogroups excluding the other two categories); ‘Coexpr’ (orthogroups co-expressed with RAP in both species); ‘RAP’ (orthogroups with RAP domains). The fractions in 'Coexpr' and 'RAP' groups were compared against the fraction in 'All', and p-values based Fisher's exact test are displayed above the bar. Files deposited in European Nucleotide Archive are listed in Figure 4—source data 1 with corresponding conditions. (C) Sub-cellular localization of RAP proteins encoded by TGME49_237010, TGME49_269830, and TGME49_289200 was tested in T. gondii by 3′ tagging of the endogenous genes with the coding sequence for the hemagglutinin epitope, together with a mitochondrial marker Tom40. See Supplementary file 6 for details of the localization predictions. (D) Distributions of Spearman's rank correlation coefficients of gene expression between all possible pairs from the 80 orthogroups implicated in invasion processes in apicomplexans (black outline) were compared against those from 80 randomly selected ones (histogram). The p value indicates statistical significance of the difference based on 10,000 random samplings. The 80 orthogroups and corresponding genes in Chromera and P. falciparum are listed in Figure 4—source data 2. (E) Heatmap showing a matrix of correlation coefficients amongst the 80 orthogroups. Based on a hierarchical clustering, we classified them into six co-expression modules, labeled as numeral 1–6. (F) Heatmap showing correlation coefficients with striated fiber assemblin (SFA) (Cvel_872). The color scheme is the same as in (E). (G) Heatmap indicating statistical significance of conserved transcriptional program, that is, the odds-ratio as defined in (A) (Fisher's exact test, p < 0.05 (gray); p < 0.005 (black)).
-
Figure 4—source data 1
RNA-seq libraries of Chromera velia under various growth conditions.
The list of growth conditions and the file names are given.
- https://doi.org/10.7554/eLife.06974.023
-
Figure 4—source data 2
List of genes implicated in invasion processes in apicomplexans.
They were either annotated as implicated in invasion processes in P. falciparum or orthologs of those in other apicomplexans. Pubmed ID number or the database from which the annotation was obtained is listed in the last two columns.
- https://doi.org/10.7554/eLife.06974.024
-
Figure 4—source data 3
Evolutionary conservation of 12 orthogroups with RAP domains (for 'RAP' category in Figure 4A).
IDs of the genes in Chromera and Plasmodium falciparum are list with odds-ratios and p-values based on Fisher's exact test.
- https://doi.org/10.7554/eLife.06974.034
Figure 4—figure supplement 1

Mitochondrial targeting of RAP and its putative role in mitochondrial metabolism.
(A) Heatmap displaying the extent of association between correlation coefficients of orthogroup-pairs in P. falciparum (Y-axis) and those in Chromera (X-axis). The color scale represents the percentile of the observed frequency amongst randomly expected frequencies when the orthology were shuffled. We observed high percentiles along the 45° diagonal, indicating that the number of orthogroup-pairs that are co-expressed in both species is greater than expected by chance. (B) Bar chart showing the fraction of orthogroups (Y-axis) predicted to be targeted to mitochondria in selected species. The orthogroups and the three categories, that is, ‘All’, ‘Coexpr’, and ‘RAP’ (X-asis) are based on those from Plasmodium and Chromera (Figure 4B). (C) Chromera expression profiles under diverse growth conditions (‘Materials and methods’) are shown for mitochondria targeted RAPs and co-expressed orthogroups. Expression levels were scaled to have a mean of 0 and a standard deviation of 1. Y-axis: orthogroups ordered based on the hierarchical clustering of their expression patterns. X-axis: combinations of different salt and iron (Fe) concentrations and temperatures in which the Chromera cultures were grown. The color scale ranged from red (low expression) to green (high expression). The asterisk (*) denotes genes encoding NADH-dependent oxidoreductase and mitochondrial acidic matrix protein 33, involved in mitochondrial oxidative phosphorylation. (D) Abundance of RAP proteins in alveolate species.
Additional files
-
Supplementary file 1
Summary of the genome assembly and the annotated genes of Chromera velia, Vitrella brassicaformis. Details of transposable elements on the genome are shown in Supplementary file 2.
- https://doi.org/10.7554/eLife.06974.026
-
Supplementary file 2
Summary of transposable elements on the Chromera velia and Vitrella brassicaformis genomes.
- https://doi.org/10.7554/eLife.06974.027
-
Supplementary file 3
Genes encoding proteins involved in forming photosystems in Chromera velia and Vitrella brassicaformis.
- https://doi.org/10.7554/eLife.06974.028
-
Supplementary file 4
Genes encoding enzymes involved in heme biosynthesis in chromerids.
- https://doi.org/10.7554/eLife.06974.029
-
Supplementary file 5
Domains of extracellular proteins and example genes in chromerids. (a) Species abbreviations: Perkinsus marinus, P. mar; Chromera velia, C. vel; Vitrella brassicaformis, V. bra; and Cryptosporidium parvum, C. par. (b) Domain accession identifiers. Domain information can be retrieved at the NCBI Conserved Domain website: (http://www.ncbi.nlm.nih.gov/cdd). (c) At the time of publication this accession identifier was valid but the relevant entry could not be retrieved via the NCBI Conserved Domain website: (http://www.ncbi.nlm.nih.gov/cdd). (d) A domain having two cysteines and thus far found only as tandem arrays in proteins of Chromera velia (for example, Cvel_967). (e) Cysteine-rich domain found in Cryptosporidium oocyst wall proteins (COWP) and in coccidians. (f) Archaeal protease-type repeats first described in the Cryptosporidium predicted EC protein, cgd7_4560. The domain was previously described as ‘A small domain with characteristically spaced cysteine residues that is fused to a papain-like protease domain in the secreted protein AF1946 from Archaeoglobus fulgidus (Templeton et al., 2004a)’. (g) The domain was previously described as ‘Domain typically with 6 cysteines, seen thus far mainly in animals with a few occurrences in plants. It is found in the sea anemone toxin metridin and fused to animal metal proteases, plant prolyl hydroxylases and is vastly expanded in the genome of Caenorhabditis elegans (Templeton et al., 2004a)’. (h) The domain was previously described as ‘β-strand rich domain, predicted to form a β-sandwich structure that is found in bacterial secreted levanases and glucosidases (Templeton et al., 2004a)’.
- https://doi.org/10.7554/eLife.06974.030
-
Supplementary file 6
Mitochondrial localization predictions of selected RAP genes. Various algorithmic methods were used to identify candidates for experimental validations in Toxoplasma. Classifications are given in the column ‘Loc’ as M-mitochondria; S- secreted; O-others.
- https://doi.org/10.7554/eLife.06974.031
Download links
A two-part list of links to download the article, or parts of the article, in various formats.
Downloads (link to download the article as PDF)
Open citations (links to open the citations from this article in various online reference manager services)
Cite this article (links to download the citations from this article in formats compatible with various reference manager tools)
Chromerid genomes reveal the evolutionary path from photosynthetic algae to obligate intracellular parasites
eLife 4:e06974.
https://doi.org/10.7554/eLife.06974


