Differential cell autonomous responses determine the outcome of coxsackievirus infections in murine pancreatic α and β cells
- Université Libre de Bruxelles, Belgium
- National Institute for Health and Welfare, Finland
- University of Exeter Medical School, United Kingdom
Figures
Figure 1 with 3 supplements
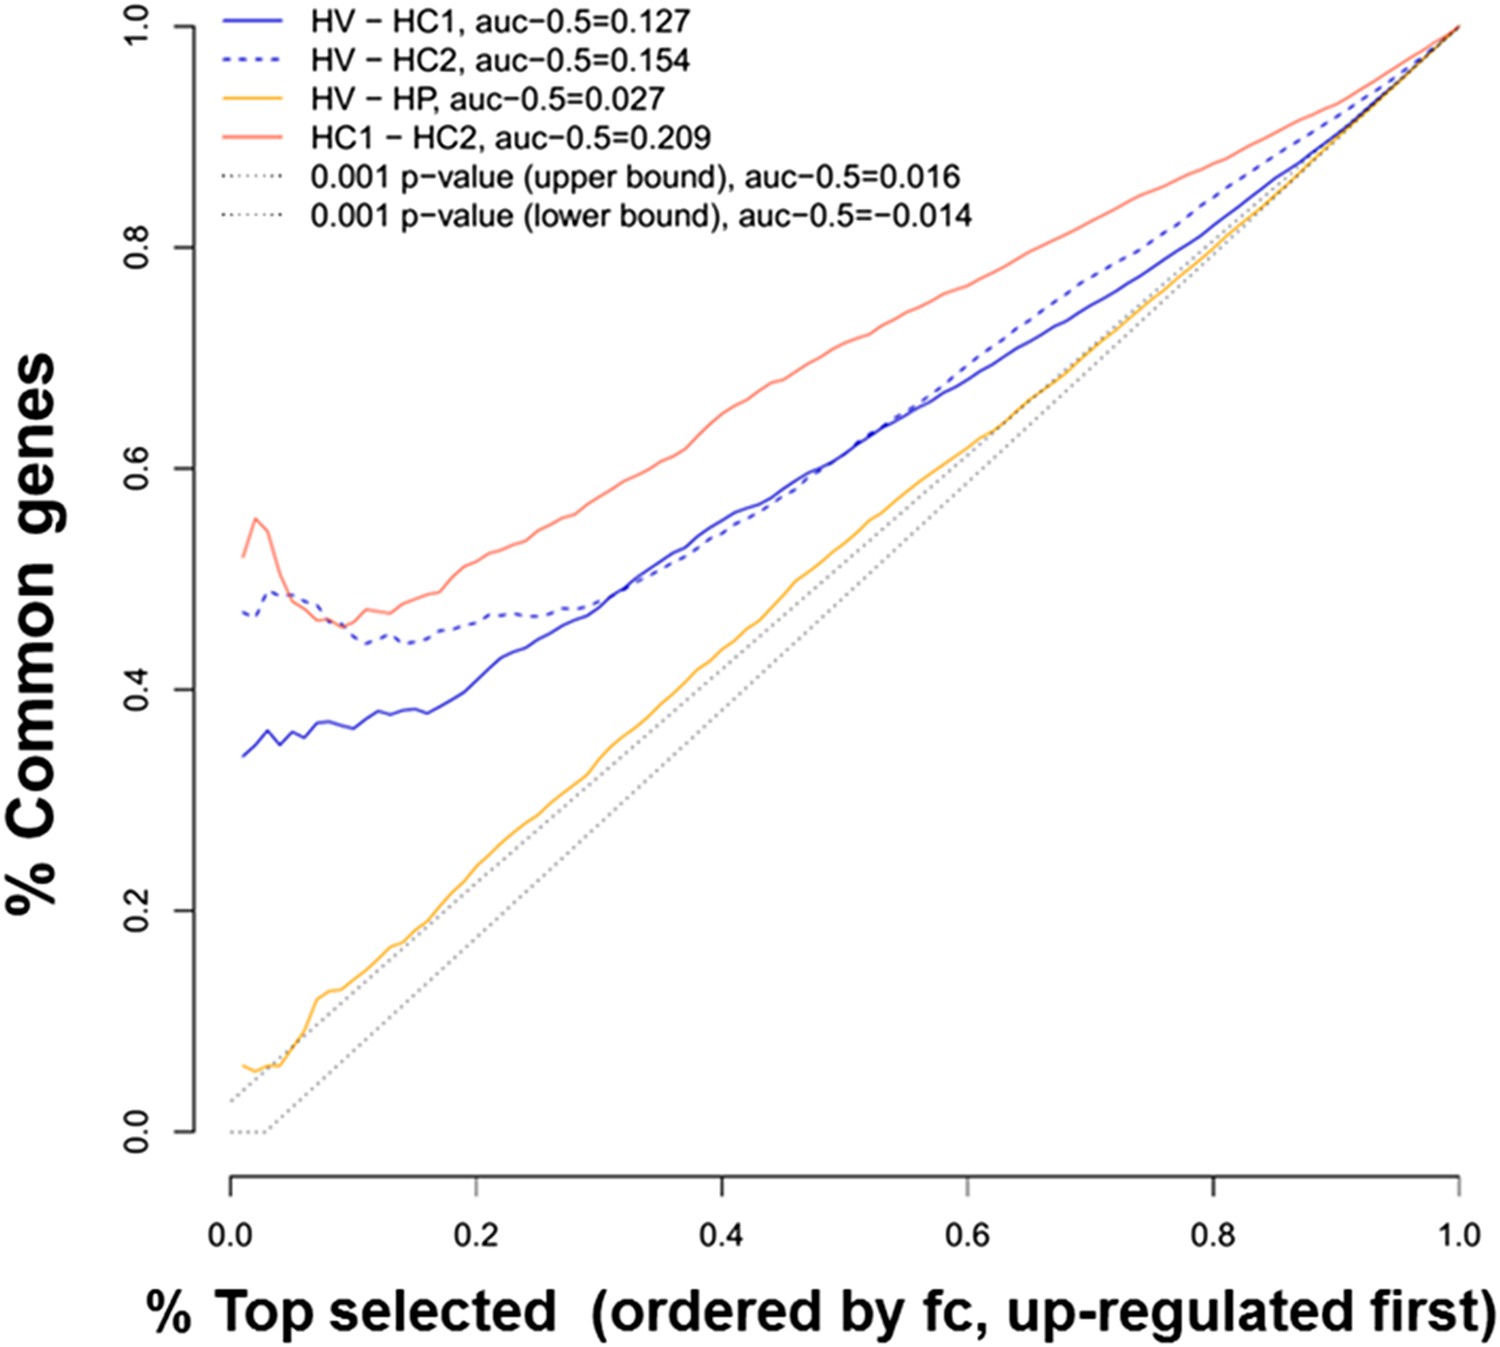
Ranking similarity between gene expression of human islets after cytokine exposure (HC1 and HC2) or after virus exposure (HV).
The similarity between HC1 and HC2 and between HV and palmitate exposure (HP) is also presented. The area under the curve (subtracted by a null threshold of 0.5) is indicated, as well as similarity curves corresponding to a p-value of 0.001. The figure represents the ranking similarity ordered by up-regulation. (For a detailed explanation of the calculations done, see ‘Materials and methods’, ‘gene expression ranking similarity’).
Figure 1—figure supplement 1

Venn diagram of the up-regulated genes in human islets exposed to cytokines (HC1 and HC2) or infected with CVB5 (HV).
In each data set, a group of up-regulated genes was identified. The criterion for differential expression was p-value < 0.05 (paired t-test; BH-adjusted in the HC1 case). Up-regulation was identified through mean fold change. 894 genes were identified to be up-regulated in HC1, 1100 in HC2, and 954 in HV. The number of genes in each separated area is indicated. The intersection between HC1 and HV has a p-value of 2.46e-151, between HC2 and HV 2.78e-180, and between HC1 and HC2 approximately e-897 (hypergeometric distribution, 9504 genes in total).
Figure 1—figure supplement 2
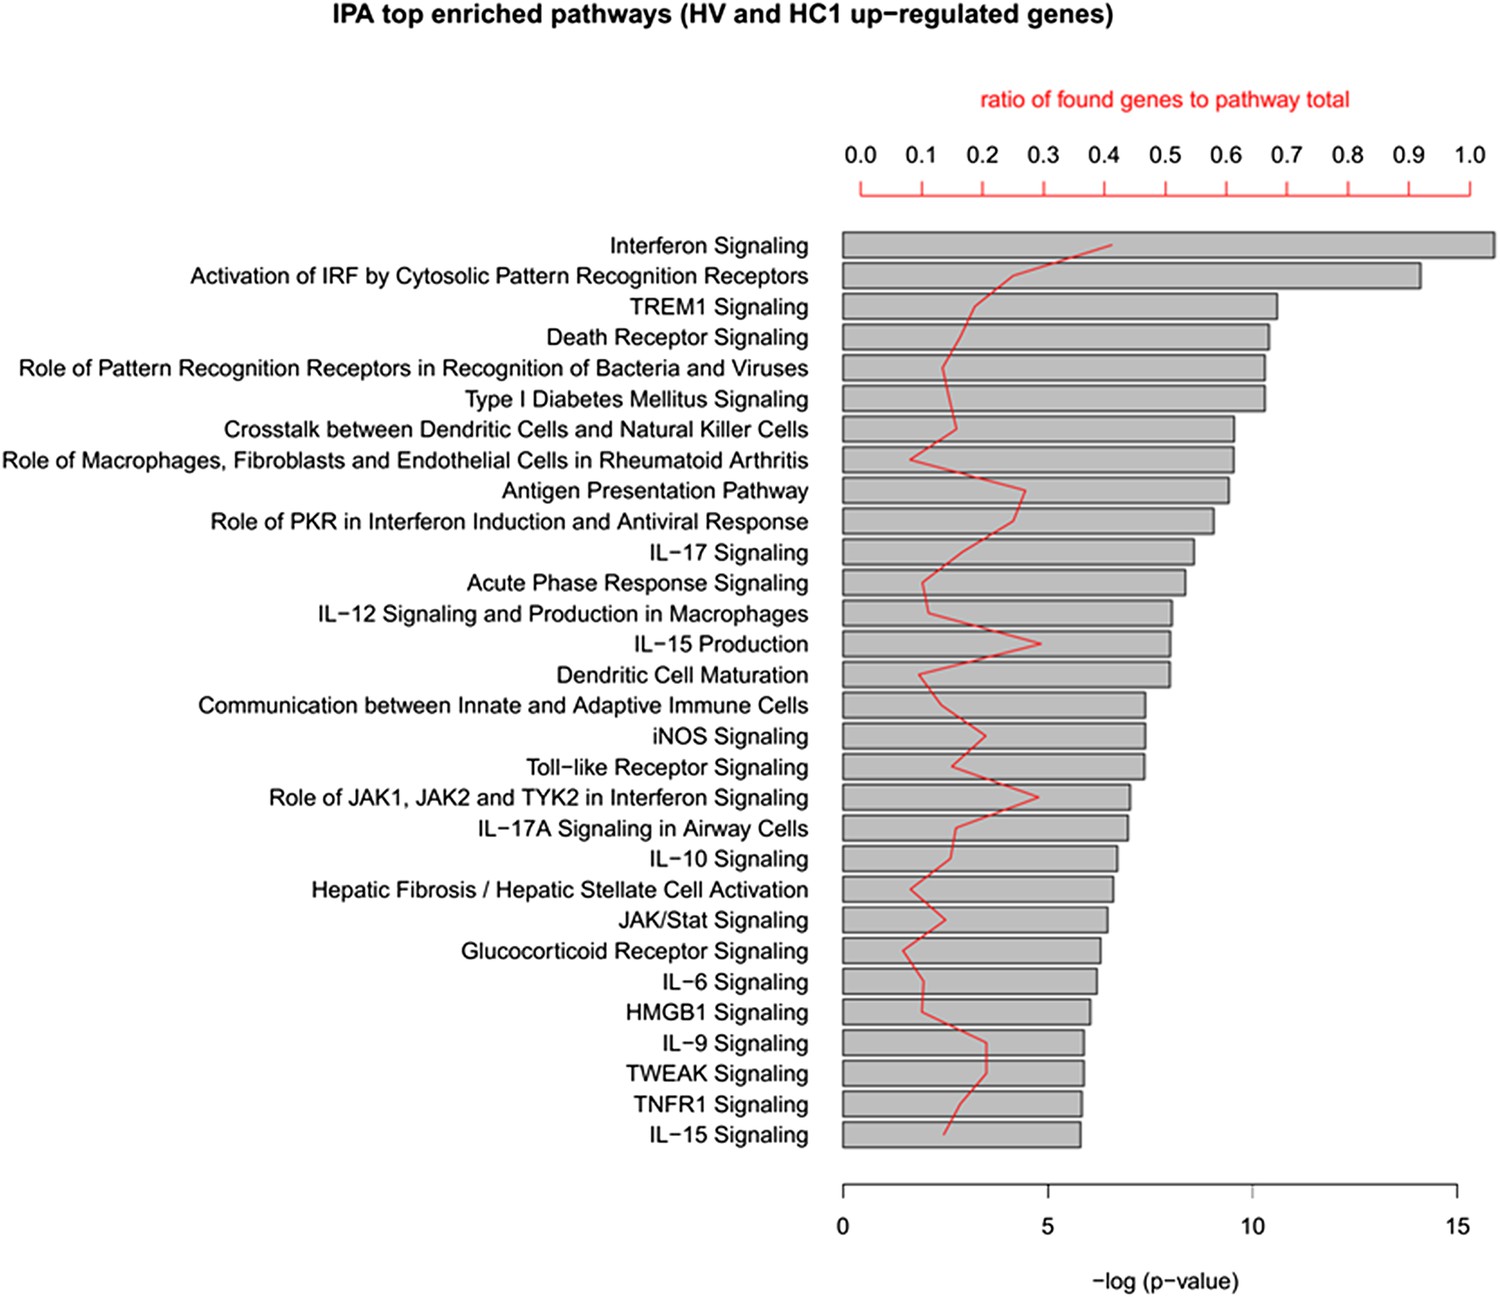
IPA analysis of the up-regulated genes in human islets exposed to cytokines HC1 or infected with CVB5 (HV).
The up-regulated genes in HC1 and HV (348 in total) were analyzed in QIAGEN's Ingenuity Pathway Analysis (IPA) to identify enriched pathways in both cytokine-treated and virus-infected human islets. The top 30 pathways (ordered by p-value) are shown. Enrichment p-value (Fisher exact test) and ratio to the number of pathway elements are also indicated. QIAGEN's Ingenuity Pathway Analysis (IPA, QIAGEN, Redwood City, www.qiagen.com/ingenuity).
Figure 1—figure supplement 3
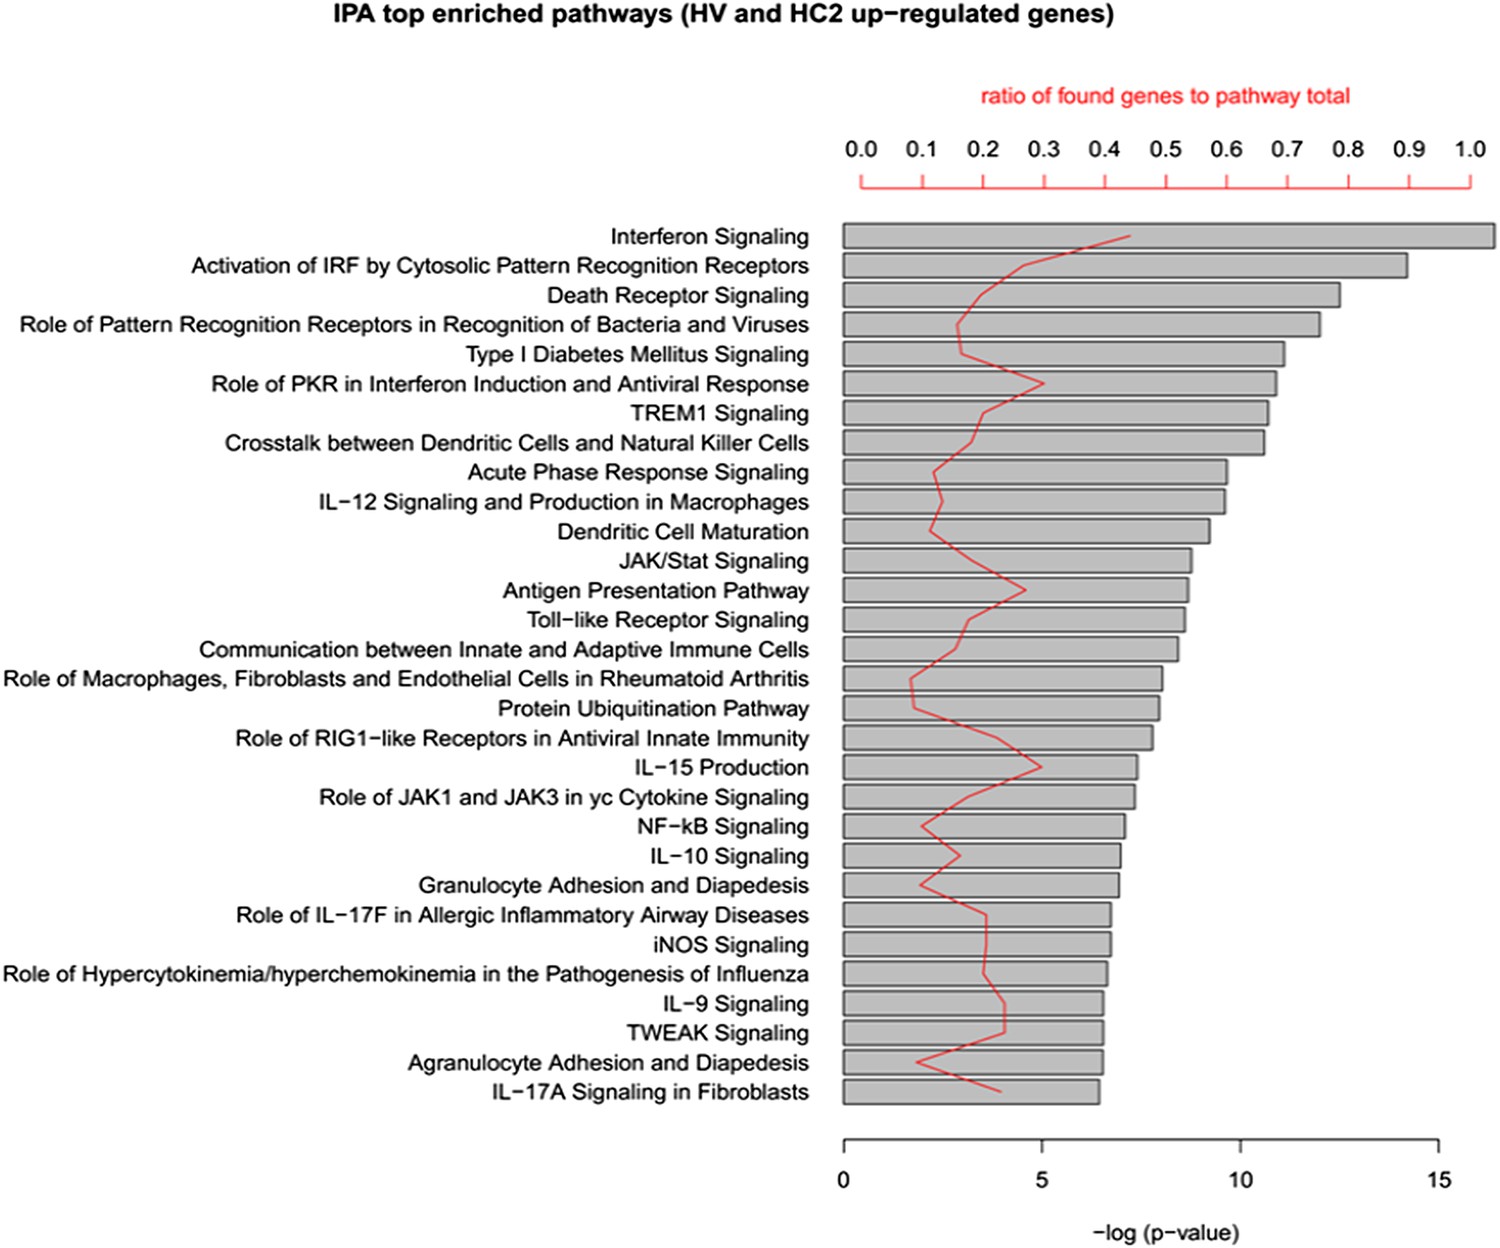
IPA analysis of the up-regulated genes in human islets exposed to cytokines HC2 or infected with CVB5 (HV).
The up-regulated genes in HC2 and HV (413 in total) were analyzed in QIAGEN's IPA to identify enriched pathways in both cytokine-treated and virus-infected human islets. The top 30 pathways (ordered by p-value) are shown. Enrichment p-value (Fisher exact test) and ratio to the number of pathway elements are also indicated. QIAGEN's Ingenuity Pathway Analysis (IPA, QIAGEN, Redwood City, www.qiagen.com/ingenuity).
Figure 2
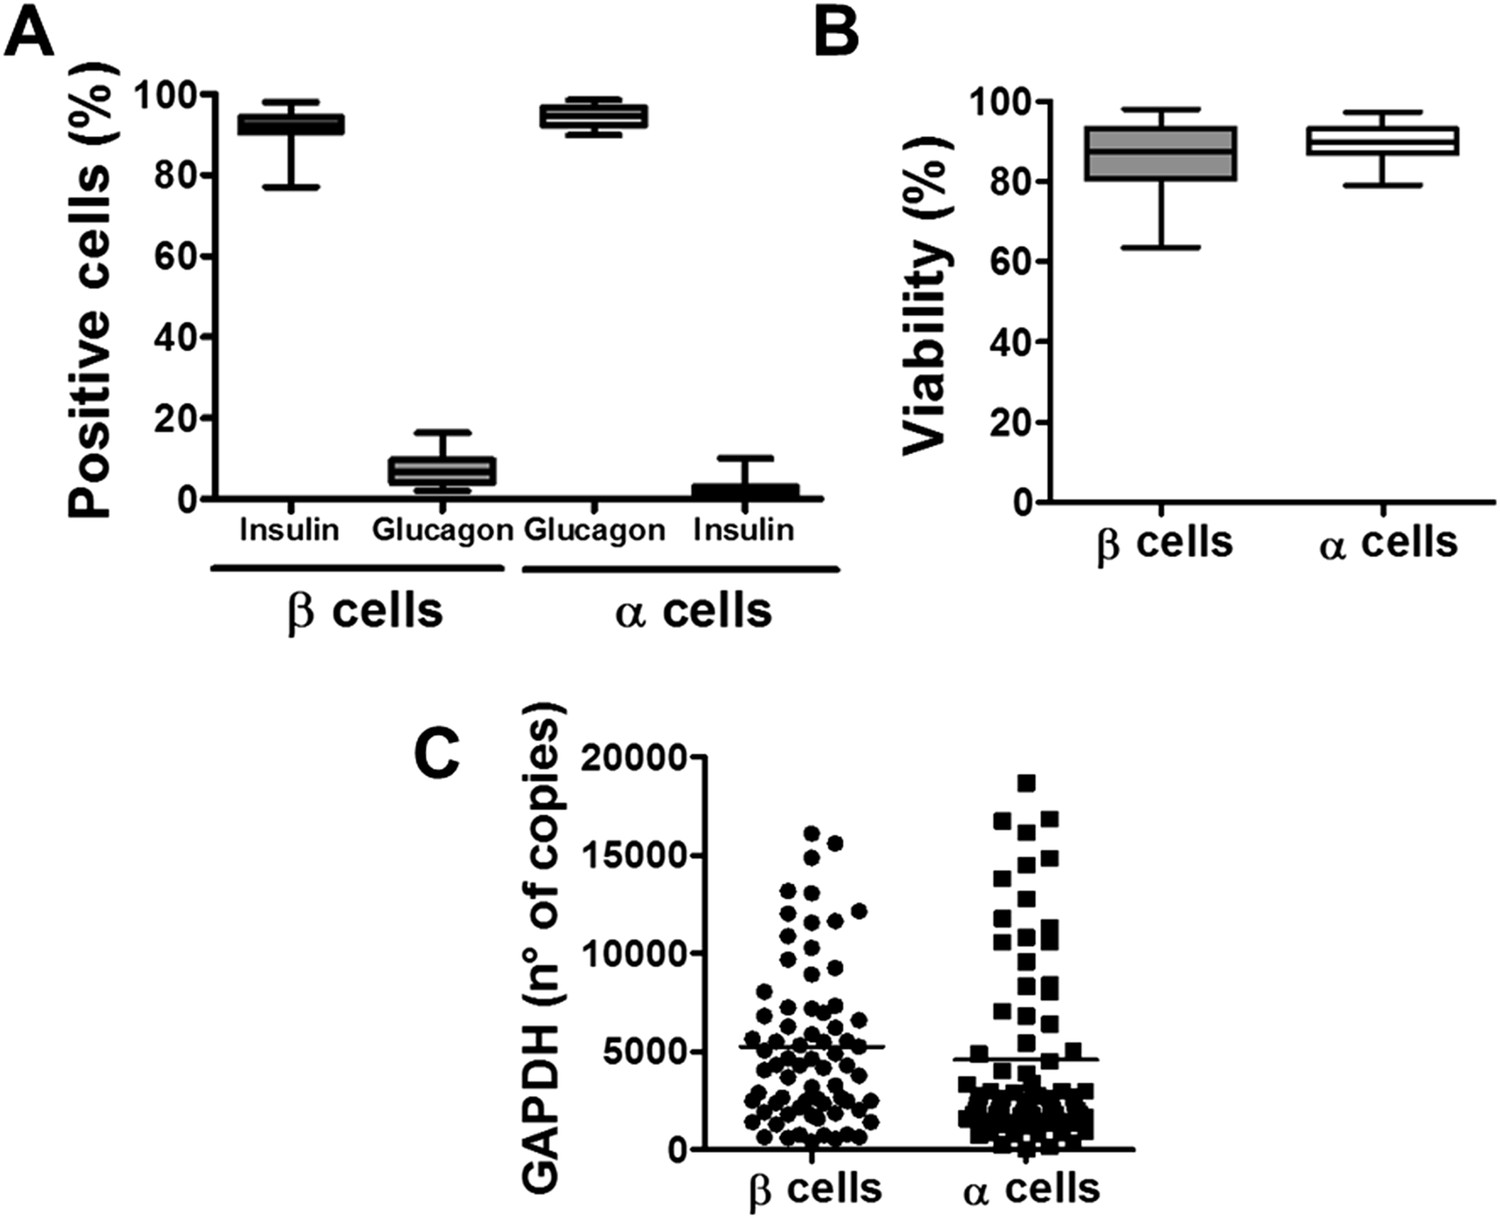
Purity, viability, and GAPDH mRNA expression of the β- and α-cell fractions after single-step FACS purification.
(A) Immunostaining for insulin or glucagon of the rat islet cell preparations used in this study. Percentage of insulin- and glucagon-positive cells in the β and α cell preparations. (B) Cell viability was evaluated by staining the β and α cells with the nuclear dyes Hoechst 33342 and propidium iodide after 4 days in culture. Results are plotted as box plots, indicating lower quartile, median, and higher quartile, with whiskers representing the range of the remaining data points of 32 independent preparations. (C) GAPDH values were measured by RT-PCR and compared with a standard curve. Results are plotted as scatter dot plot of each single measurement (n = 70 for each cell type).
Figure 3 with 7 supplements
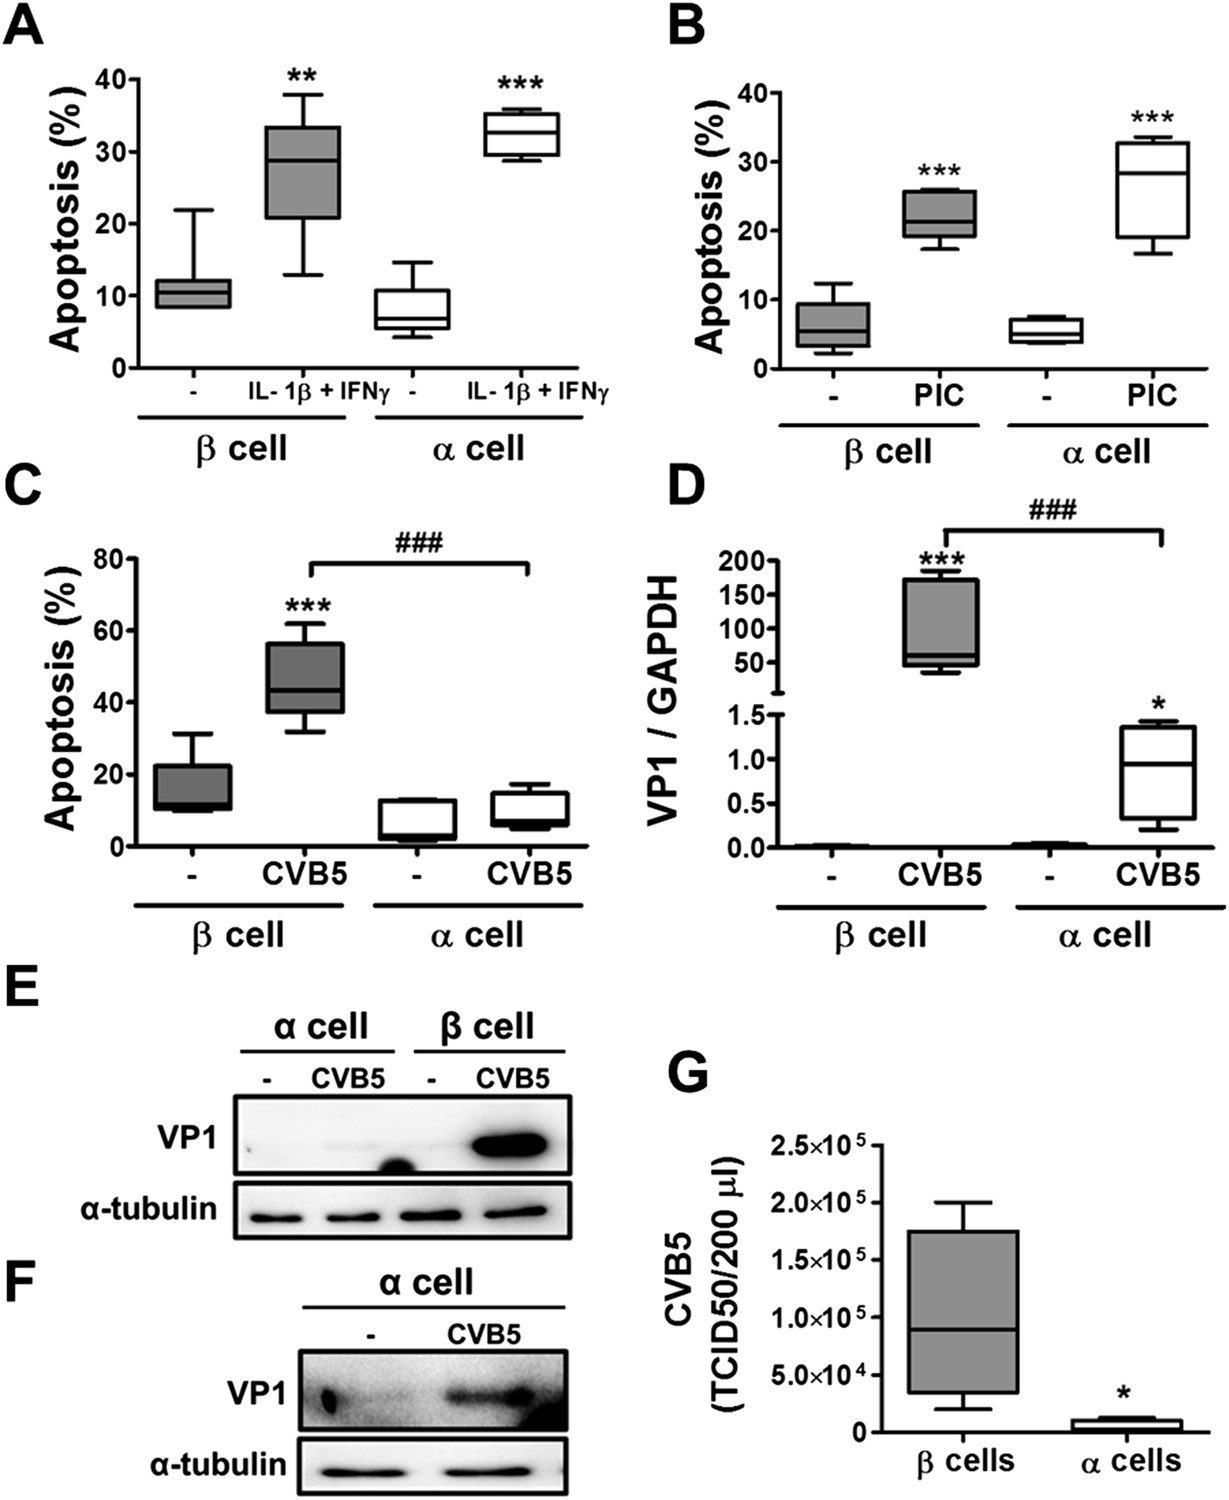
Pancreatic α cells are more resistant than β cells against CVB5- but not against cytokine- or PIC-induced cell death.
FACS-purified rat β and α cells (>90% purity for both cell types) were treated with interleukin-1β (IL-1β) + type II interferon (IFNγ) (50 or 500 U/ml, respectively) (A) or PIC (1 μg/ml) for 24 hr or infected with CVB5 (multiplicity of infection—M.O.I. 5) for 36 hr (C–G). (A–C) Apoptosis was evaluated by staining with the nuclear dies Hoechst 33342 and PI. (D) VP1 mRNA expression was assayed by RT-PCR and normalized by the housekeeping gene GAPDH. (E and F) The figures show representative Western blots of VP1 protein expression after CVB5 infection and α-tubulin for loading control. (F) The Western blot (E) was overexposed to allow visualization of VP1 expression in α cells. (G) Titration of the supernatants from β and α cells infected with CVB5 for 36 hr. Results of 4–6 experiments are plotted as box plots, indicating lower quartile, median, and higher quartile, with whiskers representing the range of the remaining data points; *p < 0.05, **p < 0.01, and ***p < 0.001 treated vs untreated (A and B) or CVB5 vs mock infection (C, D, and G); ###p < 0.001 as indicated by bars; ANOVA followed by Student's t-test with Bonferroni correction.
Figure 3—figure supplement 1
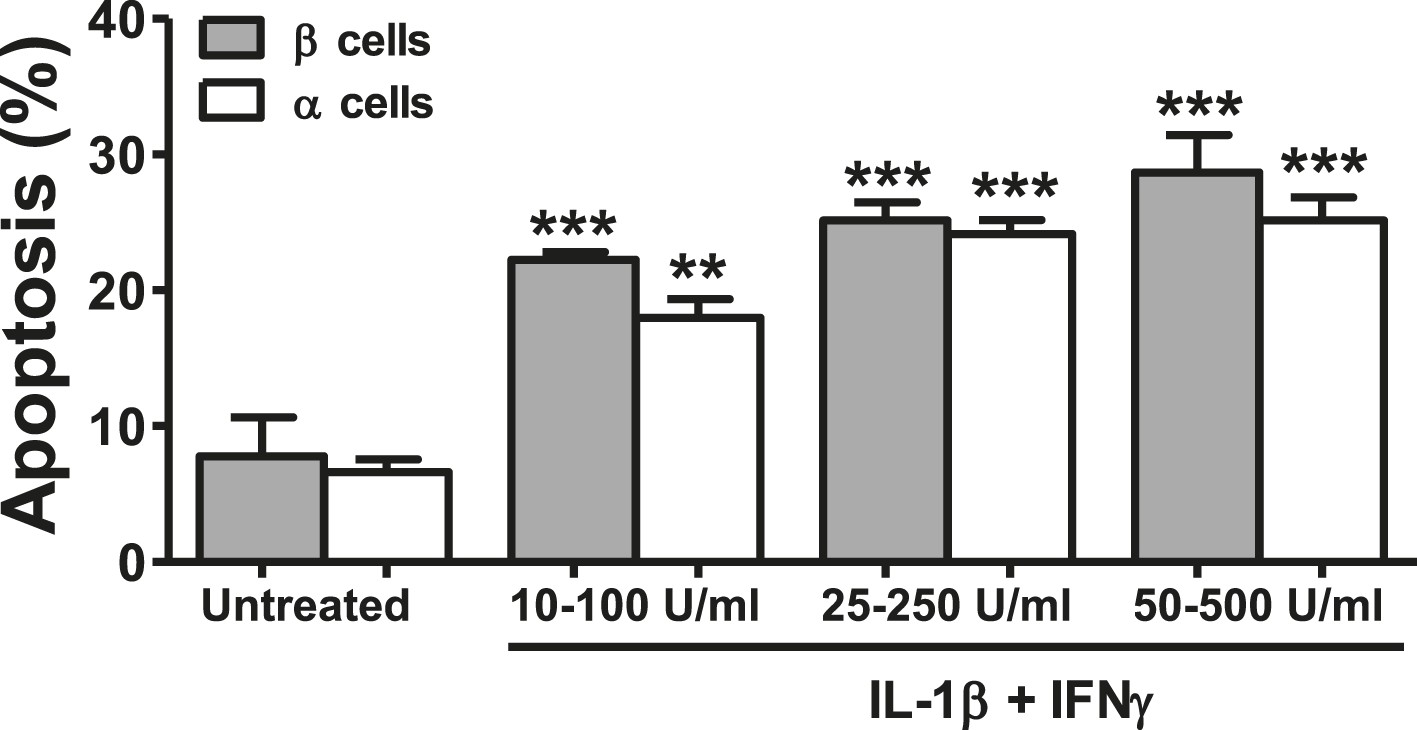
Dose-response of cytokine-induced apoptosis in pancreatic α and β cells.
FACS-purified rat β and α cells (>90% purity for both cell types) were treated with different concentrations of IL-1β + IFNγ, as indicated in the figure, for 24 hr. Apoptosis was evaluated by staining with the nuclear dies Hoechst 33342 and PI. Results are mean and SEM of 3 independent experiments; **p < 0.01 and ***p < 0.001 treated vs untreated; ANOVA followed by Student's t-test with Bonferroni correction.
Figure 3—figure supplement 2
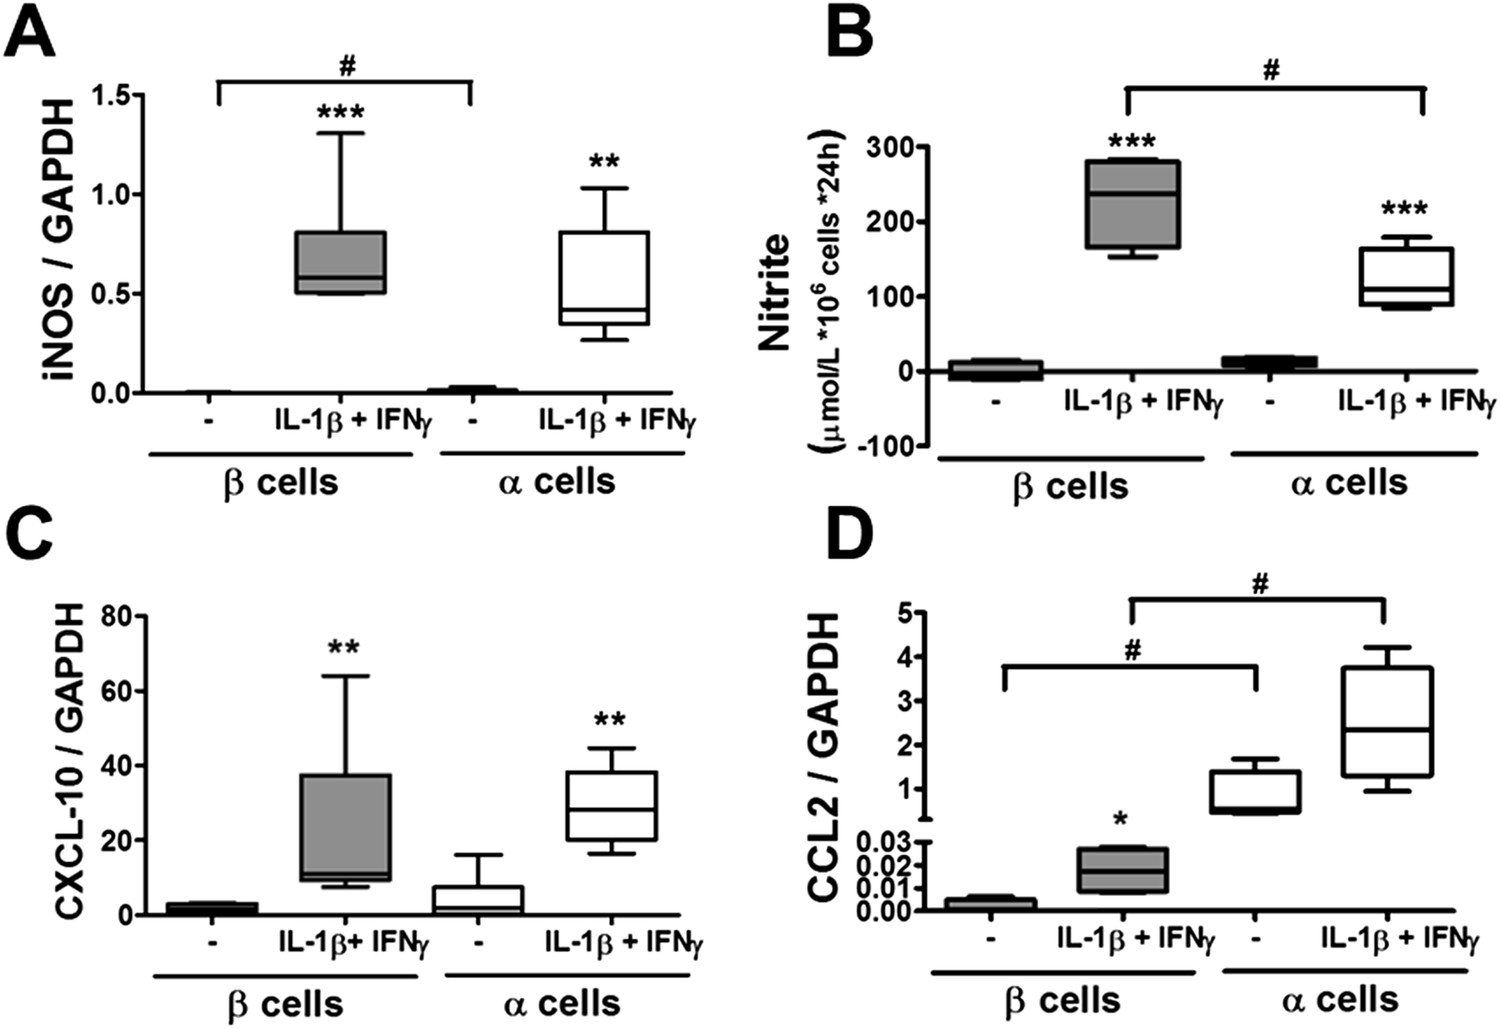
Pancreatic rat α and β cells have similar NO production, cytokine, and chemokine expression following exposure to cytokines.
FACS-purified β and α cells (>90% purity for both cell types) were treated with IL-1β + IFNγ (50 or 500 U/ml, respectively) (A–D). iNOS (A), CXCL10 (C), and CCL2 (D) mRNA expression were assayed by RT-PCR and normalized by the housekeeping gene GAPDH. (B) Cytokine-induced NO production by primary rat β or α cells was evaluated by medium nitrite accumulation. Results of 4–5 experiments are plotted as box plots, indicating lower quartile, median, and higher quartile, with whiskers representing the range of the remaining data points; *p < 0.05, **p < 0.01, and ***p < 0.001 treated vs untreated; #p < 0.05 as indicated by bars; ANOVA followed by Student's t-test with Bonferroni correction.
Figure 3—figure supplement 3
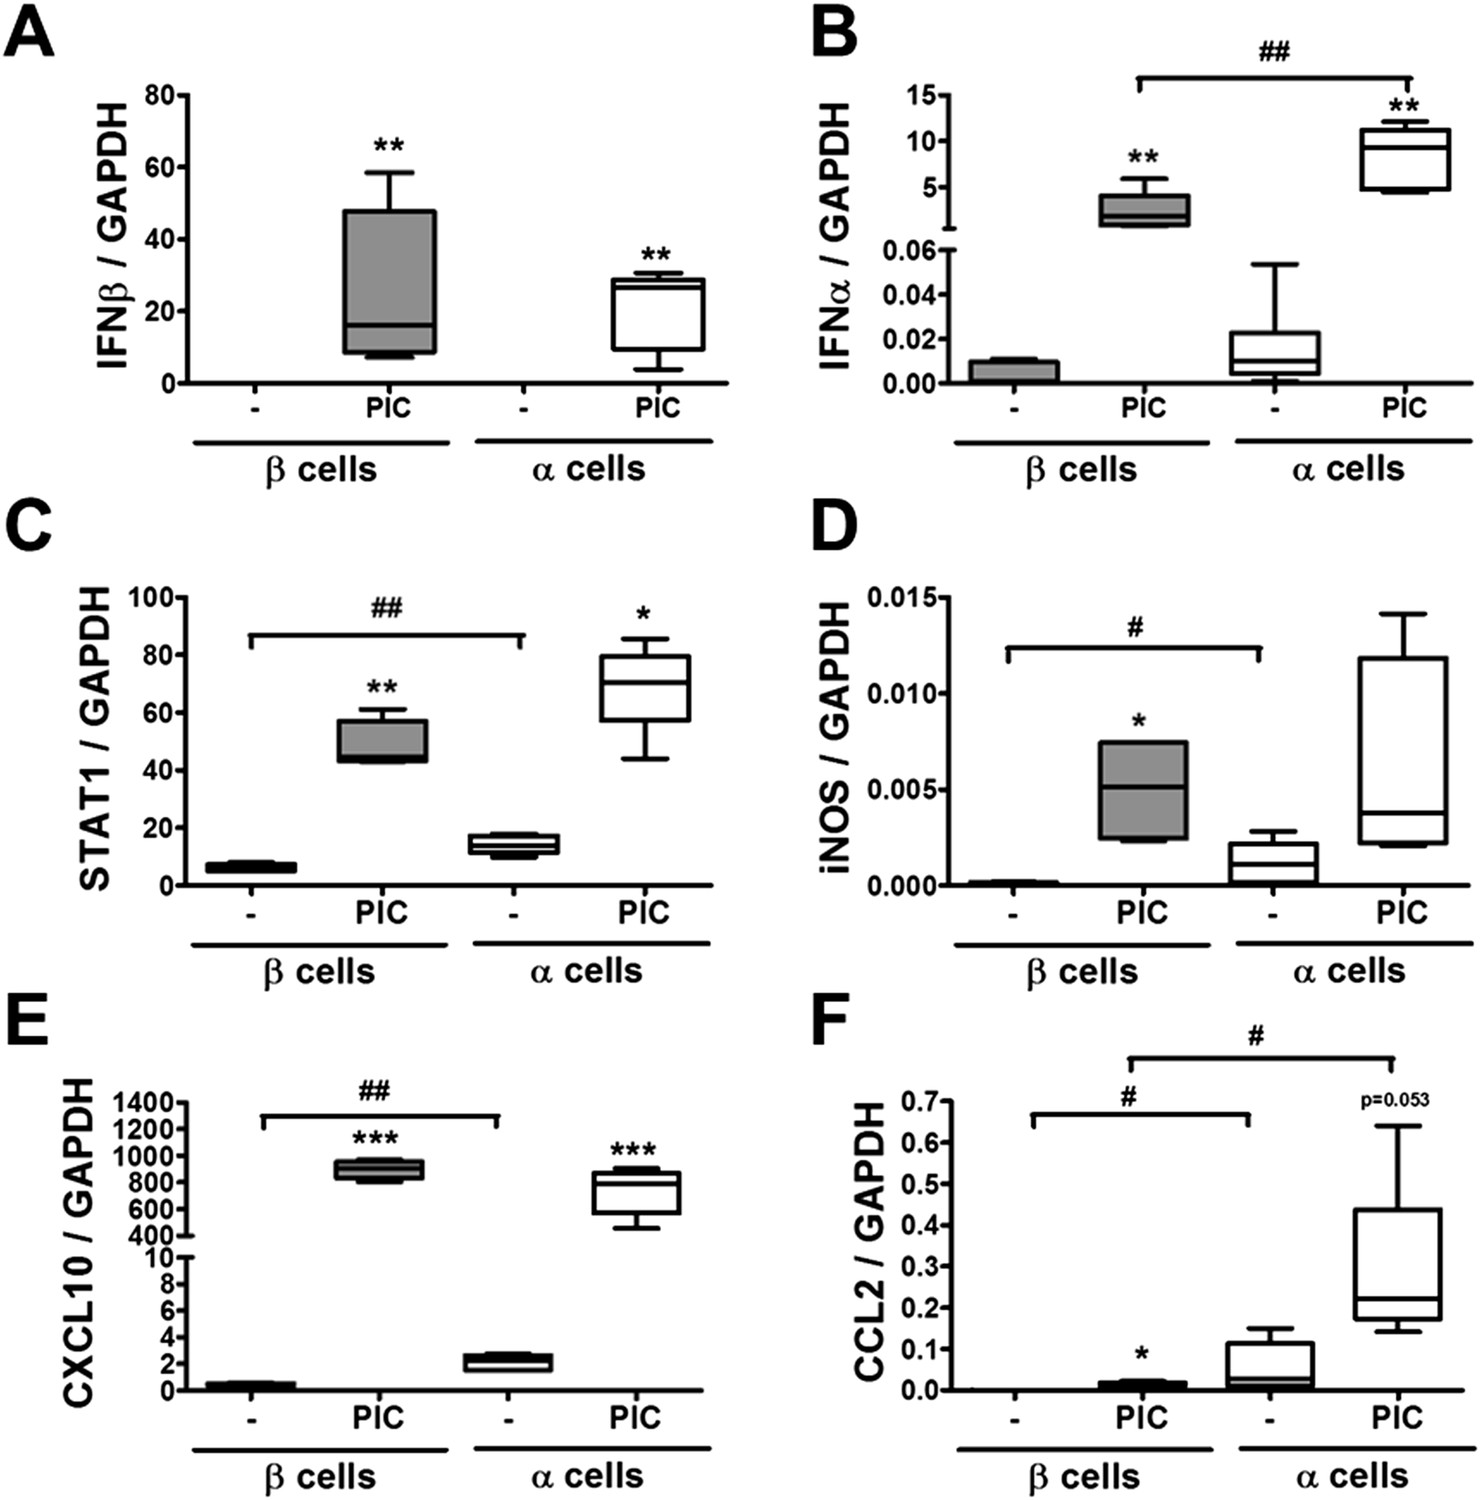
Pancreatic rat α and β cells have similar cytokine and chemokine expression following exposure to PIC.
FACS-purified β and α cells (>90% purity for both cell types) were treated with intracellular PIC (1 μg/ml) for 24 hr (A–F). IFNβ (A), IFNα (B), STAT1 (C), iNOS (D), CXCL10 (E), and CCL2 (F) mRNA expression were assayed by RT-PCR and normalized by the housekeeping gene GAPDH. Results of 4–5 experiments are plotted as box plots, indicating lower quartile, median, and higher quartile, with whiskers representing the range of the remaining data points; *p < 0.05, **p < 0.01, and ***p < 0.001 treated vs untreated; #p < 0.05 and ##p < 0.01 as indicated by bars; ANOVA followed by Student's t-test with Bonferroni correction.
Figure 3—figure supplement 4
Prolonged time-course of CVB5-induced apoptosis in pancreatic α and β cells.
FACS-purified rat β and α cells (>90% purity for both cell types) were infected with CVB5 (multiplicity of infection—M.O.I. 5) for 48, 72, or 96 hr. Apoptosis was evaluated by staining with the nuclear dies Hoechst 33342 and PI. Results are mean and SEM of 3 independent experiments; ***p < 0.001 CVB5 vs mock infection; ###p < 0.001 as indicated by bars; ANOVA followed by Student's t-test with Bonferroni correction; h.p.i., hours post-infection.
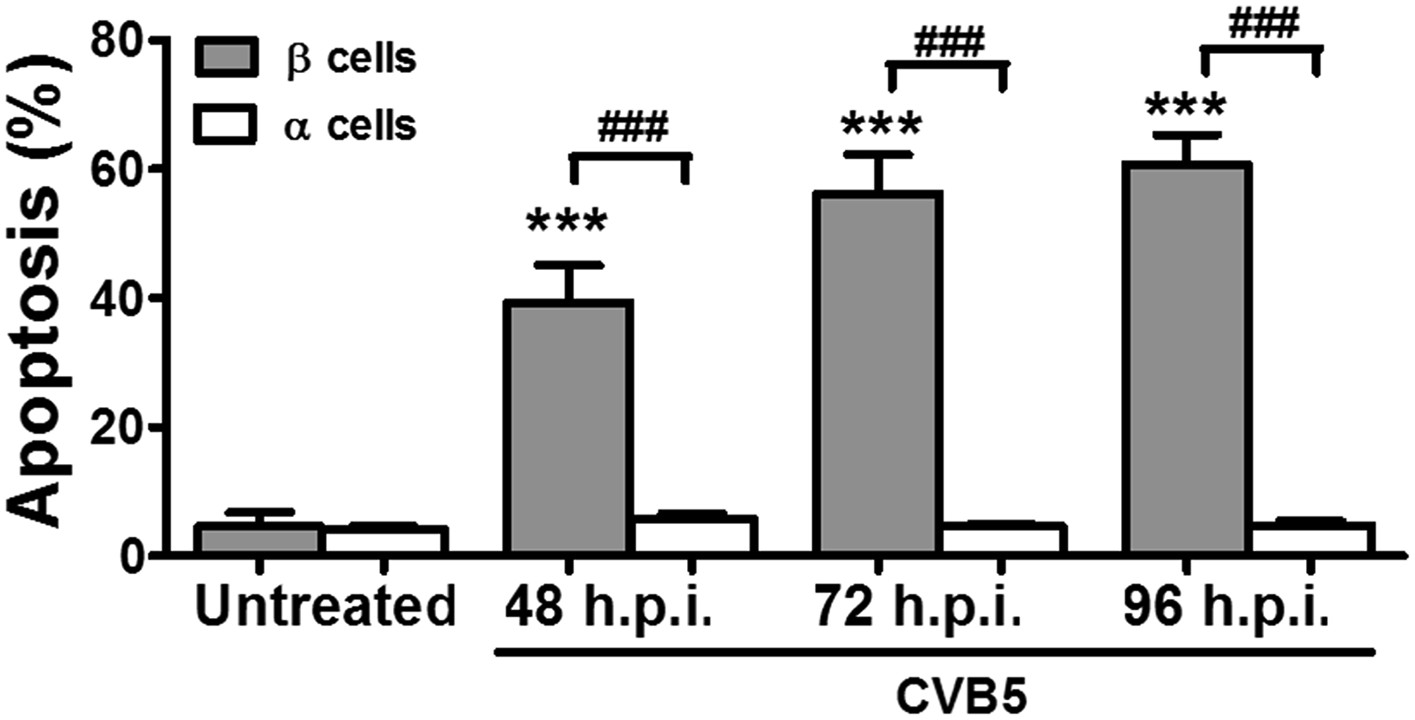
Figure 3—figure supplement 5

UV-inactivated CVB5 does not induce cell death in pancreatic α and β cells.
FACS-purified rat β and α cells (>90% purity for both cell types) were infected with CVB5 (multiplicity of infection—M.O.I. 5) or UV-inactivated CVB5 (1000 J/m2) for 36 hr. Apoptosis was evaluated by staining with the nuclear dies Hoechst 33342 and PI. Results are mean and SEM of 3 independent experiments; #p < 0.05 CVB5 vs. UV-inactivated CVB5 as indicated by bars; ANOVA followed by Student's t-test with Bonferroni correction.
Figure 3—figure supplement 6
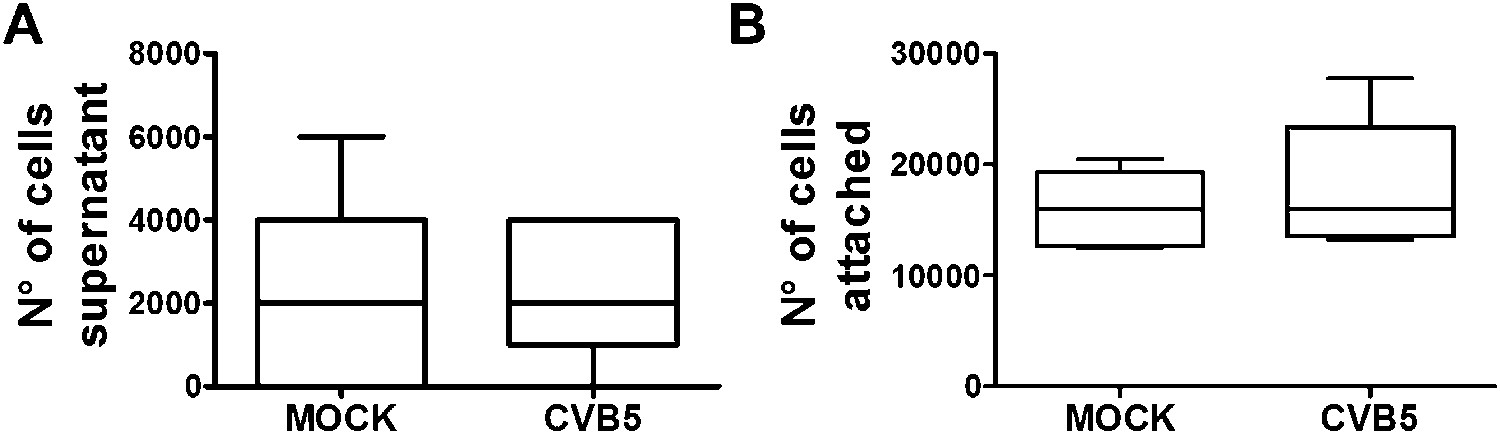
Cell counting after CVB5 infection of pancreatic α cells.
FACS-purified rat α cells (>90% purity) were infected with CVB5 (M.O.I. 5) for 36 hr. Supernatants were collected and the cells attached to the well trypsinized and also collected for quantification. The counting of supernatant cells (A) or attached cells (B) was performed in Neubauer chambers, and each point was measured in triplicate by two observers, one of them unaware of sample identity. Results are mean and SEM of 4 independent experiments; Student's t-test with Bonferroni correction.
Figure 3—figure supplement 7
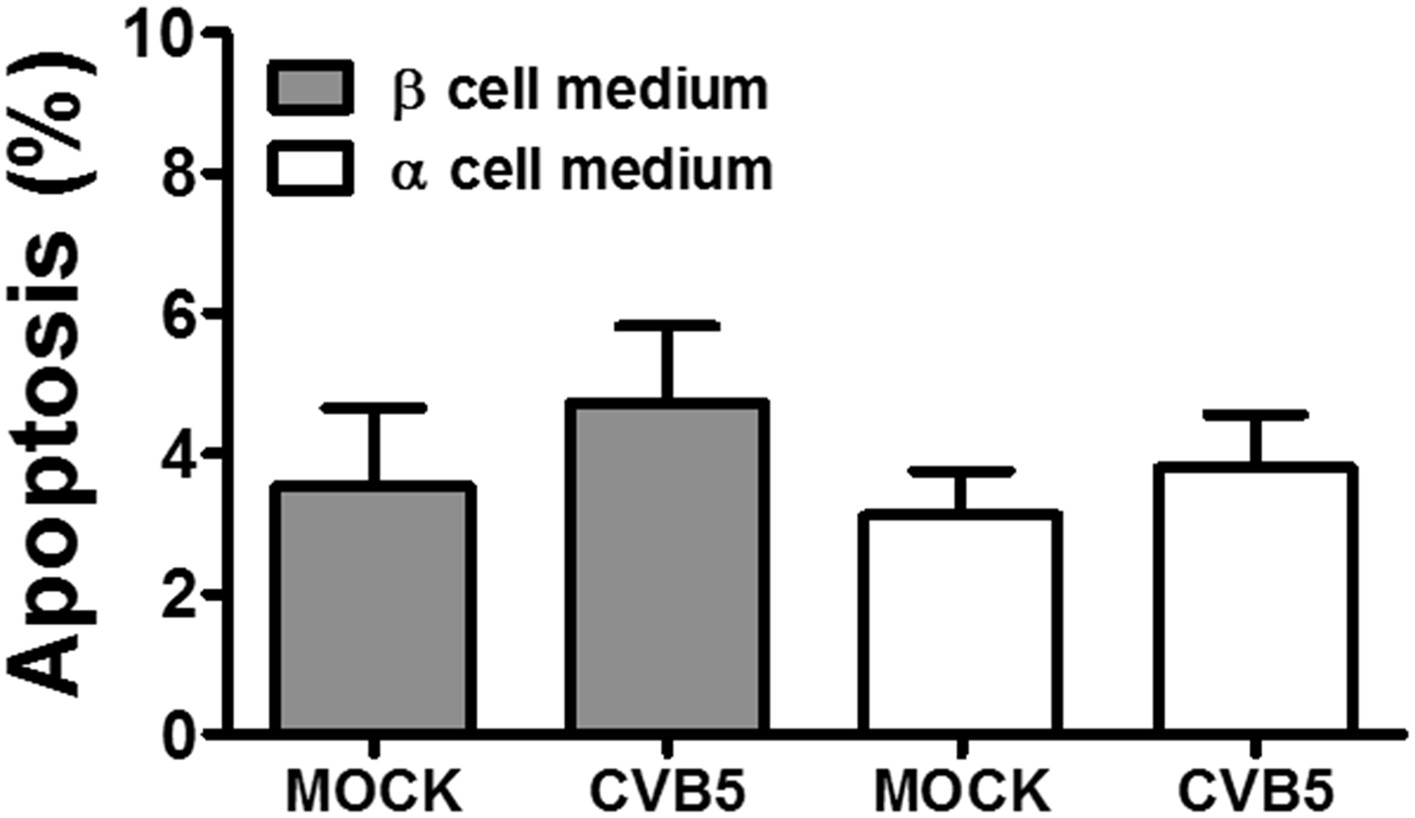
Pancreatic α cells infected with CVB5 under different medium conditions.
FACS-purified rat α cells (>90% purity) were infected in parallel with CVB5 (multiplicity of infection—M.O.I. 5) for 36 hr in two different media, that is, medium used for β cell culture, with 10 mM glucose and 5% fetal bovine serum, (gray) and the usual medium used in α cells culture (white). Apoptosis was evaluated by staining with the nuclear dies Hoechst 33342 and PI. Results are mean and SEM of 3 independent experiments; ANOVA followed by Student's t-test with Bonferroni correction.
Figure 4 with 1 supplement
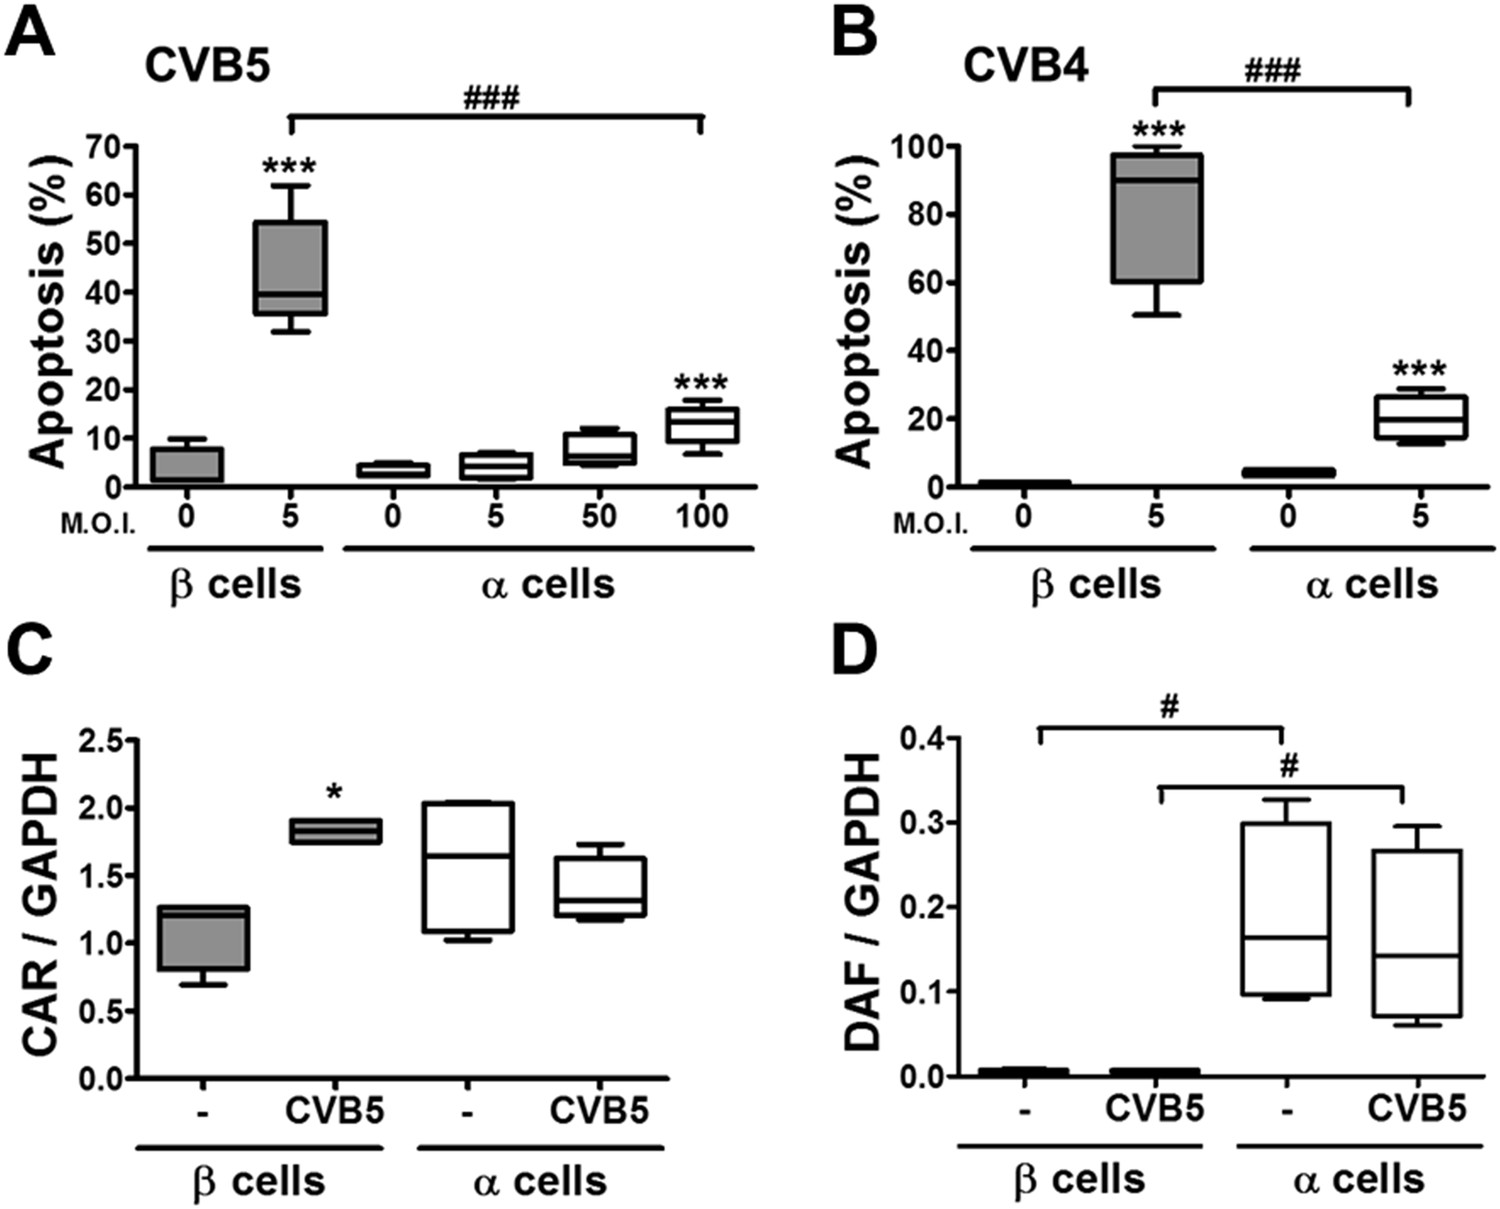
The higher susceptibility of β cells to virus-induced cell death, as compared to α cells, is not due to higher expression of virus receptors.
FACS-purified rat α and β cells (>90% purity) were infected with CVB5 (M.O.I. 5, 50 or 100 for α cells; M.O.I. 5 for β cells) (A), CVB4 (M.O.I. 5) (B), or CVB5 (M.O.I. 5) (C and D) for 36 hr. (A and B) Apoptosis was evaluated by staining with the nuclear dies Hoechst 33342 and PI. Coxsackievirus and adenovirus receptor (CAR) (C) and DAF (D) mRNA expression were assayed by RT-PCR and normalized by the housekeeping gene GAPDH. Results are from 4–8 experiments, plotted as box plots indicating lower quartile, median, and higher quartile, with whiskers representing the range of the remaining data points; *p < 0.05 and ***p < 0.001 CVB5 or CVB4 vs mock infection; #p < 0.05 and ###p < 0.001 as indicated by bars; ANOVA followed by Student's t-test with Bonferroni correction. DAF, decay accelerating factor.
Figure 4—figure supplement 1
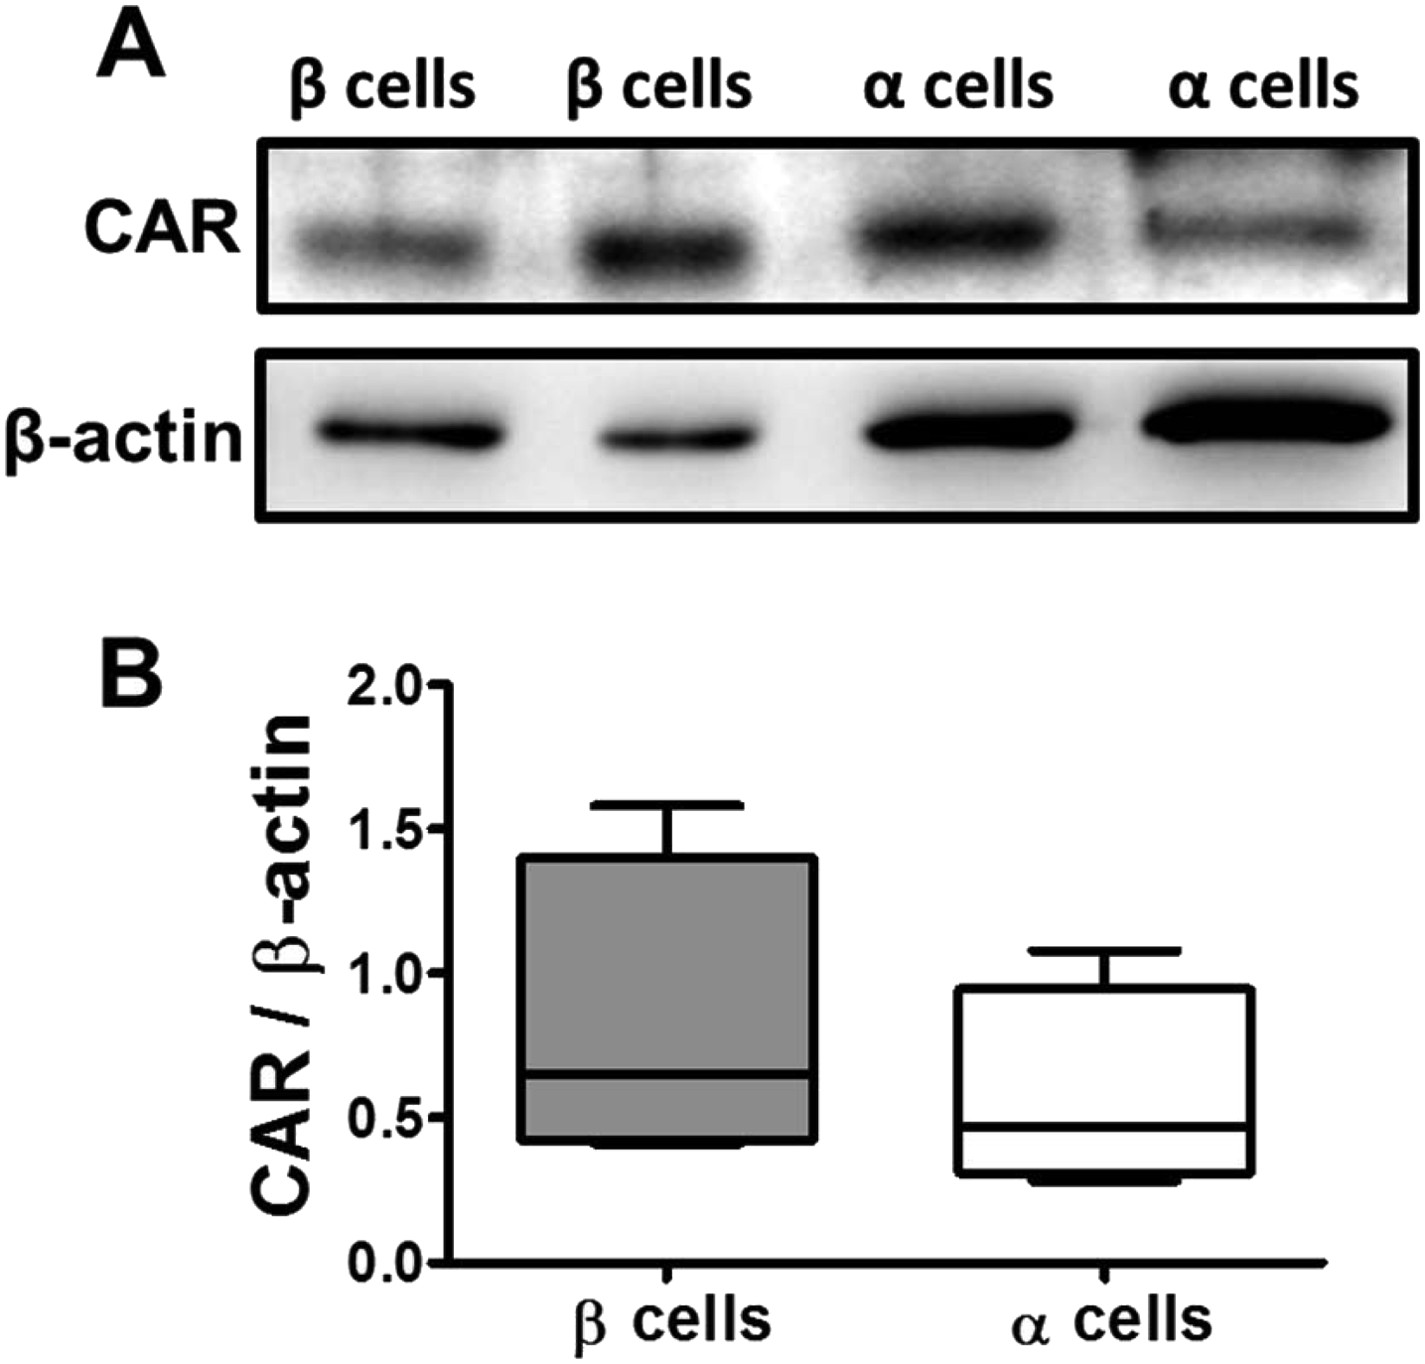
CAR protein expression in pancreatic rat β and α cells.
FACS-purified β and α cells (>90% purity for both cell types) were collected after 3 days in culture. Basal expression of CAR protein level was assayed by Western blot (2 out of 4 similar blots are shown) (A); Densitometry quantification of 4 independent samples of each cell type is shown in (B). Student's t-test with Bonferroni correction.
Figure 5
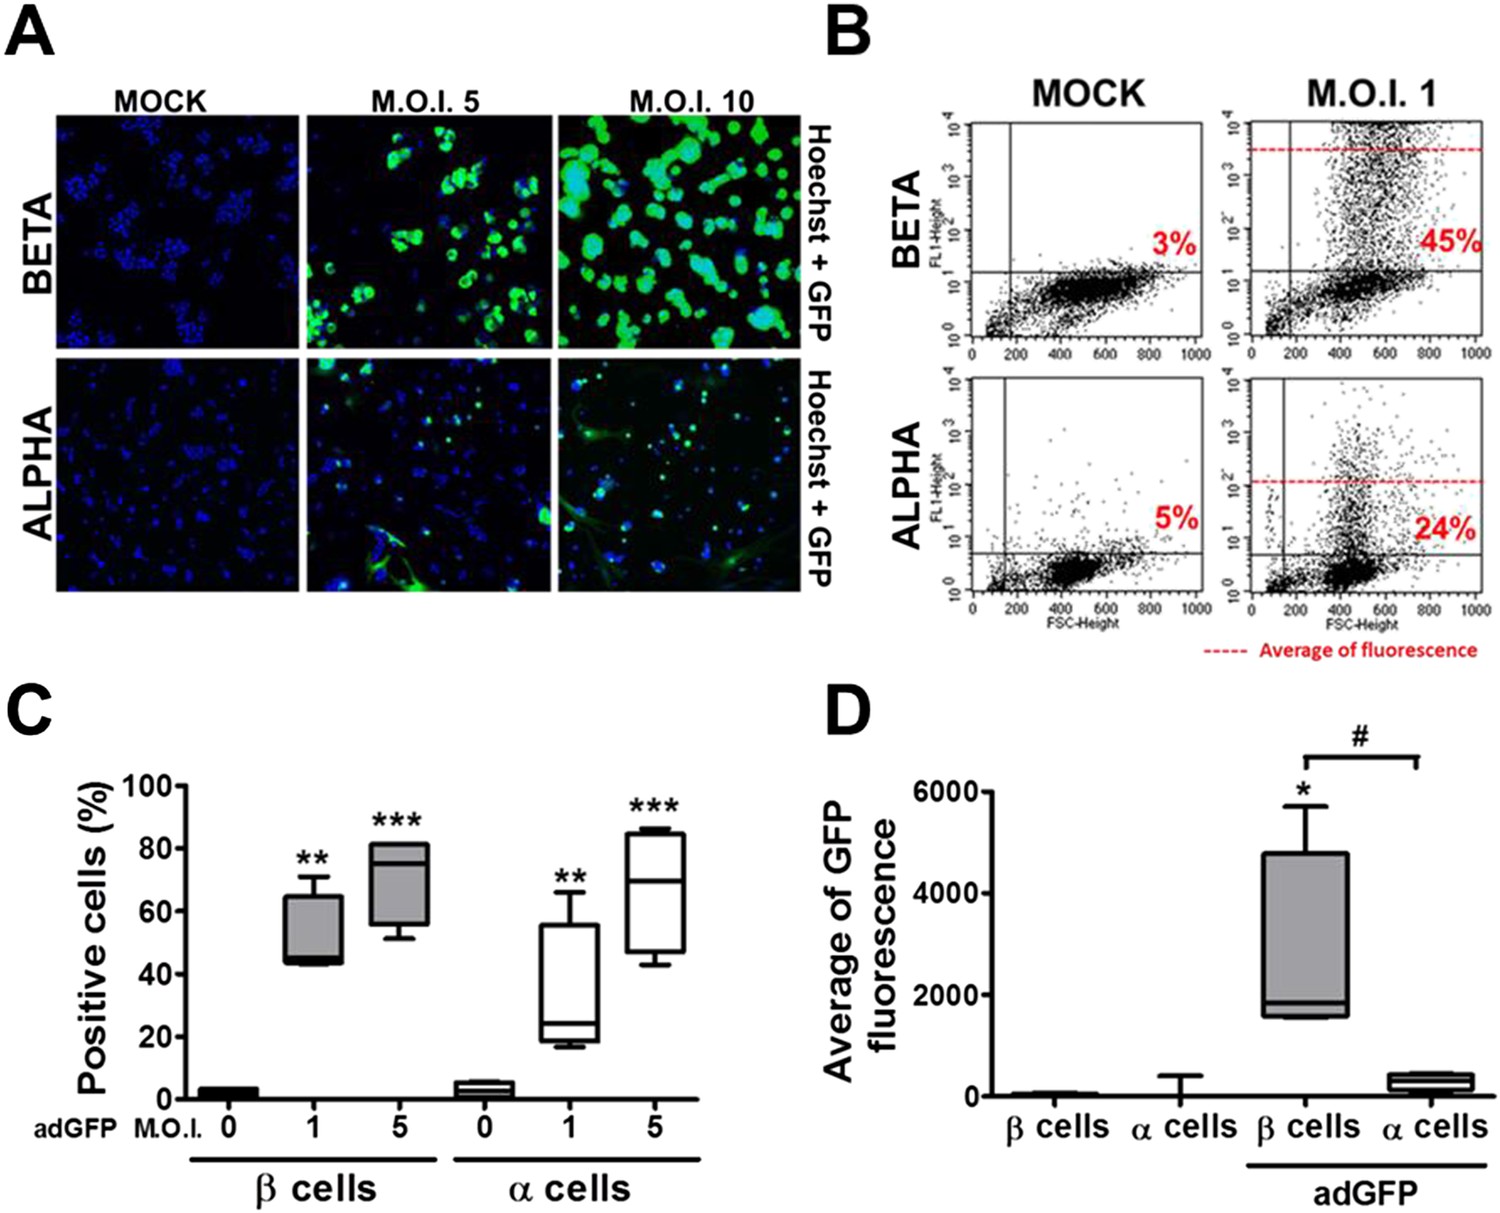
β and α cells are infected with similar efficiency by an adenoviral vector encoding GFP, but the translation of GFP protein is lower in α cells.
(A–D) FACS-purified β and α cells (>90% purity for both cell types) were infected with adeno-GFP (M.O.I. 1, 5 or 10) for 48 hr. Presence of GFP protein was evaluated by fluorescence microscopy (A) and flow cytometry (B–D). (A) Pictures show nucleus (blue) and GFP fluorescence (green). β and α cells were infected with adeno-GFP M.O.I. 1 or 5 (B and D) for 48 hr and then sorted based on green fluorescence and forward-scattered light. (B) Representative 2-D plot of 4 independent experiments. (C) Quantification of GFP positive cells. (D) Average of green fluorescence intensity in cells infected at M.O.I. 5. Results of 4 experiments are plotted as box plots, indicating lower quartile, median, and higher quartile, with whiskers representing the range of the remaining data points; *p < 0.05, **p < 0.01 and ***p < 0.001 adeno-GFP vs mock infection; #p < 0.05 as indicated by bars; ANOVA followed by Student's t-test with Bonferroni correction.
Figure 6
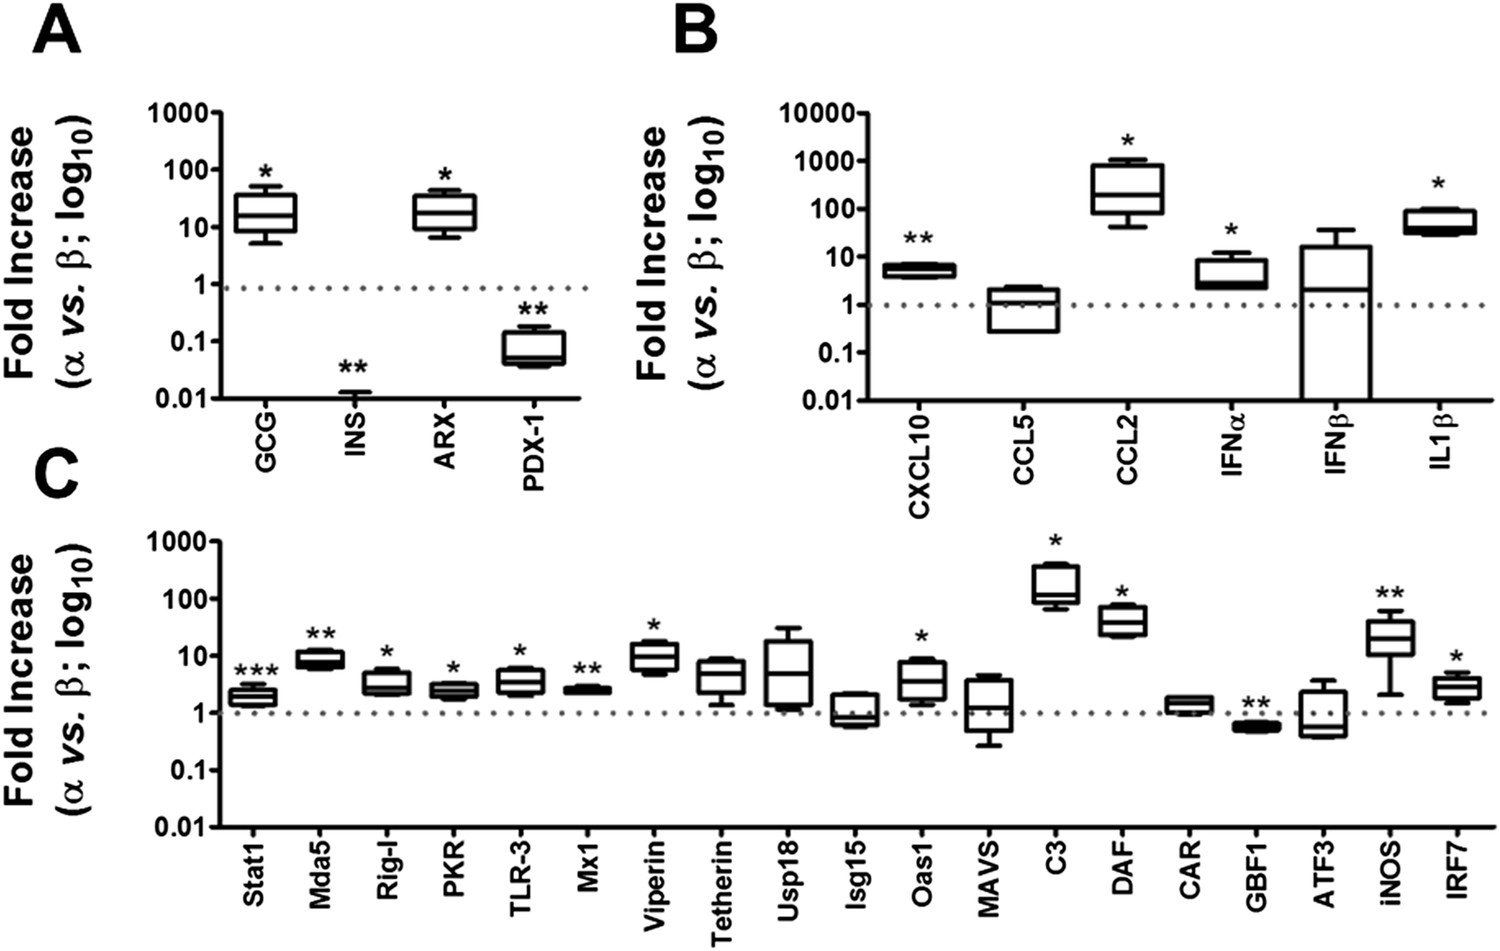
Basal expression of cell-autonomous immune response genes is higher in α cells than in β cells.
mRNA expression of genes related to identity of β and α cells (A) or cell-autonomous immune response (B and C) was assayed by RT-PCR and normalized by the housekeeping gene GAPDH. Graphs represent relative expression of mRNAs in α cells vs β cells (dotted line indicates 1, i.e., no change). Results from 4–9 experiments are plotted as box plots, indicating lower quartile, median, and higher quartile, with whiskers representing the range of the remaining data points; *p < 0.05, **p < 0.01, and ***p < 0.001 α cells vs β cells; Student's t-test with Bonferroni correction.
Figure 7

Similarity between up-regulated genes in granule neurons and pancreatic α cells.
(A) Correlation between up-regulated genes in brain (cerebellum granule cell neurons (CGNs) vs cortical neurons [CNs]) and islet cells (alpha vs beta). (B) Venn diagram of the up-regulated genes in brain (CGN vs CN) and islets cells (alpha vs beta). The absolute values are shown in Supplementary file 1.
Figure 8
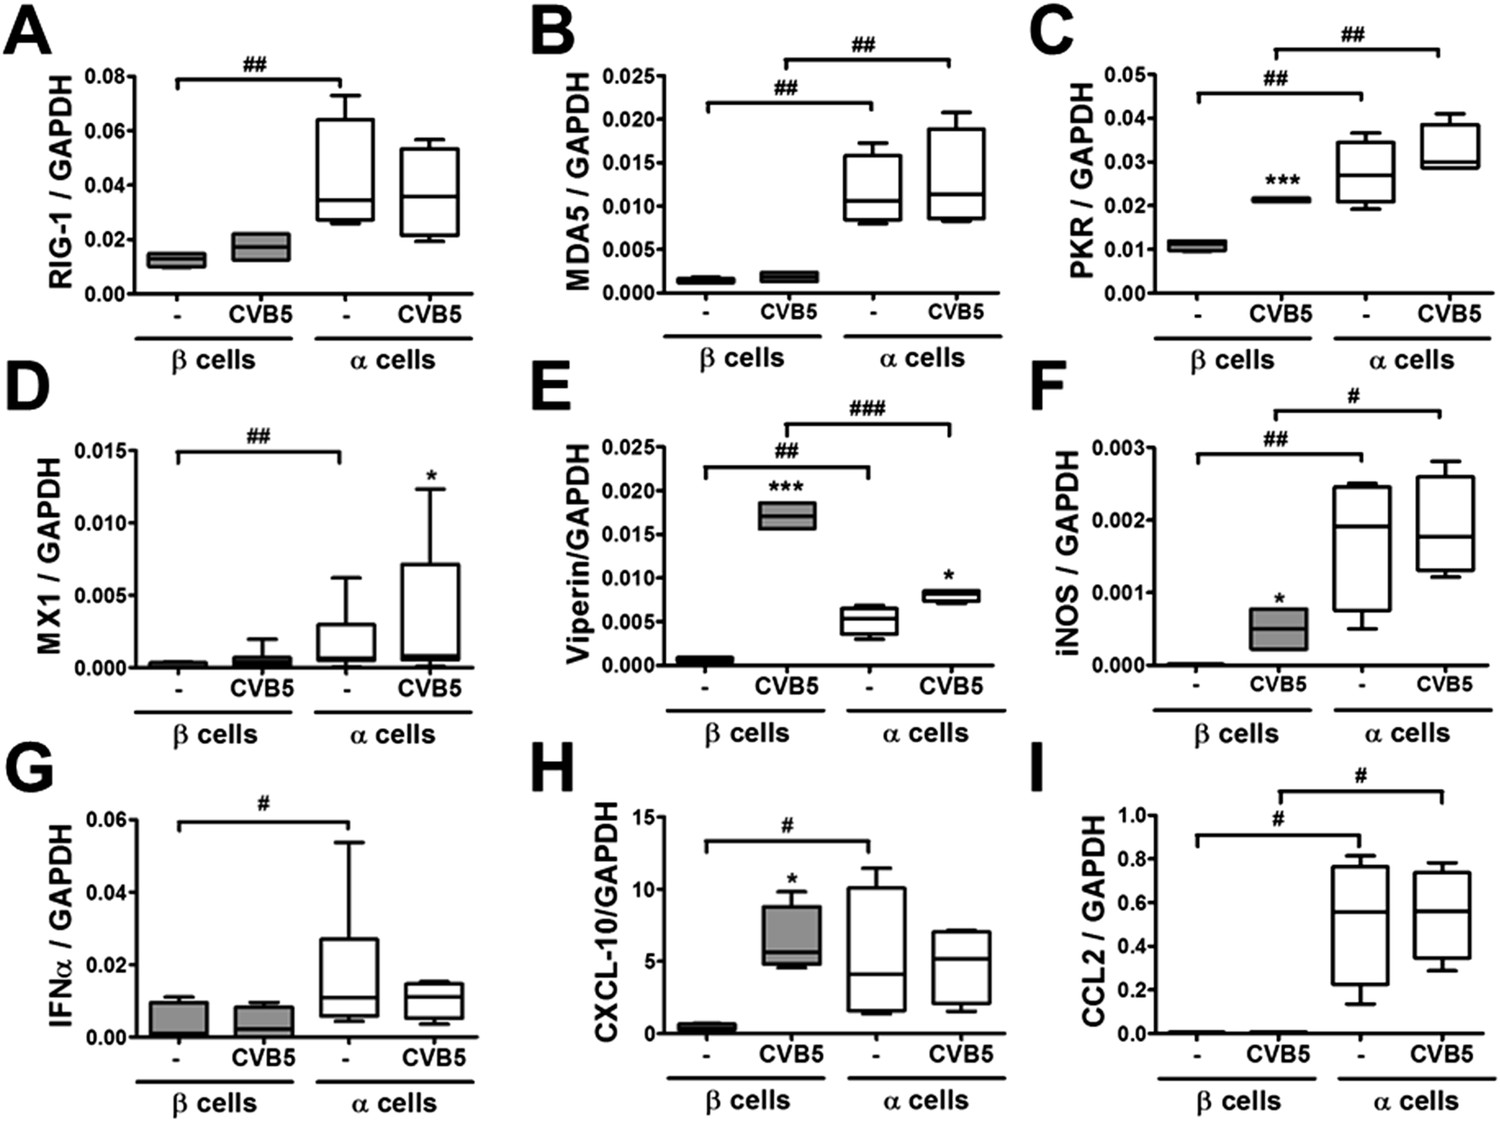
Differential expression of virus recognition and antiviral response genes in β and α cells exposed to CVB5.
(A–I) FACS-purified β and α cells (>90% purity for both cell types) were infected with CVB5 (M.O.I. 5) for 36 hr. mRNA expression of genes related to virus recognition (A–C) and antiviral responses (D–I) was assayed by RT-PCR and normalized by the housekeeping gene GAPDH. Results for 4–8 experiments are plotted as box plots, indicating lower quartile, median, and higher quartile, with whiskers representing the range of the remaining data points; *p < 0.05 and ***p < 0.001 CVB5 vs mock infection; #p < 0.05, ##p < 0.01, and ###p < 0.001 as indicated by bars; ANOVA followed by Student's t-test with Bonferroni correction.
Figure 9
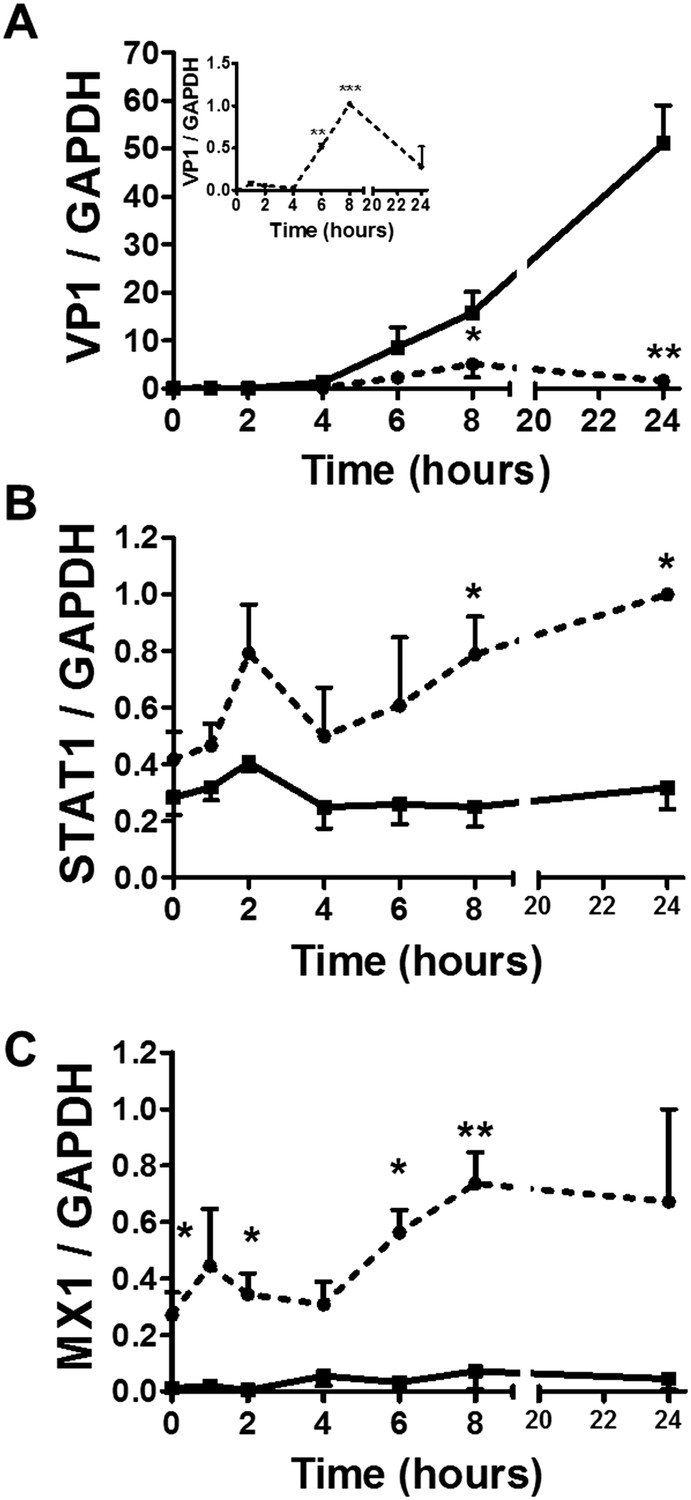
Time-course analysis of gene expression in β and α cells infected with CVB5.
(A–C) FACS-purified β (squares and solid lines) and α cells (circles and dotted lines) were infected with CVB5 (M.O.I. 5) for 1, 2, 4, 6, 8, 24 hr. VP1 (A), STAT1 (B), and MX1 (C) mRNA expression were assayed by RT-PCR and normalized by the housekeeping gene GAPDH. Inset in 6A show details of VP1 expression in α cells. Results are mean values ± SEM of 3–4 independent experiments; *p < 0.05, **p < 0.01, and ***p < 0.001 α vs β; ANOVA followed by Student's t-test with Bonferroni correction. Inset; **p < 0.01 and ***p < 0.001 CVB5 vs mock infection; One-way ANOVA followed by Student's t-test with Bonferroni correction.
Figure 10
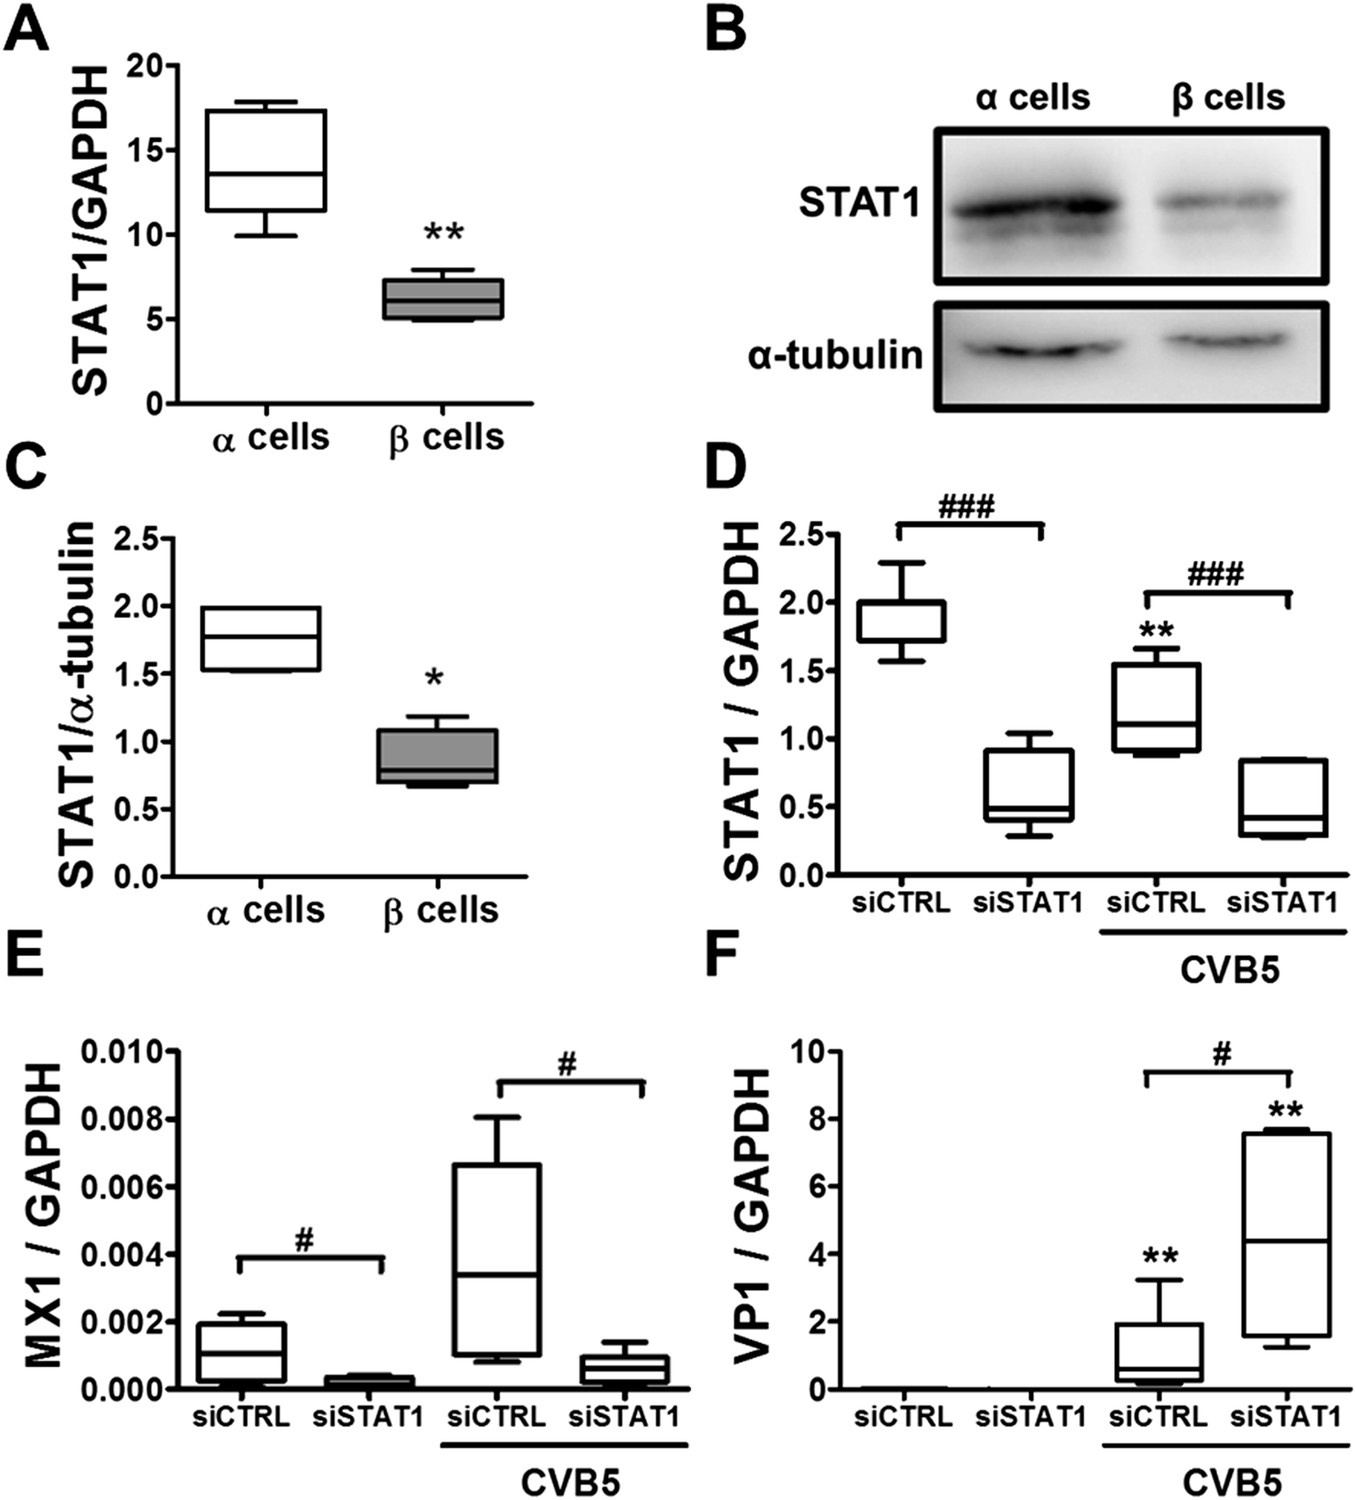
Knockdown of STAT1 decreases MX1 and increases VP1 expression in pancreatic rat α cells after CVB5 infection.
(A–C) FACS-purified β and α cells (>90% purity for both cell types) were collected after 3 days in culture. Basal expression of STAT1 mRNA level (A) was assayed by RT-PCR and normalized by the housekeeping gene GAPDH. STAT1 protein expression was measured by Western blot (B and C). Densitometry quantification of 4 independent samples of each cell type is shown in (C). (D–F) FACS-purified α cells (>90% purity) were transfected with siCTRL or siSTAT1 (D–F). After 48 hr of recovery, cells were infected with CVB5 (M.O.I. 5) for 36 hr. STAT1 (D), MX1 (E), or VP1 (F) mRNA expression was assayed by RT-PCR and normalized by the housekeeping gene GAPDH. Results from 4–6 experiments are plotted as box plots, indicating lower quartile, median, and higher quartile, with whiskers representing the range of the remaining data points; *p < 0.05 and **p < 0.01 and CVB5 vs mock infection; #p < 0.05 and ###p < 0.001 as indicated by bars; ANOVA followed by Student's t-test with Bonferroni correction.
Figure 11 with 1 supplement
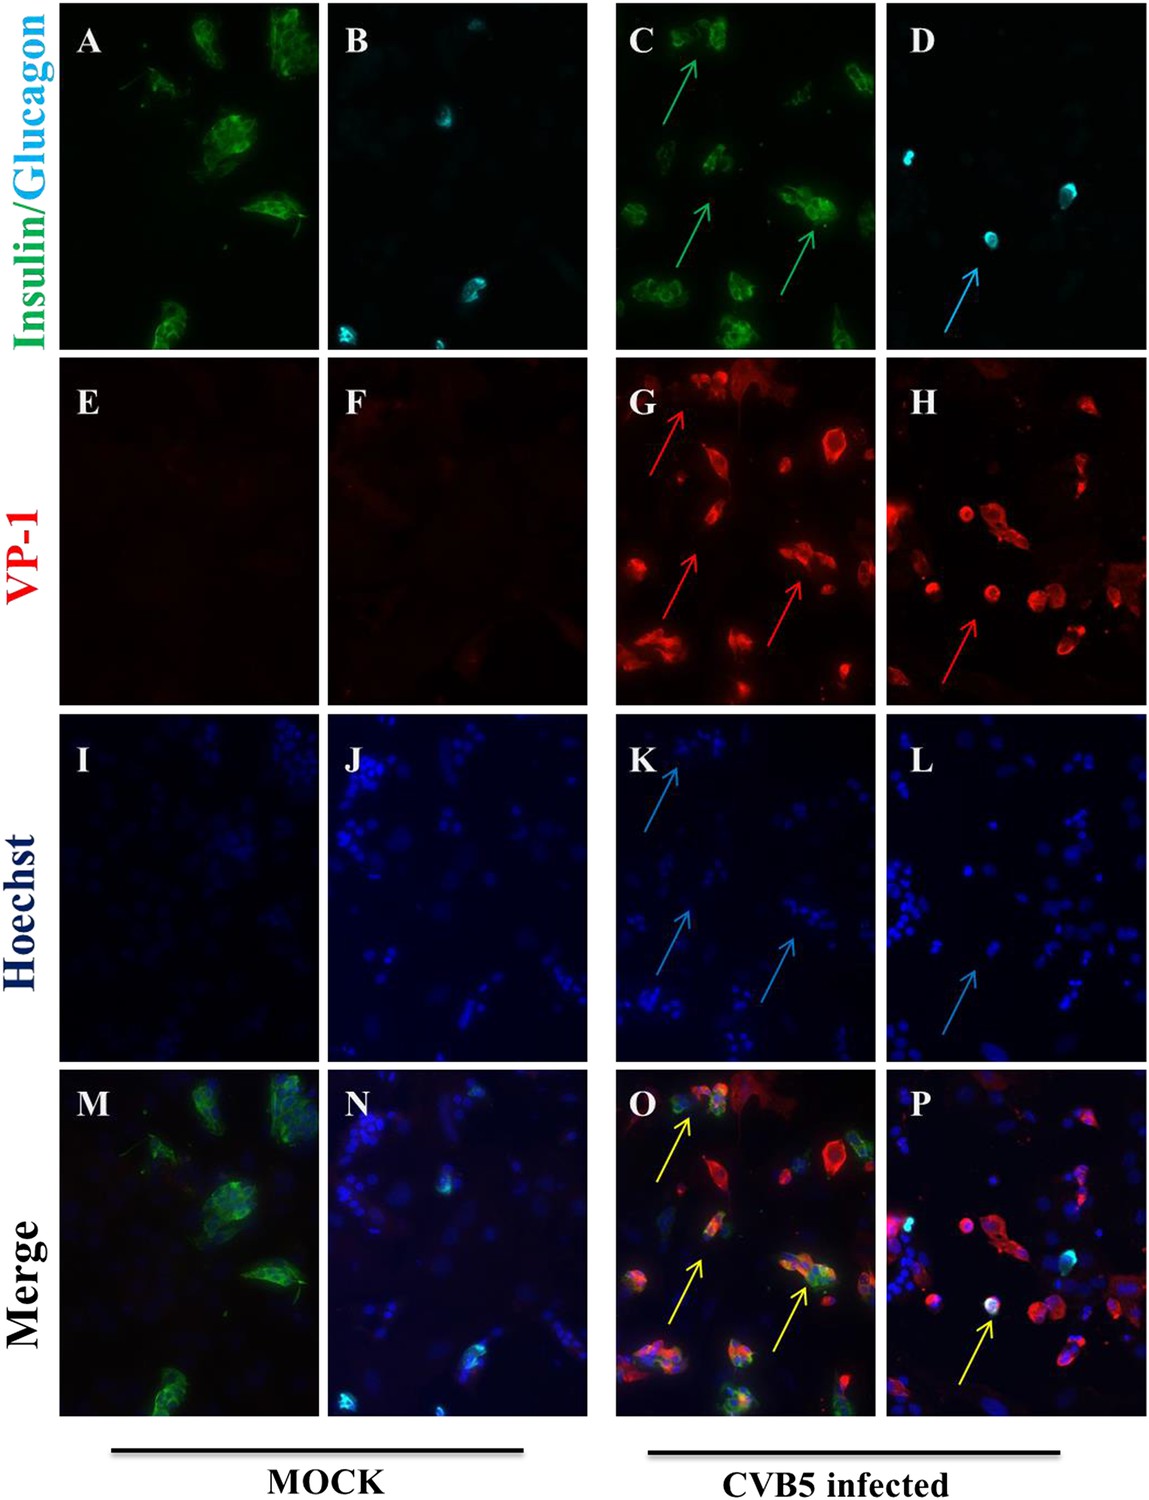
Infection of both α and β cells in dispersed human islets exposed to high titers of CVB5 for 8 hr.
Dispersed human islets were mock infected or infected with CVB5 (M.O.I. 10) for 8 hr. After infection, cells were fixed and used for histological studies. Fluorescent microscopy analysis of insulin (A and C, in green), glucagon (B and D, in cyan), and VP-1(E–H, in red) shows the presence of double-positive cells for insulin and VP-1 (O, merged panels, in yellow) and glucagon and VP-1(P, merged panels, in yellow/white) after CVB5 infection. No VP-1 positive cells (E and F) were observed in mock-infected cells. Nuclear staining was performed with Hoechst (I–L, in blue). Double-positive cells for insulin and VP-1 and for glucagon and VP-1 are indicated by the arrows (C, D, G, H, K, L, O, and P panels).
Figure 11—figure supplement 1
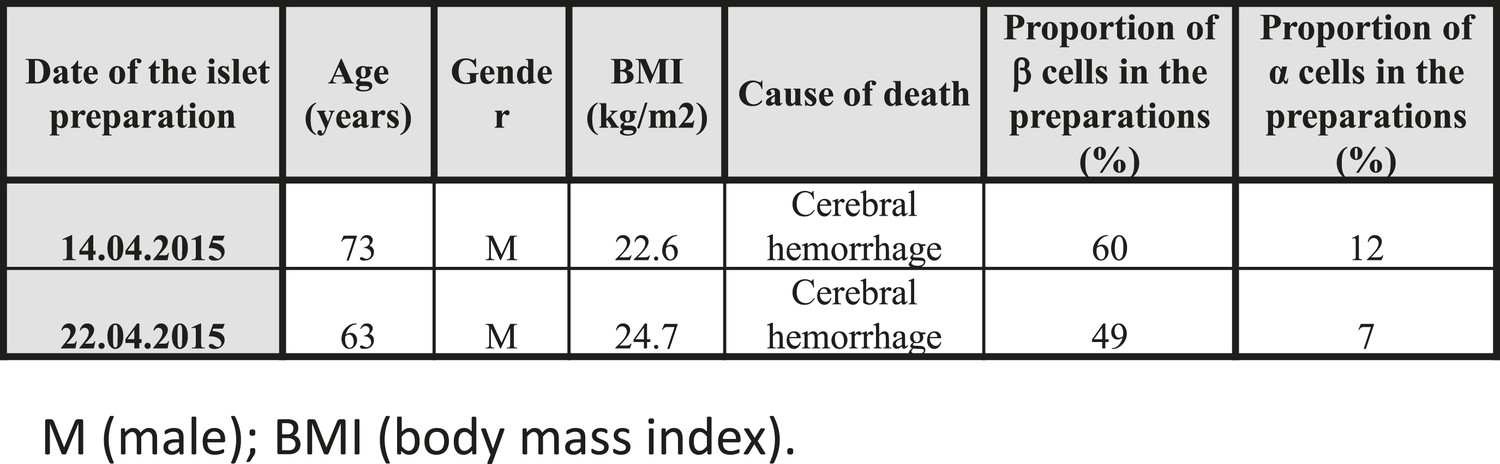
Characteristics of the 2 human donors used in the present study.
https://doi.org/10.7554/eLife.06990.025
Figure 12 with 1 supplement
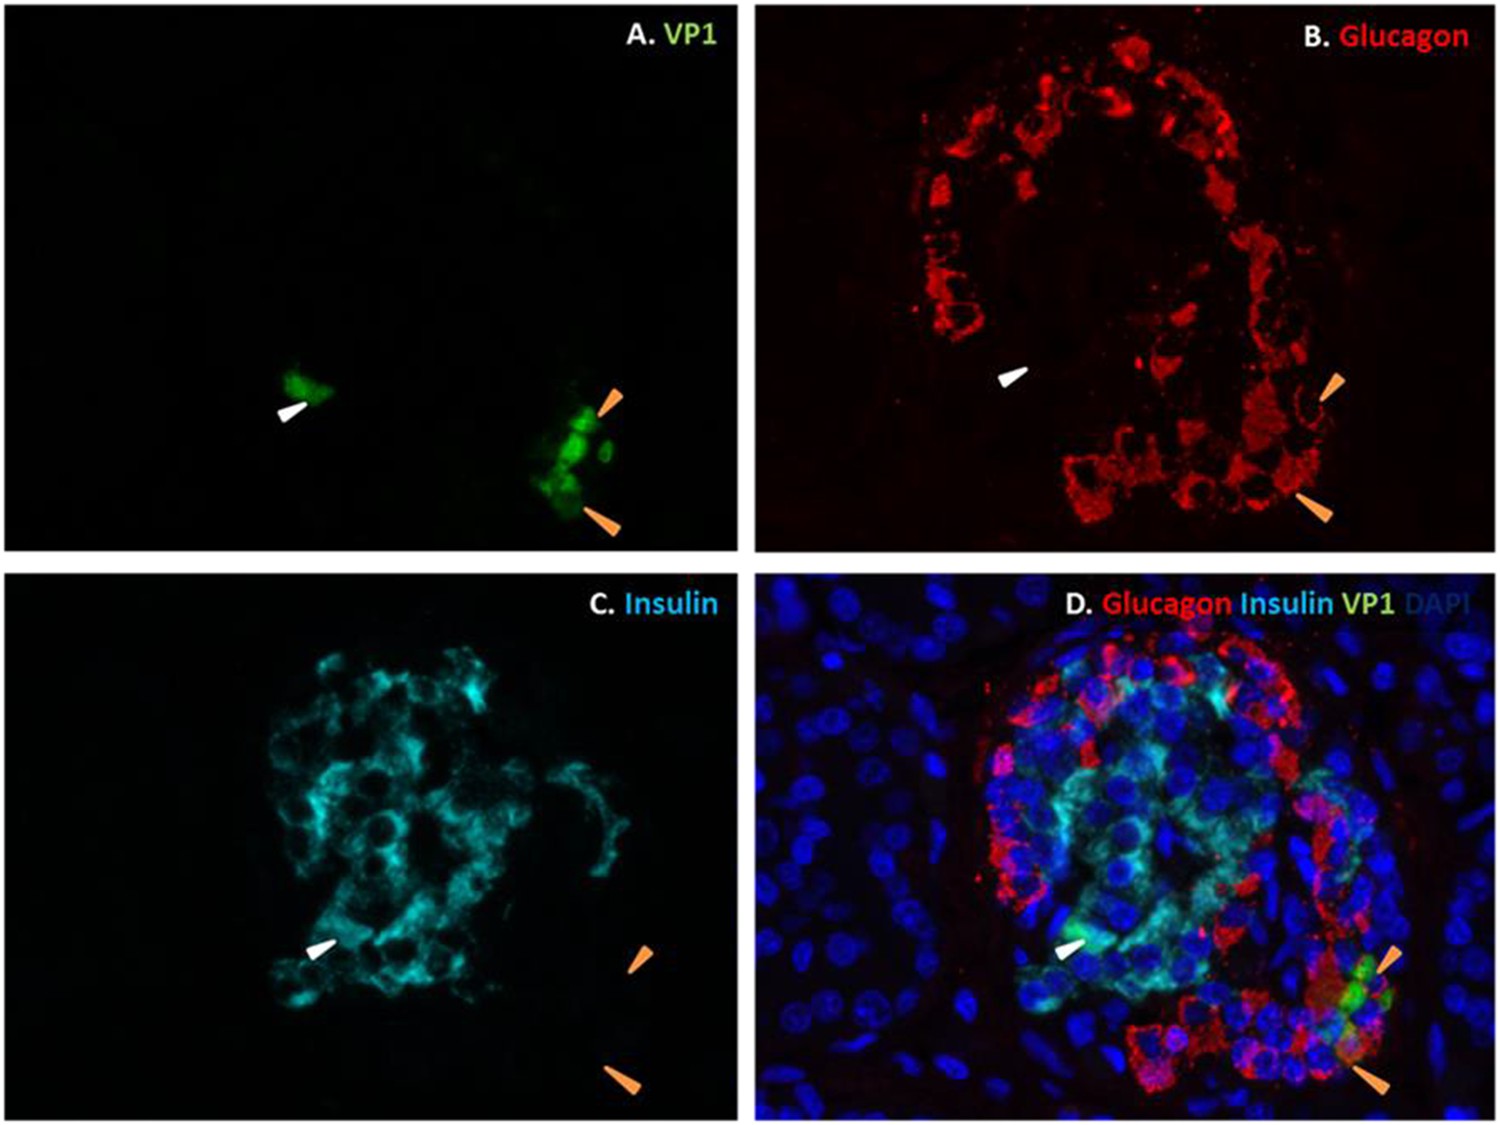
Fluorescence photomicrographs of an islet from a neonate with an acute coxsackievirus infection.
Viral VP1 (green; A, D) co-localizes with glucagon (red; B, D) in certain cells (orange arrows) and with insulin (light blue; C, D) in another (white arrow). Nuclei were stained with DAPI (dark blue) in the merged image (D).
Figure 12—figure supplement 1
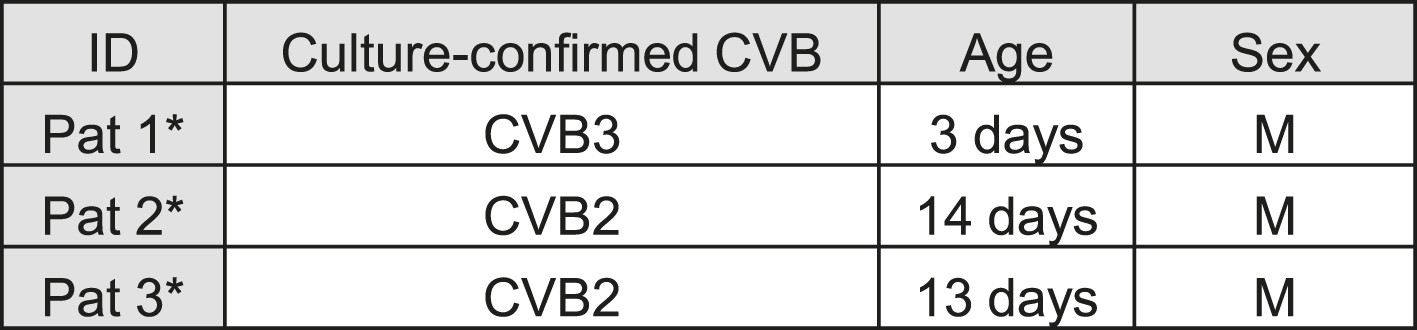
List of human samples used.
Cases were randomly selected from a previously described collection (Richardson et al., 2009).
Author response image 1

Viral titers of CVB5 bound to FACS sorted primary rat α or β cells. FACS-purified rat α cells (˃90% purity) were infected with CVB5 (M.O.I. 5). After 2 hr incubation cells are washed with medium 3 times before freezing in complete medium. The cell-bound virus was then titrated by limit dilution assay and TCID50 titers calculated according to the Kärber formula. To determine the background of unbound virus, wells devoid of cells were treated the same way and corresponding titers. The unbound viruses were subtracted in each experiment. Results are Mean and SEM of 2-3 independent experiments.
Additional files
-
Supplementary file 1
Comparison between differentially expressed genes in granule cell neurons (compared to cortical neurons) and pancreatic α cells (compared to β cells).
- https://doi.org/10.7554/eLife.06990.028
-
Supplementary file 2
List of primers used in the study.
- https://doi.org/10.7554/eLife.06990.029
Download links
A two-part list of links to download the article, or parts of the article, in various formats.
Downloads (link to download the article as PDF)
Open citations (links to open the citations from this article in various online reference manager services)
Cite this article (links to download the citations from this article in formats compatible with various reference manager tools)
Differential cell autonomous responses determine the outcome of coxsackievirus infections in murine pancreatic α and β cells
eLife 4:e06990.
https://doi.org/10.7554/eLife.06990


