Norepinephrine is required to promote wakefulness and for hypocretin-induced arousal in zebrafish
- California Institute of Technology, United States
Figures
Figure 1 with 3 supplements
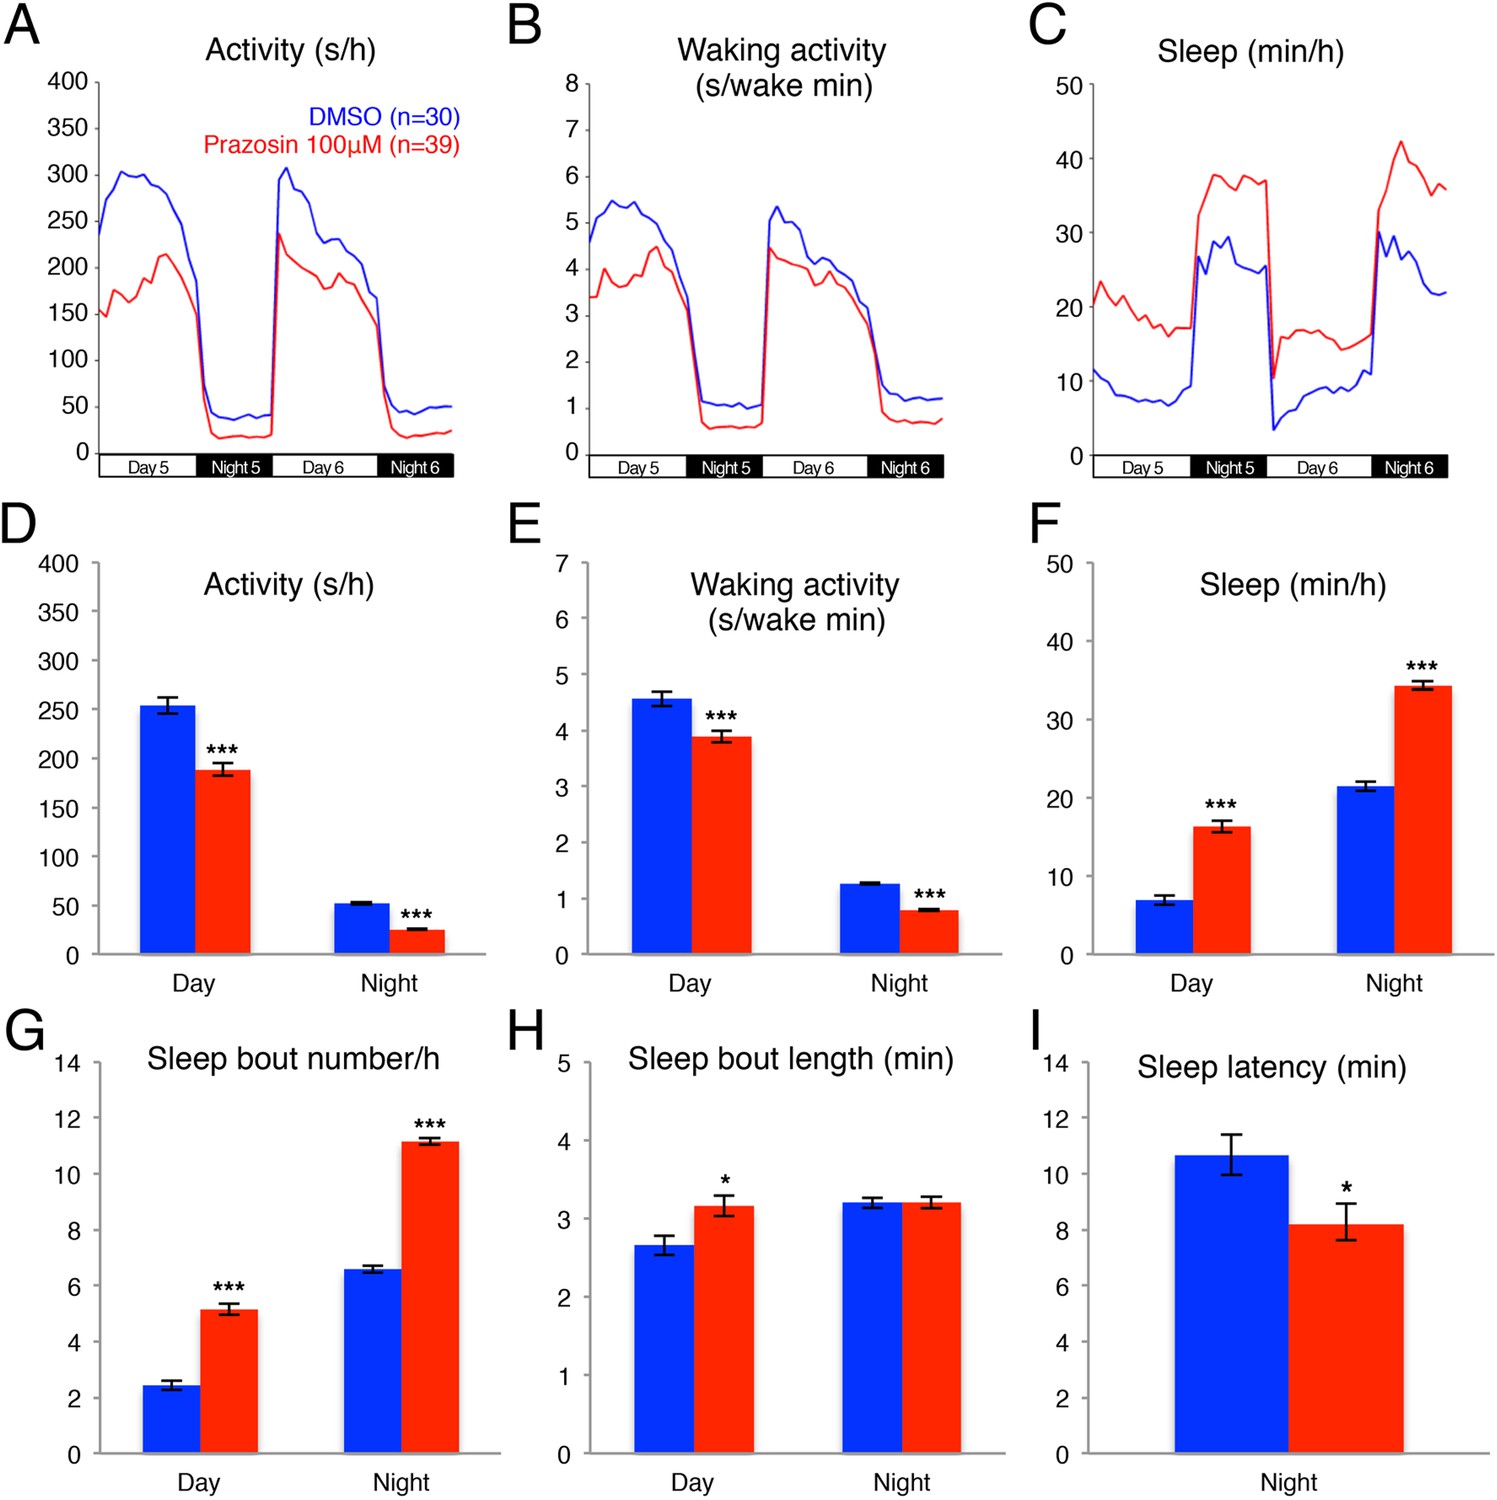
Prazosin treated larvae are less active and sleep more than vehicle treated controls.
Representative activity (A), waking activity (amount of locomotor activity while awake) (B) and sleep (C) traces of vehicle (blue) and prazosin (red) treated zebrafish larvae. Bar graphs of activity (D), waking activity (E), sleep (F), sleep bout number (G), sleep bout length (H) and sleep latency (I) from three combined experiments (n > 180 for each condition). Bars represent mean ± s.e.m. *, p < 0.05 and ***, p < 0.0001 by one-way ANOVA.
Figure 1—figure supplement 1
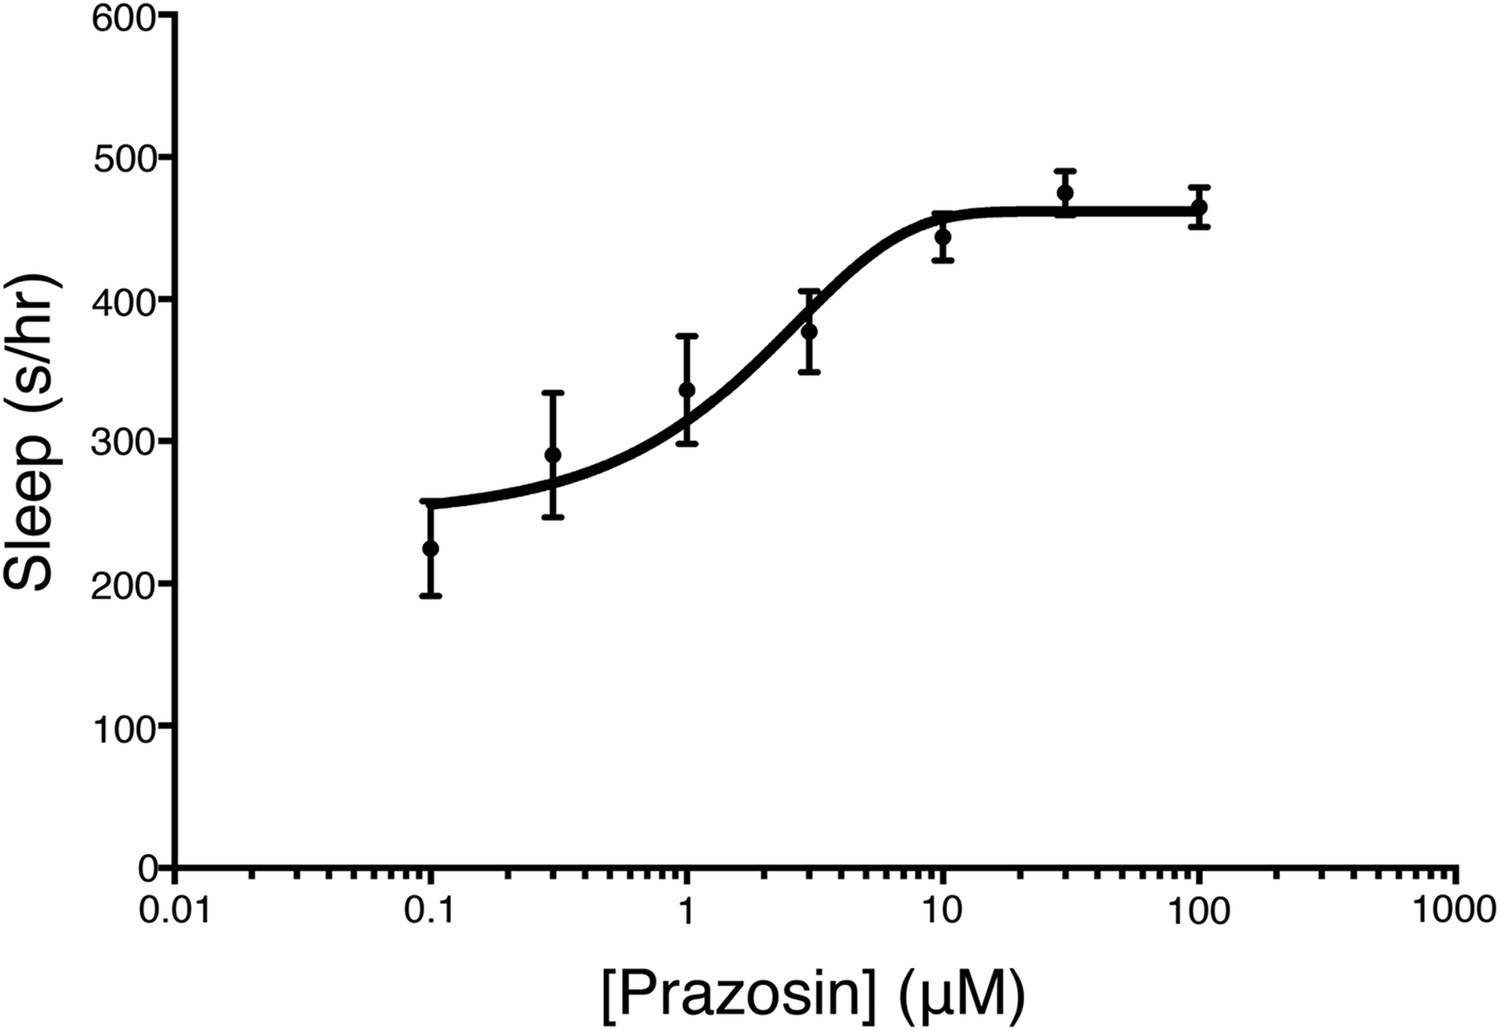
Prazosin night sleep dose–response curve.
Larvae were treated with prazosin over range of concentrations (n = 12 for each concentration) on the morning of day 5 of development. Sleep was measured during night 5. Mean ± s.e.m is shown for each concentration.
Figure 1—figure supplement 2
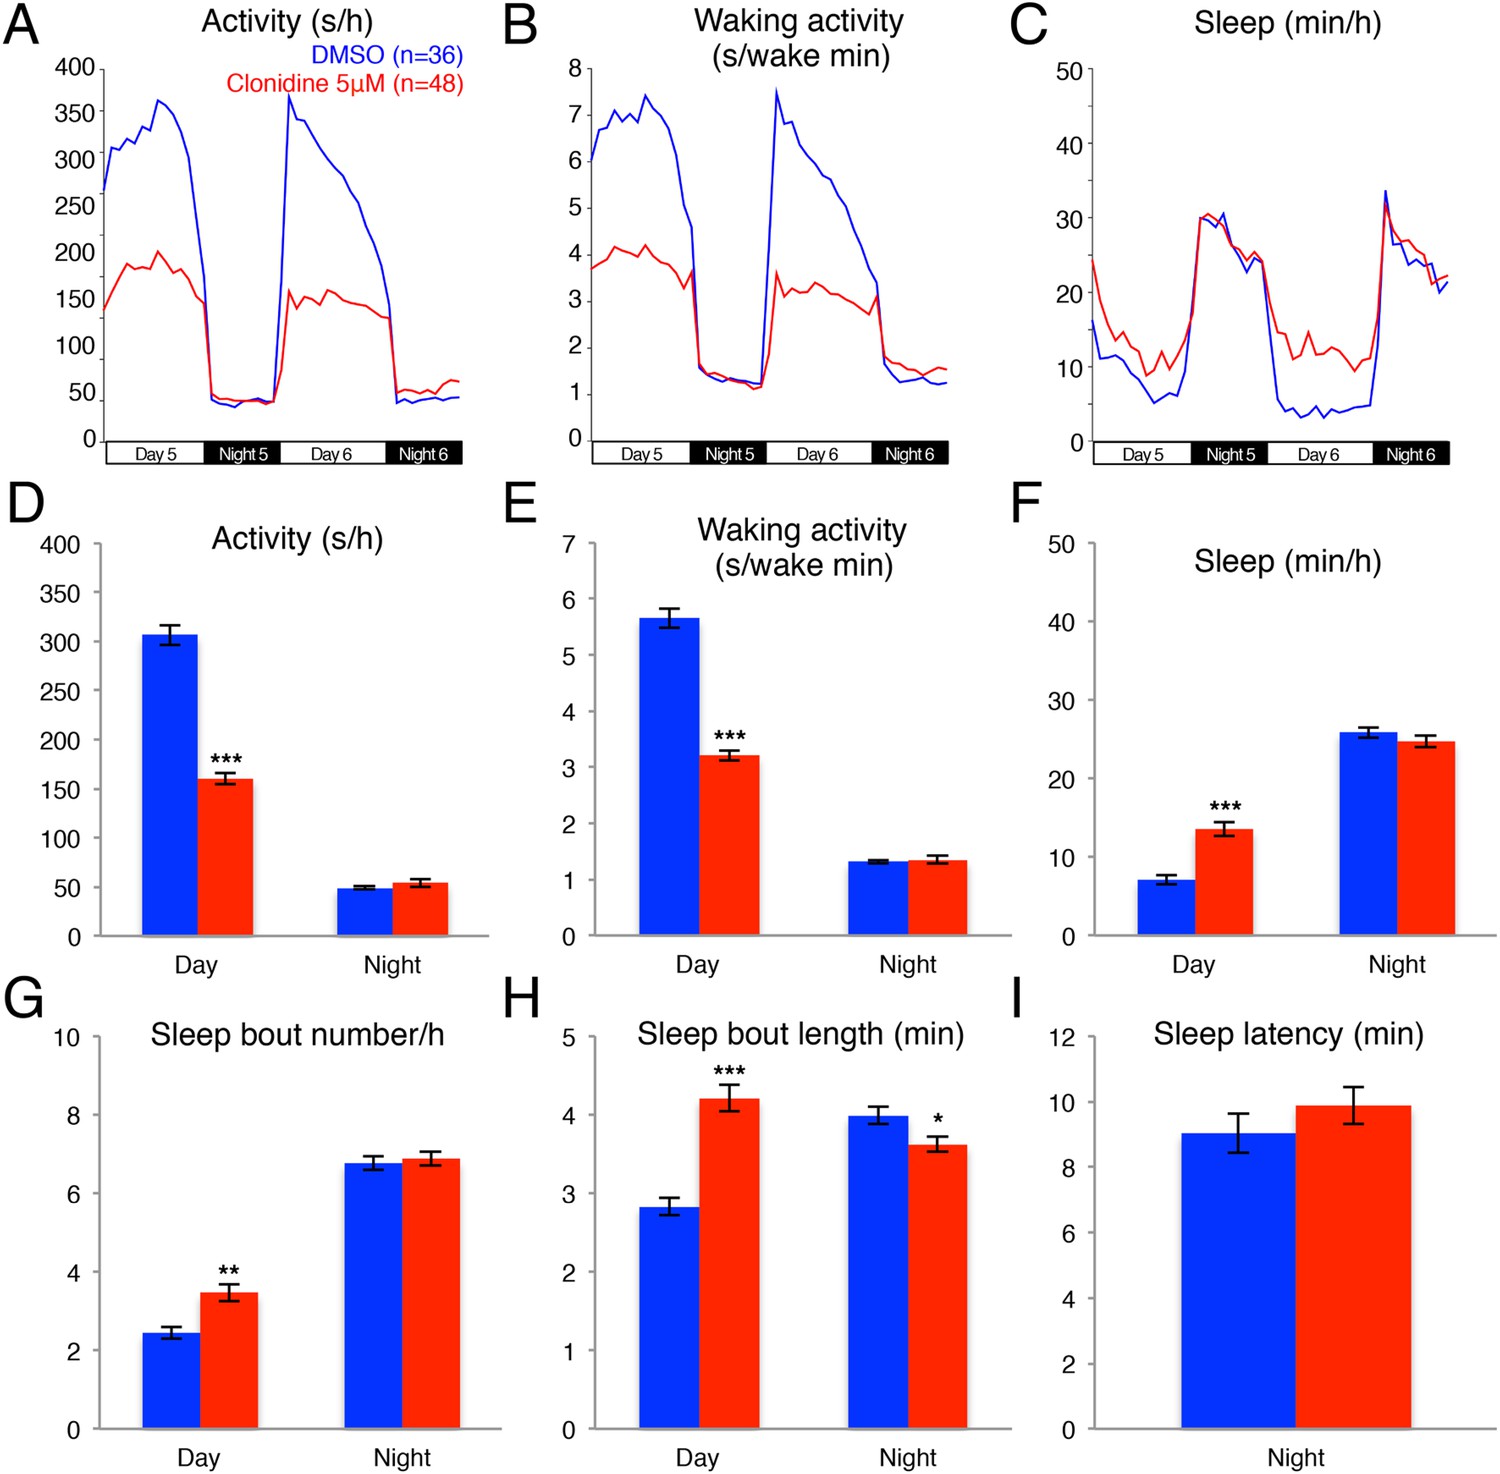
Clonidine treated larvae are less active and sleep more than vehicle treated controls during the day.
Representative activity (A), waking activity (B) and sleep (C) traces of vehicle (blue) and clonidine (red) treated zebrafish larvae. Bar graphs of activity (D), waking activity (E), sleep (F), sleep bout number (G), sleep bout length (H) and sleep latency (I) from two combined experiments (n > 140 for each condition). Bars represent mean ± s.e.m. *, p < 0.05; **; p < 0.001; ***, p < 0.0001 by one-way ANOVA.
Figure 1—figure supplement 3
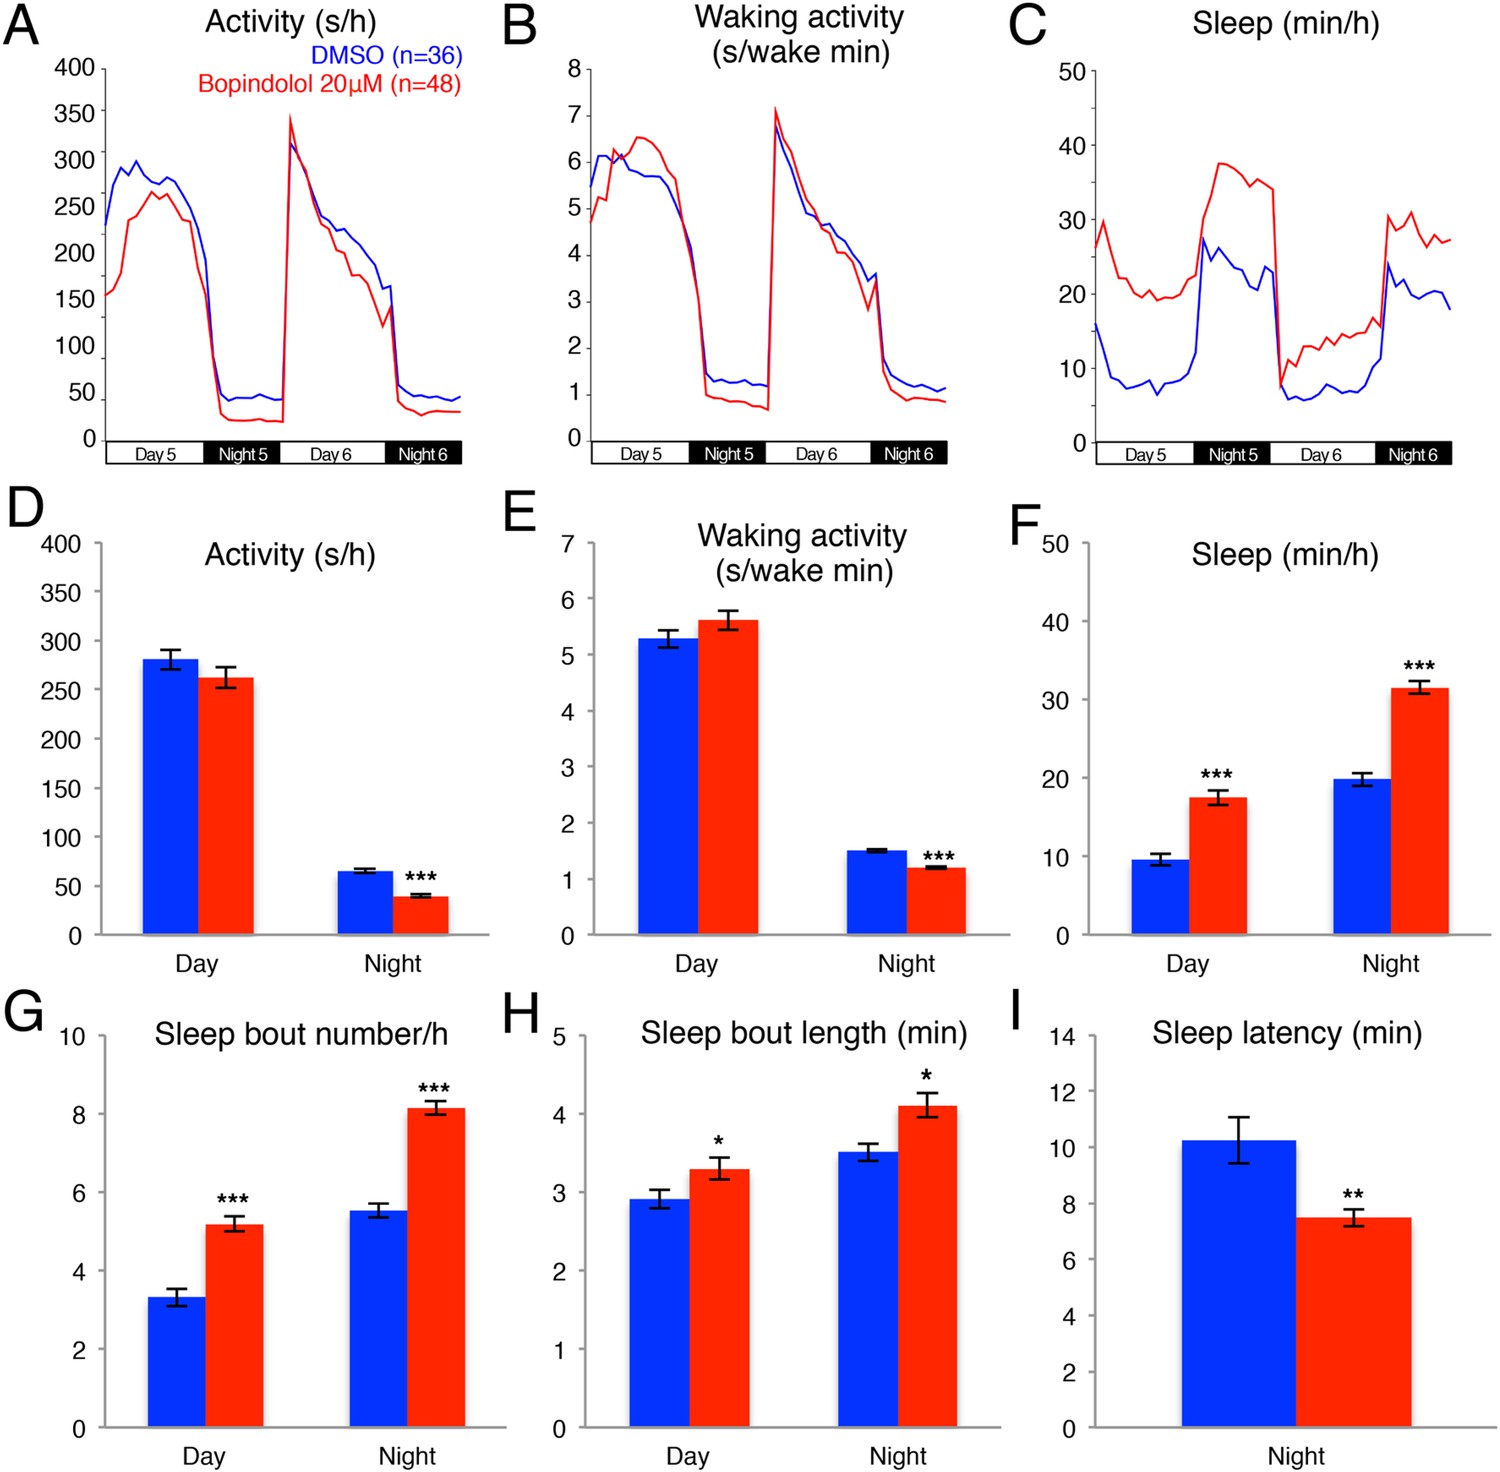
Bopindolol treated larvae sleep more than vehicle treated controls.
Representative activity (A), waking activity (B) and sleep (C) traces of vehicle (blue) and bopindolol (red) treated zebrafish larvae. Bar graphs of activity (D), waking activity (E), sleep (F), sleep bout number (G), sleep bout length (H) and sleep latency (I) from two combined experiments (n > 140 for each condition). Bars represent mean ± s.e.m. n indicates number of larvae. *, p < 0.05; **, p < 0.001; ***, p < 0.0001 by one-way ANOVA.
Figure 2 with 2 supplements
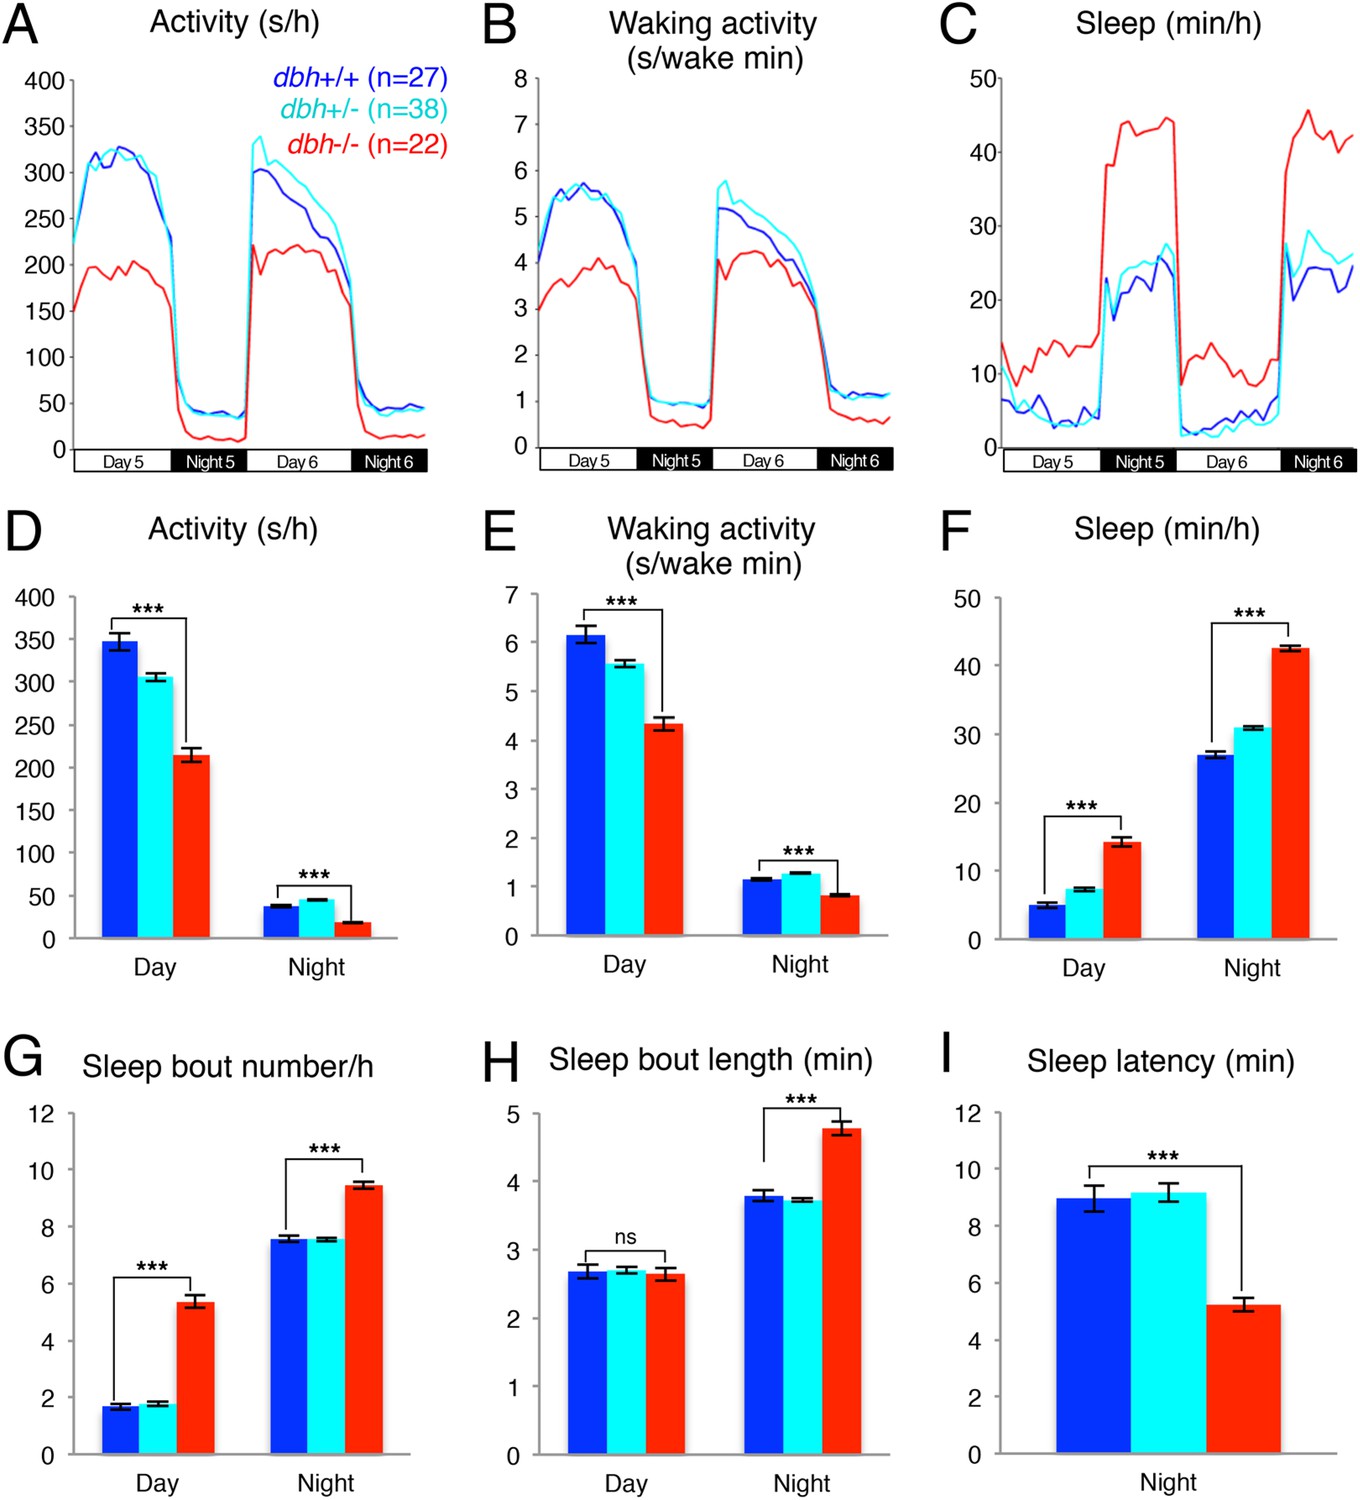
dbh mutant larvae are less active and sleep more than sibling controls.
Representative activity (A), waking activity (B) and sleep (C) traces of dbh+/+ (blue) dbh+/− (cyan) and dbh−/− (red) zebrafish larvae. Bar graphs show mean ± s.e.m. activity (D), waking activity (E), sleep (F), sleep bout number (G), sleep bout length (H) and sleep latency (I) from seven combined experiments (n > 250 for each genotype). n indicates number of larvae. ***, p < 0.0001 and ns, not significant by one-way ANOVA.
Figure 2—figure supplement 1
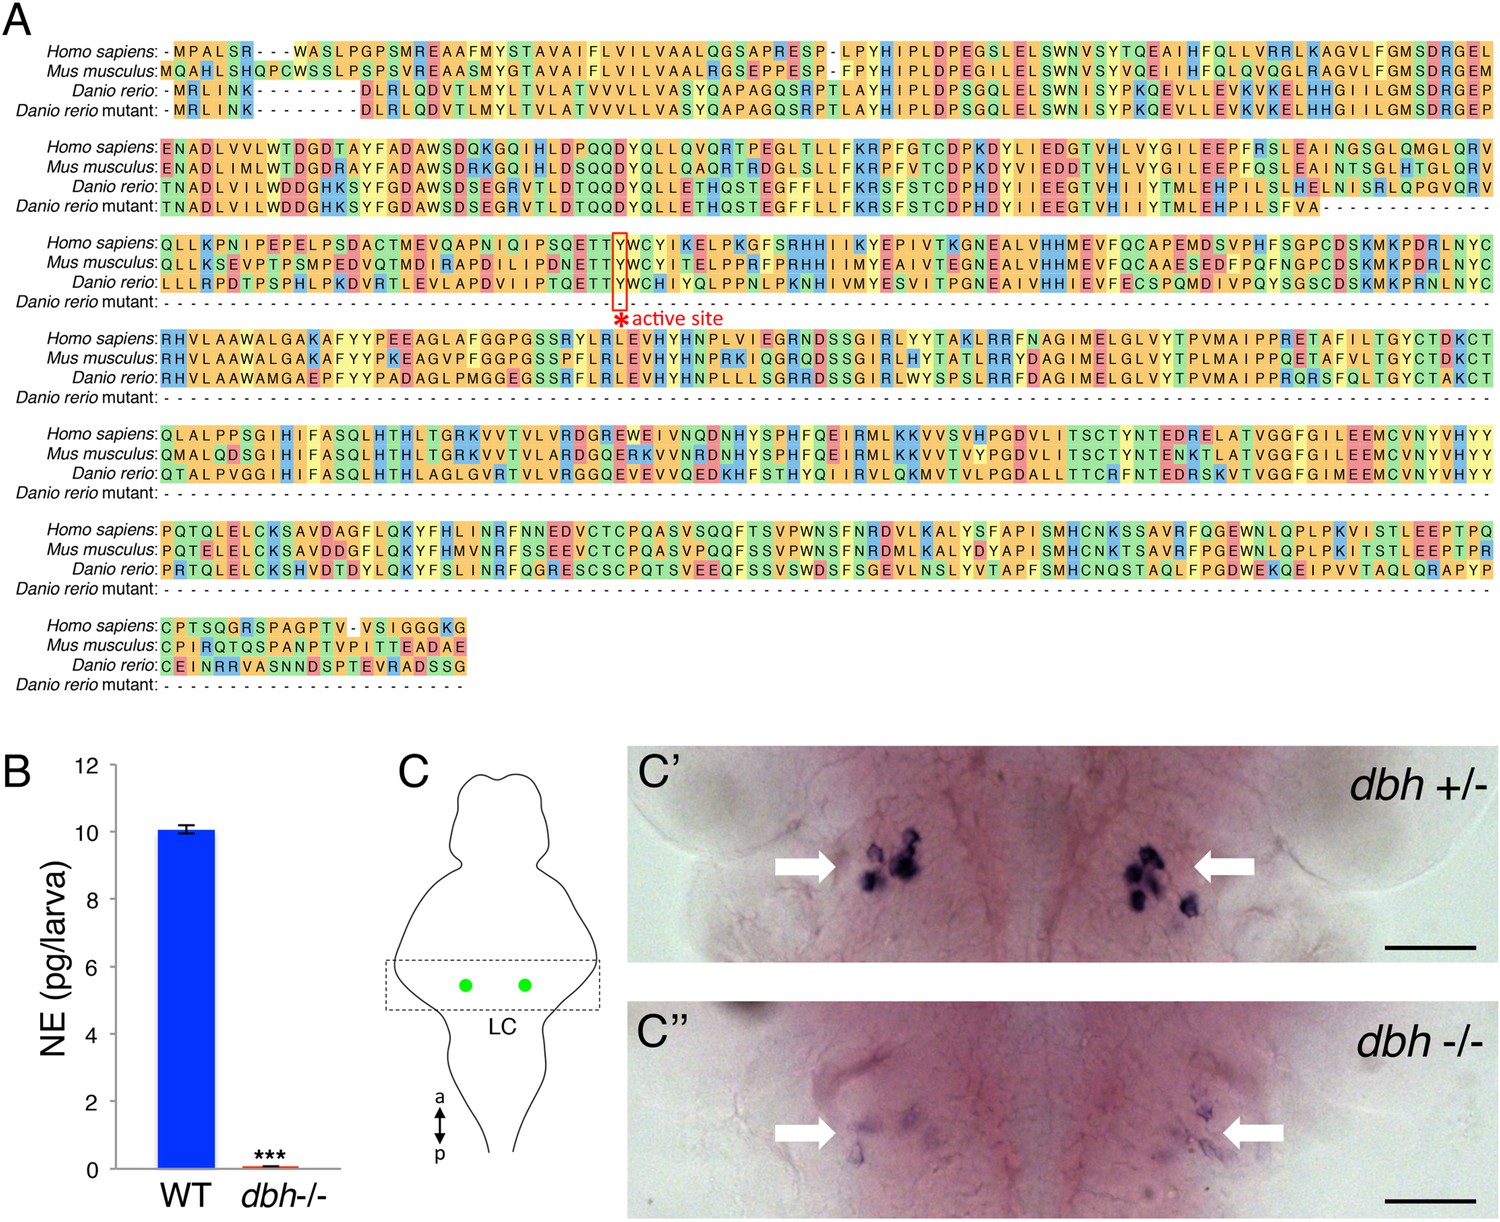
Verification of zebrafish dbh mutant.
(A) Alignment of human, mouse, WT zebrafish and mutant zebrafish DBH amino acid sequences. The coding sequence of the mutant allele terminates before the conserved active site residue (asterisk). (B) ELISA quantification of NE levels in WT and dbh−/− zebrafish larvae. Mean ± s.e.m. is shown. ***, p < 0.0001 by one-way ANOVA. (C) RNA in situ hybridization (ISH) for dbh in dbh+/− (C′) and dbh−/− (C′′) sibling larvae in the LC, indicated by white arrows. Larvae were obtained from a dbh+/− to dbh−/− mating and were genotyped after imaging. Schematic diagram indicates the brain region (box) containing the LC (green) that is shown in the ISH images. a = anterior, p = posterior. Scale bar = 50 μm.
Figure 2—figure supplement 2
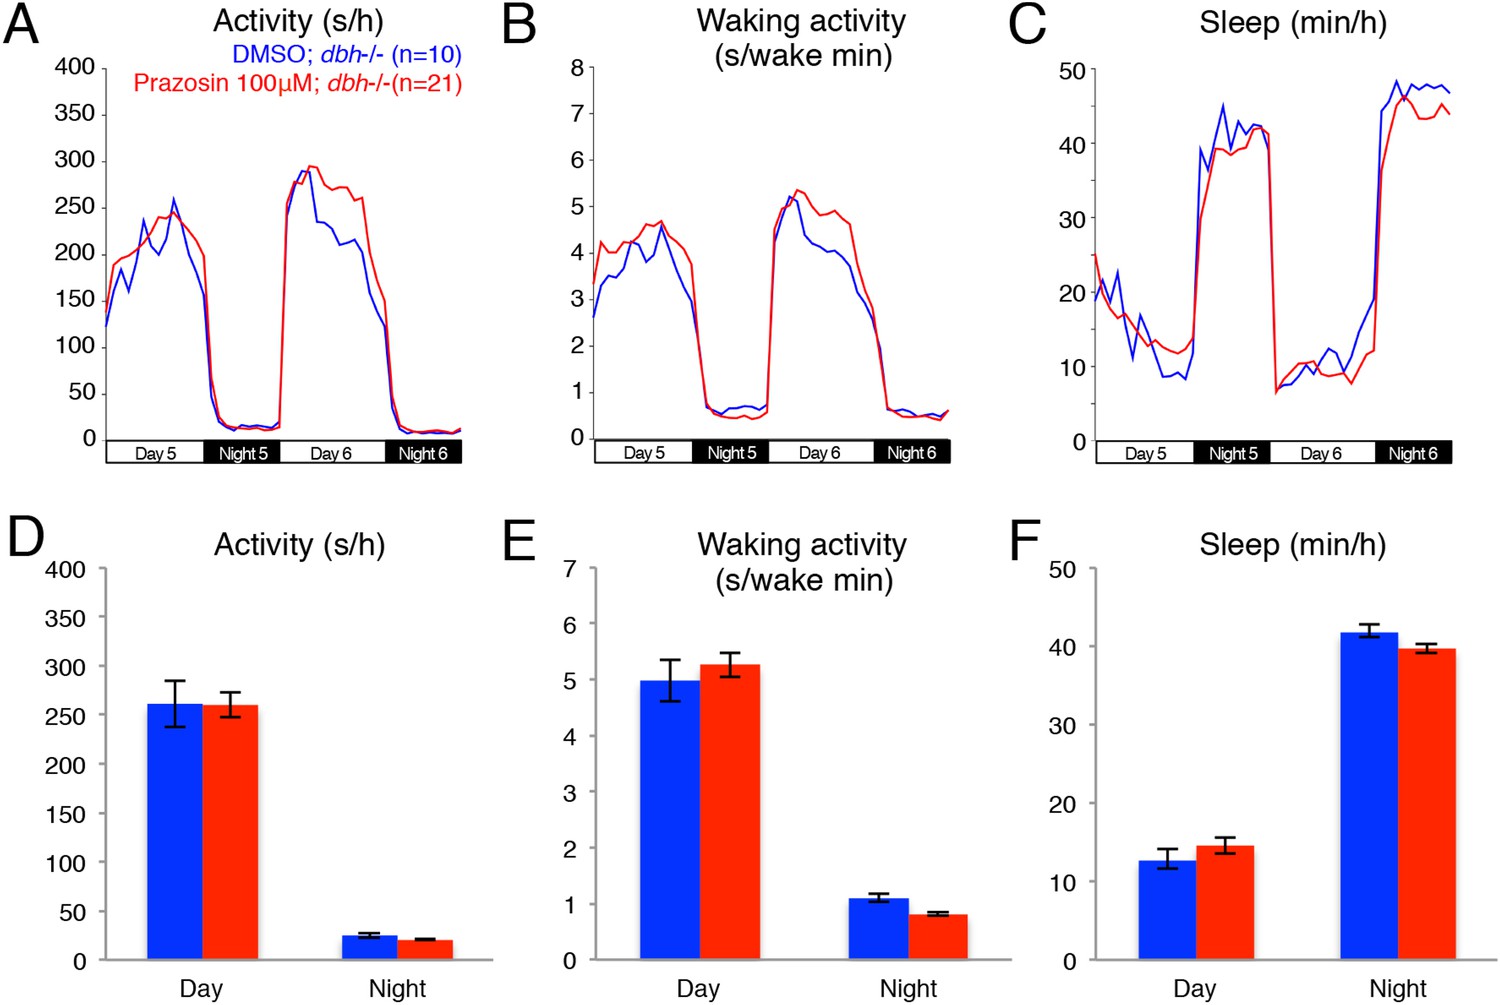
Treatment of dbh−/− fish with prazosin does not alter sleep/wake behavior.
Representative activity (A), waking activity (B) and sleep (C) traces of vehicle (blue) and prazosin (red) treated zebrafish dbh−/− larvae. Bar graphs of activity (D), waking activity (E) and sleep (F) from two combined experiments (n > 45 for each condition). Bars represent mean ± s.e.m. n indicates number of larvae.
Figure 3
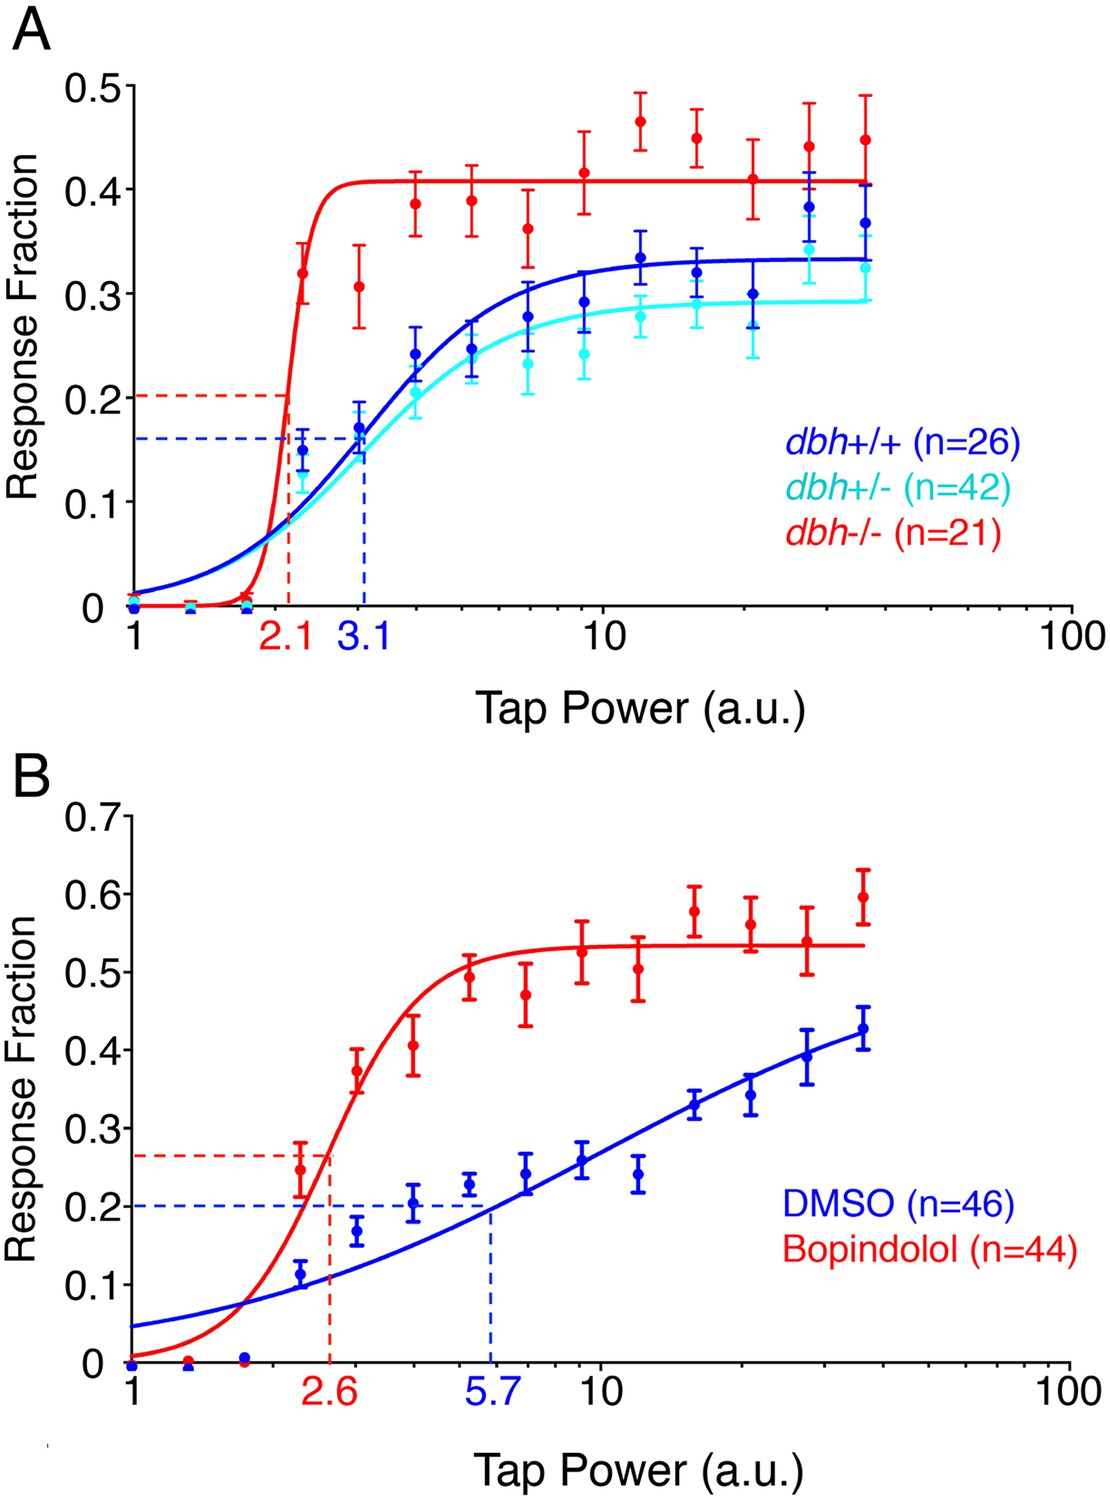
dbh mutants and bopindolol-treated WT larave exhibit lower arousal threshold.
Stimulus-response curves generated by a tapping assay for dbh−/− and sibling control larvae (A), and bopindolol and DMSO treated WT larvae (B). Thirty trials were performed at each stimulus intensity, with a 1 min inter-trial interval. Each data point indicates mean ± s.e.m. Stimulus-response curves were constructed using the non-linear variable slope module in Prism and fitted using ordinary least squares. Dashed lines mark the ETP50 values for different genotypes and drug treatments. dbh−/− have an ETP50 value of 2.1 vs 3.1 for sibling controls (32% decrease, p < 0.0001 by extra sum-of-squares F test) (A), and bopindolol treated animals have an ETP50 value of 2.6 vs 5.7 for sibling controls (54% decrease, p < 0.0001 by extra sum-of-squares F test) (B). n indicates number of larvae.
Figure 4 with 4 supplements
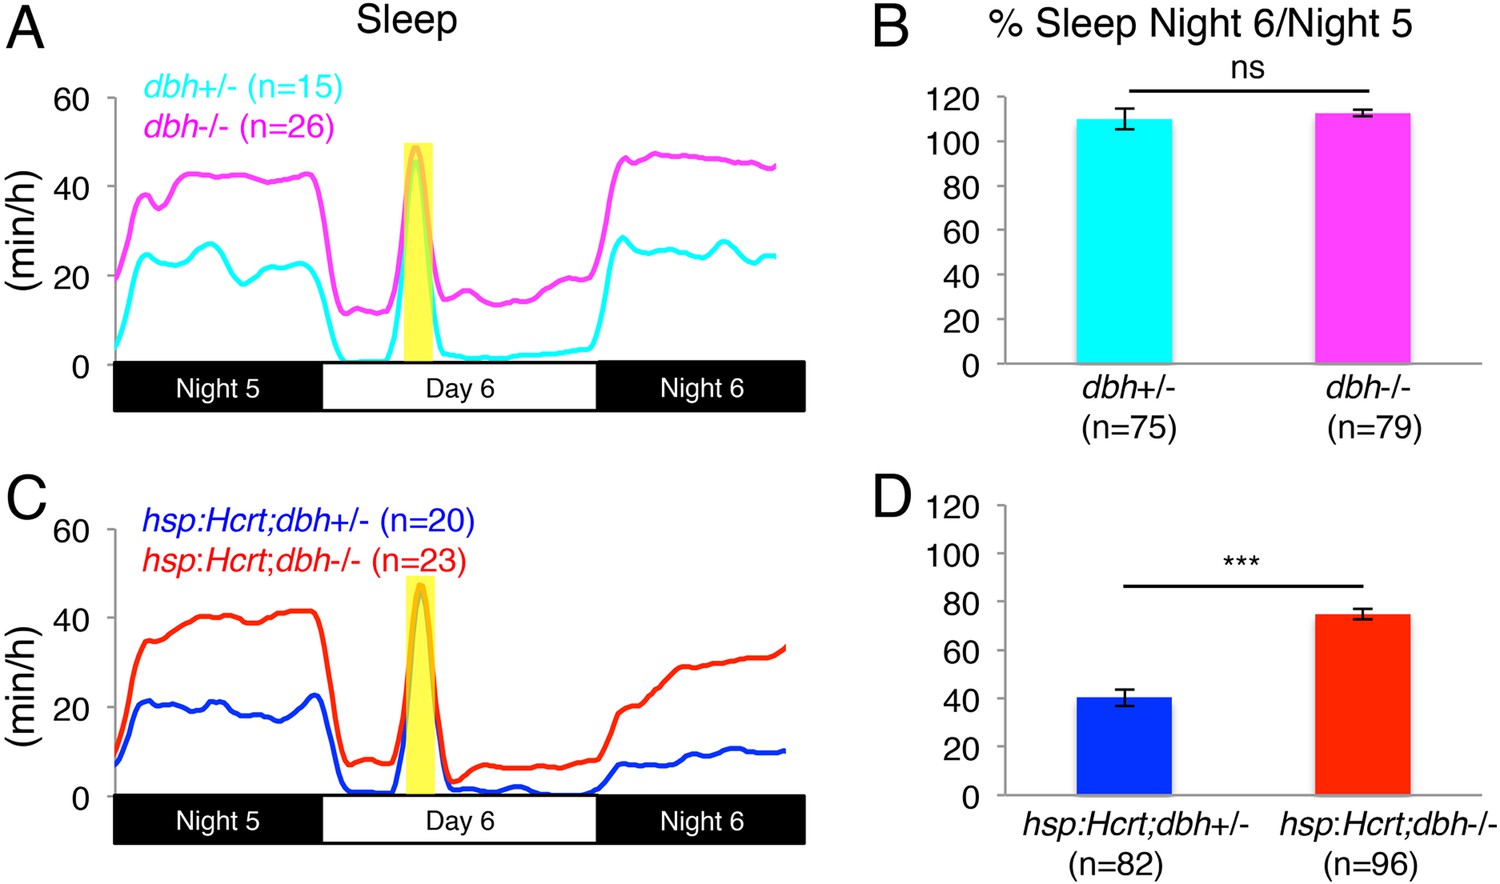
Reduced sleep at night due to Hcrt overexpression is suppressed in dbh mutants.
(A, C) Sleep traces from a single representative experiment; yellow region indicates time of heat shock (HS) during day 6. (B, D) Bar graphs show mean ± s.e.m. percentage change in sleep during night 6 compared to night 5 from four combined experiments. (B) In the absence of the hsp:Hcrt transgene, HS during day 6 has no significant effect on dbh−/− larvae compared to dbh+/− larvae. (D) The reduced sleep induced by Hcrt overexpression is significantly diminished in dbh−/− larvae compared to dbh+/− sibling controls. n indicates number of larvae. ***, p < 0.0001 and ns, not significant by one-way ANOVA.
Figure 4—figure supplement 1
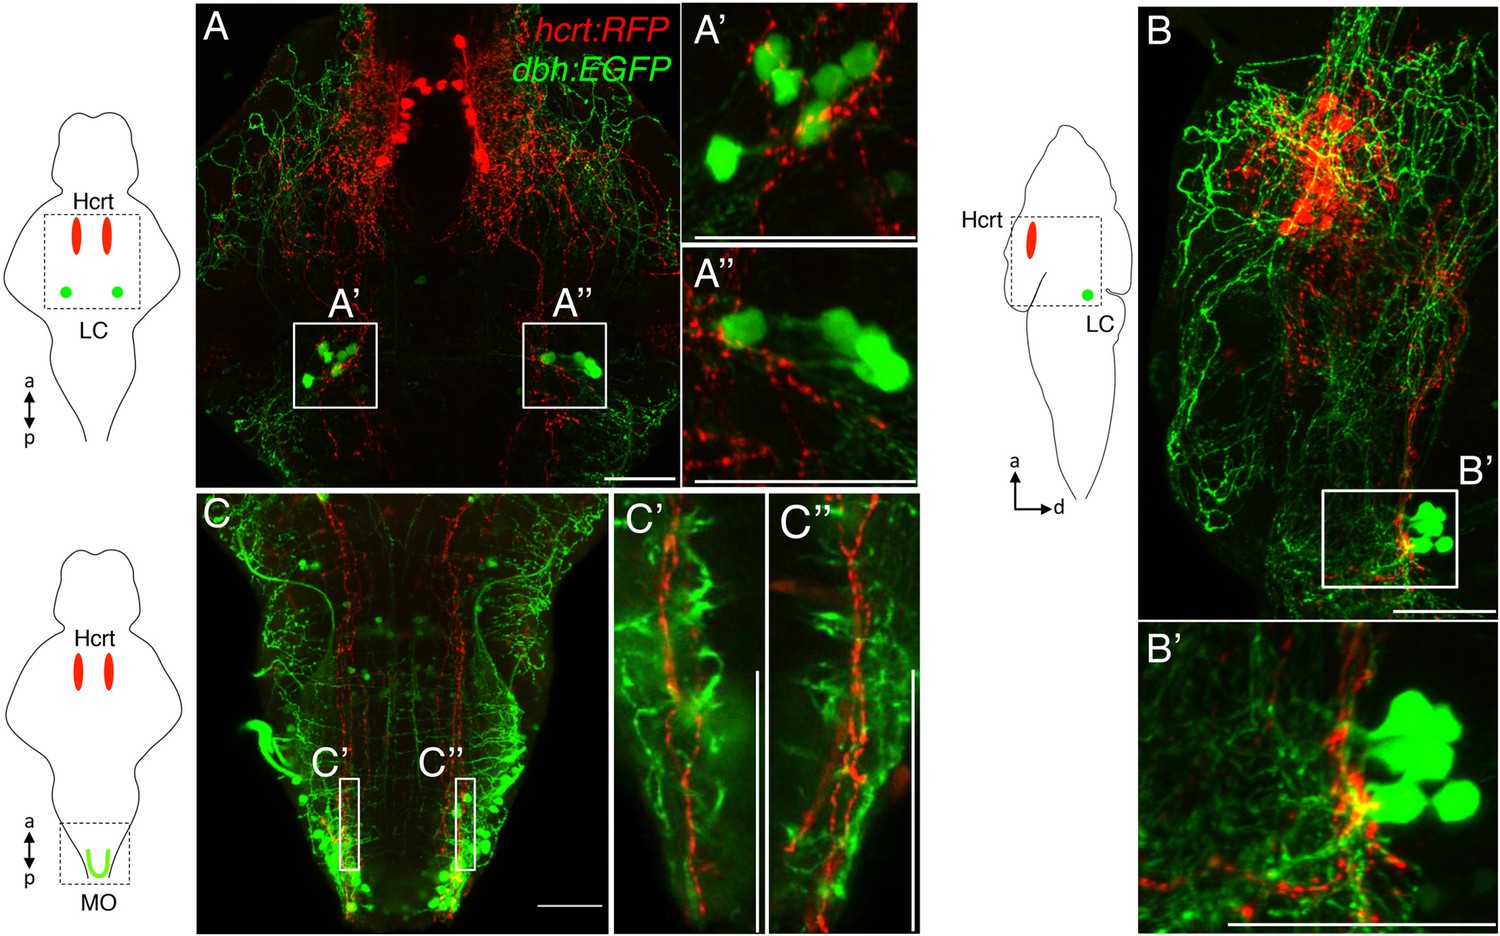
Hcrt neurons project to dbh expressing cells.
Hcrt neurons (red) project to dbh expressing cells (green) in the LC. (A) Dorsal-ventral maximum intensity projection, (B) lateral maximal intensity projection (dorsal to the right). Boxed regions are shown at higher magnification in (A′, A′′, B′). (C) Projections from Hcrt neurons to dbh-expressing neurons in the medulla oblongata (MO). A dorsal-ventral maximum intensity projection is shown. Single optical sections of the boxed regions are shown at higher magnification in (C′, C′′). Schematic diagrams indicate brain regions shown in the confocal images. a = anterior, p = posterior, d = dorsal. Scale bars = 50 μm.
Figure 4—figure supplement 2
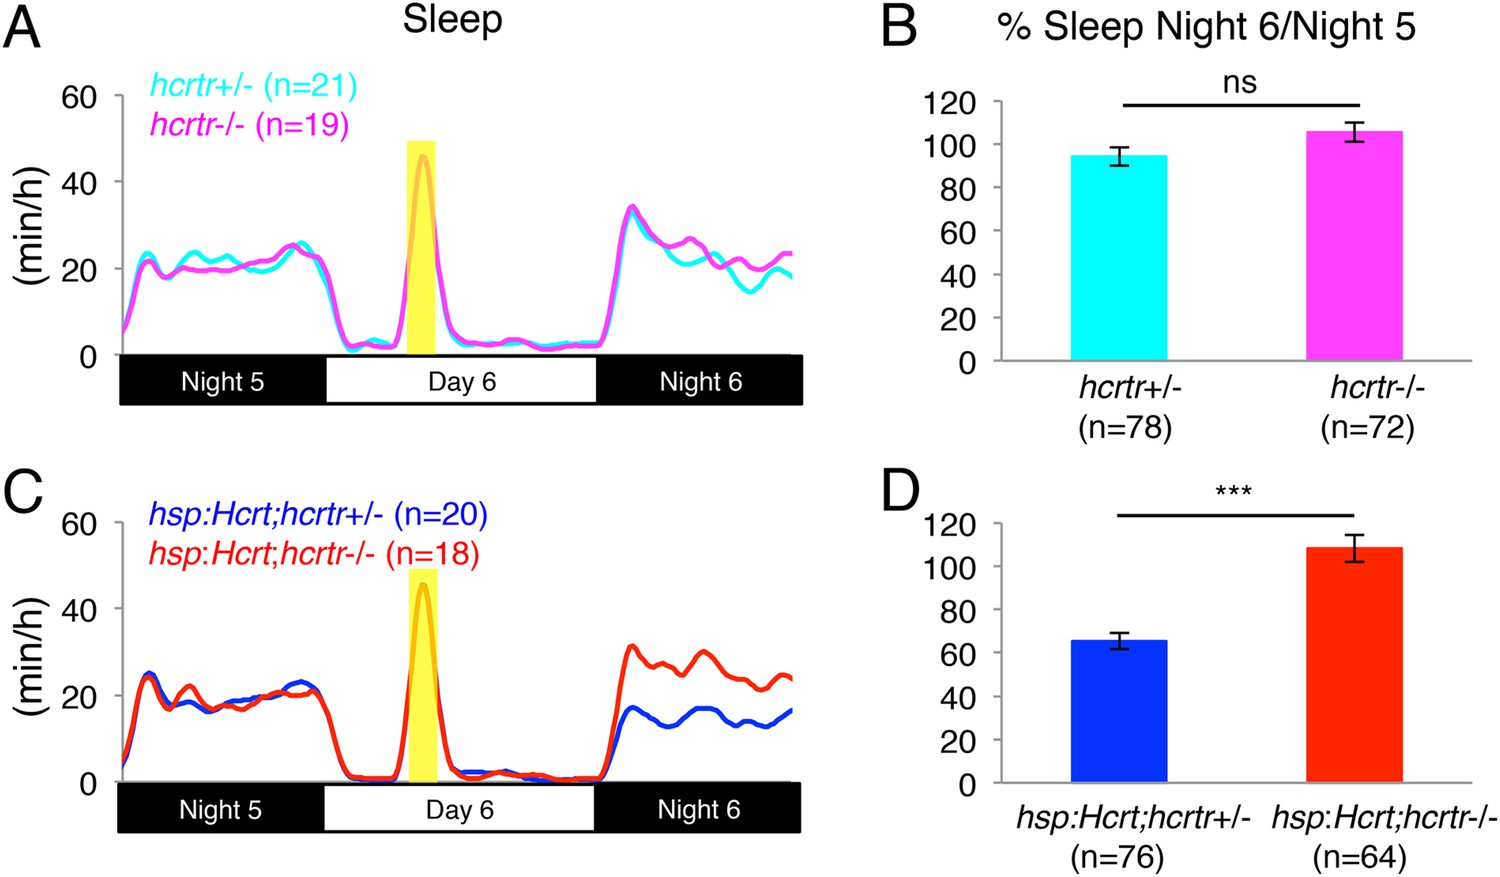
Reduced sleep at night following Hcrt overexpression requires the hcrtr.
(A, C) Sleep traces from a single representative experiment; yellow region indicates time of HS during day 6. (B, D) Bar graphs show mean ± s.e.m. percentage change in sleep during night 6 compared to night 5 from four combined experiments. (B) In the absence of the hsp:Hcrt transgene, HS during day 6 has no significant effect on hcrtr−/− larvae compared to hcrtr+/− larvae. (D) The reduced sleep induced by Hcrt overexpression is significantly diminished in hcrtr−/− larvae compared to hcrtr+/− sibling controls. n indicates number of larvae. ***, p < 0.0001 and ns, not significant by one-way ANOVA. We note that zebrafish hcrtr−/− larvae have been shown to exhibit normal baseline locomotor activity and sleep levels (Appelbaum et al., 2009), similar to mouse hcrt and hcrt receptor 2 mutants (Willie et al., 2003; Mochizuki et al., 2011).
Figure 4—figure supplement 3

Reduced sleep at night due to Hcrt overexpression is suppressed by prazosin.
(A, C) Sleep traces from a single representative experiment; yellow region indicates time of HS during day 6. (B, D) Bar graphs show mean ± s.e.m. percentage change in sleep during night 6 compared to night 5 from two combined experiments. (B) In the absence of the hsp:Hcrt transgene, HS during day 6 has no significant effect on the Sleep Night 6/Night 5 ratio, whether the animals are treated with prazosin or vehicle. (D) The reduced sleep induced by Hcrt overexpression is significantly diminished by prazosin. n indicates number of larvae. **, p < 0.01 and ns, not significant by one-way ANOVA.
Figure 4—figure supplement 4
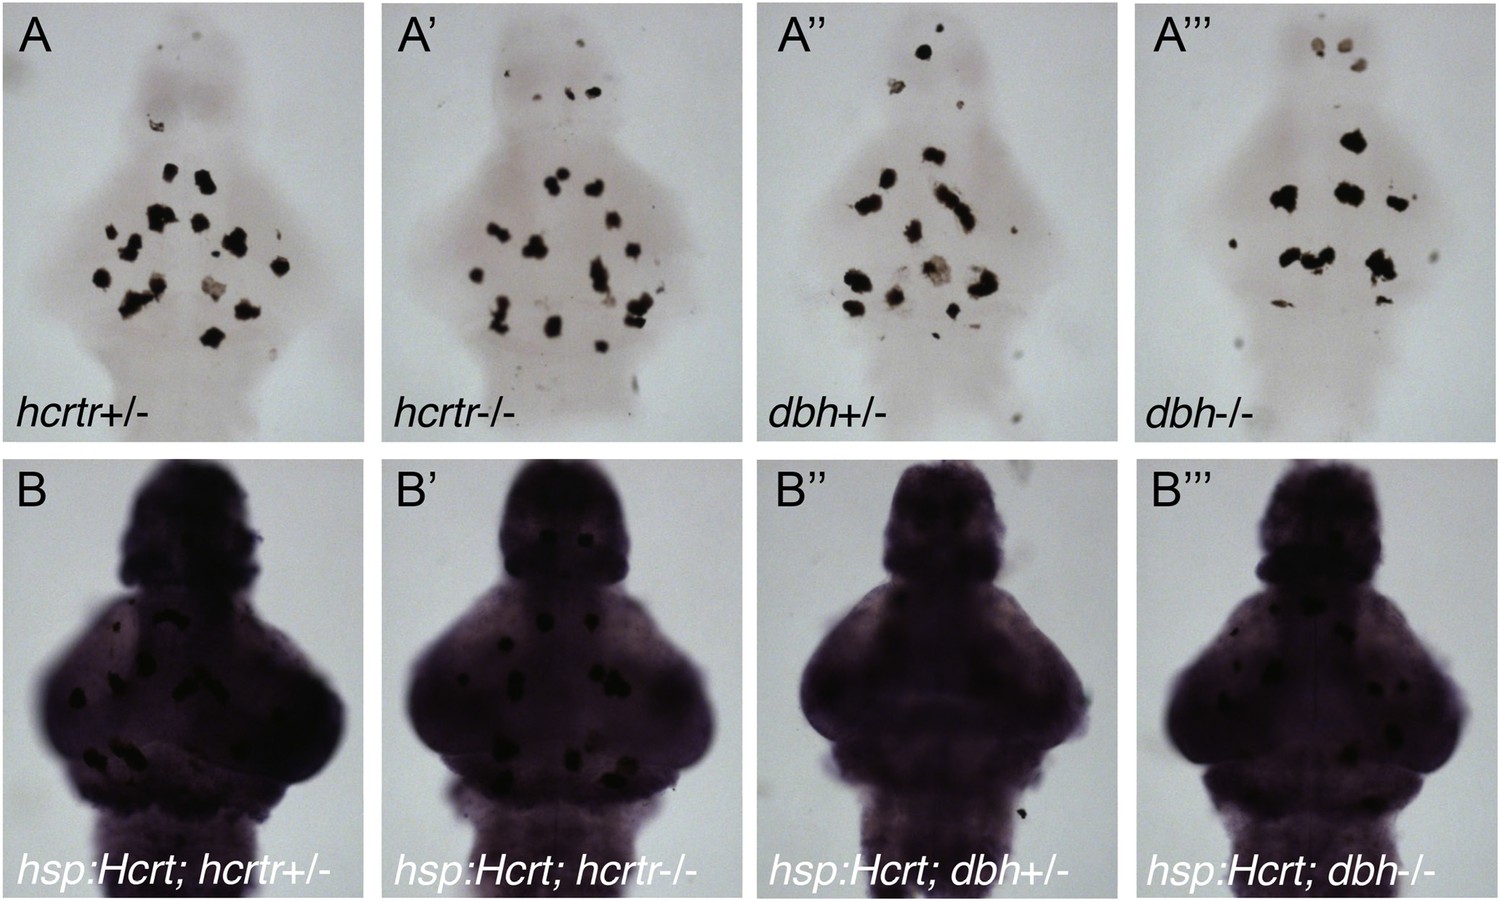
The heat shock promoter is not suppressed in hcrtr or dbh mutants.
Representative images of brains from larvae that do not (A) or do (B) contain the hsp:Hcrt transgene, fixed 30 min after HS, and processed for ISH using a hcrt-specific probe. hcrt overexpression levels are similar for hcrtr+/− (B), hcrtr−/− (B′), dbh+/− (B′′) and dbh−/− (B′′′) animals. Larvae were generated by crossing homozygous to heterozygous mutant animals, and brains were genotyped after imaging. Dark spots in (A–A′′′) are pigment cells. Endogenous hcrt expression is not observed in (A–A′′′) because ISH development was stopped before endogenous hcrt is detectable.
Figure 5 with 1 supplement
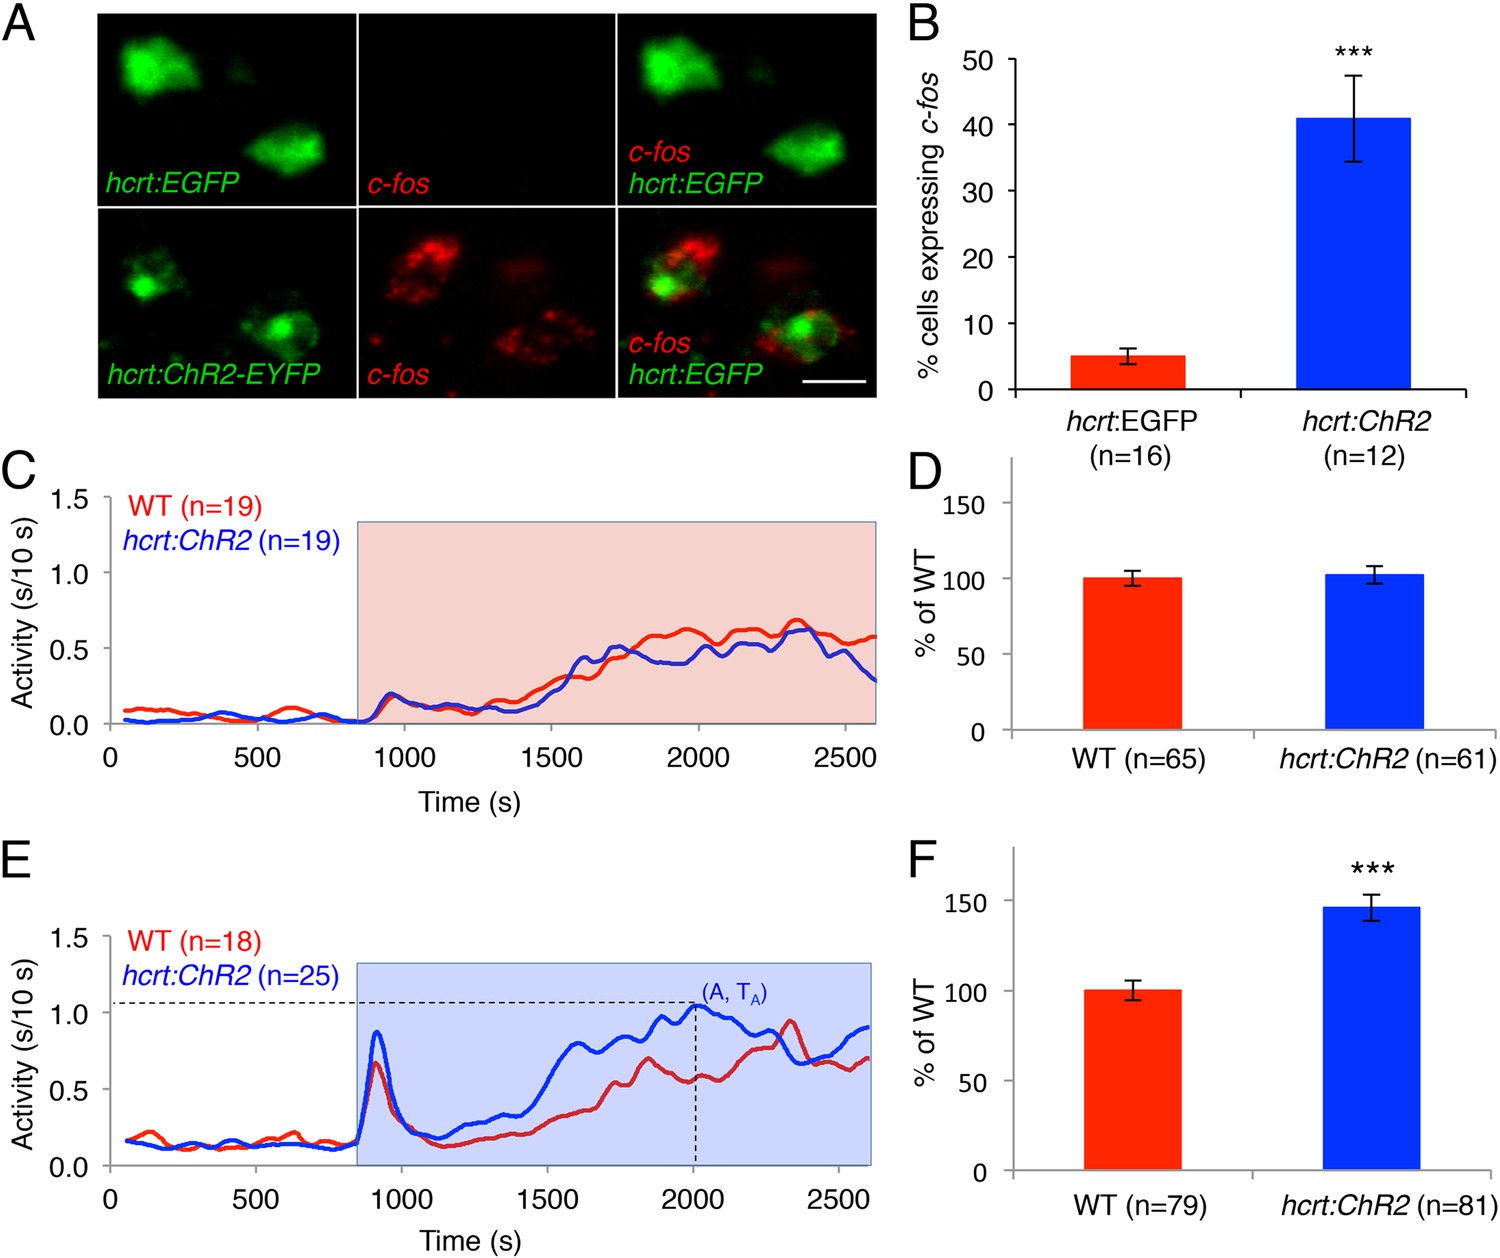
Optogenetic activation of Hcrt neurons increases locomotor activity.
(A) Representative images of Hcrt neurons co-labeled with EYFP or EGFP (green) and c-fos (red). Scale bar = 10 μm. (B) Mean ± s.e.m. percentage of EYFP- or EGFP-expressing neurons that also express c-fos in Tg(hcrt:EGFP) and Tg(hcrt:ChR2-EYFP) larvae. (C) Representative locomotor activity trace during red light exposure. (D) Average locomotor activity relative to WT siblings during red light exposure. Data is pooled from 3 experiments and is represented as mean ± s.e.m. (E) Representative locomotor activity trace during blue light exposure. (F) Average locomotor activity relative to WT siblings during blue light exposure. Data is pooled from 4 experiments and is represented as mean ± s.e.m. Red and blue boxes in (C) and (E) indicate periods of red and blue light illumination. ‘A’ is the maximum activity reached for larvae of a particular genotype and ‘TA’ is the time taken to reach maximum activity A. n indicates number of larvae. ***, p < 0.0001 by one-way ANOVA.
Figure 5—figure supplement 1
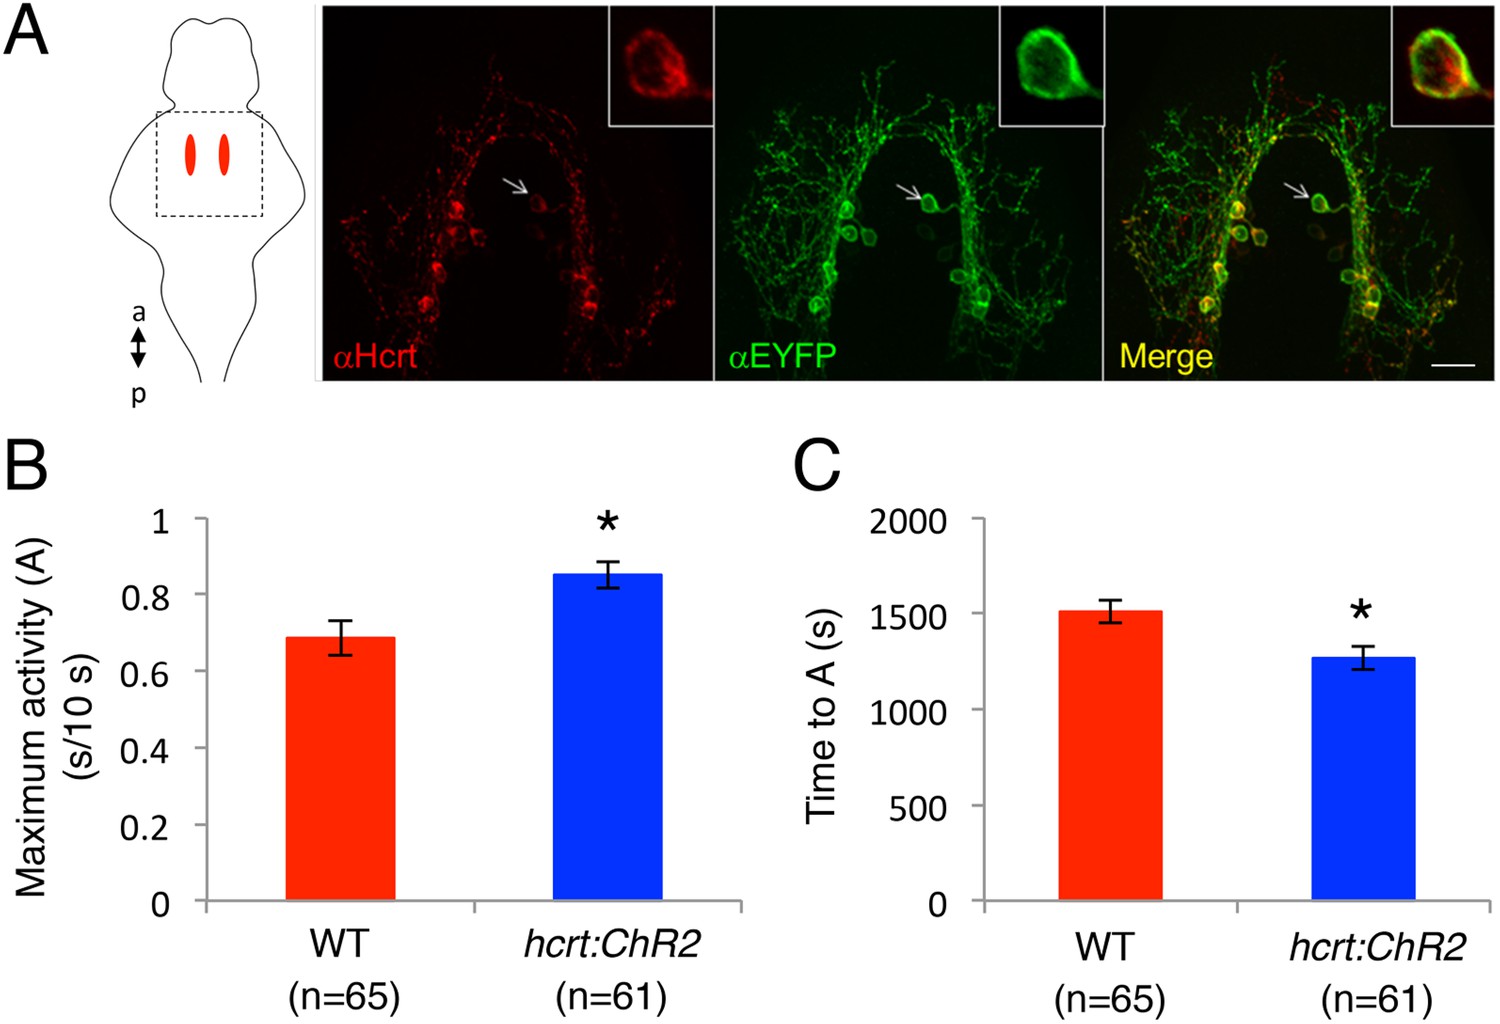
Specific expression of ChR2-EYFP in Hcrt neurons and temporal dynamics of hcrt:ChR2-EYFP induced locomotor activity.
(A) Representative image from a Tg(hcrt:ChR2-EYFP) larval brain showing Hcrt (red) and EYFP (green) immunoreactivity, and merged images (yellow). Arrow indicates a neuron that is shown at higher magnification in the inset images. Schematic diagram indicates the brain region shown in the images. a = anterior, p = posterior. Scale bar = 20 μm. (B). Activation of Hcrt neurons using ChR2 changes the dynamics of locomotor activity. Tg(hcrt:ChR2-EYFP) larvae reach a higher maximum level of locomotor activity (B), and they do so faster (C), than their non-transgenic siblings. ‘A’ is the maximum activity reached for larvae of a particular genotype and ‘TA’ is the time taken to reach maximum activity, as diagrammed in Figure 5. Data represent mean ± s.e.m. n indicates number of larvae. *, p < 0.05 by one-way ANOVA.
Figure 6 with 1 supplement
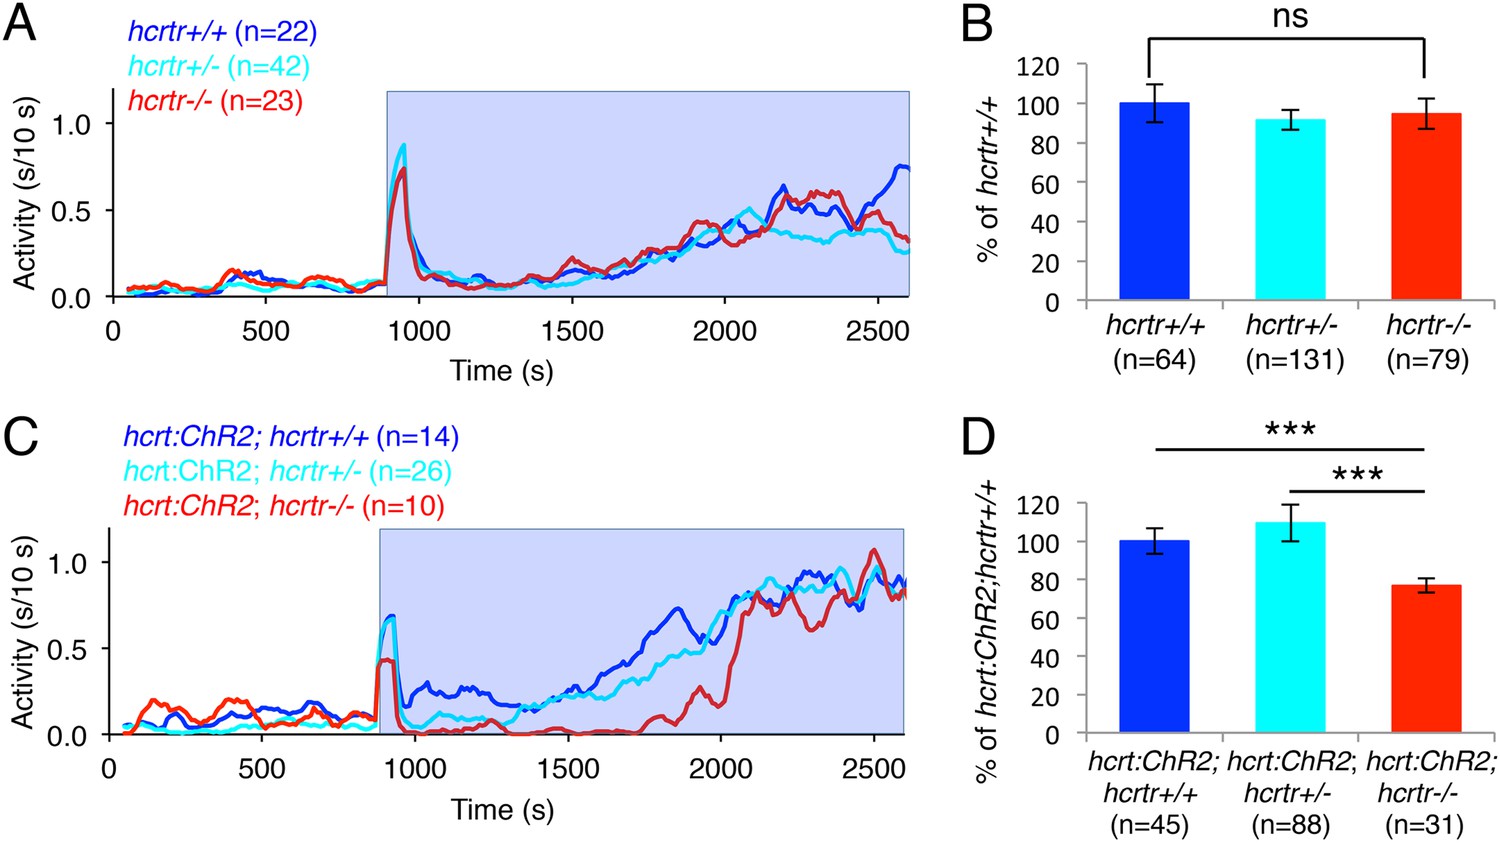
The hcrtr is required for Hcrt neuron-induced increased locomotor activity.
(A, C) Representative locomotor activity traces for hcrtr−/− and sibling controls without (A) and with (C) the hcrt:ChR2-EYFP transgene during blue light exposure. (B, D) Average locomotor activity relative to sibling controls. Data is pooled from 3 experiments in both cases. Data is represented as mean ± s.e.m. and is plotted as percentage of hcrtr+/+ (B) or hcrt:ChR2-EYFP; hcrtr+/+ (D). n indicates number of larvae. ***, p < 0.0001 and ns, not significant by one-way ANOVA followed by Tukey's test to correct for multiple comparisons.
Figure 6—figure supplement 1

Hcrt signaling is required for Hcrt neuron-induced increased locomotor activity.
In this experiment, larvae of all six genotypes were tested in the same behavioral plates. Tg(hcrt:ChR2-EYFP);hcrtr+/+ larvae (blue stripes) showed a significant increase in locomotor activity compared to hcrtr+/+ larvae (blue). A similar increase was observed for Tg(hcrt:ChR2-EYFP);hcrtr+/− larvae (cyan stripes) compared to hcrtr+/− larvae (cyan), although the difference was smaller than for hcrtr+/+ larvae, suggesting a dosage effect. Tg(hcrt:ChR2-EYFP);hcrtr−/− larvae (red stripes) were also more active than hcrtr−/− larvae (red), although the difference was much smaller than for Tg(hcrt:ChR2-EYFP);hcrtr+/+ larvae (blue stripes) compared to hcrtr+/+ larvae (blue). Tg(hcrt:ChR2-EFYP);hcrtr+/+ larvae (blue stripes) were also significantly more active than Tg(hcrt:ChR2-EYFP);hcrtr−/− larvae (red stripes). These results suggest that most, but not all, of the effect of stimulating Hcrt neurons on locomotor activity is due to Hcrt signaling. Data is pooled from 3 experiments. Data is represented as mean ± s.e.m. and is plotted as percentage of hcrtr+/+. n indicates number of larvae. *, p < 0.05; **p < 0.01; ***, p < 0.0001 by Steel–Dwass test and correction for multiple comparisons.
Figure 7

Optogenetic stimulation of Hcrt neurons activates LC neurons.
(A) Schematic representation of areas stimulated (Hcrt, yellow) and imaged (LC, green). a = anterior, p = posterior. (B, C) Representative images of a LC cell expressing GCaMP6s in a Tg(hcrt:EGFP) (B) or Tg(hcrt:ChR2-EYFP) (C) larva before (B, C) and immediately after (B′, C′) stimulation of Hcrt neuron region. (D) GCaMP6s fluorescence intensity for a representative LC neuron in a Tg(hcrt:EGFP) (top) and a Tg(hcrt:ChR2-EYFP) (bottom) larva. Single-trial (gray) and average (black) responses are shown. (E) Mean ± s.e.m. ∆F/F (%) values averaged for all trials. n indicates number of trials for 5 Tg(hcrt:EGFP) and 4 Tg(hcrt:ChR2-EYFP) larvae. ***, p < 0.001 by one-way ANOVA. See Videos 1 and 2 for examples of GCaMP6s imaging.
Figure 8
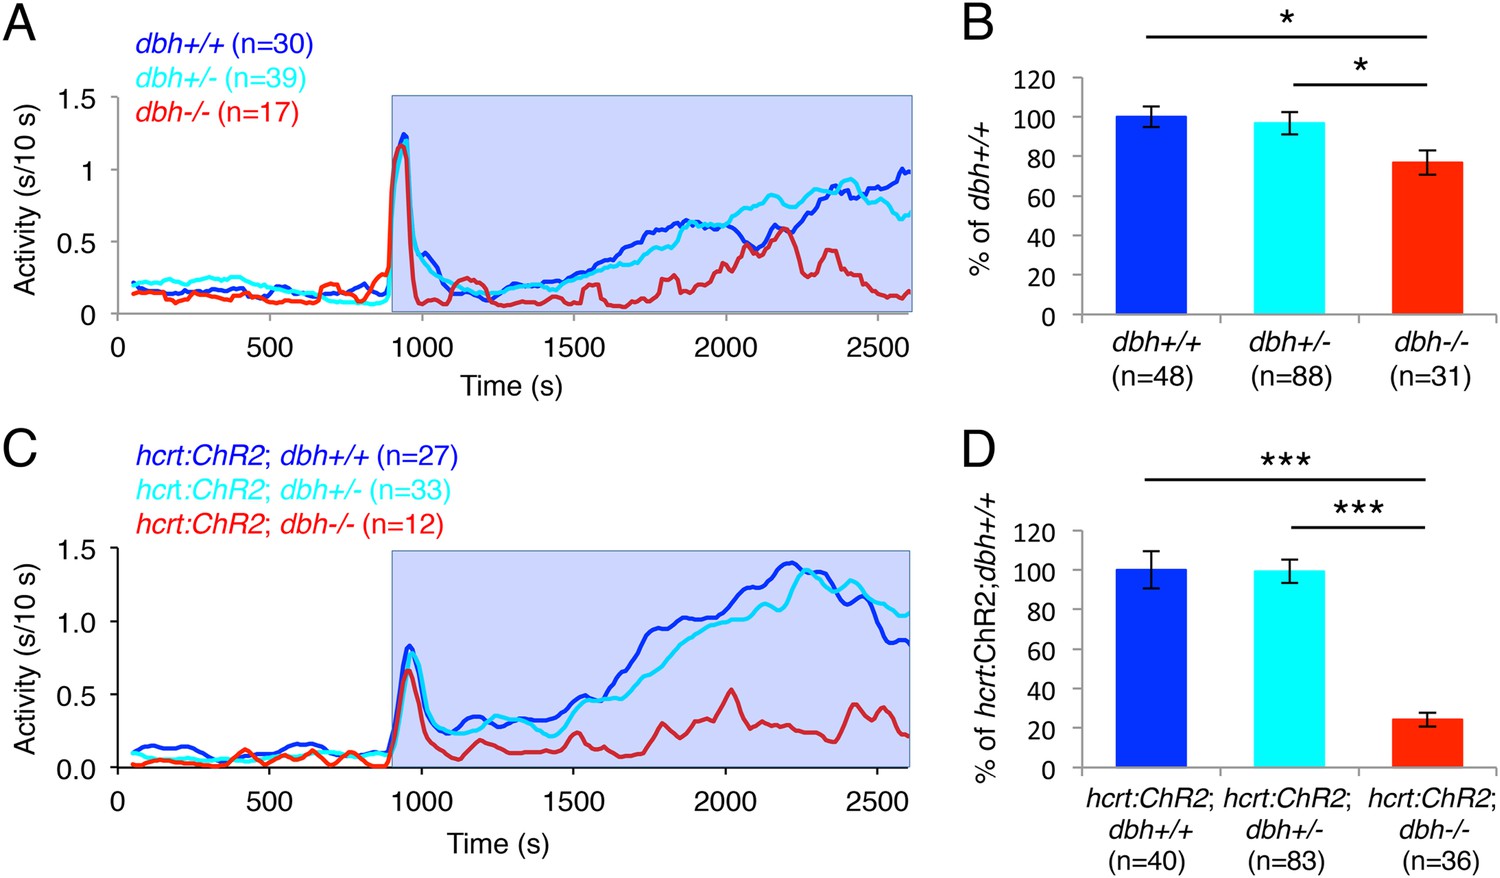
dbh is required for Hcrt neuron-induced increased locomotor activity.
(A, C) Representative locomotor activity traces for dbh−/− and sibling control larvae without (A) and with (C) the hcrt:ChR2-EYFP transgene during blue light exposure. (B, D) Average locomotor activity relative to sibling controls. Data is pooled from 2 (B) or 3 (D) experiments. Data is represented as mean ± s.e.m. and is plotted as percentage of dbh+/+ (B) or hcrt:ChR2-EYFP; dbh+/+ (D). n indicates number of larvae. *, p < 0.05 and ***, p < 0.0001 by one-way ANOVA followed by Tukey's test to correct for multiple comparisons.
Videos
Video 1
Pulsed illumination of hcrt:EGFP neurons does not affect GCaMP6s fluorescence in LC neurons.
Two trials for a representative LC neuron are shown. Frames labeled ‘Stimulation’ indicate periods during which the soma of Hcrt neurons were illuminated by ten 0.3 s pulses of 488 nm light, during which time GCaMP6s was not imaged in the LC. See Figure 7 for quantification.
Video 2
Pulsed illumination of hcrt:ChR2-EYFP neurons increases GCaMP6s fluorescence in LC neurons.
Two trials for a representative LC neuron are shown. Frames labeled ‘Stimulation’ indicate periods during which the soma of Hcrt neurons were illuminated by ten 0.3 s pulses of 488 nm light, during which time GCaMP6s was not imaged in the LC. See Figure 7 for quantification.
Additional files
-
Source code 1
Scripts used for analysis of behavioral data. sort_fish_sttime_192.pl is a Perl script (Prober et al., 2006) that converts data acquired by the Viewpoint videotracker system to a format that is useful for analysis using Matlab and removes notations that are not relevant to behavioral analysis. perl_batch_192well.m is a Matlab script that allows the sort_fish_sttime_192.pl script to run on the Matlab platform. TapAnalysis.m is a Matlab script that analyzes tapping assay data and generates a table that lists the number of larvae that moved during each tapping event. VT_analysis.m is a Matlab script (modified from Prober et al., 2006) that analyzes locomotion data collected by the Viewpoint videotracker system to quantify several metrics, including activity, waking activity, sleep, sleep architecture and sleep latency. Detailed instructions on the use of these scripts will be provided upon request.
- https://doi.org/10.7554/eLife.07000.024
Download links
A two-part list of links to download the article, or parts of the article, in various formats.
Downloads (link to download the article as PDF)
Open citations (links to open the citations from this article in various online reference manager services)
Cite this article (links to download the citations from this article in formats compatible with various reference manager tools)
Norepinephrine is required to promote wakefulness and for hypocretin-induced arousal in zebrafish
eLife 4:e07000.
https://doi.org/10.7554/eLife.07000


