A mex3 homolog is required for differentiation during planarian stem cell lineage development
- The Hospital for Sick Children, Canada
- University of Toronto, Canada
- Terrence Donnelly Centre for Cellular and Biomedical Research, Canada
- Ontario Institute for Cancer Research, Canada
Figures
Figure 1 with 2 supplements
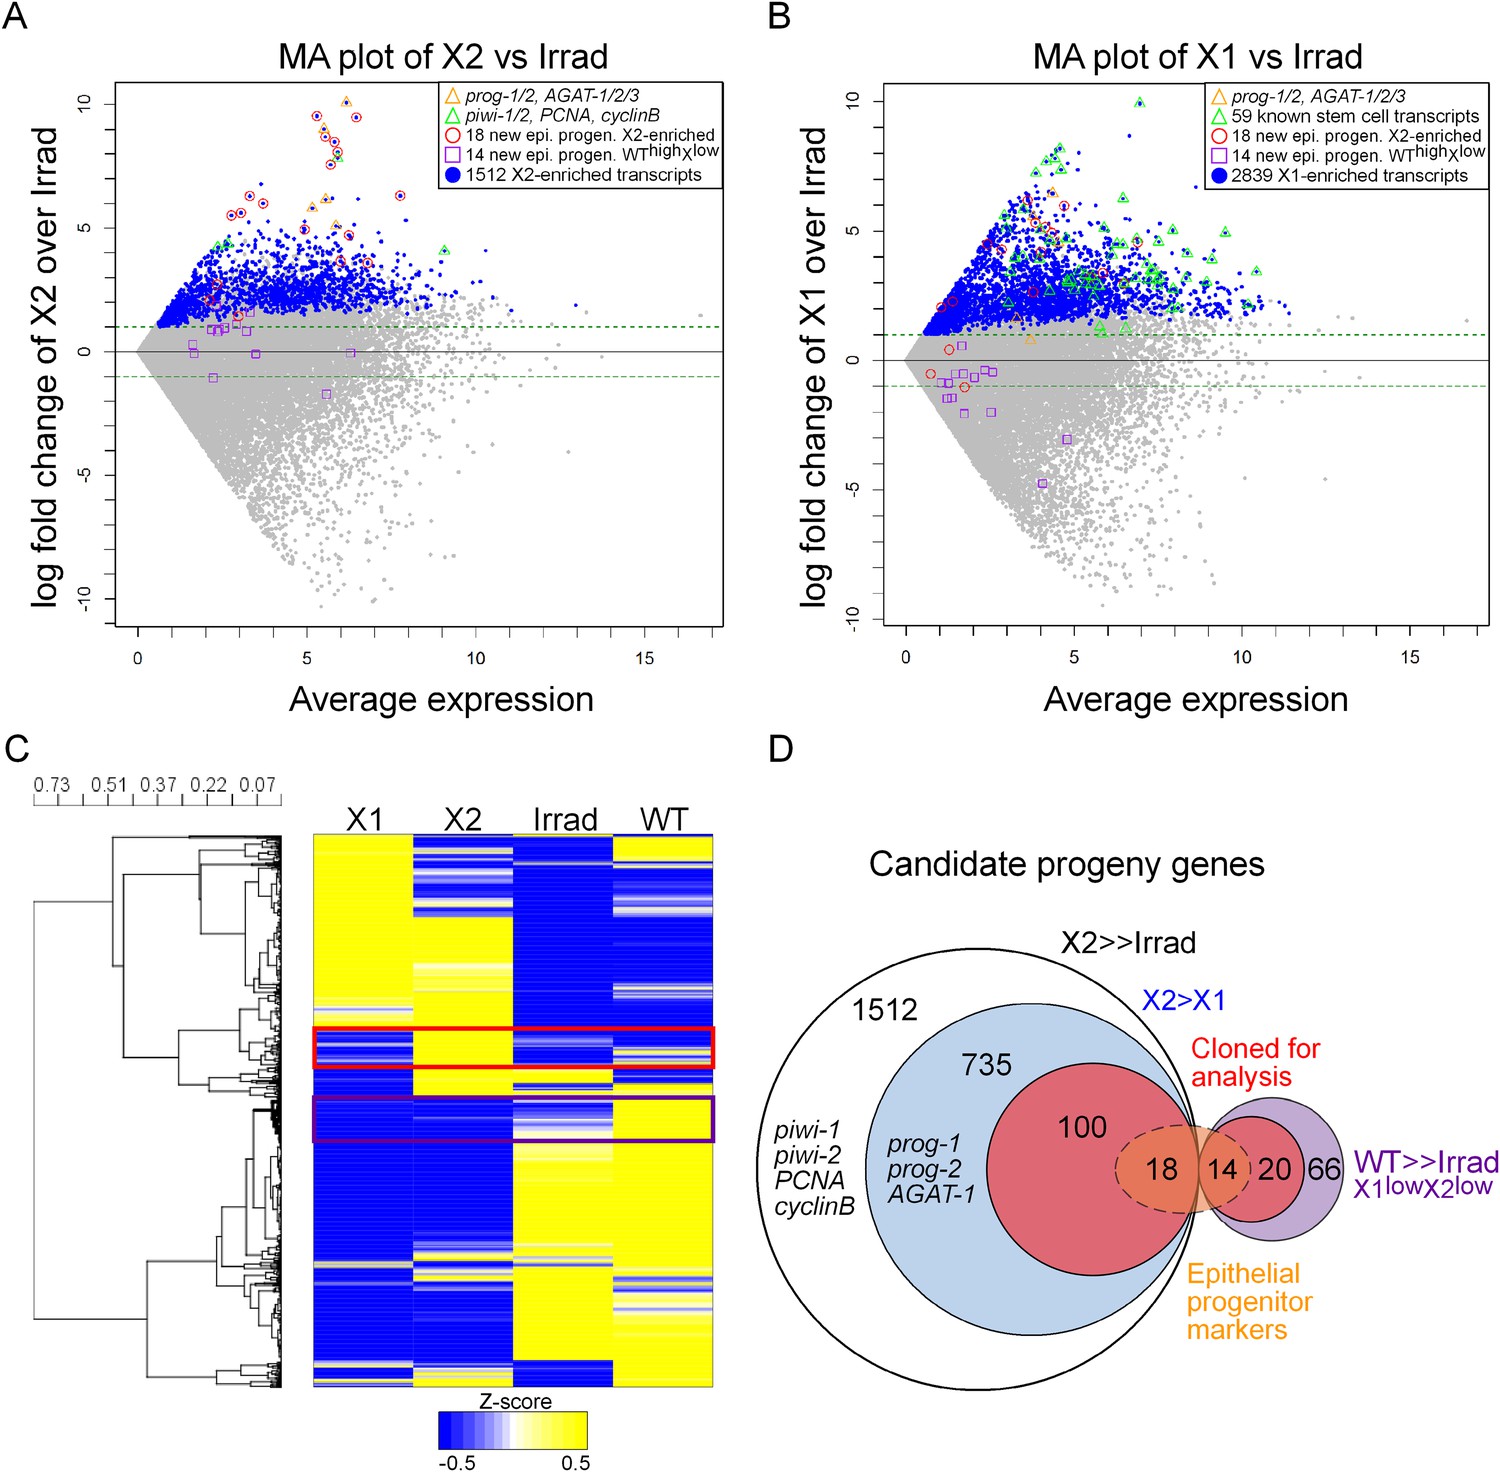
Transcriptional analysis of irradiation-sensitive cell populations in Schmidtea mediterranea.
Irradiation-sensitive cell populations (X1, X2) isolated by fluorescence-activated cell sorting (FACS), lethally irradiated whole worms (Irrad), and intact control worms (WT) were analyzed by RNA-deep sequencing (RNAseq). (A and B) MA plots comparing enrichment in the X2 (A) or X1 (B) cell populations over Irrad, with average expression level. Each gray dot represents one transcript. Blue dots represent transcripts found to be significantly enriched in the respective cell population through DESeq analysis (X2, p < 0.01; X1, p < 0.001). Previously established postmitotic lineage markers are indicated by orange triangles. Previously established stem cell-specific transcripts are indicated as green triangles. Candidate genes identified in this study as markers of epithelial progenitors are indicated as red circles (X2-enriched) or purple boxes (WThighXlow). (C) Hierarchical clustering of RNAseq data identifies transcripts enriched in the X2 population (red box), as well as a group of irradiation-sensitive transcripts, which have high expression in intact control worms but low expression in X1, X2, and Irrad populations (purple box, WThighXlow). To improve visualization, the heatmap depicts z-scores scaled to the range of −0.5 to +0.5. (D) Selection of candidate progeny genes for analysis was determined by enriched expression in X2 fraction compared to both Irrad and X1 fractions. The pool of candidate genes validated in this study to be expressed in epithelial progenitors is indicated in orange. >> denotes more than fivefold enrichment.
Figure 1—figure supplement 1
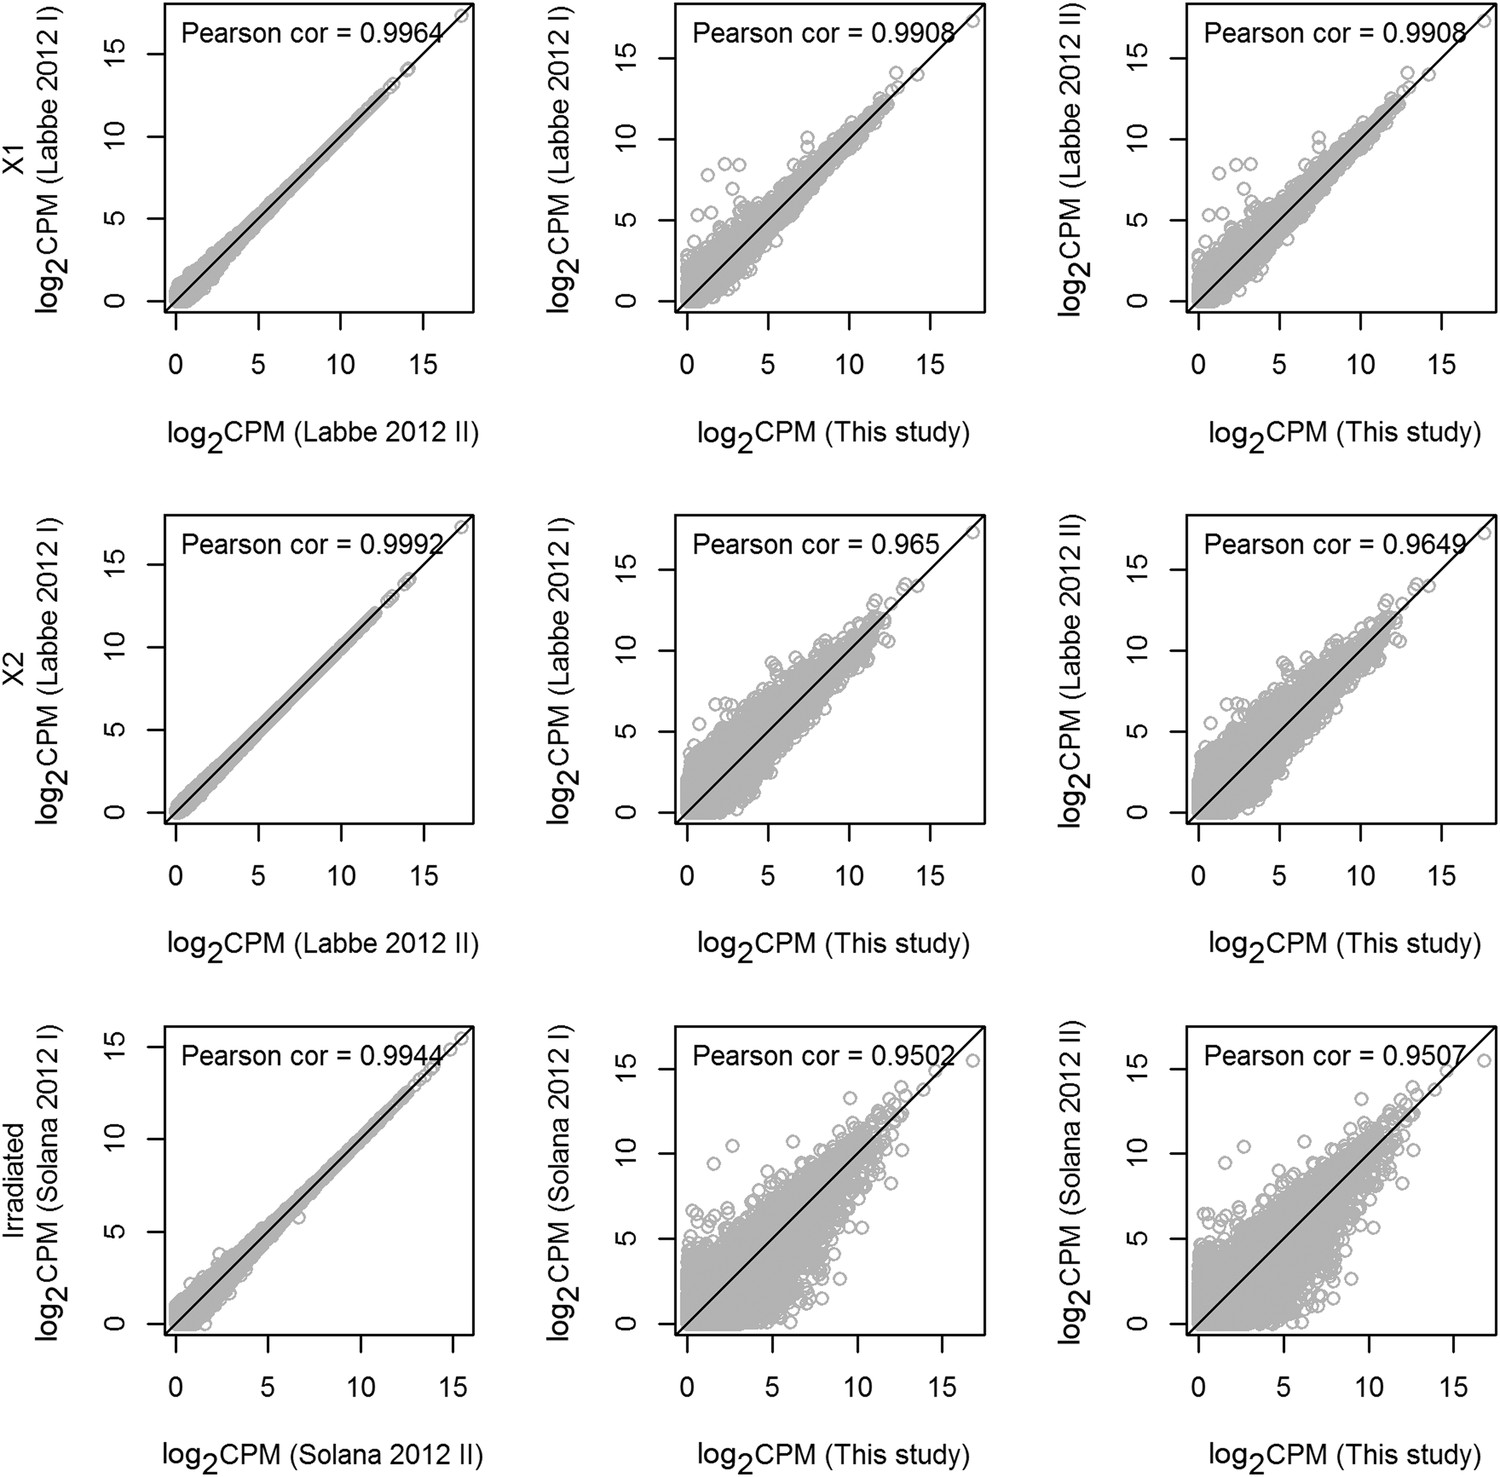
Statistical correlations between new and published data sets.
Scatter plots of transcripts (gray circles) with reads per million values of 1000 or less, displayed as log-transformed values. The black diagonal line represents a Pearson correlation coefficient of 1. The corresponding Pearson correlation coefficients are shown at the top of each panel. All correlation-test p-values were found to be equal to 0 (Student's t-test). As expected, the replicates in each data are highly correlated, and the Pearson correlation coefficients between the replicates in X1 or X2 are greater than 0.95. Furthermore, sequencing from whole irradiated planarians is highly correlated.
Figure 1—figure supplement 2
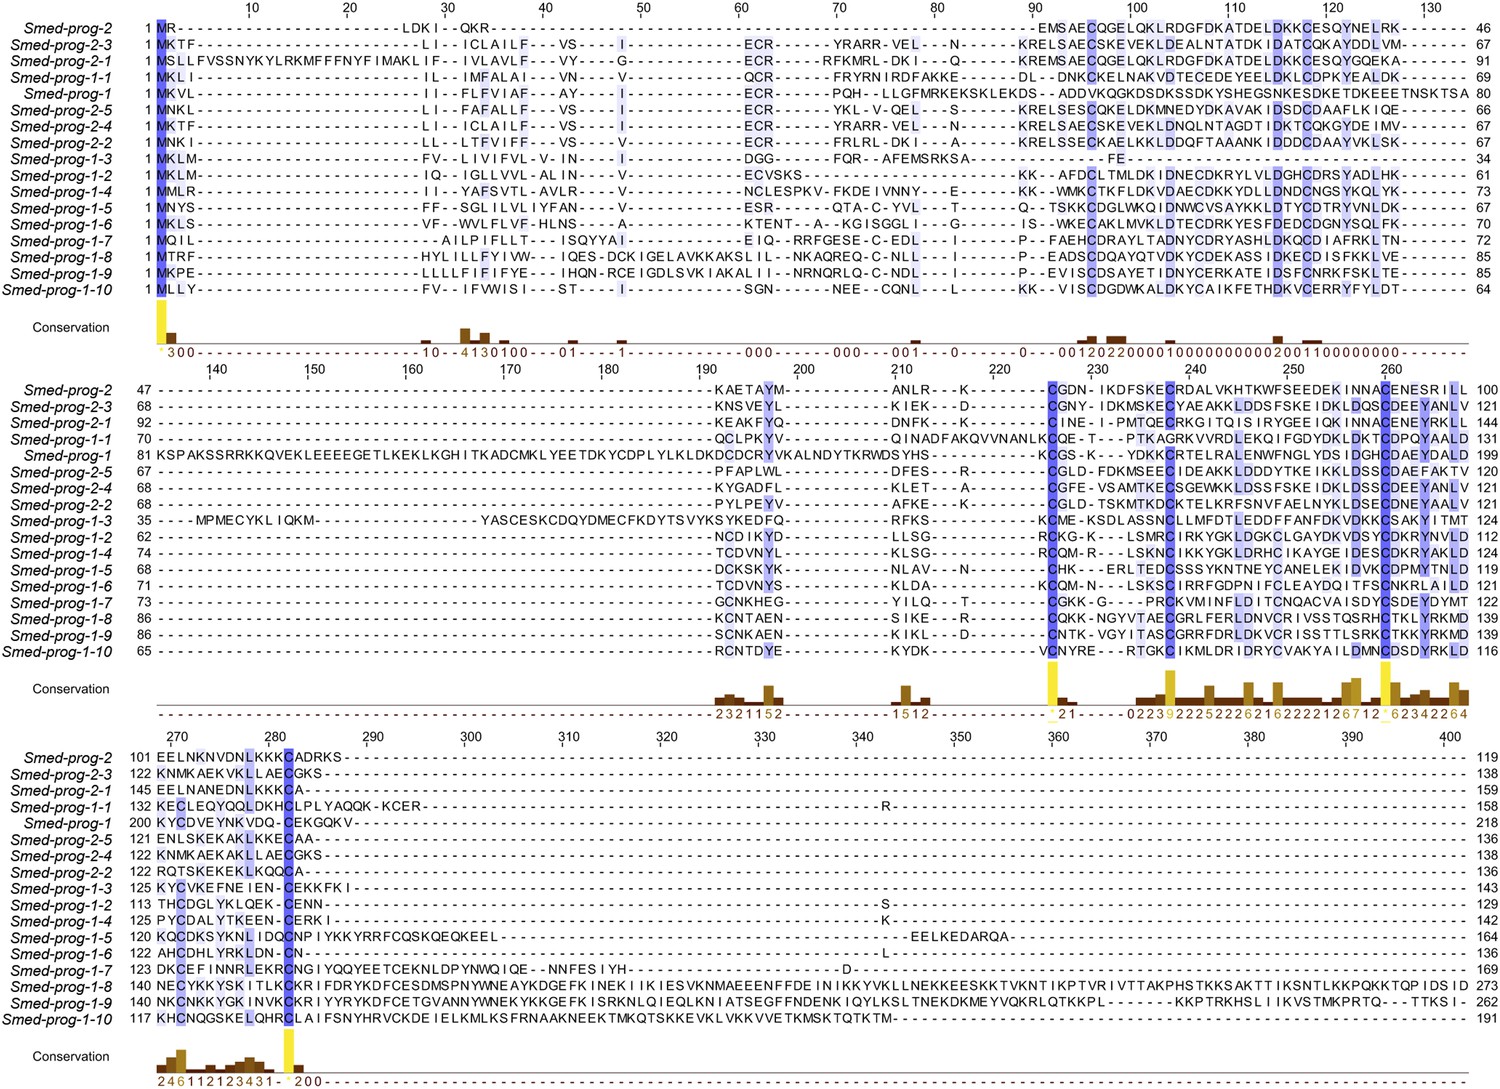
Predicted protein alignments of the PROG family that are irradiation-sensitive.
An alignment of the 17 PROG family genes used in this study is shown using the tool MUSCLE. Blue shading of residues reflects conservation, which is also plotted below the alignment in the ‘conservation’ plot.
Figure 2 with 4 supplements
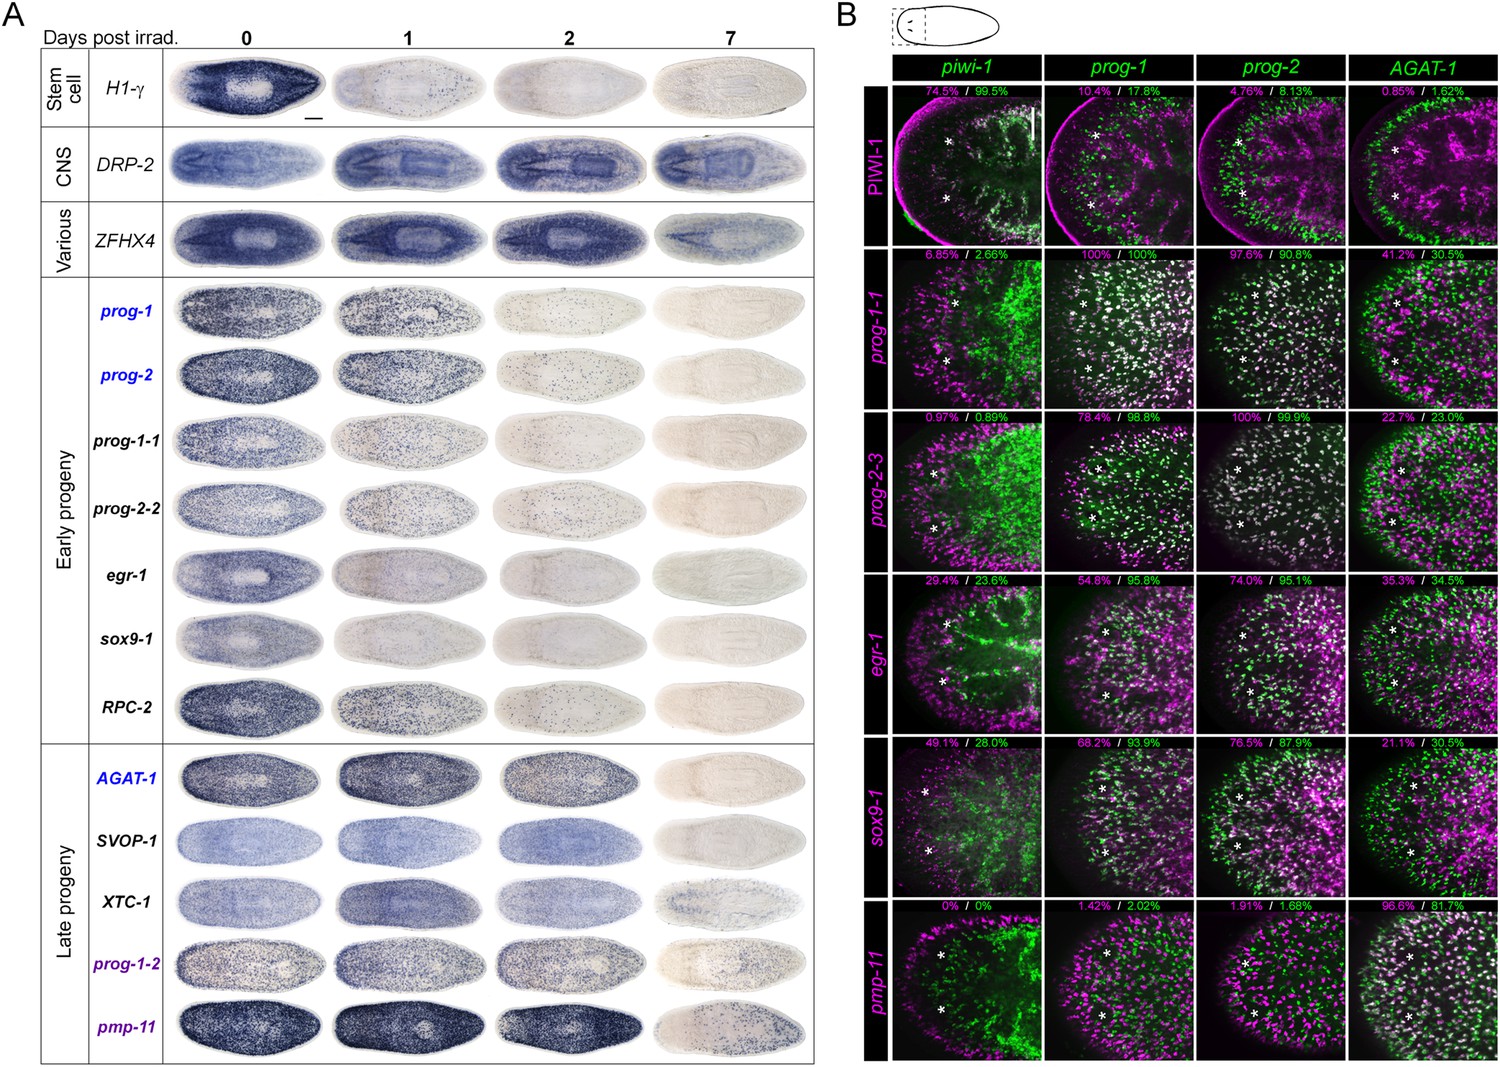
Expression analyses of candidate progeny genes.
(A) Whole-mount in situ hybridization (WISH) analysis of X2-enriched and WThighXlow candidate progeny genes in control and lethally irradiated worms. Examples of genes expressed in a stem cell-like pattern, strong in the bi-lobed brain, distinct and unique patterns, or in a prog-like sub-epithelial pattern are shown. prog-like genes were categorized as early progeny markers when they displayed similar post-irradiation down-regulation kinetics as prog-1 and prog-2, or late progeny markers when they displayed similar loss kinetics as AGAT-1. Established lineage markers prog-1, prog-2, and AGAT-1 are included as comparisons and highlighted in blue text. Candidate epithelial progenitor genes with WThighXlow expression are indicated in purple text. Anterior, left; scale bar, 200 μm. (B) Combinatorial double fluorescent WISH (dFISH) between lineage markers and identified X2-enriched and WThighXlow postmitotic progeny markers was performed to assess co-localization with stem cell, early progeny, and late progeny cell populations. Percent co-localization is shown at the top of each panel and is averaged from 3 to 4 animals. Magenta, percent co-expression in [row gene]+ cells; green, percent co-expression in [column gene]+ cells. Images from the head, trunk, and tail regions were used for all cell counts, with a minimum of 300 cells counted. Dispersions of data are in Supplementary file 3. Representative confocal projections spanning 4–6 μm of the head region are shown. Eyespots are marked by asterisks. Anterior, left; scale bar, 100 μm.
Figure 2—figure supplement 1
Gene expression analysis of candidate progeny genes.
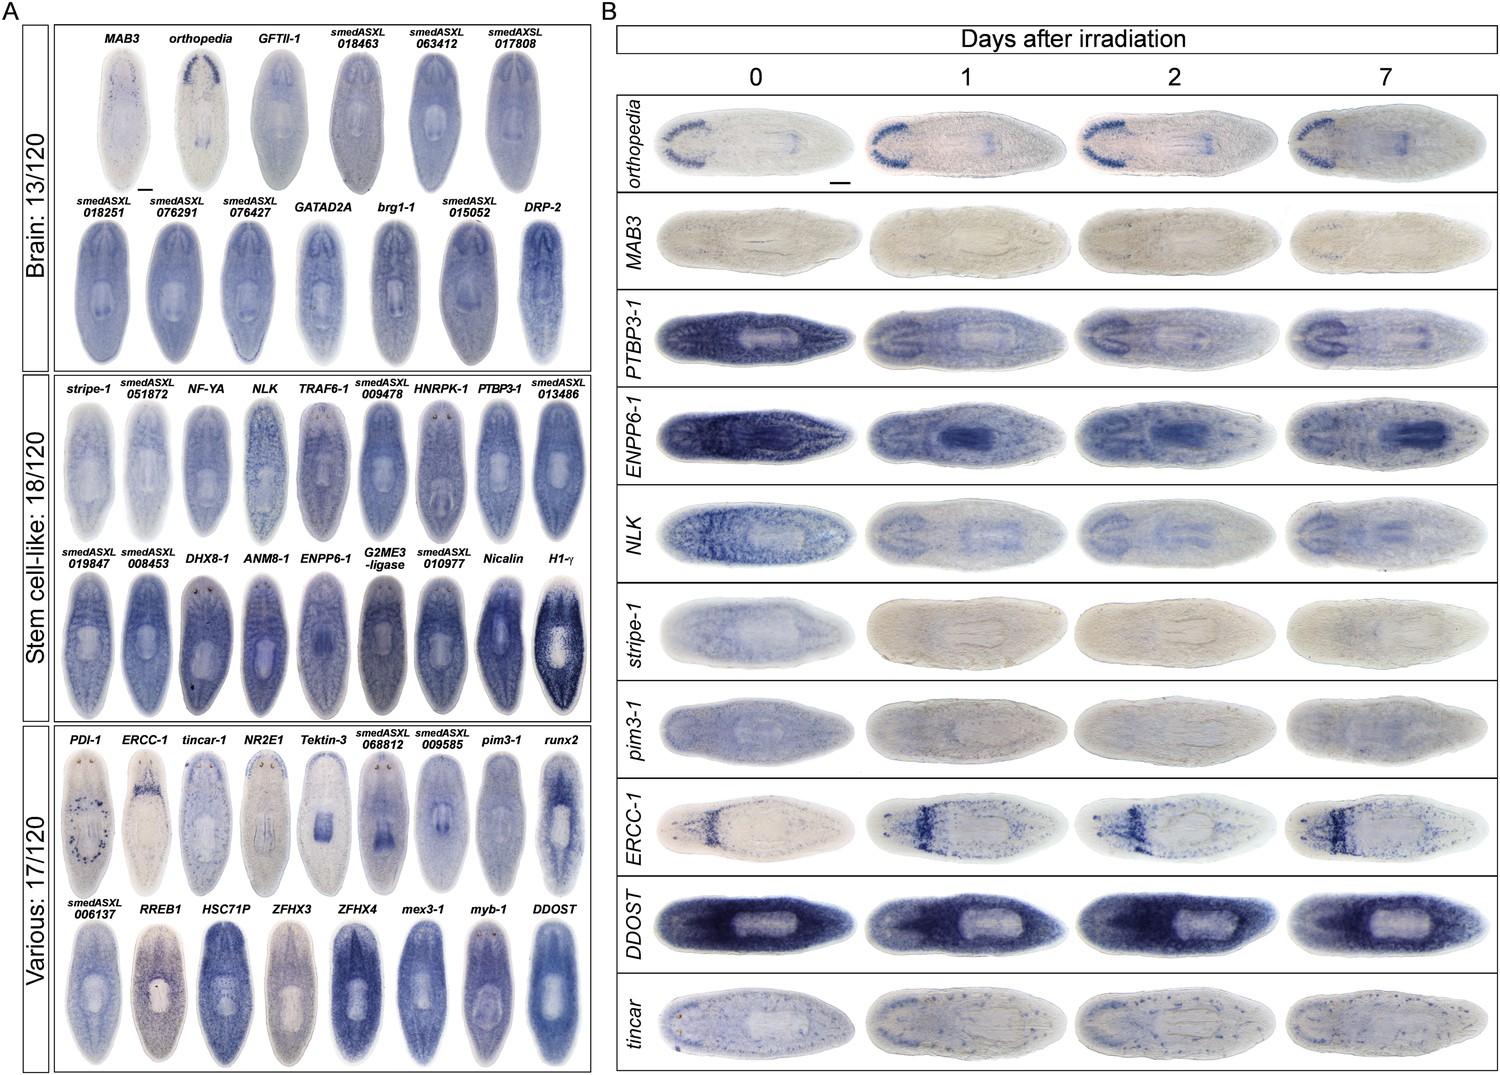
(A) WISH was used to determine the gene expression patterns of X2-enriched and WThighXlow genes in intact control worms. Genes for which a reliable and discrete pattern could be obtained are shown. Genes were named based on the best BLASTx result in mouse (when Expect value < 1 × e−5) or based on transcript identity if no homology is found. Genes were categorized as either predominant in the brain (Brain), predominant in a stem cell pattern with or without expression elsewhere (Stem cell-like), or possessing unique patterns (Various). (B) A subset of candidate progeny genes was assessed by whole-mount ISH after irradiation with 60 Gys, up to 7 days after exposure. Scale bars, 200 μm.
Figure 2—figure supplement 2
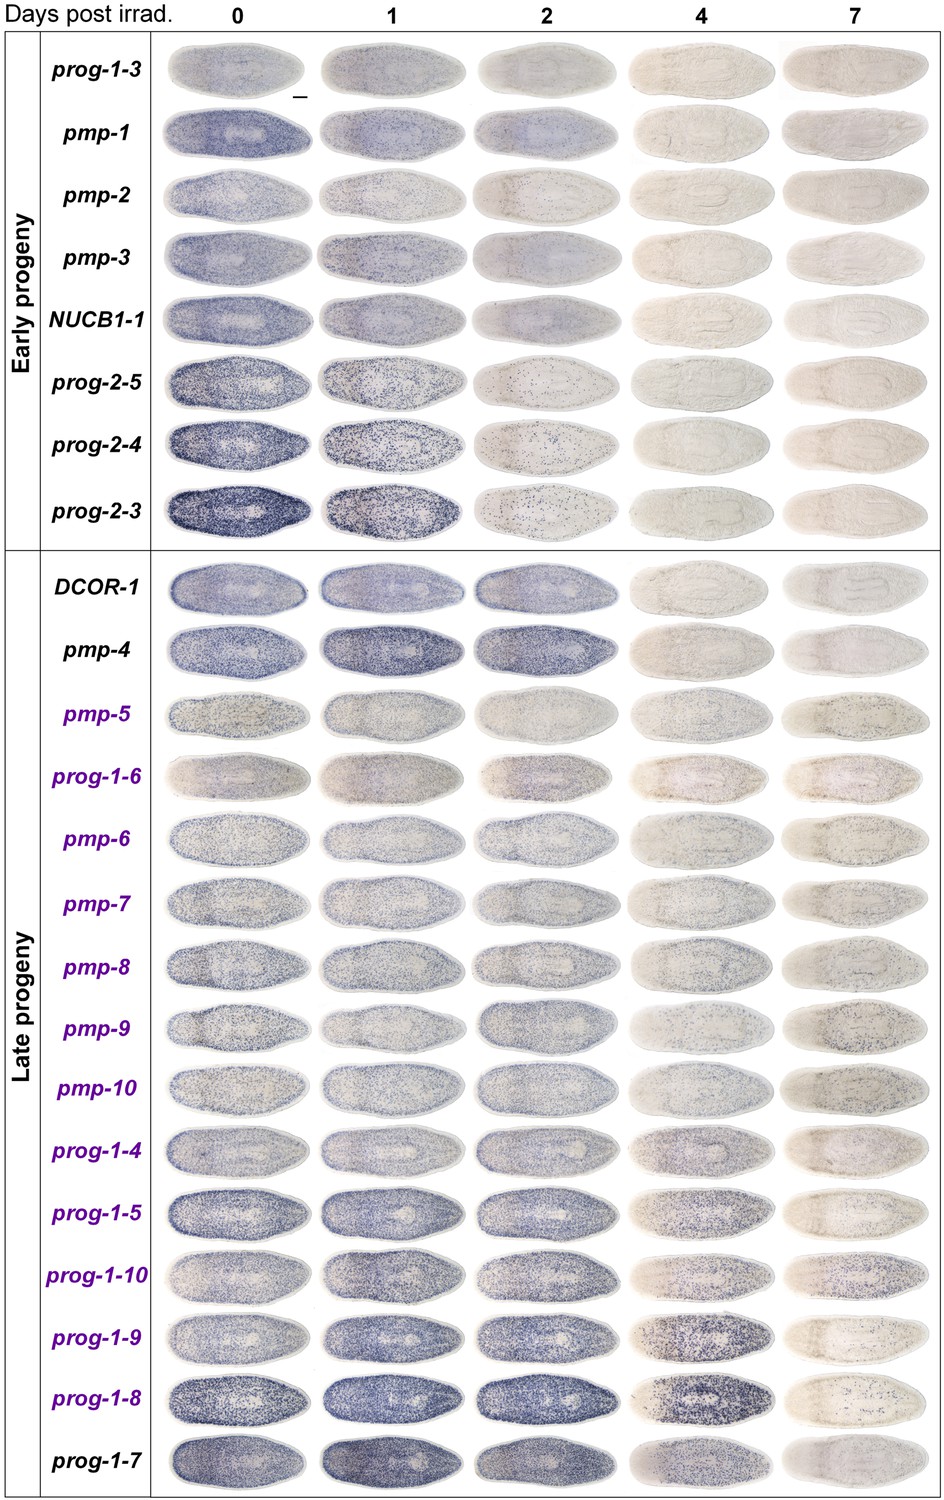
Gene expression analysis of candidate progeny genes with a prog-like expression pattern.
Candidate progeny genes, which exhibited a prog-like expression pattern, were all assessed by WISH in irradiated worms (60 Gy) at the indicated time points. Genes were categorized as either early progeny or late progeny depending on whether they exhibited similar kinetics of down-regulation to prog-1/2 or AGAT-1/2/3, respectively. Genes, which are WThighXlow, are indicated in purple text. Scale bar, 200 μm.
Figure 2—figure supplement 3
Co-localization of progeny markers with dFISH.
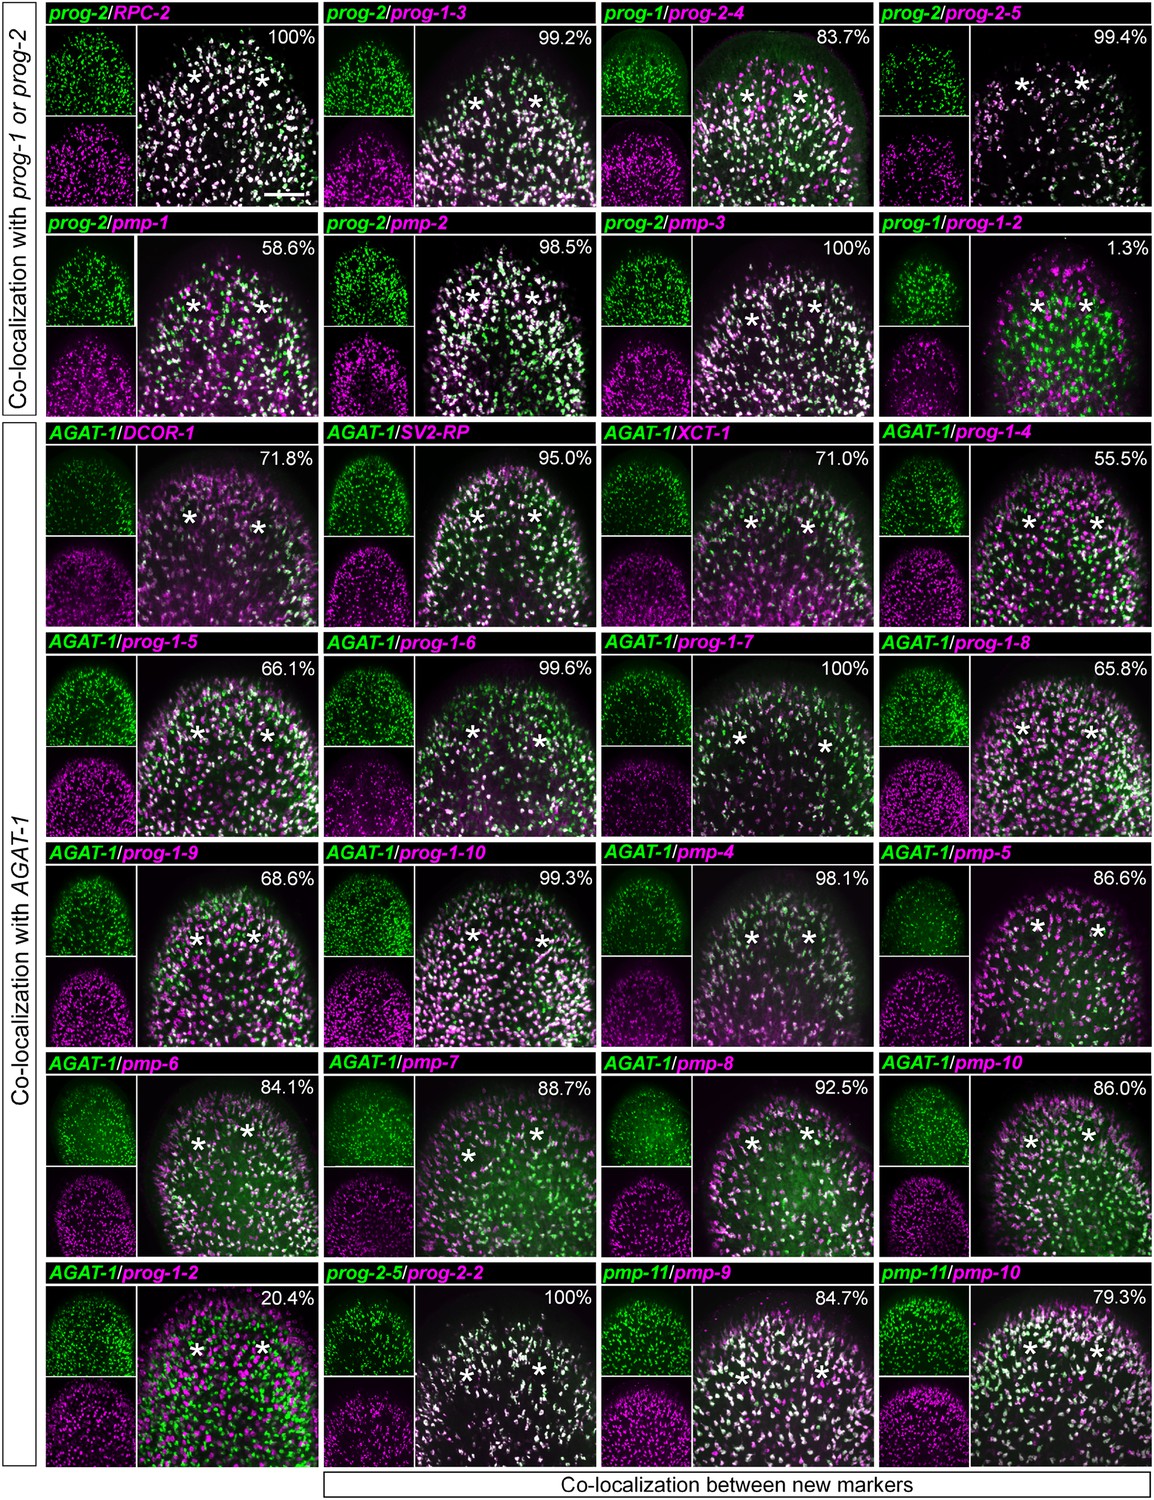
Co-expression of X2-enriched and WThighXlow early and late progeny markers with established lineage markers (prog-1, prog-2, and AGAT-1) or with each other was determined using dFISH. Confocal projections spanning 6–10 μm are shown. Smaller panels on the left show individual channels with expression of one gene; larger panels on the right show merged channels. Numbers indicate the percent of magenta-labeled cells, which co-express the green-labeled transcript. 200–2000 cells were counted for each dFISH combination. Location of eyespots is marked by asterisks; anterior, up.
Figure 2—figure supplement 4
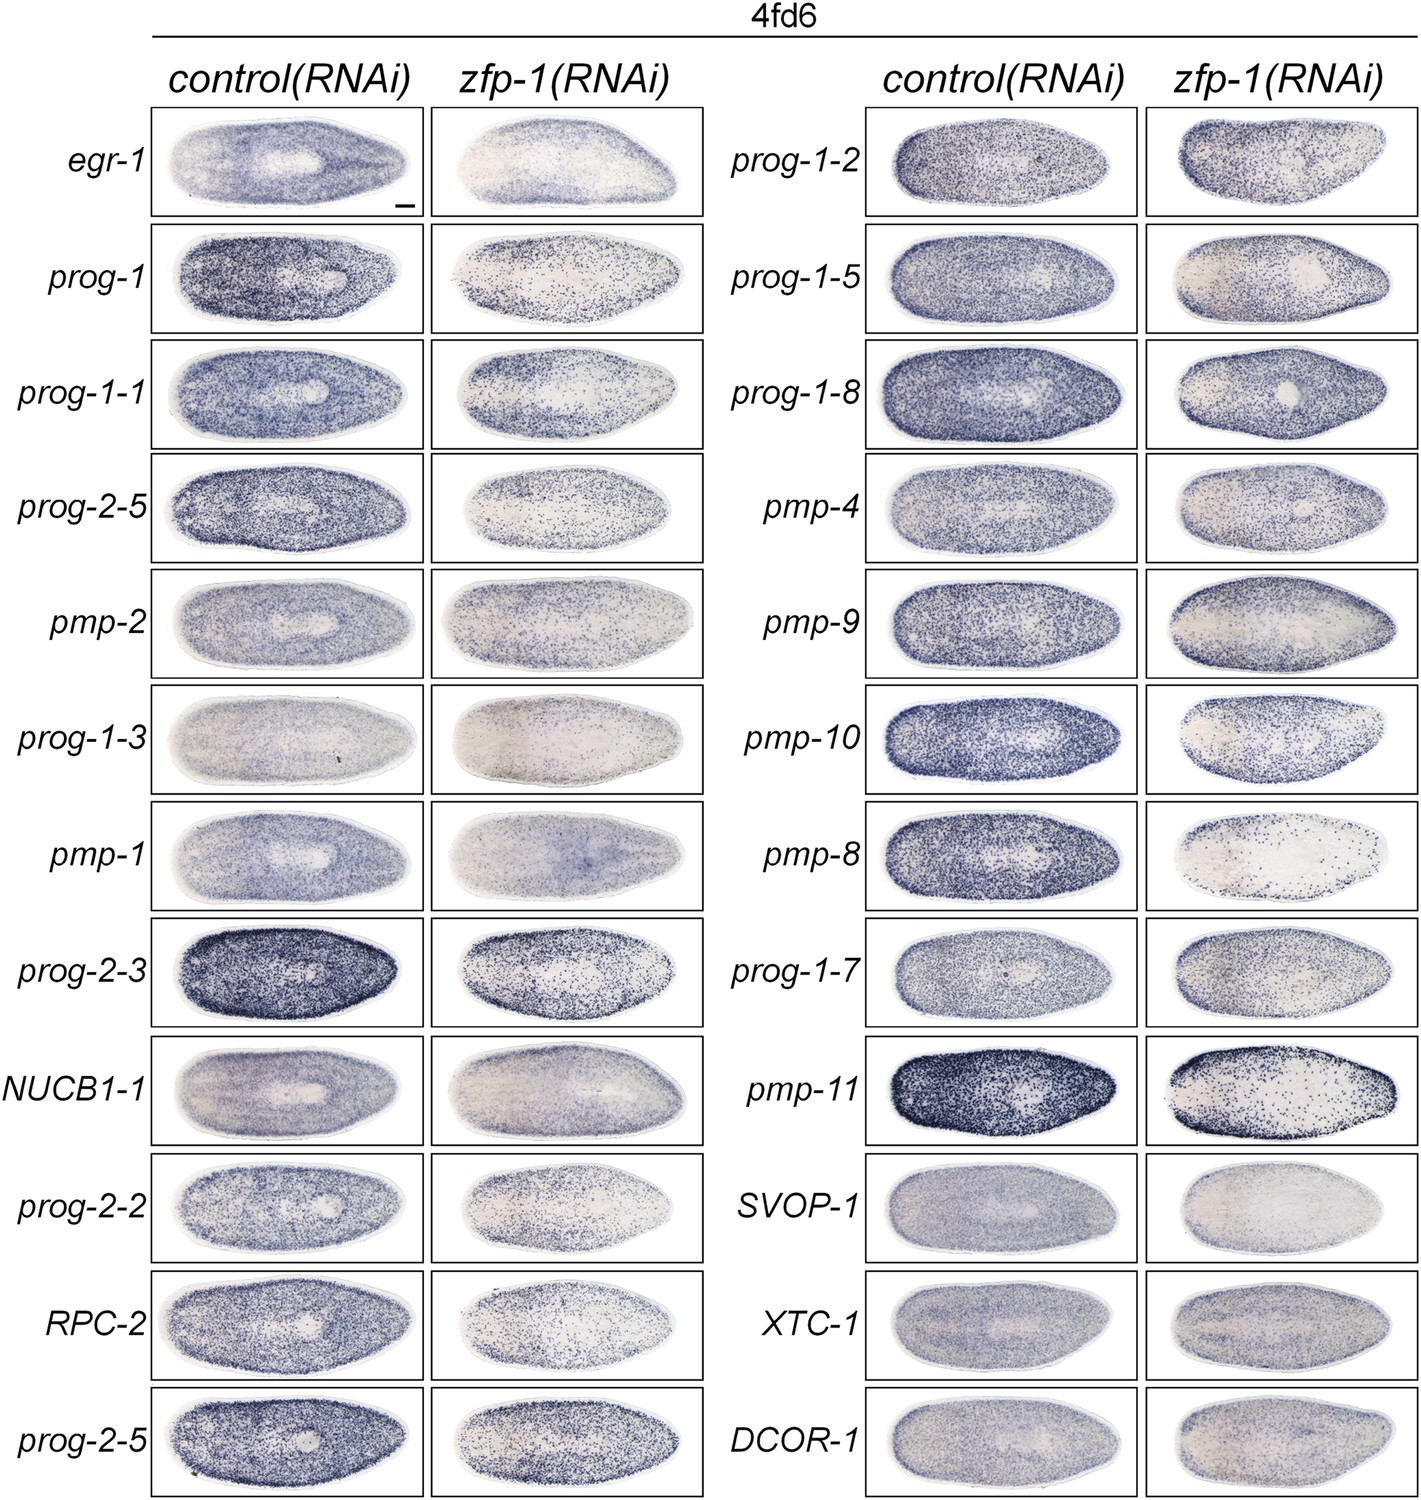
Analysis of new progeny markers in zfp-1(RNAi) animals.
X2-enriched and WThighXlow early and late progeny transcripts identified as potential markers of epithelial progenitors were assessed by WISH in zfp-1(RNAi) animals. Knockdown of zfp-1 has previously been shown to selectively ablate zeta-neoblasts and output of epithelial progenitors, and down-regulate prog-1 and prog-2.
Figure 3 with 1 supplement
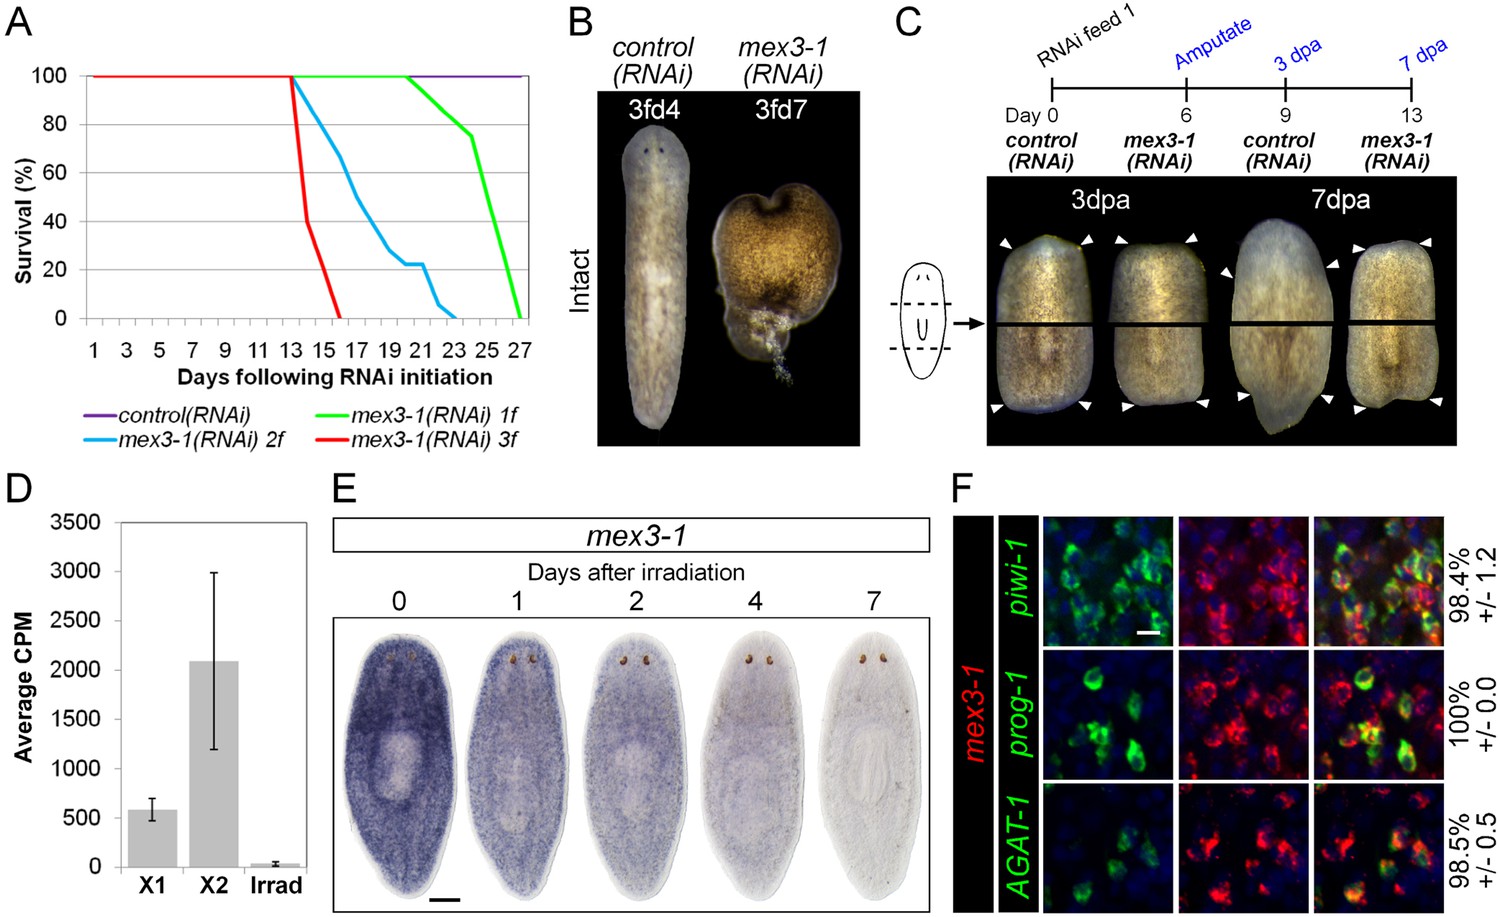
mex3-1 is required for tissue homeostasis and regeneration.
(A) Survival curves of mex3-1(RNAi) animals to determine the optimal RNAi dosage. One RNAi feed was sufficient to produce completely penetrant lethality by 27 days. (B) RNAi worms were observed for homeostatic abnormalities after 1–3 feeds. Time point at which animals were imaged is indicated as x days after z feeds (zfdx). (C) Regenerative ability after injury was tested according to the experimental timeline shown. Trunk fragments after pre- and post-pharyngeal amputations are shown. (D) Expression levels of mex3-1 in different FACS populations by RNAseq. Error bars show standard deviation. (E) WISH analysis of mex3-1 in intact worms after 60 Gray (Gy) irradiation. Scale bar, 200 μm. (F) dFISH was performed to examine mex3-1 expression in stem cells and postmitotic progeny. Numbers indicate the percentage of stem cells, early progeny, or late progeny co-expressing mex3-1 (n > 400 cells per dFISH, ± standard error). Scale bar, 10 μm.
Figure 3—figure supplement 1
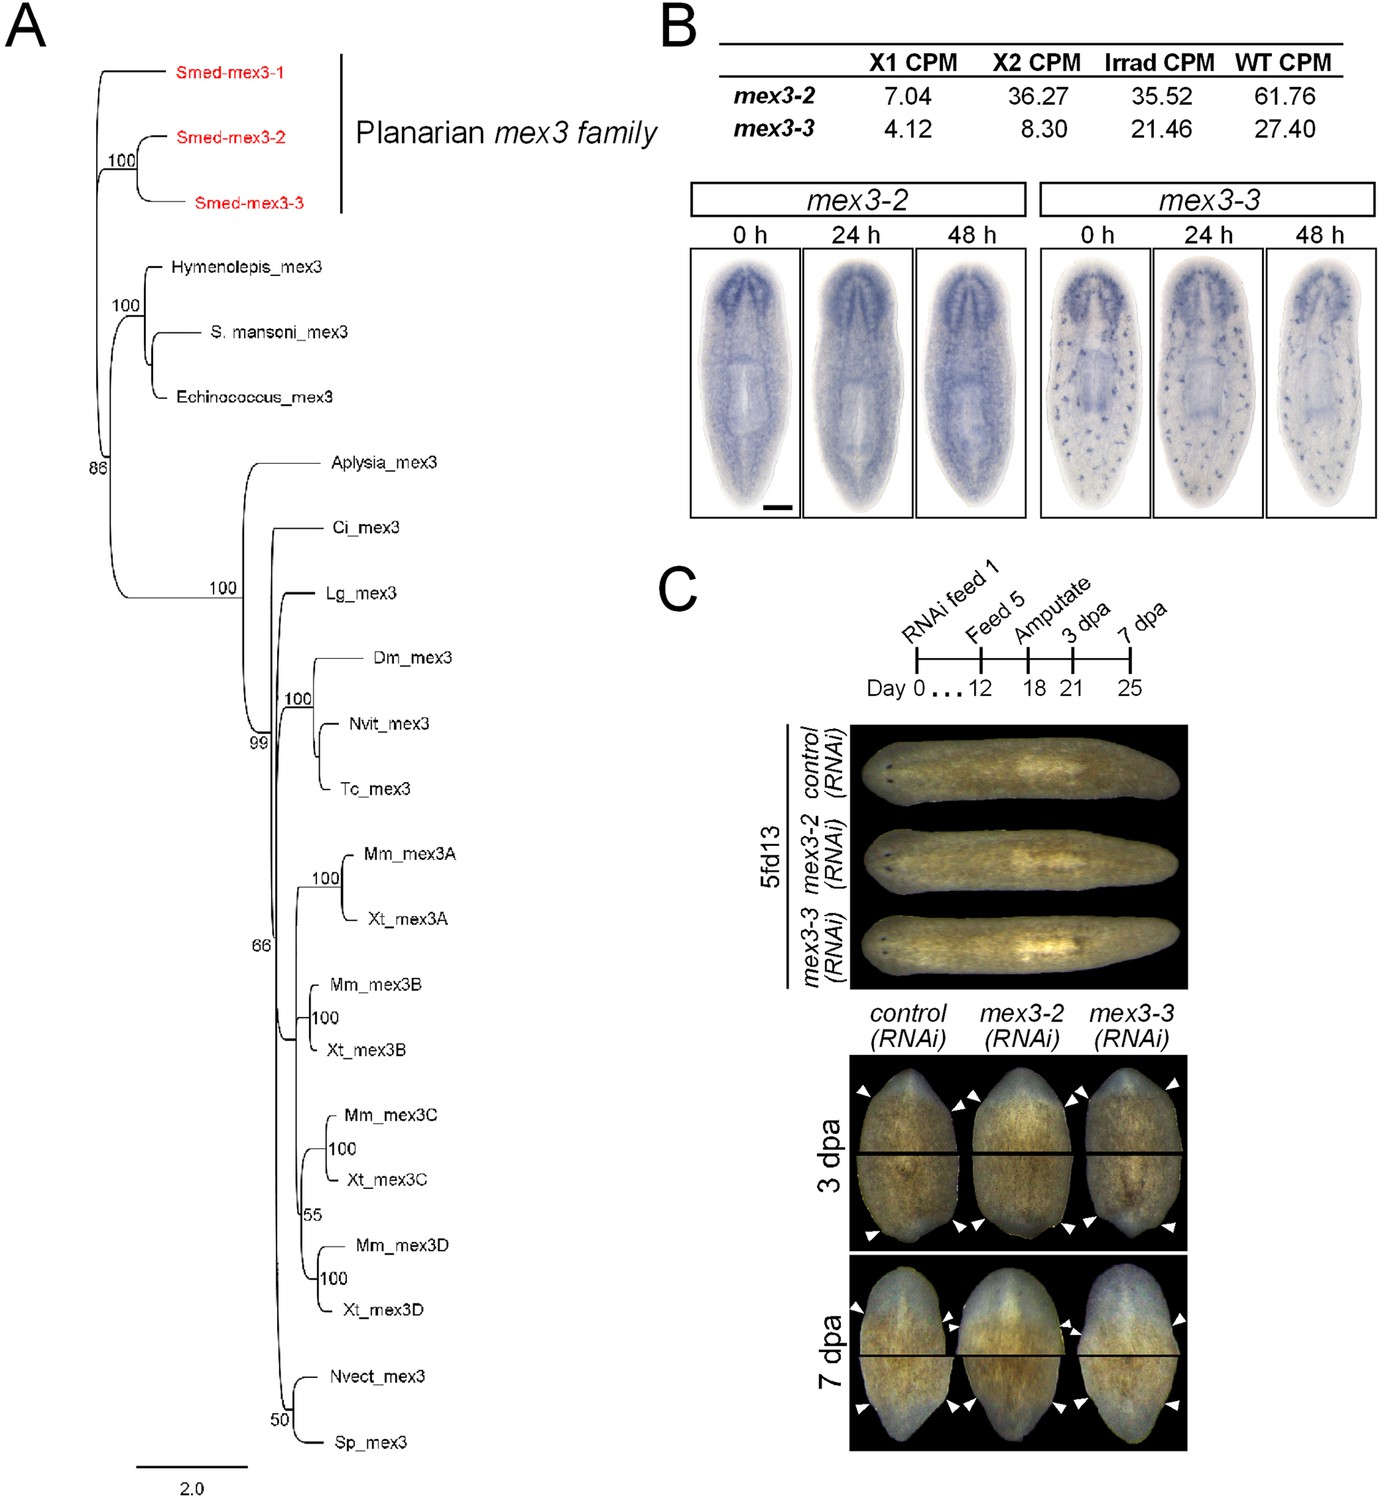
Identification and analysis of MEX3 homologs in S. mediterranea.
(A) Phylogenetic analysis of the mex3 gene family in planarians shows that they are likely the results of planarian-specific duplications. A Bayesian phylogeny was run as outlined in the ‘Materials and methods’. Only posterior probabilities 50% and above are shown. S. mediterranea sequences are in red. Multiple mex3 homologs could not be found in individual species of other flatworms. (B) Expression levels of mex3-2 and mex3-3 in RNAseq of FACS-isolated populations and control intact worms. Expression of mex3 homologs by WISH after lethal irradiation (60 Gy) is shown below. (C) Phenotypes of mex3-2 and mex3-3 RNAi animals during homeostasis (upper panel) and during regeneration after amputation (lower panel). Species sequences used in the phylogeny: Smed = Schmidtea mediterranea; S. mansoni = Schistosoma mansoni; Echinococcus = Echinococcus multilocularis; Aplysia = Aplysia californica; Ci = Ciona intestinalis; Lg = Lottia gigantea; Dm = Drosophila melanogaster; Tc = Tribolium castaneum; Nvit = Nasonia vitripennis; Mm = Mus musculus; Xt = Xenopus tropicalis; Nvect = Nematostella vectensis; Sp = Strongylocentrotus purpuratus.
Figure 4 with 1 supplement
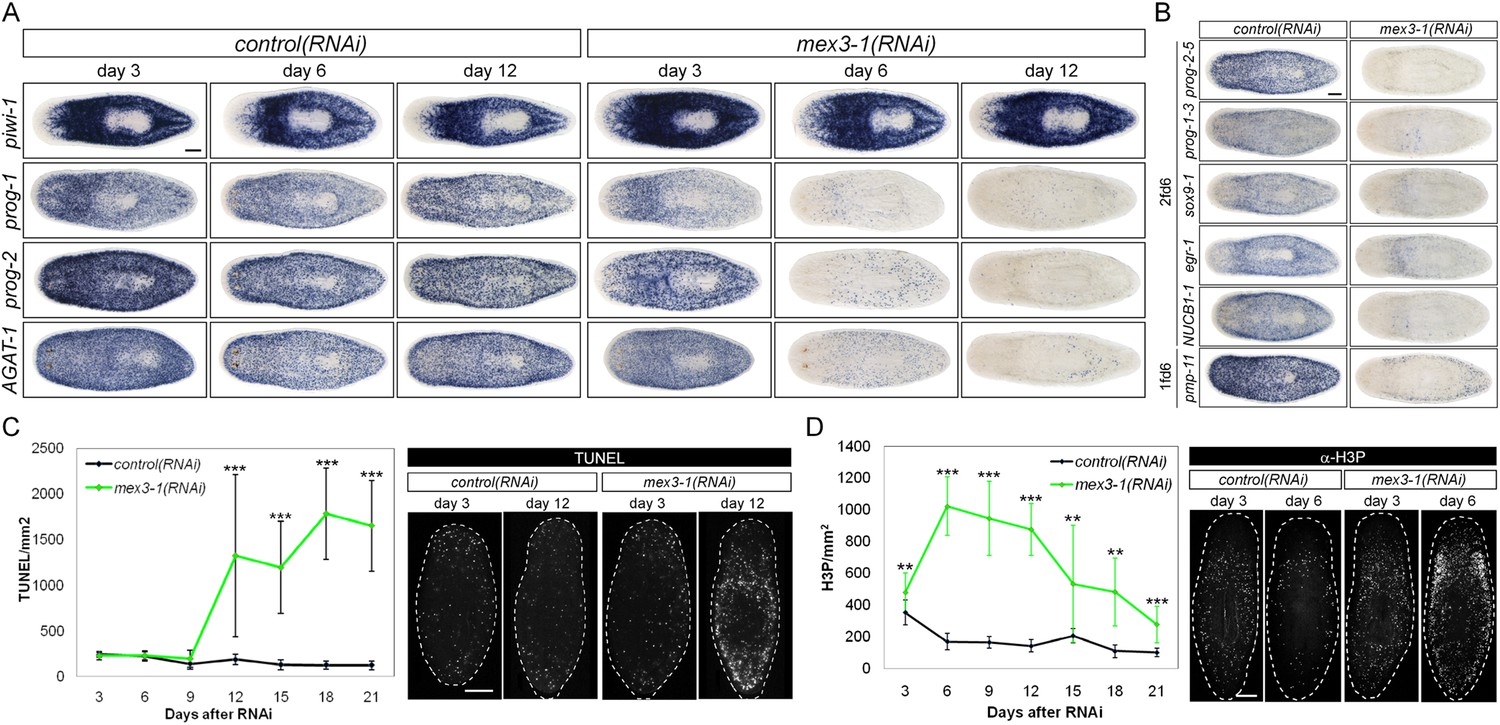
RNAi against mex3-1 selectively affects progeny markers and causes hyper-proliferation.
(A) Lineage markers labeling stem cells (piwi-1), early (prog-1, prog-2), and late (AGAT-1) progeny were assessed by WISH after RNAi. The day 12 time point reflects the maximal perturbation to progeny markers prior to obvious health decline in the animal. (B) Representative newly identified early and late progeny transcripts were assessed by WISH after RNAi. (C) Whole-animal quantification of TUNEL was performed to measure cell death in RNAi animals. Representative stains and time points are shown to the right. (D) Whole-animal quantification of H3P immunolabeling was performed to assess cell proliferation after RNAi. Representative stains and time points are shown to the right. Unless otherwise noted, all experimental time points are indicated as after a single RNAi feeding. Scale bars, 200 μm. Error bars are standard deviations. **p < 0.01, ***p < 0.001 (Student's t-test).
Figure 4—figure supplement 1
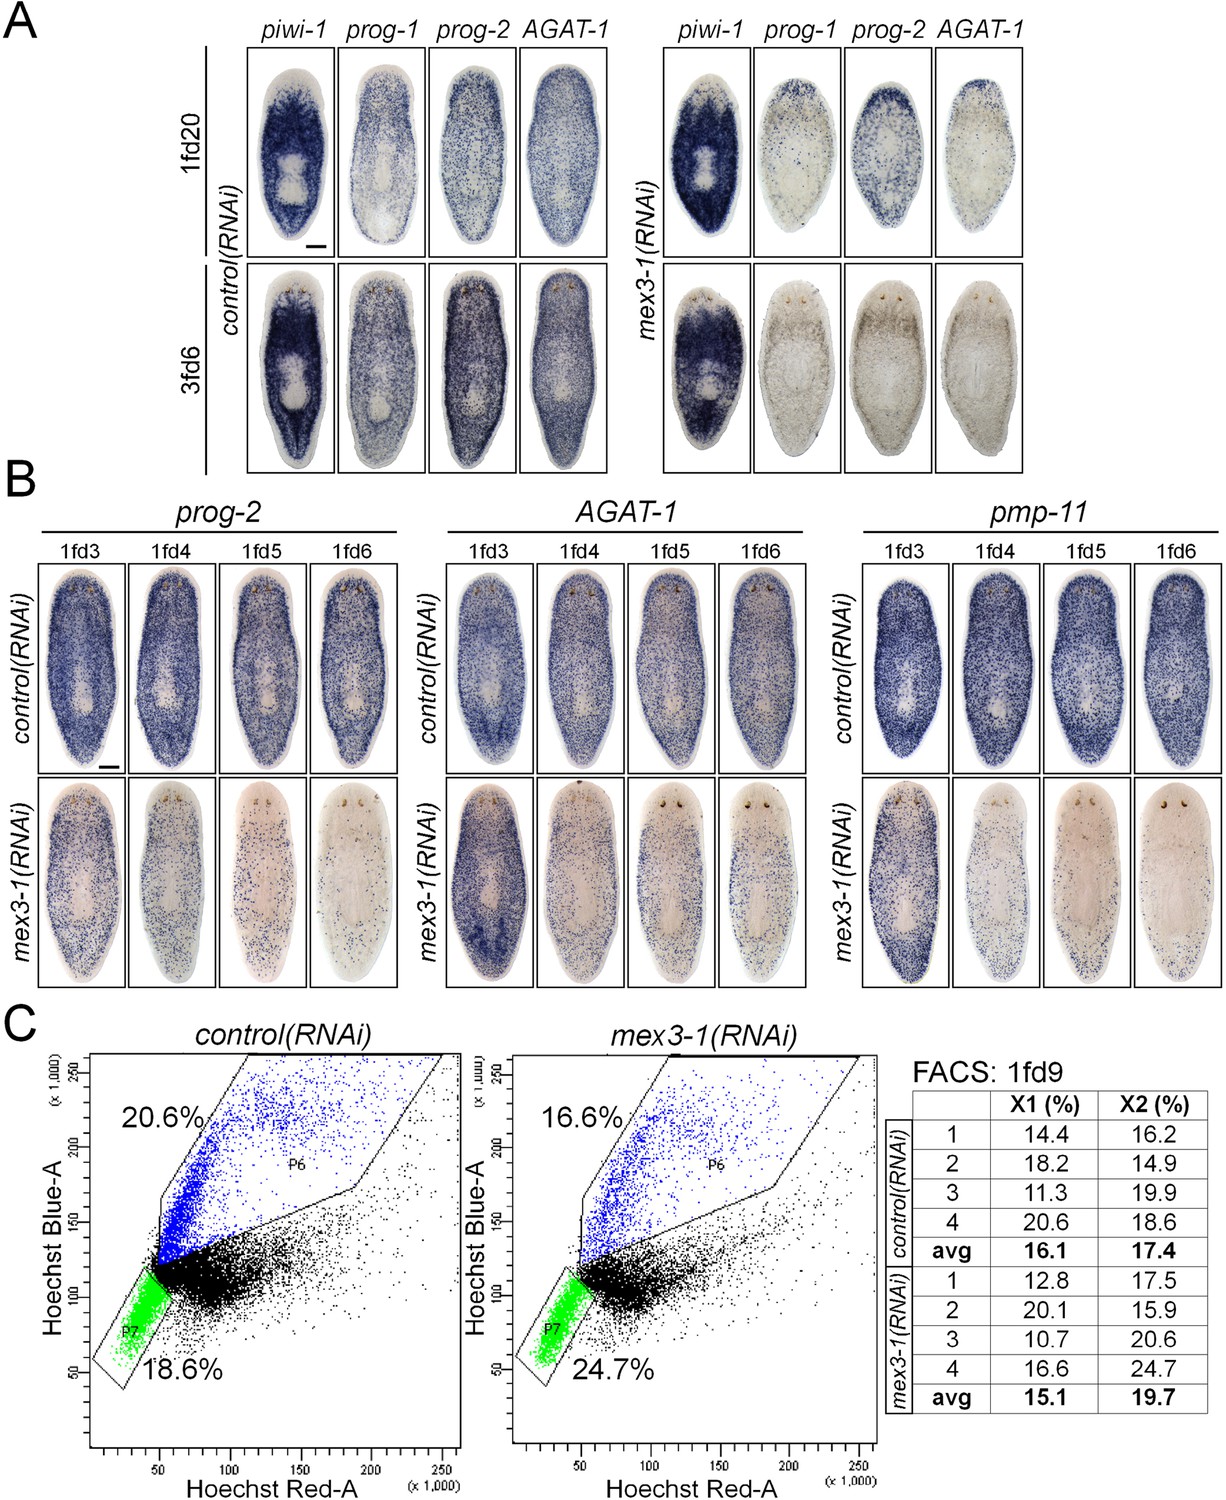
mex3-1 RNAi depletes progeny without impairing stem cell proliferation.
(A) Lineage markers labeling stem cells (piwi-1), early (prog-1, prog-2), and late (AGAT-1) progeny were assessed by WISH after RNAi. Shown are a late time point after one RNAi feeding and a late time point with multiple RNAi feeds, when health decline is evident. (B) Detailed time course analysis of early (prog-2) and late (AGAT-1, pmp-11) progeny marker down-regulation after mex3-1 RNAi. Scale bars, 200 μm. (C) FACS analysis with Hoechst staining of mex3-1(RNAi) animals 9 days after RNAi. FACS plots from one run are shown on the left; right table indicates proportion of X1 and X2 populations of all runs.
Figure 5 with 1 supplement

mex3-1(RNAi) animals exhibit expansion of the stem cell compartment.
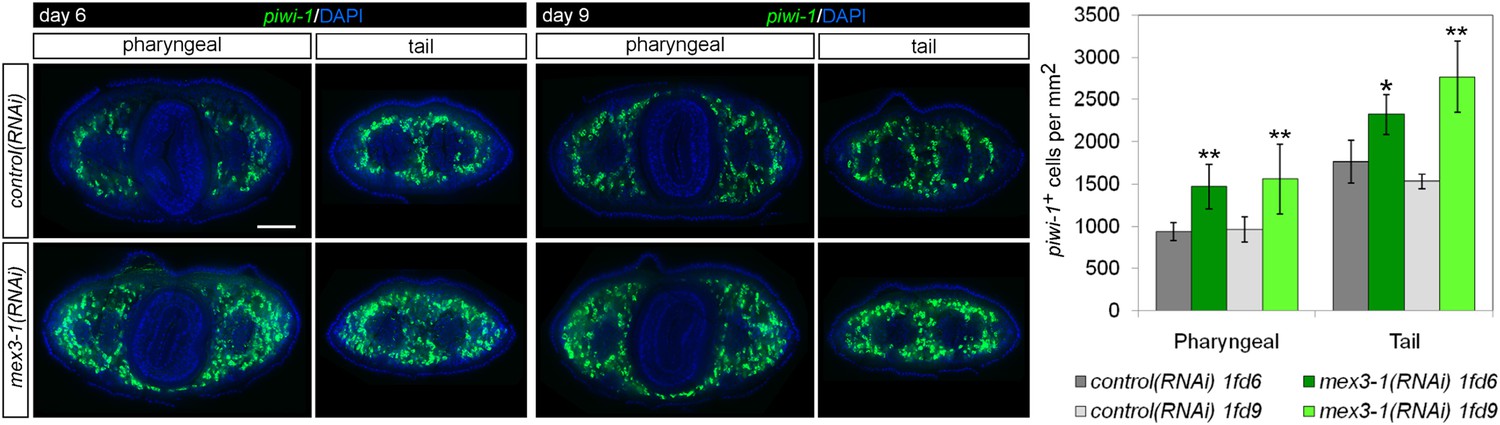
(A) RNAi worms were administered EdU at 6 or 9 days after RNAi and quantified after a 24-hr period. Counts were performed on whole-animal single confocal planes. (B) mex3-1(RNAi) animals were irradiated with a sublethal dose (16.5 Gy), and stem cells (piwi-1) and progeny (prog-1) were quantified by dFISH at 7 and 9 days after irradiation. The proportion of progeny to stem cells between mex3-1(RNAi) and control worms differed significantly (p < 0.001, analysis of covariance). Whole-animal confocal projections are shown. Each point on the graph represents one animal. (C) Stem cells were quantified in pre-pharyngeal cross sections of intact worms after RNAi by piwi-1 fluorescent WISH (FISH) during phenotypic progression. Single confocal planes at day 9 after RNAi are shown; dorsal, top. (D) Quantification of stem cell subclasses in intact worms 12 days after RNAi. Stem cell subclass was determined by piwi-1 labeling and expression of soxP-1 pooled with soxP-2 (sigma subclass), hnf4 (gamma), or zfp-1 (zeta). Diagrams indicate areas of worms quantified, and arrows indicate example double-positive cells. Scale bars, 200 μm in (A–C) and 50 μm in (D). Error bars represent standard deviation. *p < 0.05, **p < 0.01, ***p < 0.001 (Student's t-test).
Figure 5—figure supplement 1
Quantification of stem cells in mex3-1(RNAi) animals.
Stem cells were quantified in mid-pharyngeal and tail cross sections of intact worms at 6 and 9 days after RNAi by piwi-1 FISH. Single confocal planes are shown; dorsal, top. Scale bar, 200 μm. *p < 0.05; **p < 0.01 (Student's t-test). 10 animals were counted per RNAi treatment.
Figure 6 with 2 supplements
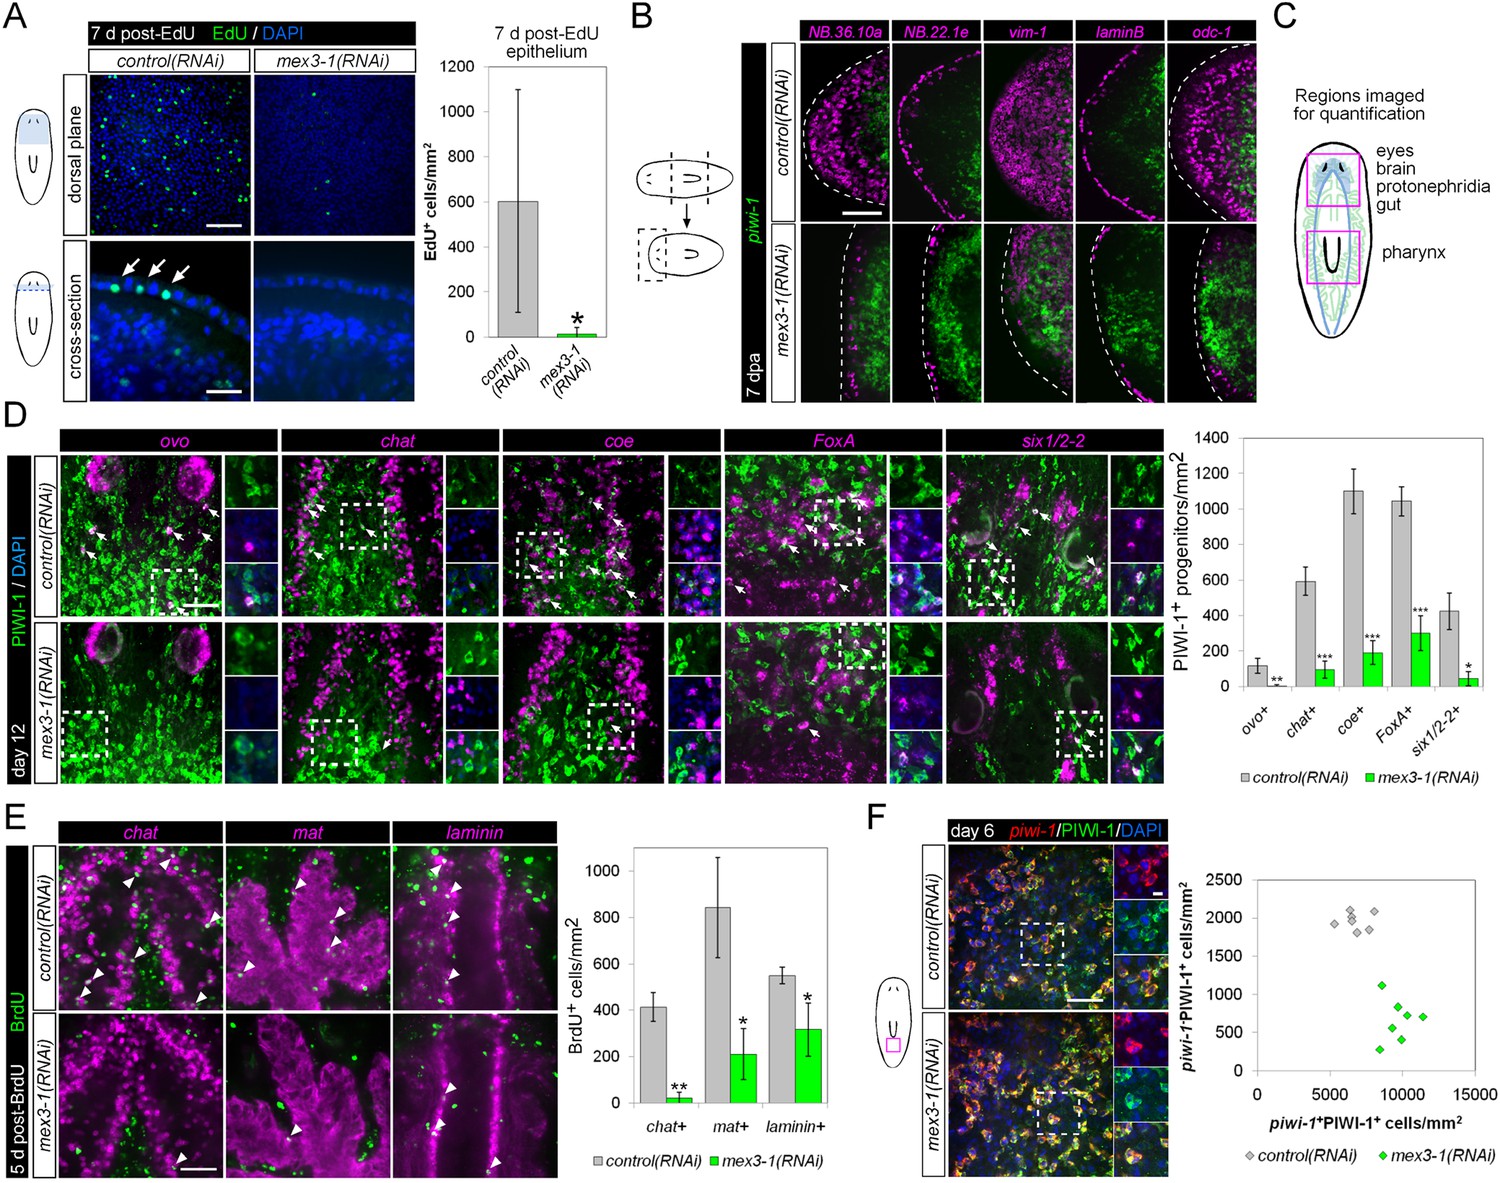
mex3-1 is required for epithelial turnover and regeneration as well as differentiation toward multiple tissues.
(A) RNAi animals were administered EdU 6 days after RNAi, and EdU+ labeling in the epithelium was quantified after a 7-day period. Single confocal planes are shown, with EdU+ cells in the epithelium indicated by arrows. Top panel scale bar, 100 μm; bottom panel scale bar, 50 μm. (B) RNAi animals amputated 7 days after RNAi were analyzed after 7 days regeneration by dFISH for stem cells and epithelial-associated genes. Single confocal planes or projections of head blastemas are shown, with anterior to the left. Dotted lines indicate animal boundary. Scale bar, 100 μm. (C) Diagram indicating regions of animal imaged and examined for quantification of lineage-restricted neoblast progeny. (D) Lineage-restricted progeny populations were quantified in intact worms 12 days after RNAi, using PIWI-1 immunolabeling and FISH for ovo (eyes), chat or coe (brain), FoxA (pharynx), and six1/2-2 (protonephridia). Single confocal planes are shown. Arrows indicate example double-positive cells. Magnified areas are indicated by dashed boxes and inset to the right of each image. Scale bar, 50 μm. (E) RNAi animals were administered BrdU 6 days after RNAi, and BrdU+ labeling in differentiated tissues (chat, brain; mat, gut; laminin, pharynx) was examined after a 5-day period. Single confocal planes are shown. Arrowheads indicate example double-positive cells. Scale bar, 50 μm. Error bars represent standard deviation. *p < 0.05, **p < 0.01, ***p < 0.001 (Student's t-test). (F) Quantification of stem cells (piwi-1+PIWI-1+) and immediate postmitotic stem cell descendants (piwi-1−PIWI-1+) were performed 6 days after RNAi, in head, pre-pharyngeal, and tail regions. Shown are single confocal planes from the tail region. Magnified areas are indicated by dashed boxes. The proportion of postmitotic descendants to stem cells between mex3-1(RNAi) and control worms differed significantly (p < 0.001, non-linear regression analysis). Scale bar, 50 μm on left panels, 10 μm on right panels. All counts were performed in 5–10 animals.
Figure 6—figure supplement 1
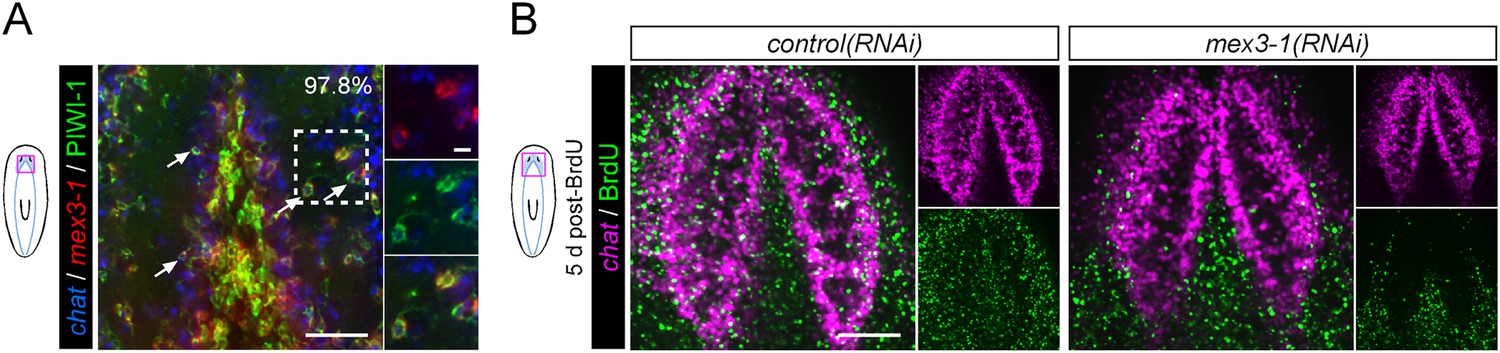
mex3-1 RNAi impairs brain differentiation.
(A) Expression of mex3-1 in neural-restricted neoblast progeny by mex3-1 and chat dFISH with PIWI-1 immunolabeling. Percentage of chat+PIWI-1+ cells which express mex3-1 is indicated at top-right of panel. Arrows indicate example triple-labeled cells. Dashed box indicates area of magnified panels. Left scale bar, 50 μm; right scale bar, 10 μm. (B) Animals were administered BrdU at 6 days after RNAi and assessed at 5 days post-BrdU. Scale bar, 100 μm. All images shown are single confocal planes.
Figure 6—figure supplement 2
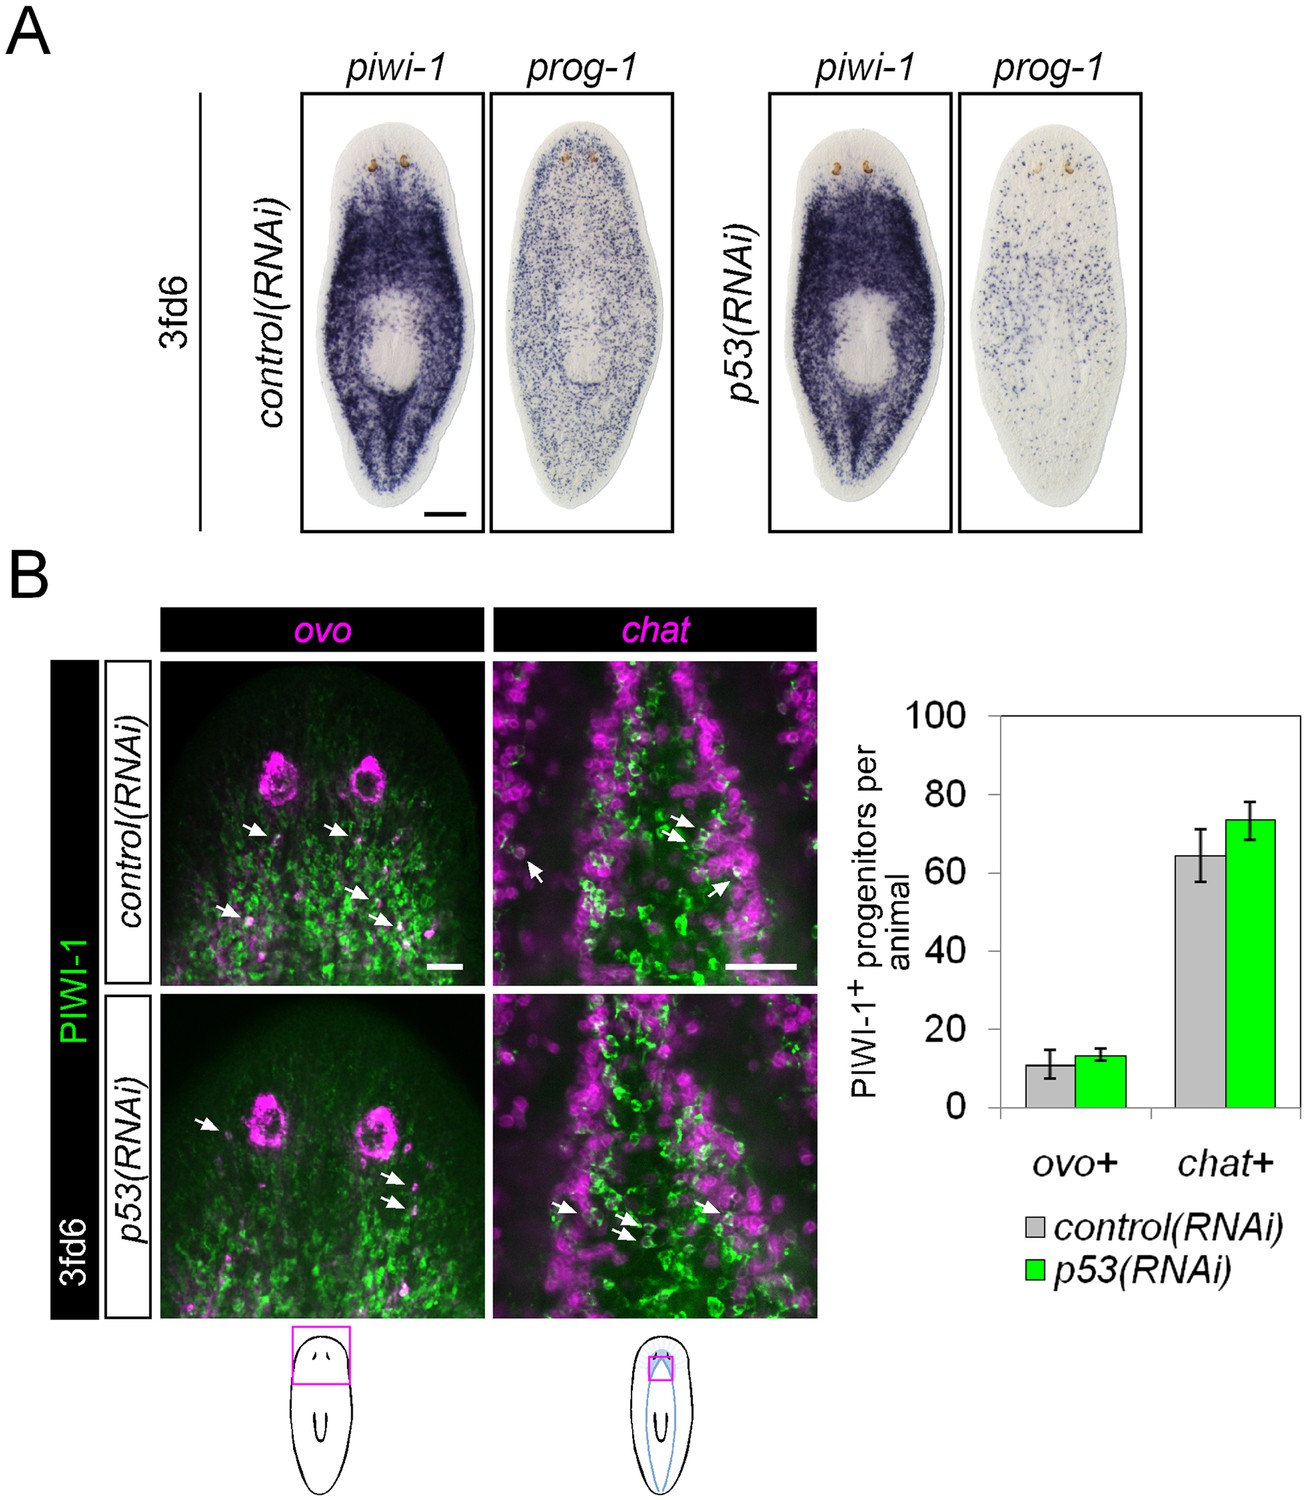
Differentiation in p53(RNAi) animals.
(A) Stem cell (piwi-1) and epithelial progenitor (prog-1) populations were examined by WISH in RNAi animals. Scale bar, 200 μm. (B) Eye and neural lineage-restricted neoblast progeny were quantified in RNAi animals by FISH (ovo, eye; chat, brain) with PIWI-1 immunolabeling. Arrows indicate example double-positive cells. Scale bars, 50 μm.
Figure 7 with 2 supplements
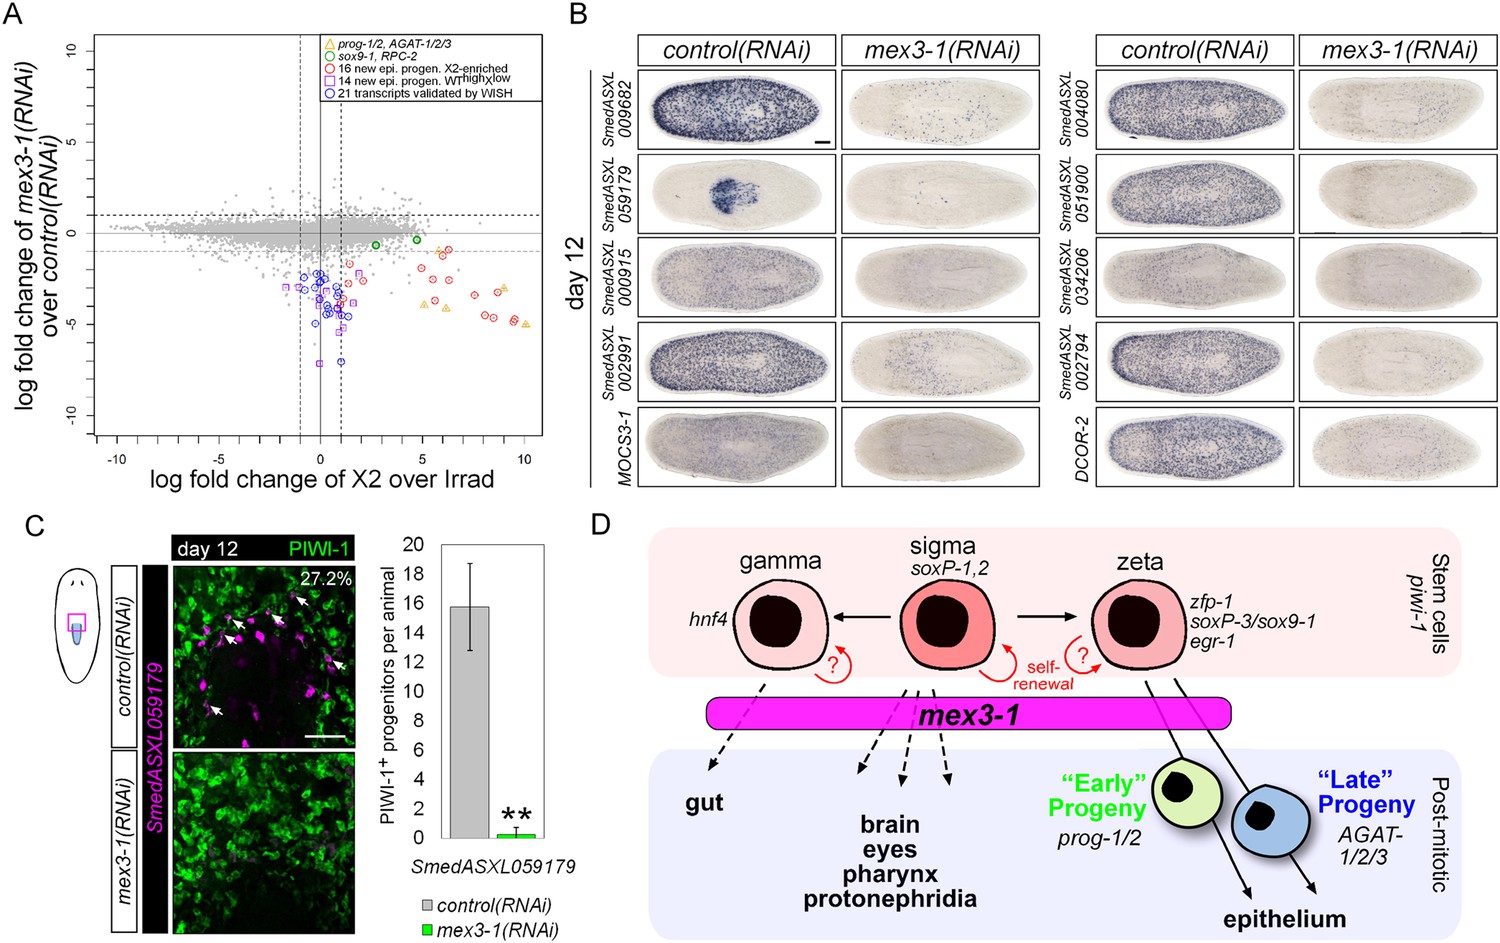
Transcriptional analysis after mex3-1 RNAi identifies novel progenitor transcripts.
(A) RNAseq was performed on mex3-1(RNAi) animals 12 days after RNAi. Each gray dot represents one transcript. Established and newly identified progeny markers are indicated. Top mex3-1 down-regulated transcripts cloned out for validation by WISH are indicated as well. (B) The blue-circled transcripts from (A) all require mex3-1 for expression. Scale bar, 200 μm. (C) Assessment of the mex3-1(RNAi)-down-regulated transcript Smed_ASXL059179 as a marker for a novel pharynx progenitor cell type using FISH and PIWI-1 immunolabeling. Confocal projections in control and mex3-1 RNAi animals are shown. Error bars represent standard deviation. Scale bar, 50 μm. **p < 0.01 (Student's t-test). (D) Model of lineage specification in planarian stem cells. mex3-1 is a key determinant in balancing stem cell self-renewal and differentiation, acting as a promoter of postmitotic cell fates and commitment toward multiple lineages.
Figure 7—figure supplement 1
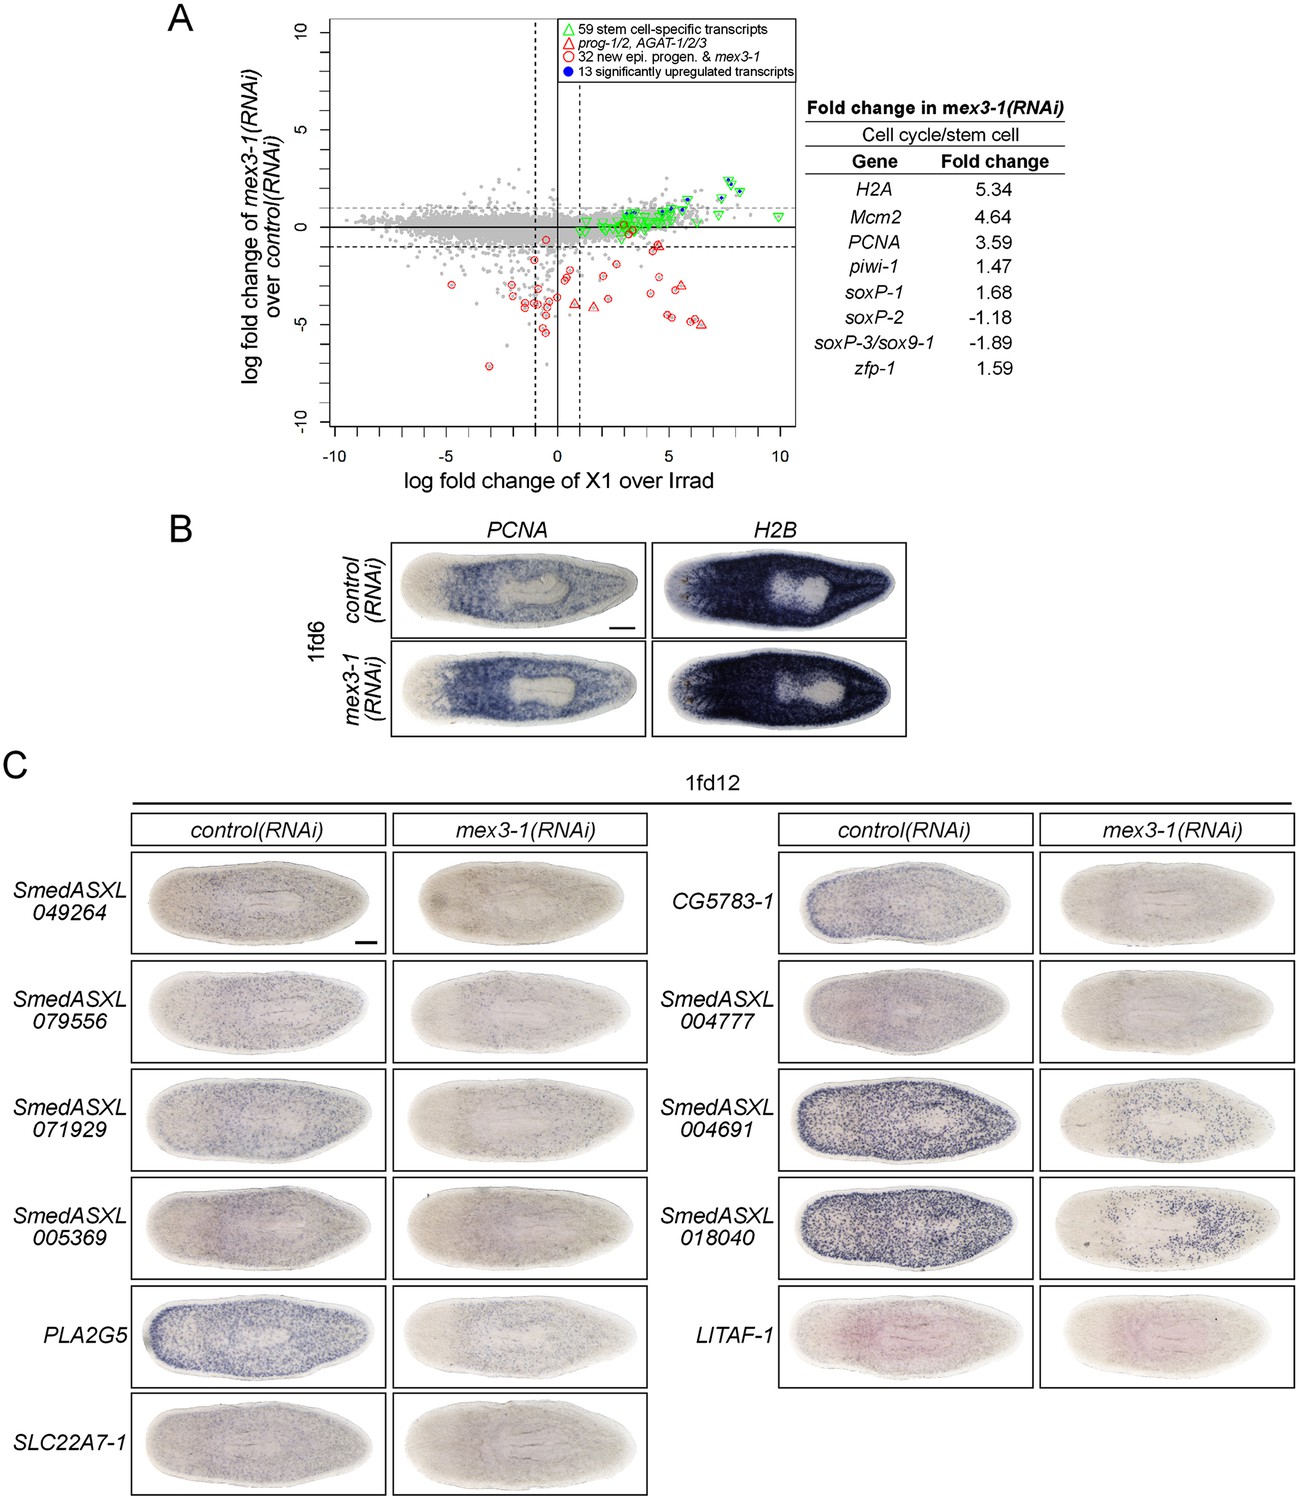
RNAseq analysis of mex3-1(RNAi) animals.
(A) RNAseq was performed on mex3-1(RNAi) animals 12 days after RNAi, and X1 enrichment is compared to fold change after mex3-1 knockdown. Each gray dot represents one transcript. Established stem cell genes (from Figure 1B), which were found to be significantly upregulated in mex3-1(RNAi), are highlighted in blue (p < 0.01). The fold changes of a subset of known stem cell genes (involved in proliferation, pan-stem cell gene, or subclass identity) are shown on the right. (B) Upregulation of the cell cycle genes PCNA and H2B in RNAseq analysis was confirmed by WISH of mex3-1(RNAi) worms 6 days after RNAi. (C) From the top down-regulated genes after mex3-1 knockdown, 21 uncharacterized genes were chosen for cloning and expression analysis by WISH (11/21 genes are shown). mex3-1(RNAi) animals were stained 12 days after RNAi to confirm that target genes were down-regulated. Genes were named based on the best BLASTx result to mouse when the Expect value <1 × e−5, or based on transcript number if no homology was found. Scale bars, 200 μm.
Figure 7—figure supplement 2
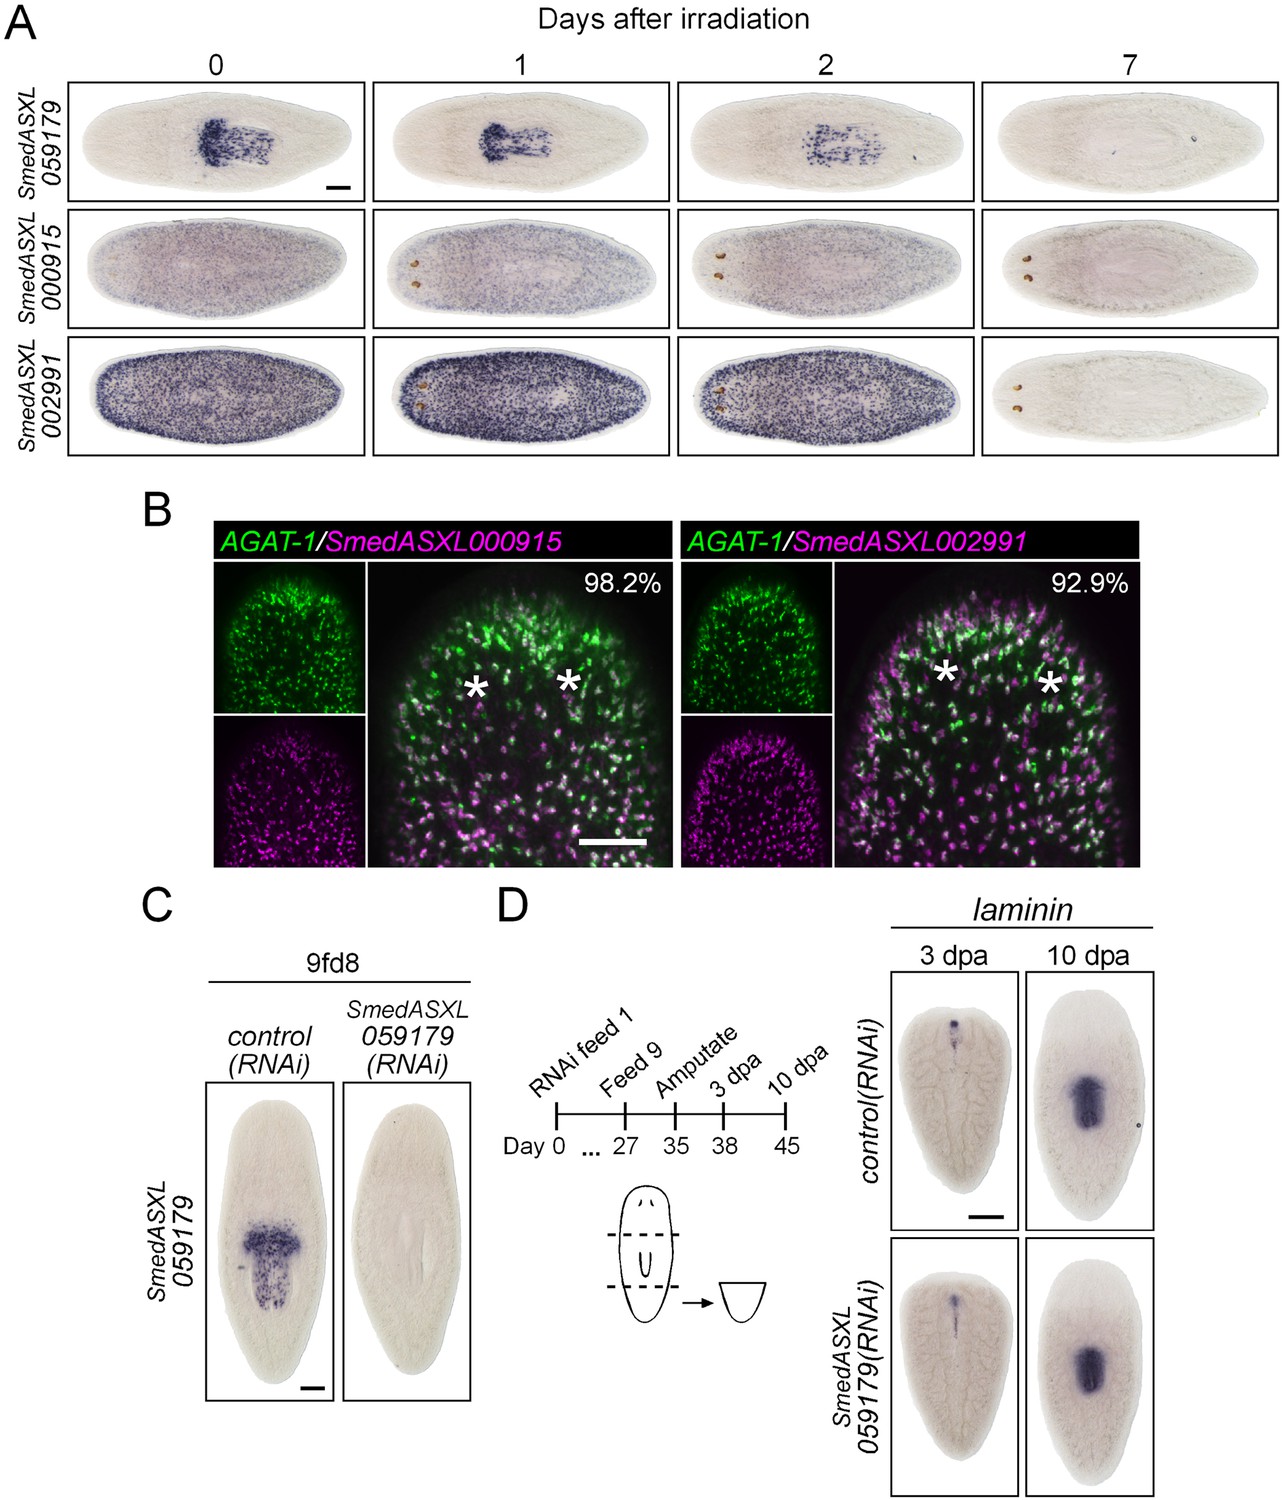
Characterization of down-regulated genes in mex3-1(RNAi) animals.
(A) Expression of three genes down-regulated after mex3-1 RNAi was assessed in lethally irradiated worms by WISH. Scale bar, 200 μm. (B) Expression of two mex3-1(RNAi)-down-regulated genes in late progeny was examined by dFISH with AGAT-1. Percentages of cells that express AGAT-1 are indicated in the top-right of each panel. Images shown are confocal projections spanning 4 μm in depth. Scale bar, 100 μm. (C) Functional analysis by RNAi knockdown of the new pharyngeal progenitor marker SmedASXL_059179. Expression of SmedASXL_059179 after knockdown was examined by WISH. Scale bar, 200 μm. (D) Diagram outlining schedule of RNAi feeds and amputation for assessment of pharynx regeneration. Shown is WISH of the pharynx marker laminin in regenerating tail fragments. Scale bar, 200 μm.
Additional files
-
Supplementary file 1
RNA-deep sequencing (RNAseq) from this study and previously published studies and analysis. Raw reads from RNAseq of fluorescence-activated cell sorting (FACS)-isolated X1 and X2 populations, lethally irradiated (60 Gray) whole worms (Irrad), and intact control worms (WTcontrols). Tab 2, transcripts identified using DESq as having enriched expression in the X1 population compared to irradiated animals, with adjusted p-value < 0.001. Tab 4, transcripts identified using DESq as having enriched expression in the X2 population compared to irradiated animals, with adjusted p-value < 0.01.
- https://doi.org/10.7554/eLife.07025.023
-
Supplementary file 2
Established stem cell and progeny genes, and genes characterized in this study. Tab 1–2, listing of 59 verified neoblast-specific genes (Known stem cell genes) and five established postmitotic progeny genes previously shown to be enriched in the X2 FACS gate (Known X2 epithelial progenitor genes) used in Figure 1, Figure 7, and Figure 7—figure supplement 1. Tab 3, annotation of the top 100 X2-enriched genes chosen for expression analysis and RNA interference (RNAi) screening in this study. Tab 4, a total of 66 transcripts were identified as WThighXlow, which are irradiation-sensitive transcripts with low expression in both the X1 and X2 irradiation-sensitive FACS gates. Tab 5, epithelial progenitor markers identified in this study.
- https://doi.org/10.7554/eLife.07025.024
-
Supplementary file 3
Cell counts for co-localization of identified progeny markers with established epithelial progenitor genes. Total cell counts for established lineage markers piwi-1, prog-1, prog-2, and AGAT-1, and new progeny markers identified in this study are shown. All counts were performed in 3–4 animals at multiple body regions (head, pre-pharyngeal, tail).
- https://doi.org/10.7554/eLife.07025.025
-
Supplementary file 4
Transcriptional analysis of mex3-1(RNAi) animals. Raw RNAseq reads of control and mex3-1(RNAi) animals are shown. Best homology to fly and mouse proteins are shown for the top 100 down-regulated genes. The top 21 uncharacterized down-regulated genes chosen for validation by WISH are indicated.
- https://doi.org/10.7554/eLife.07025.026
Download links
A two-part list of links to download the article, or parts of the article, in various formats.
Downloads (link to download the article as PDF)
Open citations (links to open the citations from this article in various online reference manager services)
Cite this article (links to download the citations from this article in formats compatible with various reference manager tools)
A mex3 homolog is required for differentiation during planarian stem cell lineage development
eLife 4:e07025.
https://doi.org/10.7554/eLife.07025


