Phosphodiesterase 4D acts downstream of Neuropilin to control Hedgehog signal transduction and the growth of medulloblastoma
- Stanford University School of Medicine, United States
Figures
Figure 1 with 1 supplement

Signaling downstream of Sema3-Nrp enhances Hh transduction.
(A) Schematic drawing of Nrps protein structure. (B) In NIH3T3 cells in which Nrp1&2 were silenced by RNAi, Hh signaling could be rescued by full-length (FL) Nrp1 construct, but not by Nrp1 constructs that lack the entire extracellular domain (ΔExt), cytoplasmic domain (ΔCyt), A1 (ΔA1), or A2 (ΔA2) domain. Western blot shows that truncated Nrps were expressed with expected molecular weights. (C, D) Hh signaling activity in NIH3T3 cells treated with increasing concentrations of recombinant Shh in conjunction with a constant concentration of Sema3A, Sema3F (3 μg/ml), or VEGF165 (100 ng/ml) for 24 hr (E, F) Western blot shows that lentivirus-mediated expression of shRNA against Nrp1 and Nrp2 abolished the expression of endogenous Nrps (E). On day 3, Hh signaling activity was evaluated after cells were treated with Shh in conjunction with Sema3A or Sema3F for 24 hr (F). In all experiments Gli1 transcript level was measured by qPCR to evaluate Hh signaling activity; a.u., arbitrary unit. All error bars represent SEM. Statistics: Student's t-Test. *p < 0.05.
Figure 1—figure supplement 1
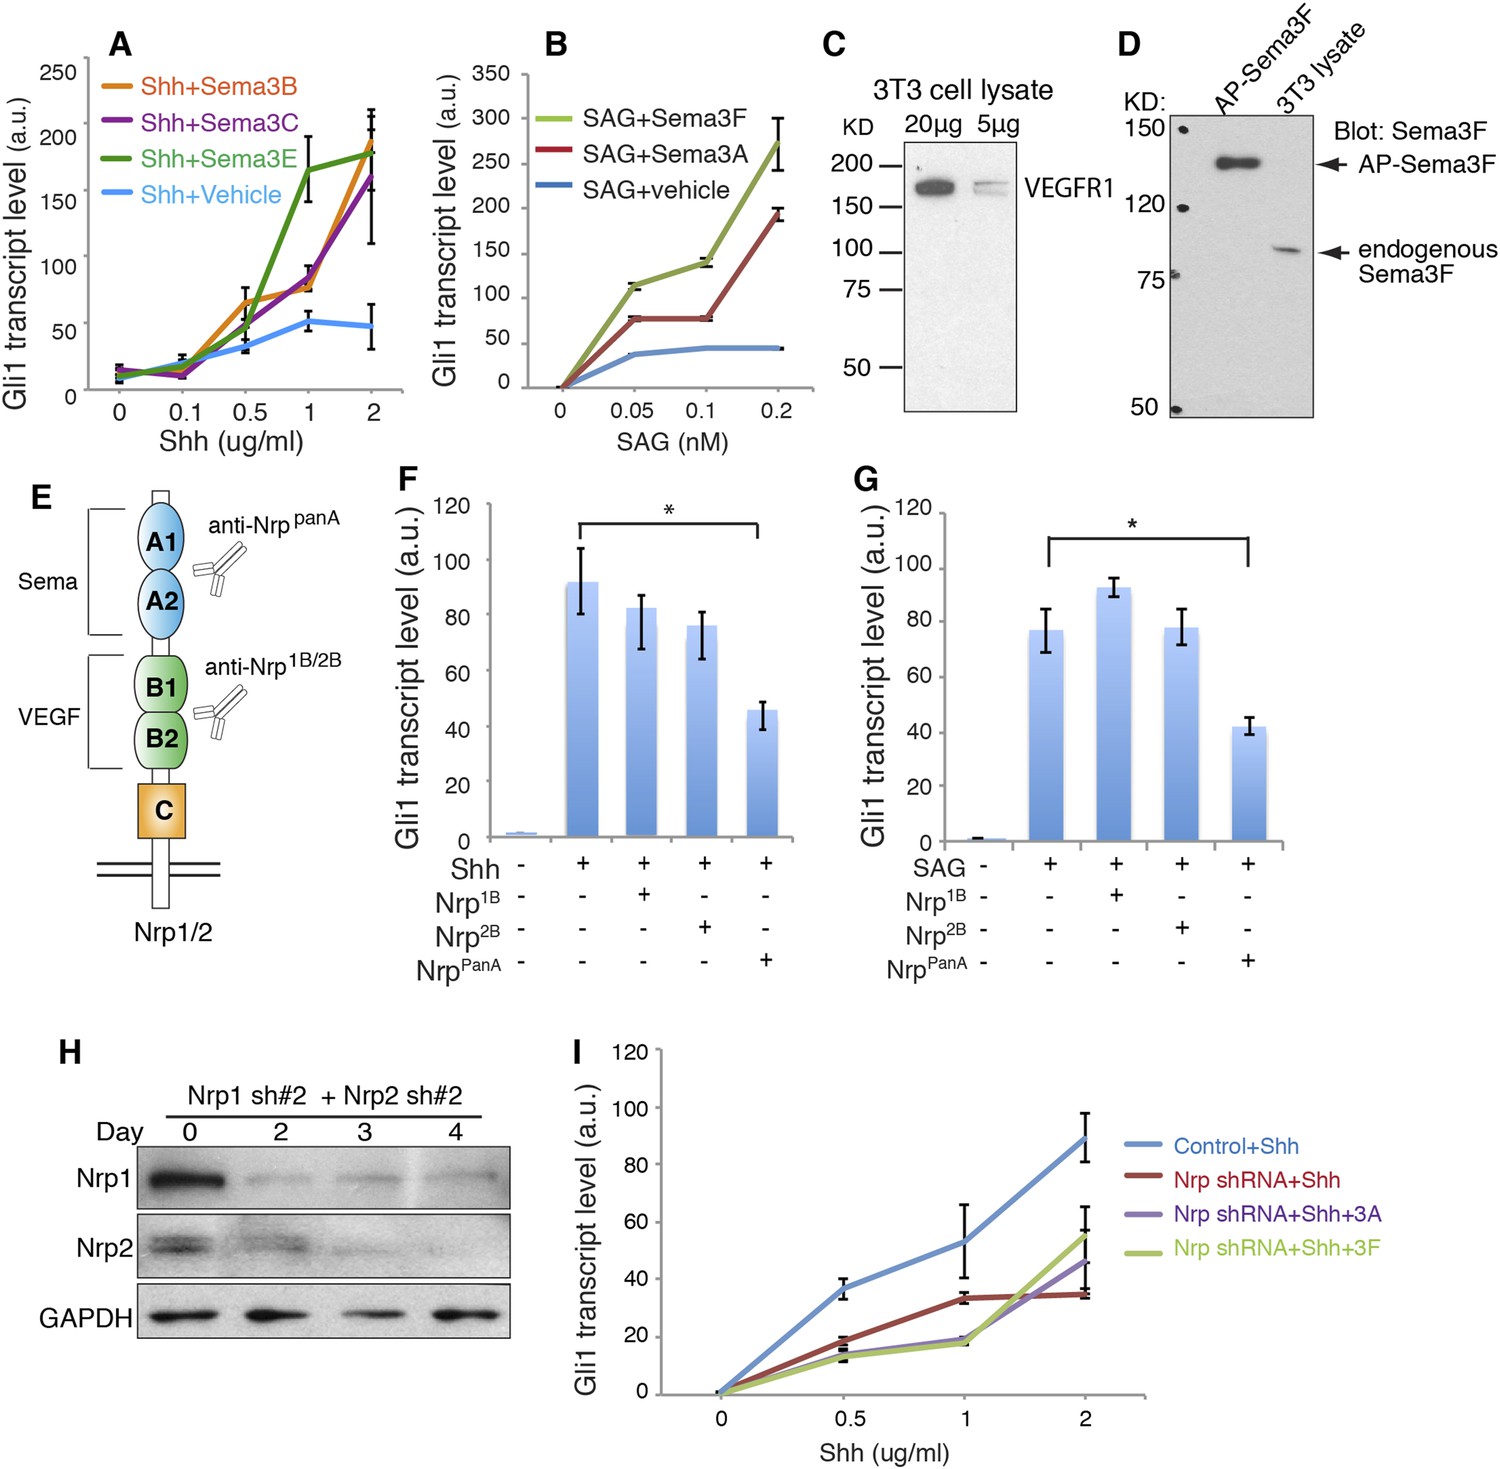
Sema3 signals through Nrps to enhance Hh transduction.
(A, B) Hh signaling activity in NIH3T3 cells treated with increasing concentrations of Shh (A) or SAG (B) in conjunction with a constant concentration of Sema3 recombinant proteins (3 μg/ml) for 24 hr. (C, D) Western blot showing that VEGFR1 and Sema3F are expressed in 3T3 cells. (E) Diagram of function-blocking Nrp antibodies that specifically block Nrp binding with the ligands Sema3 and VEGF. (F, G) Hh signaling activity in NIH3T3 cells incubated with function-blocking Nrp antibodies (50 μg/ml) together with Shh or SAG for 4 hr. (H) Western blot shows that lentivirus-mediated expression of shRNA (pair #2) against Nrp1 and Nrp2 abolished the expression of endogenous Nrps. (I) On day 3, Hh signaling activity was evaluated after cells were treated with Shh in conjunction with Sema3A or Sema3F for 24 hr. In all experiments Gli1 transcript level was measured by qPCR to evaluate Hh signaling activity; a.u., arbitrary unit. All error bars represent SEM. Statistics: Student's t-Test. *p < 0.05, **p < 0.01, ***p < 0.001.
Figure 2 with 2 supplements
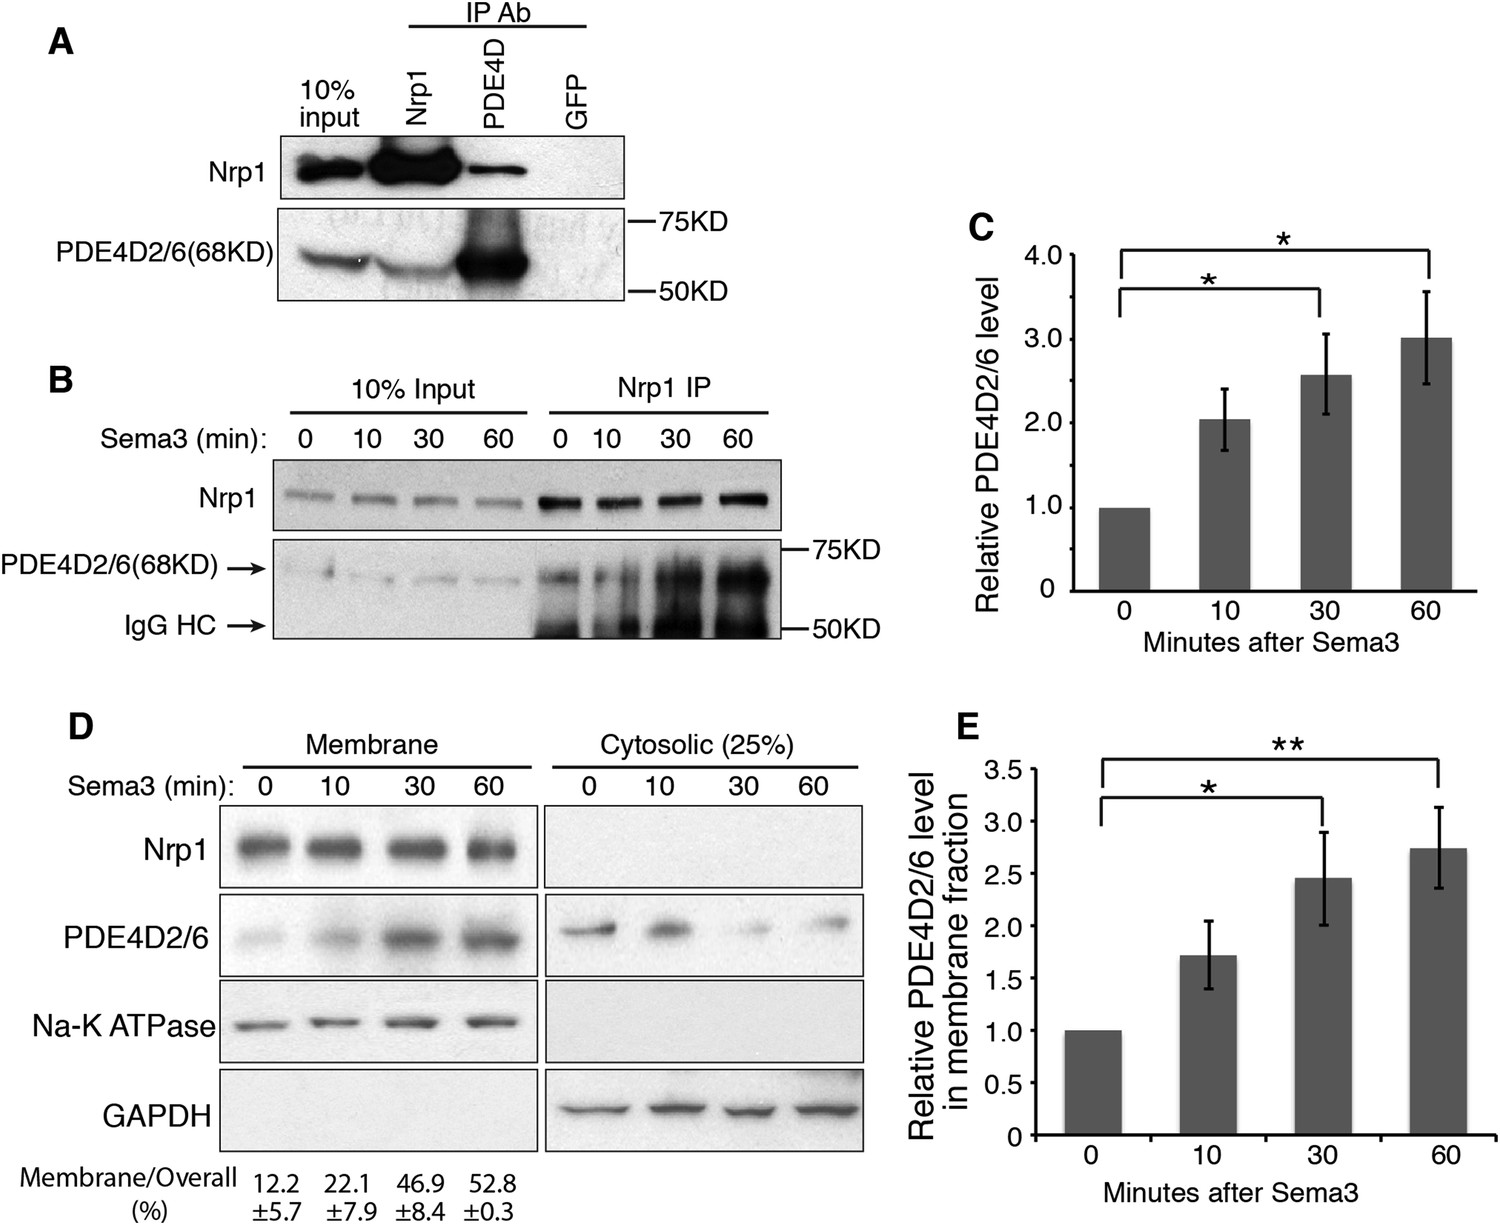
Nrp1 interacts with PDE4D, and Sema3 promotes this interaction.
(A) Immunoblot showing that the endogenous PDE4D isoform 2/6 from NIH3T3 cells was immunoprecipated by Nrp1 antibody, but not by an unrelated GFP antibody. (B, C) Immunoblots showing the amount of PDE4D2/6 immunoprecipitated by Nrp1 antibody from cells treated with Sema3 (a combination of Sema3A+3F) for different periods of time. (B). Band intensity was normalized to the input at the corresponding time point, and then normalized to time 0 (C). (D, E) Immunoblots showing the amount of Nrp1 and PDE4D2/6 in the membrane and cytosolic fractions from cells treated with Sema3A+3F for different periods of time. (D). Band intensity was normalized to time 0 (E). Quantification in (C) and (E) were from three independent experiments. Error bars represent SEM. Statistics: Student's t-Test. *p < 0.05, **p < 0.01.
Figure 2—figure supplement 1
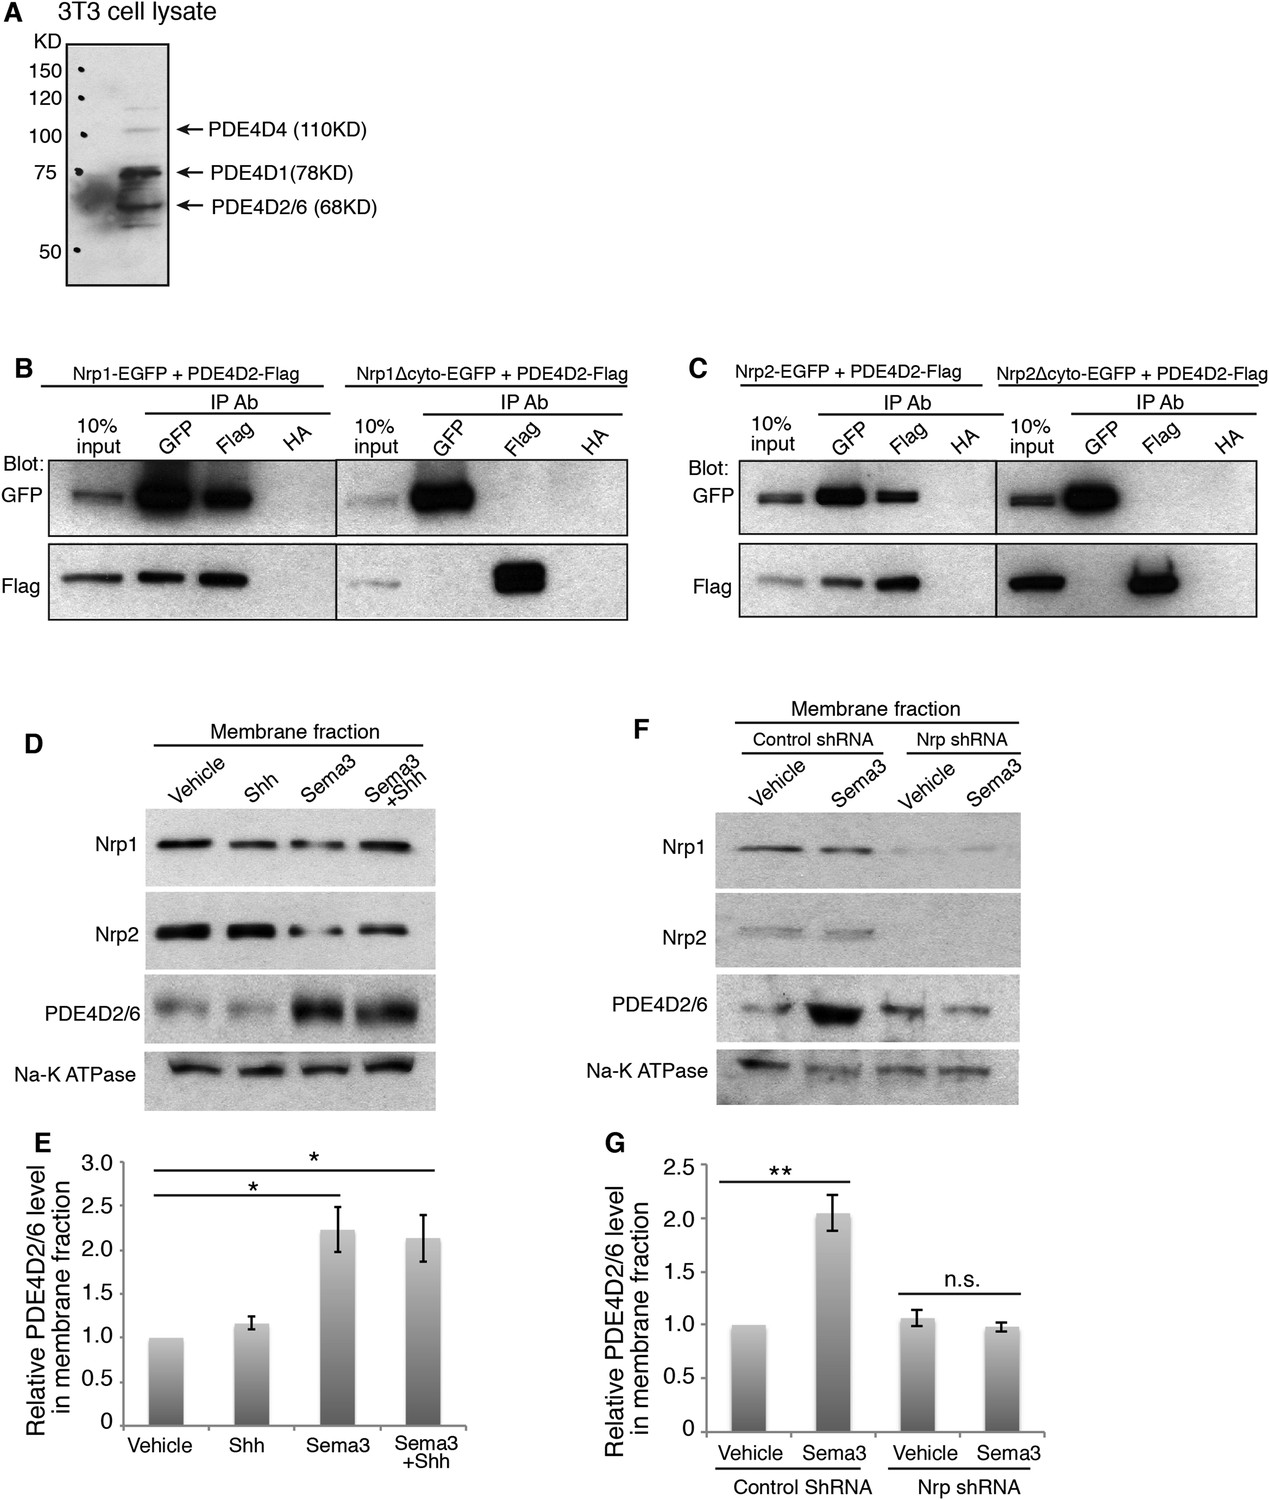
The cytoplasmic domain of Nrps mediates their interactions with PDE4D2.
(A) Major PDE4D isoforms expressed in NIH3T3 cells recognized by a PDE4D antibody against the consensus C-terminus of all PDE4D isoforms. (B, C) Flag- tagged PDE4D2 co-immunoprecipitates with full length EGFP-tagged Nrp1/2 after they are overexpressed in NIH3T3 cells, but not with cytoplasmic domain-truncated Nrps (Nrp1/2-Δcyto). (D) Immunoblots showing the amount of Nrp1/2 and PDE4D2/6 in the membrane fractions from cells treated with Shh, Sema3A+3F, or the combination of Shh and Sema3s for 30 min. (E) Band intensity was normalized to vehicle. (F) After Nrp1+2 were silenced by RNAi, membrane fractions were isolated from the cell. Immunoblots showing the amount of Nrp1/2 and PDE4D2/6 in the membrane fractions from cells treated with Sema3 (3A+3F) for 30 min. (E) Band intensity was normalized to vehicle. Quantification in (E) and (G) were from three independent experiments. Error bars represent SEM. Statistics: Student's t-Test. *p < 0.05, **p < 0.01.
Figure 2—figure supplement 2

Sema3-Nrp signaling reduces intracellular cAMP levels.
(A) cAMP standard curve generated by cAMP-Glo assay showing the linear relationship between cAMP concentration and the luminescence intensity change (ΔLuminescence). (B) ΔLuminescence was read out after cells were treated with control (BSA), forskolin (1 μM) or Sema3F (3ug/ml) for 30 min ΔLuminescence was calculated as Luminescencetreated—Luminescenceuntreated. (C) Cells were infected with lentivirus expressing shRNA against Nrp1&2 for 72 hr ΔLuminescence was read out after cells were treated with control (BSA), or Sema3F (3ug/ml) for 30 min. Statistics: Non-parametric Mann–Whitney test. All error bars represent SEM. *p < 0.05, **p < 0.01.
Figure 3 with 2 supplements
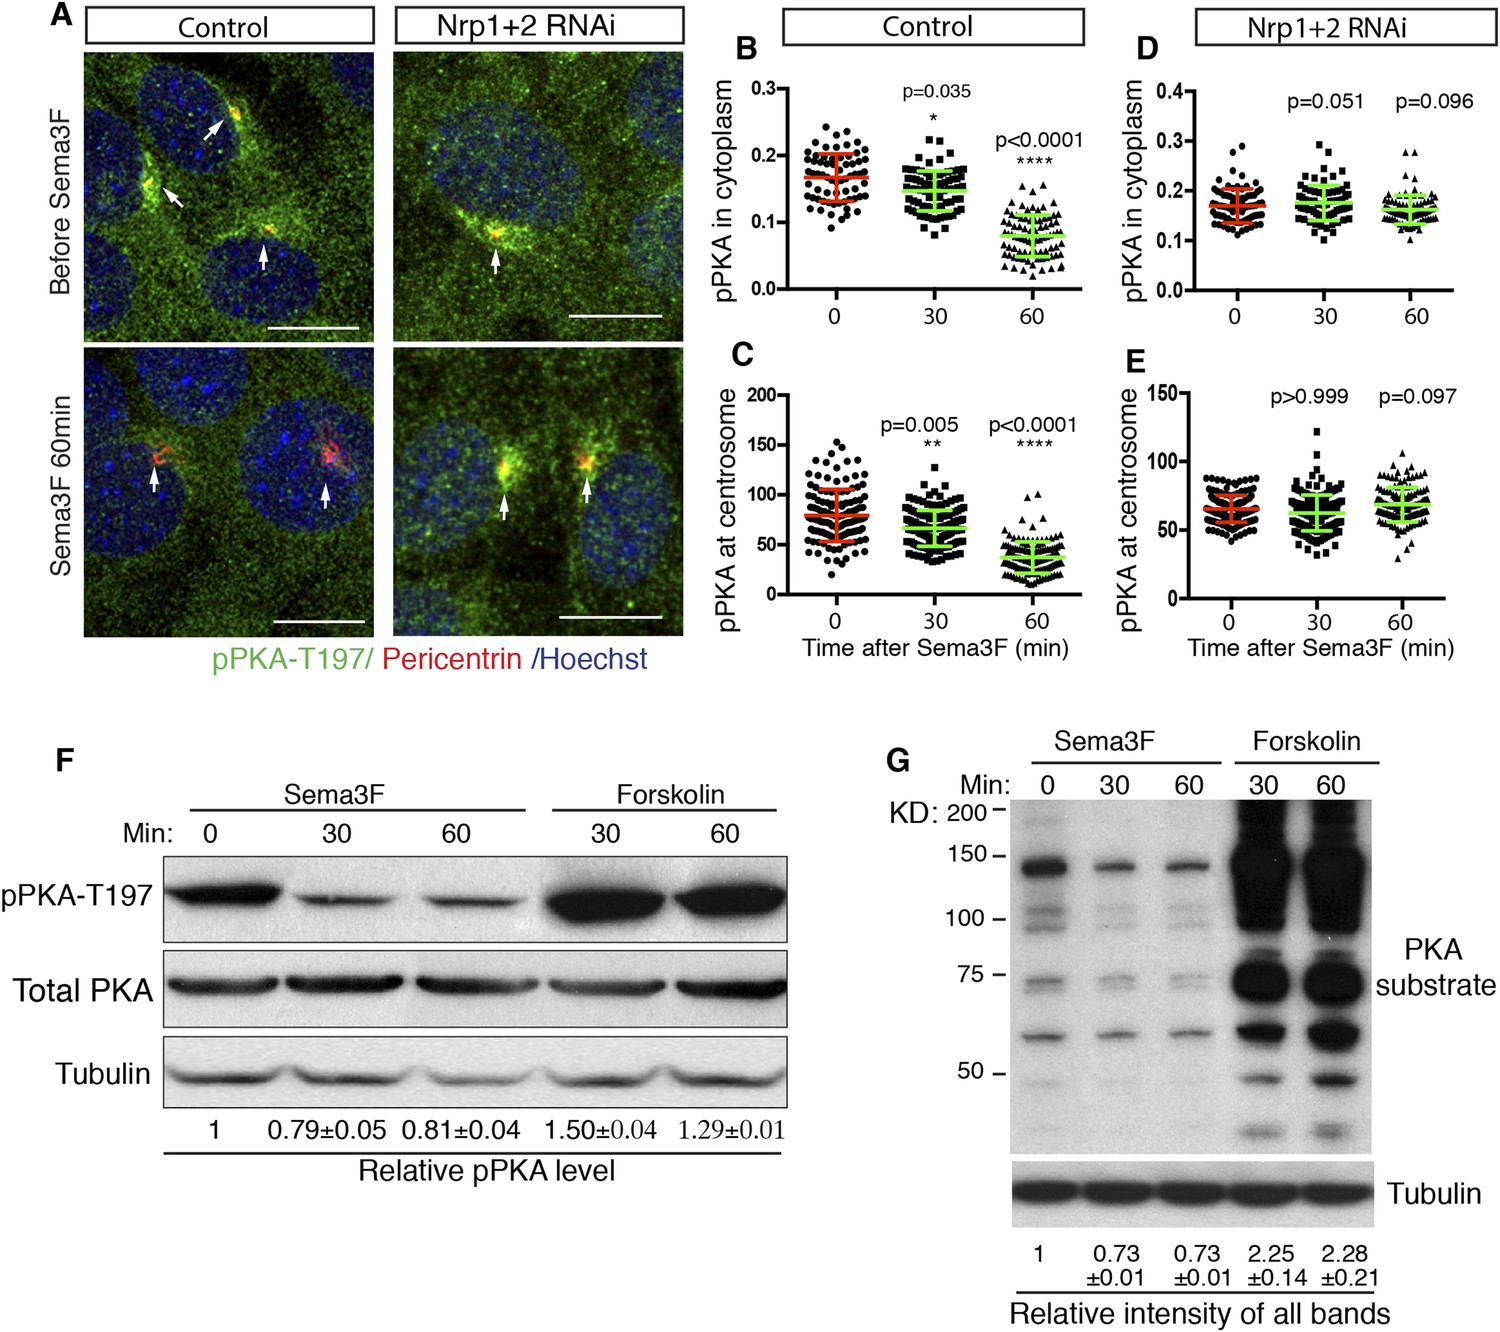
Sema3-Nrp signaling inhibits PKA activity.
(A) Immunofluorescence showing active PKA in NIH3T3 cells after Sema3F treatment. Cells were infected with lentiviruses expressing control shRNA or shRNA against Nrp1&2 for 72 hr. Active PKA is recognized by the antibody against phospho-PKA T197 (green). Scale bar, 10 μm. (B–E) Quantification of phospho-PKA level at the cytoplasm and centrosome. Data are shown as mean ± SD. Statistics: Kruskal–Wallis non-parametric One-Way ANOVA. (F) Western blot showing the phospho-PKA and total PKA levels in NIH3T3 cells treated with Sema3F or Forskolin for indicated time periods. Quantification of relative active PKA level (mean ± SEM) from three independent experiments was shown at the bottom of each blot. (G) Western blot showing the levels of PKA substrate phosphorylation in NIH3T3 cells treated with Sema3F or Forskolin for indicated time periods. Quantification of the relative intensity of all bands in each lane (mean ± SEM) from three independent experiments was shown at the bottom.
Figure 3—figure supplement 1
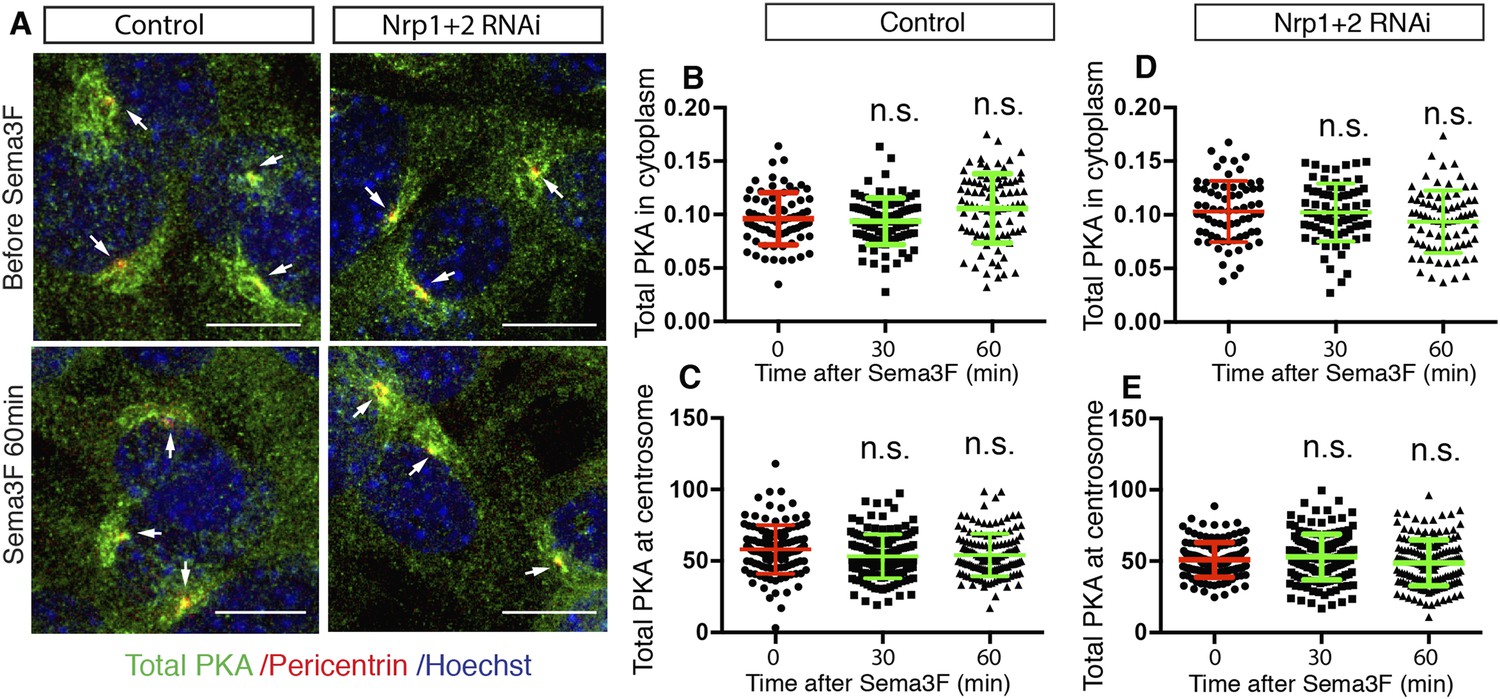
Sema3-Nrp signaling does not change total PKA level.
(A) Immunofluorescence showing total PKA in NIH3T3 cells after Sema3F treatment. Cells were infected with lentiviruses expressing control shRNA or shRNA against Nrp1&2 for 72 hr. The antibody that recognizes total PKA stains for both phosphorylated and non-phosphorylated PKA (green). Scale, 10 μm. (B–E) Quantification of total PKA level at the centrosome. Data are shown as mean ± SD. Statistics: Kruskal–Wallis non-parametric One-Way ANOVA.
Figure 3—figure supplement 2
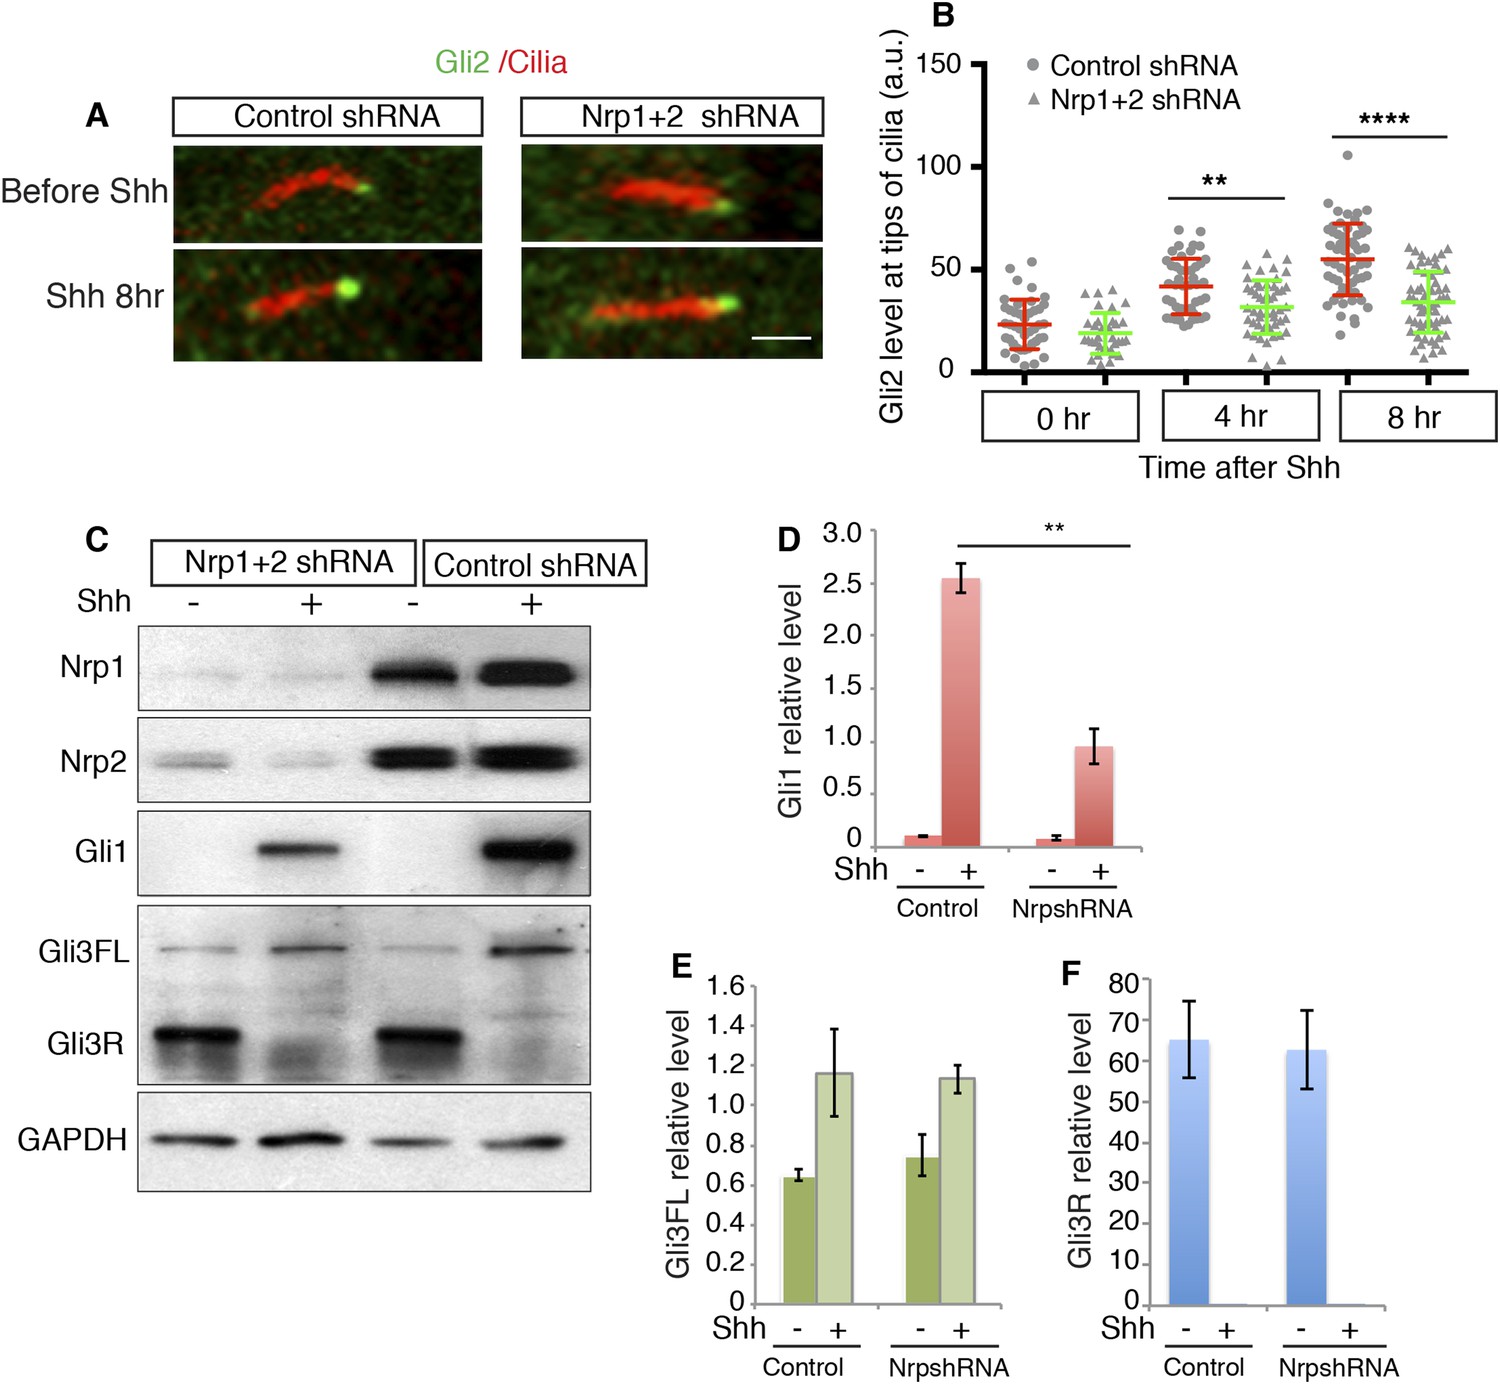
Sema3-PKA signaling enhances Shh-induced Gli2 enrichment to the cilia tip, but does not affect Gli3 processing.
(A, B) NIH3T3 cells were infected with lentivirus expressing control or Nrp shRNA for 72 hr. After Shh treatment, cells were stained with Gli2 and acetylated tubulin (Red). Gli2 intensity at the cilia tips (arrows) was measured (B). (C) 72 hr after lentivirus-mediated RNAi, cells were treated with Shh for 24 hr. Cell lysate was then used in Western Blot to detect Gli1 induction and Gli3 processing. (D–F) Quantification of the intensity of Gli1, Gli3 full length and Gli3 repressor from 3 independent experiments. Data are mean ± SD. Statistics: non-parametric Mann–Whitney test. **p < 0.01, ****p < 0.0001. Scale, 2 μm. Abbreviation: Gli3FL, Gli3 full length. Gli3R: Gli3 repressor.
Figure 4 with 2 supplements
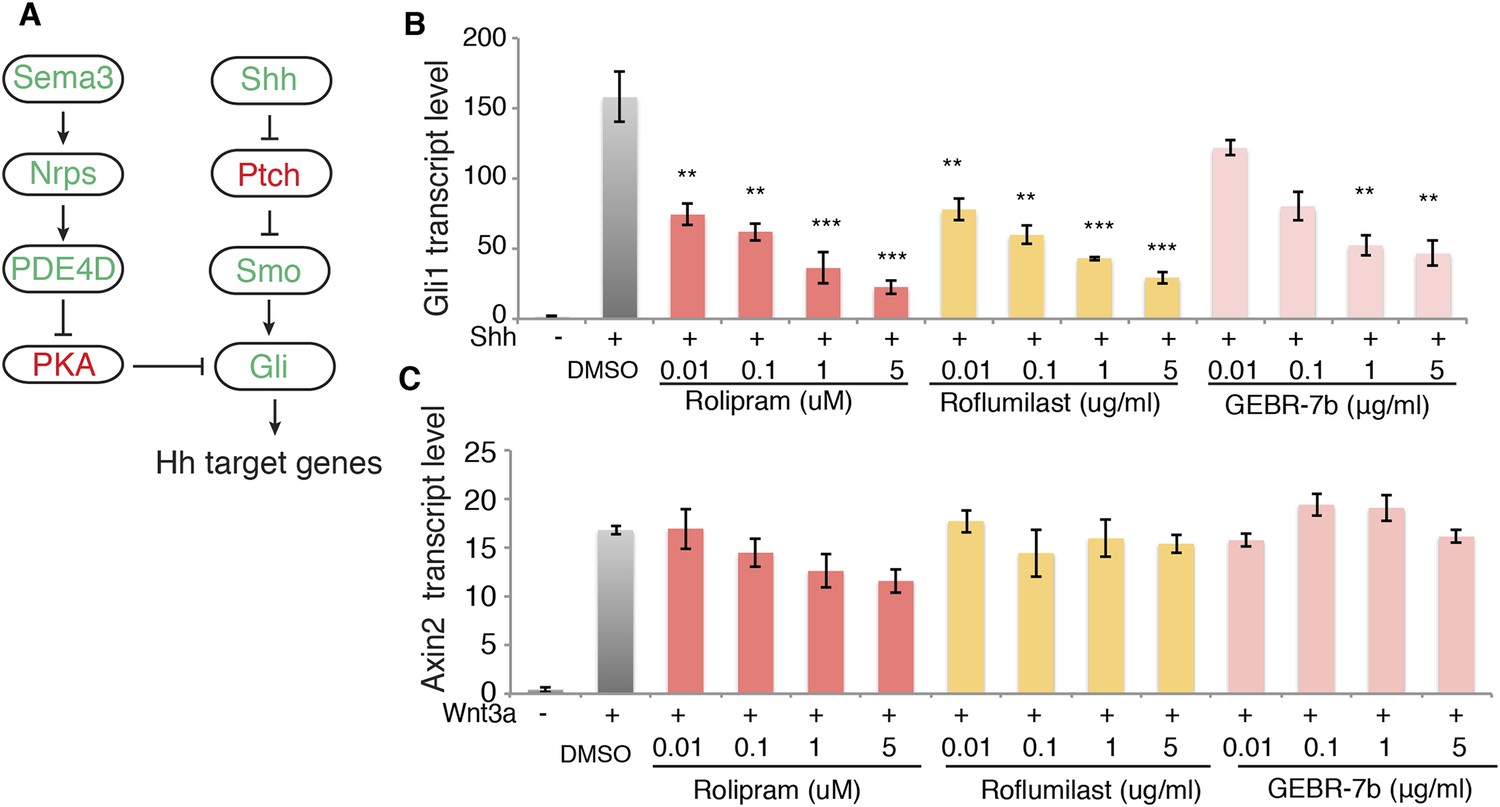
PDE4D inhibitors suppress Hh signal transduction.
(A) Schematic diagram showing that Sema3-Nrp signaling regulates Hh pathway through controlling the activity of PDE4D and PKA. (B) The Hh signaling activity in NIH3T3 cells incubated with PDE4D inhibitors together with Shh conditioned medium for 4 hr Gli1 transcript levels were measured by qPCR to evaluate the Hh signal transduction. (C) The Wnt signaling activity in NIH3T3 cells incubated with PDE4D inhibitors together with Wnt3a for 4 hr Axin2 transcript levels were measured by qPCR to evaluate the Wnt signal transduction. All data are mean ± SEM. Statistics: Student t-Test, in comparison to the condition where cells were treated with DMSO. **p < 0.01, ***p < 0.001.
Figure 4—figure supplement 1
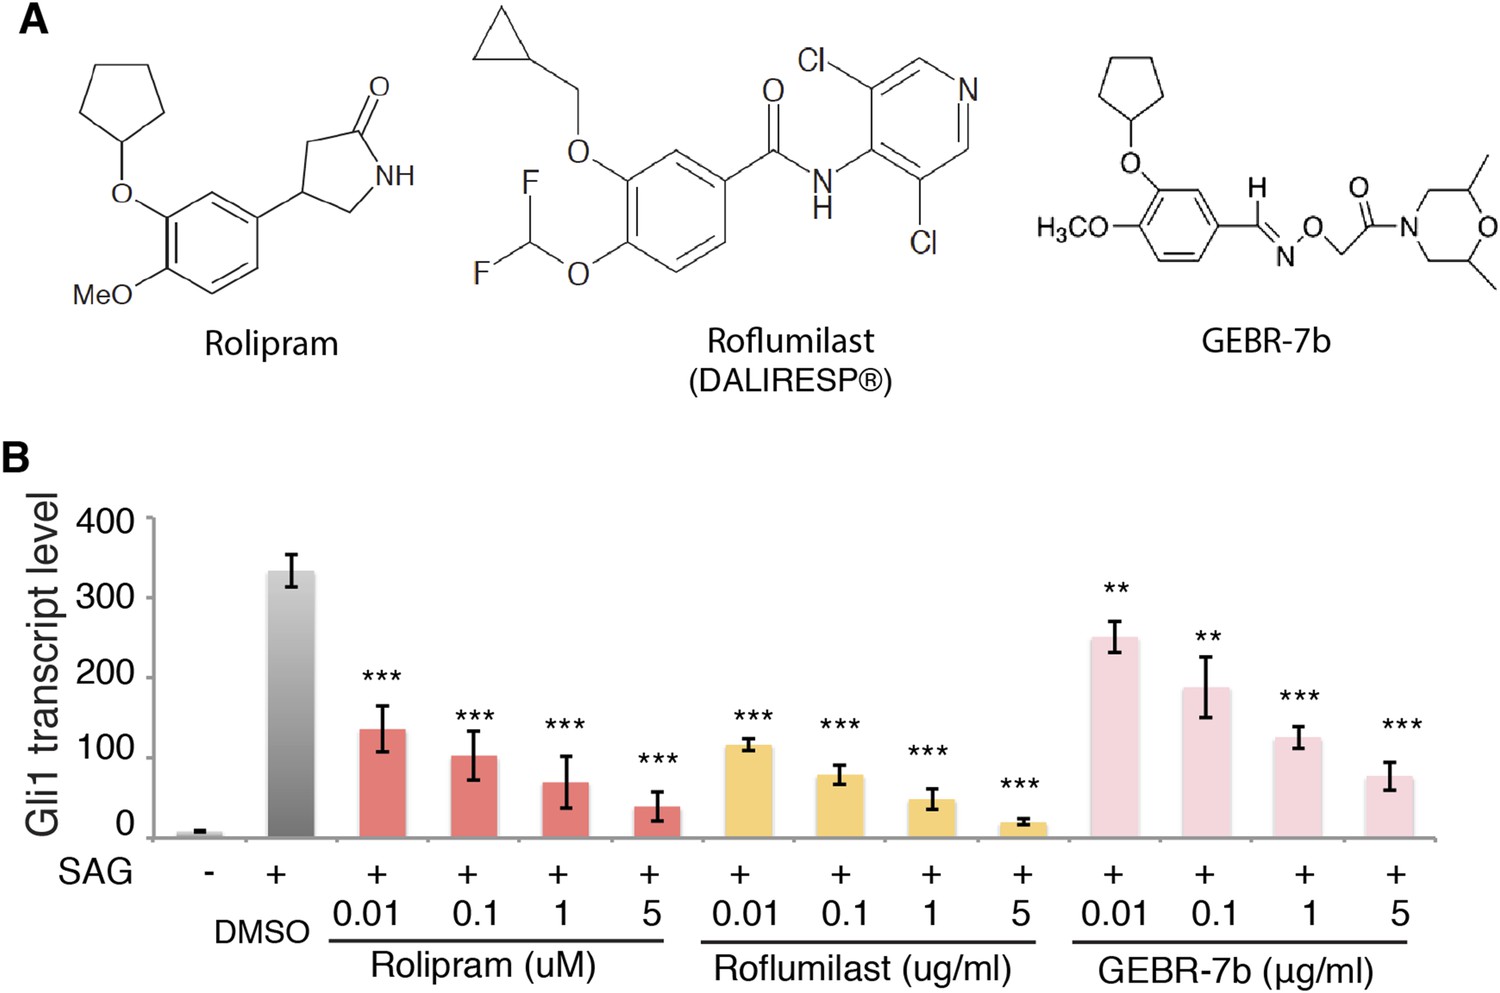
PDE4D inhibitors suppress SAG-induced Hh signal transduction.
(A) Chemical structure of the PDE4D inhibitors used in the assays. (B) The Hh signaling activity in NIH3T3 cells incubated with PDE4D inhibitors together with SAG for 4 hr Gli1 transcript levels were measured by qPCR to evaluate the Hh signal transduction. All data are mean ± SEM. Statistics: Student t-Test, in comparison to the condition where cells were treated with DMSO. **p < 0.01, ***p < 0.001.
Figure 4—figure supplement 2
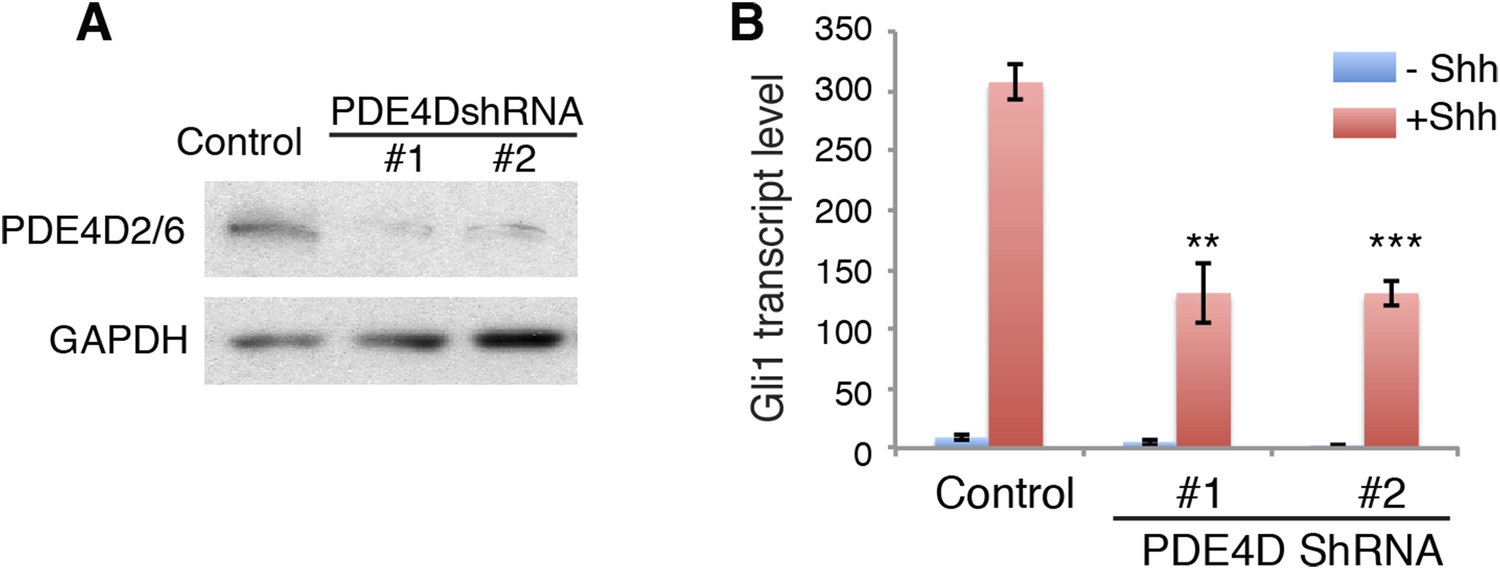
PDE4D knockdown reduces Hh signaling activity.
(A) Western blot shows that lentivirus-mediated expression of shRNA against PDE4D abolished the expression of endogenous PDE4D2/6. (B) On day 3, Hh signaling activity was evaluated after cells were treated with Shh. Gli1 transcript level was measured by qPCR to evaluate Hh signaling activity. Data are mean ± SEM. Statistics: Student's t-Test. **p < 0.01, ***p < 0.001.
Figure 5
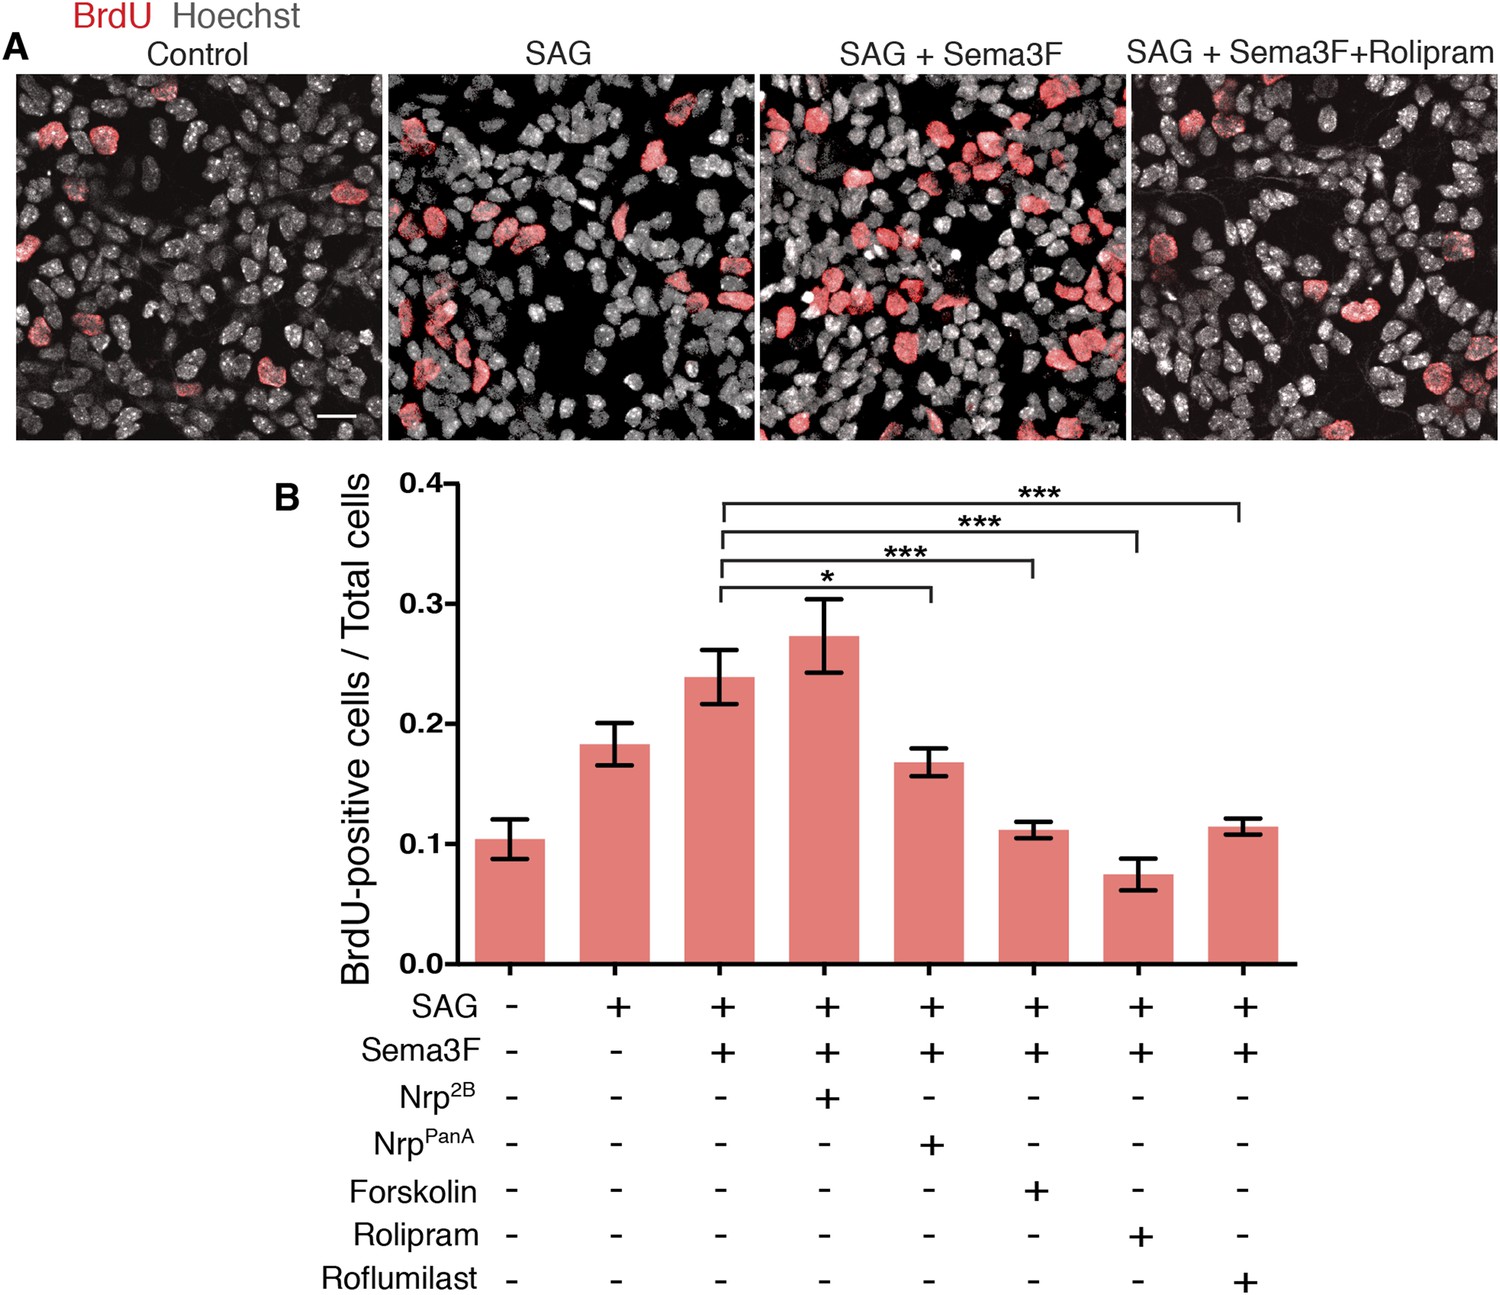
GNP proliferation is promoted by Sema3 and inhibited by hyperactive PKA.
(A) GNP proliferation was assayed by BrdU incorporation in GNPs cultured in vitro for 20 hr. GNPs were cultured in medium with indicated reagents and BrdU was added 1 hr before the cells were fixed. Scale: 20 μm. (B) BrdU incorporation rate was calculated as the number of BrdU-positive cells divided by total cell number. Error bars represent SEM, Statistics: Kruskal–Wallis non-parametric One-Way ANOVA. *p < 0.05, ***p < 0.001.
Figure 6 with 1 supplement
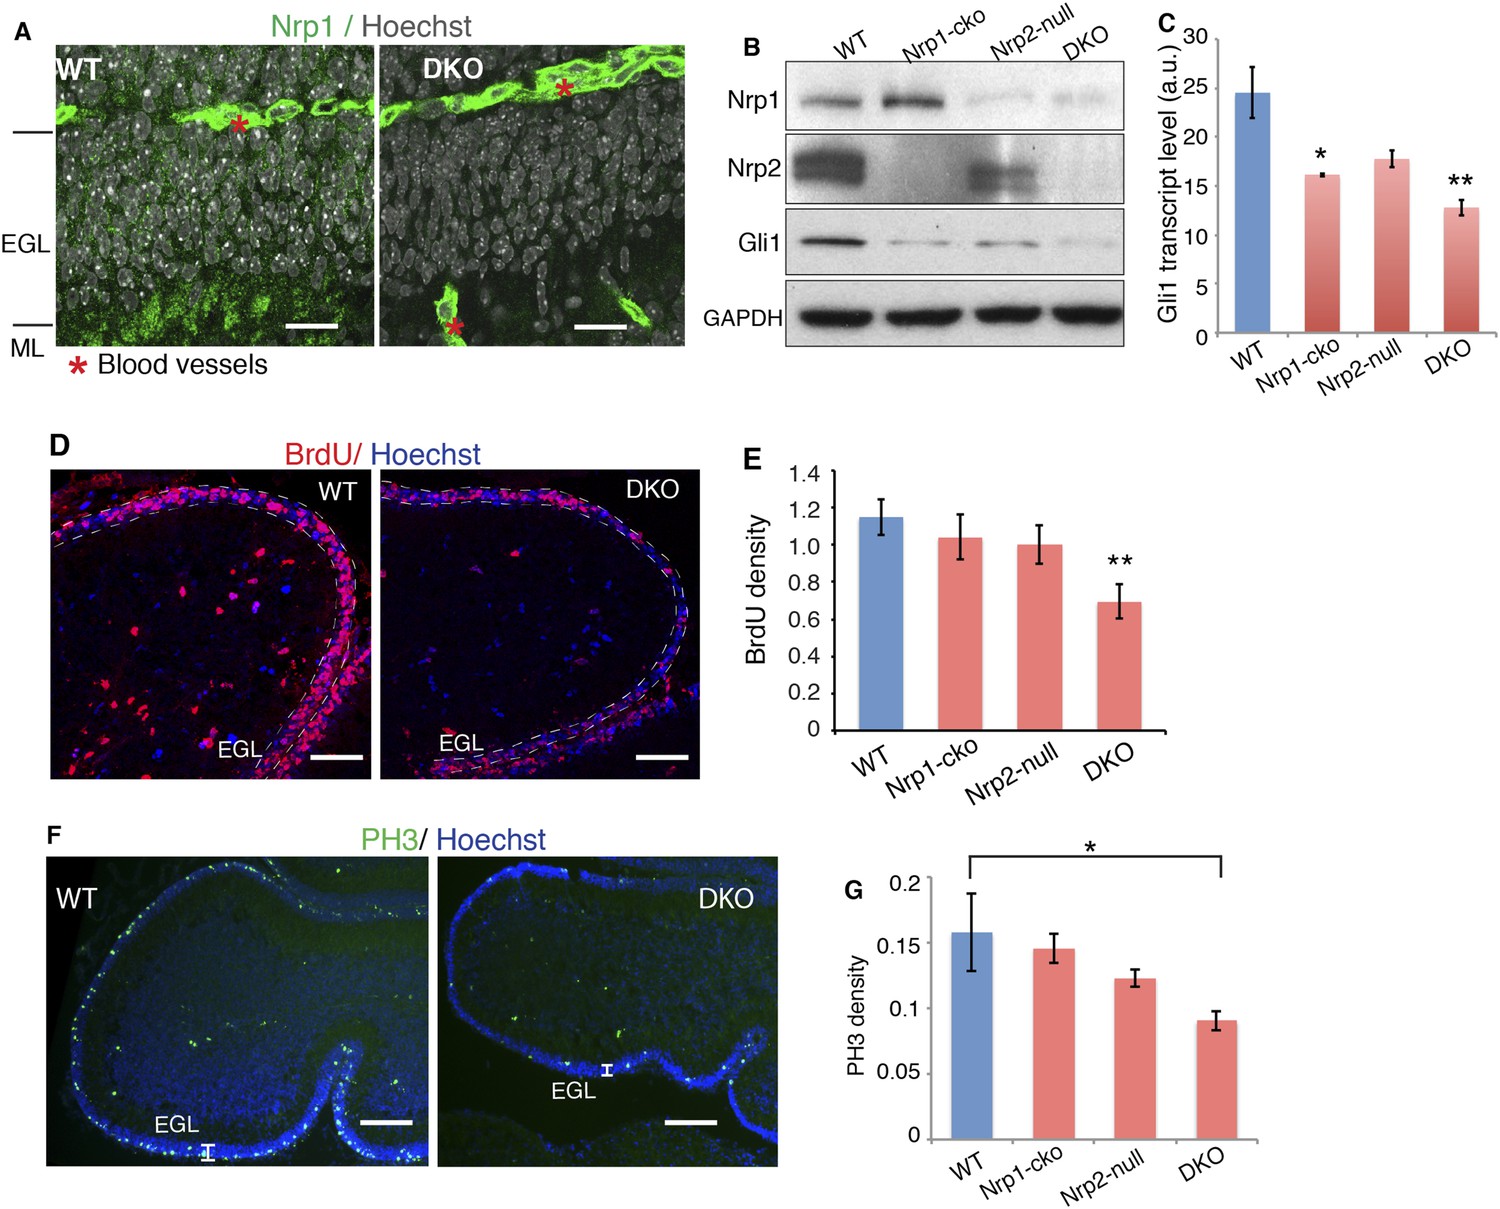
Loss of Nrps impairs GNP proliferation in the developing cerebellum.
(A) Immunostaining of Nrp1 (green) in the P7 cerebellum of wild type and Nrp1/2 DKO mouse show that Nrp1 was specifically knocked out from GNP cells in EGL and parallel fibers in ML, but remains in blood vessels. Scale, 20 μm. (B) Immunoblots showing that Nrp1 and 2 are knocked out from DKO cerebellum, and that Gli1 expression was much lower in the cerebellum of Nrp1/2 DKO mice compared to wild type littermates. Nrp1-cko: Math1Cre,Nrp1floxed/floxed. Nrp2-null: Nrp2-/-. (C) The Hh pathway activity in the cerebellum of Nrp1/2 DKO mice and littermates was evaluated by Gli1 transcript level. (D, E) GNP proliferation in the EGL (circled by dotted lines) of Nrp1/2 DKO mice and littermates was evaluated by BrdU incorporation assay. Scale: 50 μm. (F, G) Immunostaining and quantification of Phospho-H3 (green) in EGL of wild type and Nrp1/2 DKO cerebellum at P7. Scale, 100 μm. All error bars represent SEM. Statistics: non-parametric Mann–Whitney test. *p < 0.05, **p < 0.01.
Figure 6—figure supplement 1

Loss of Nrps in the developing cerebellum leads to PKA hyperactivation.
(A) Immunoblots showing that phospho-PKA level was significantly higher in Nrp1/2 DKO mice at P7 as indicated by phospho-PKA antibody, but the total PKA levels remained unchanged. Quantification of relative active PKA level (mean ± SEM) from 3 animals of each phenotype was shown at the bottom of each blot. (B) Immunoblot showing that PKA substrate phosphorylation increased in Nrp1/2 DKO cerebellum comparing to wild type littermates.
Figure 7 with 1 supplement
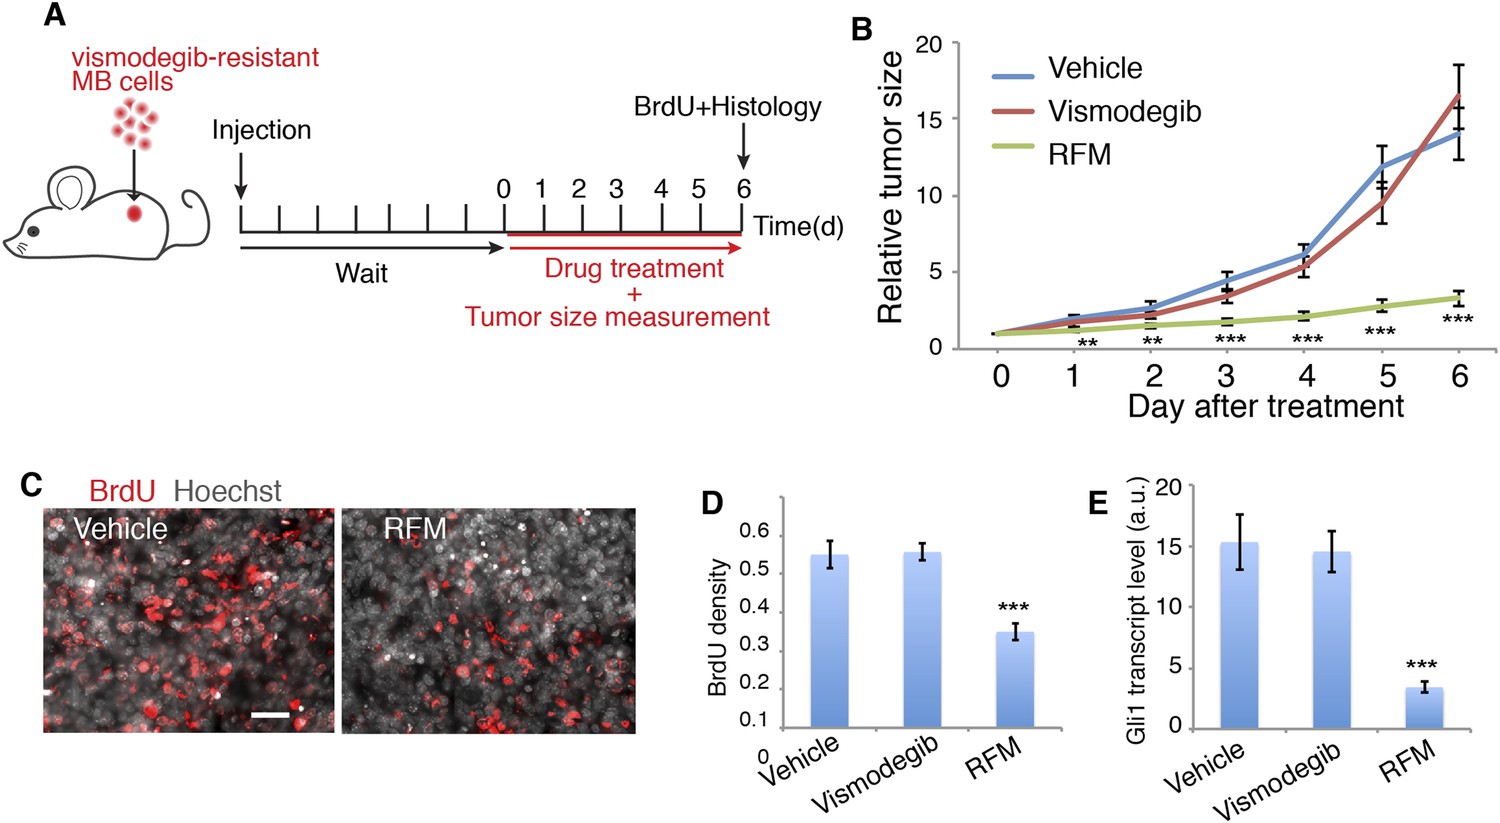
PDE4 inhibitors suppress Hh signal transduction and Hh-related tumor growth.
(A) Schematic diagram of the MB tumor allograft experiment in mouse. Drug treatment started 6 day after injection when the size of tumors could be accurately measured. (B) The relative tumor size is defined as the tumor volume on the indicated day divided by that on day 0. For each drug 9–10 mice were used. (C, D) BrdU density in tumors after drug treatment. Scale: 50 μm. (E) Hh signal transduction in tumors was assessed by Gli1 transcription level through qPCR. RFM: roflumilast. Error bars represent SEM. Statistics: Student's t-Test. **p < 0.01, ***p < 0.001.
Figure 7—figure supplement 1
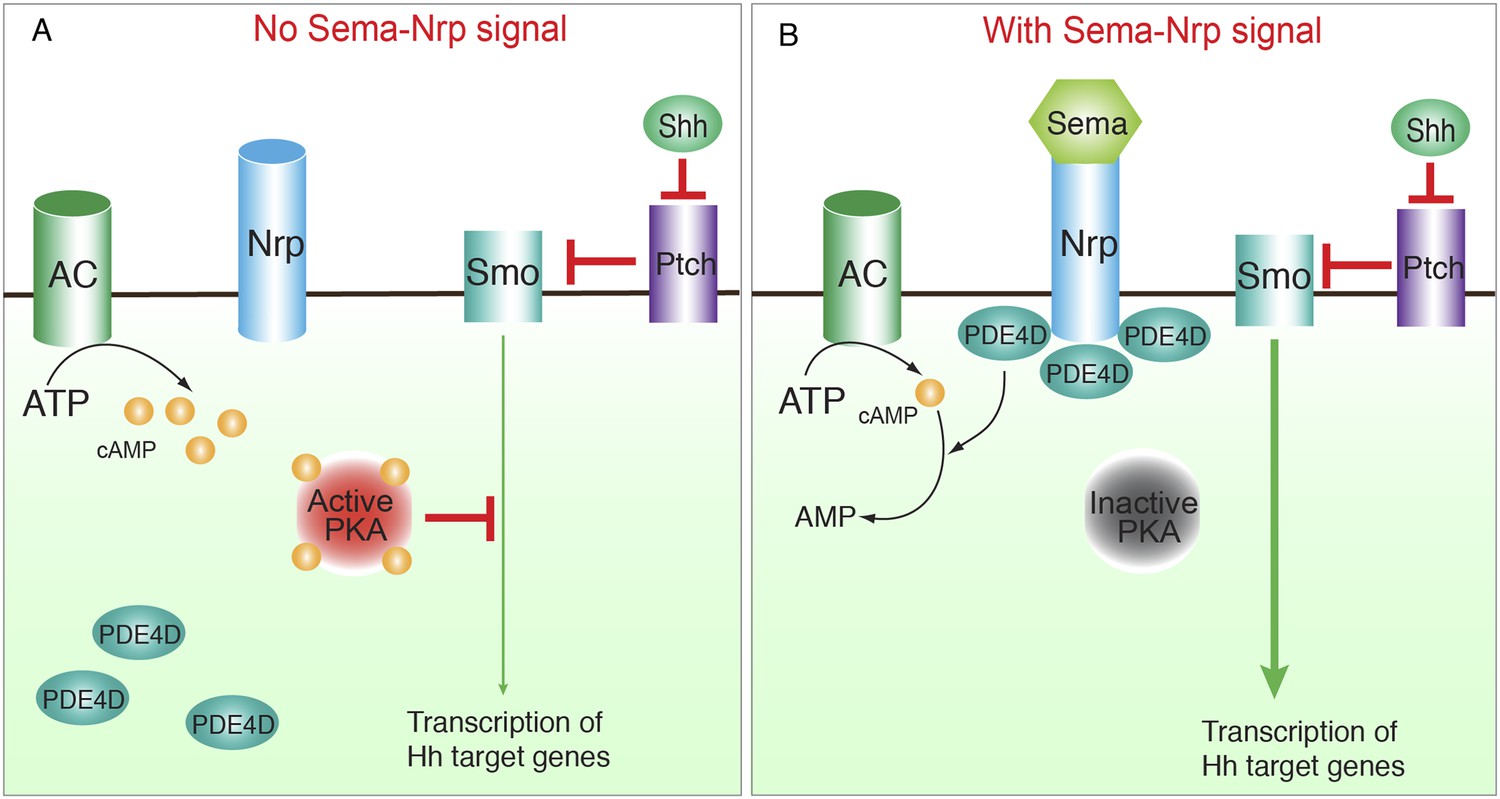
Schematic view of the integration of Sema3-Nrp with the Hh signal pathway by controlling PKA and PDE4.
(A) Without Sema3 or Nrps, the majority of PDE4D resides in the cytoplasm rather than being associated with the cell membrane, where cAMP is produced by AC. As peri-membrane cAMP is not easily accessible to cytoplasmic PDE4D for degradation, its concentration remains high, which leads to high PKA activity and inhibition of Hh signaling. (B) In the presence of Sema3 and Nrps, PDE4D is recruited to the cell membrane and thus brought into close proximity to its target cAMP. This results in reduced cAMP concentration in the entire cell and at the cilium base. Consequently PKA is inhibited, which promotes Hh signal transduction. In this process, inhibition of PKA by Sema3-Nrp signal per se is insufficient to turn on Hh signaling; instead it enhances Hh signaling once Shh turns on the pathway. Abbreviations: AC: Adenylyl Cyclase; PDE4D: Phosphodiesterase 4D; Nrp: Neuropilin.
Author response image 1
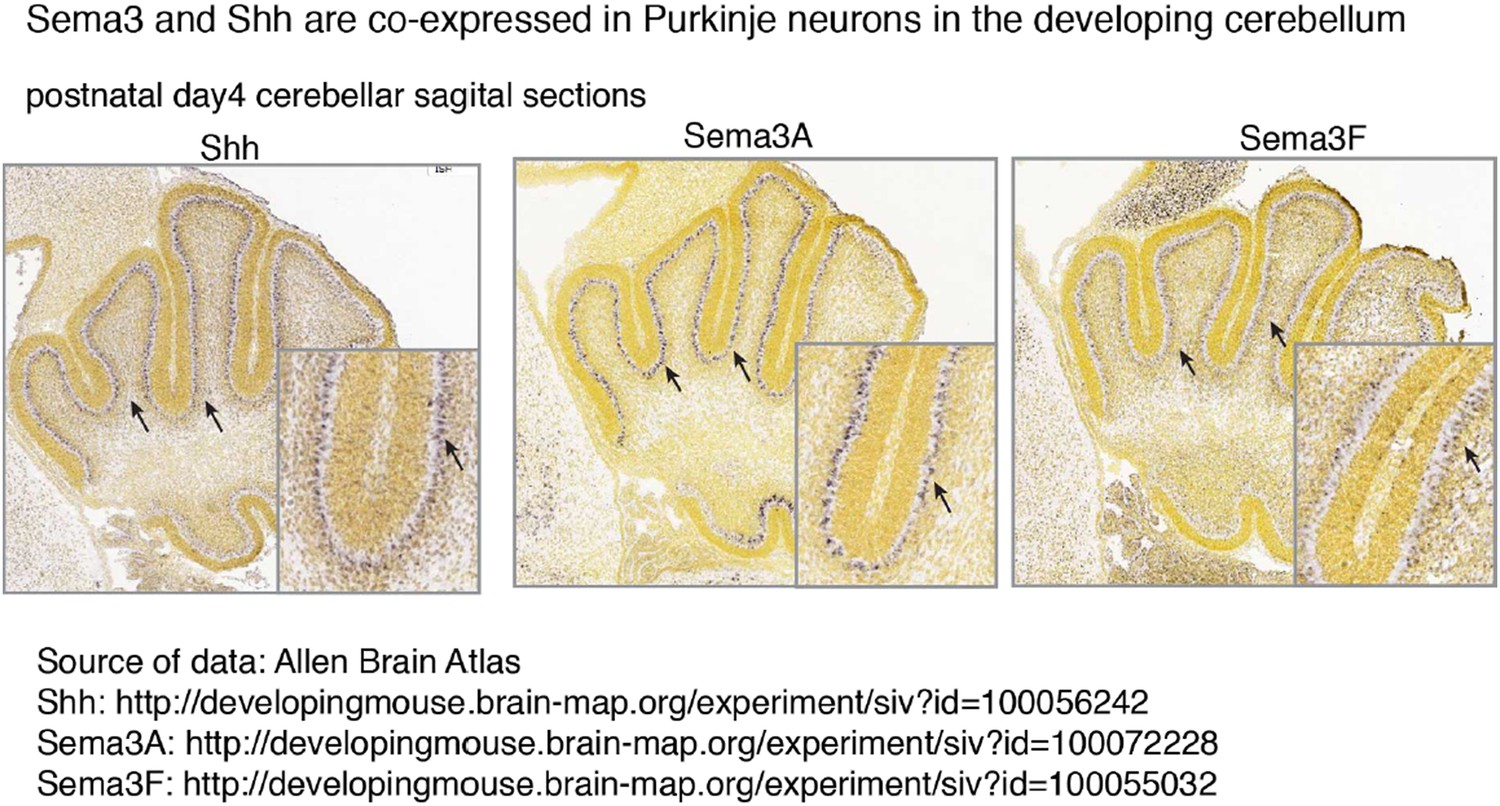
Sema3 and Shh are co-expressed in Purkinje neurons in the developing cerebellum.
Multiple Sema3 isoforms are co-expressed with Shh in Purkinje neurons in the developing cerebellum. In situ hybridization results are from Allen Brain Atlas. Arrows point to the cell bodies of Purkinje neurons.
Author response image 2
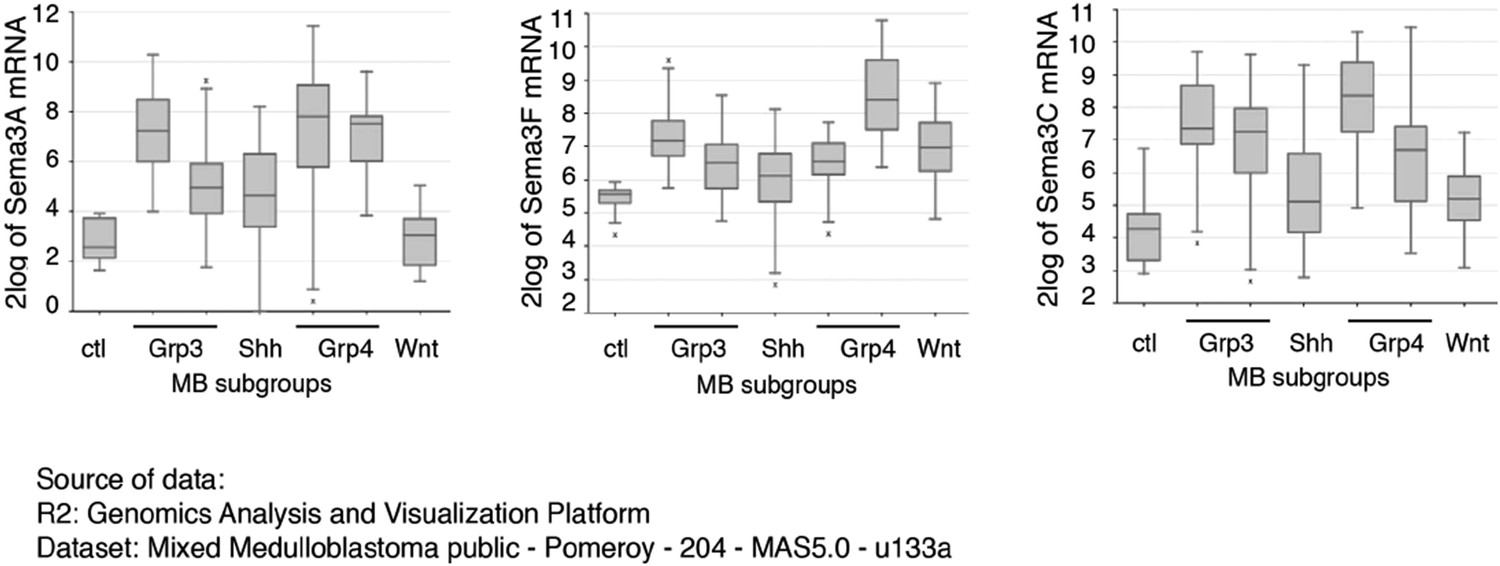
Sema3 expression levels are elevated in medulloblastoma.
Multiple isoforms of Sema3 expression levels are elevated in medulloblastoma. Data are RNA-seq results from 204 patient samples, and were originally published in Cho et al., J. Clin. Oncol. 2011, 29: 1424.
Download links
A two-part list of links to download the article, or parts of the article, in various formats.
Downloads (link to download the article as PDF)
Open citations (links to open the citations from this article in various online reference manager services)
Cite this article (links to download the citations from this article in formats compatible with various reference manager tools)
Phosphodiesterase 4D acts downstream of Neuropilin to control Hedgehog signal transduction and the growth of medulloblastoma
eLife 4:e07068.
https://doi.org/10.7554/eLife.07068


