Transglutaminase 2 contributes to a TP53-induced autophagy program to prevent oncogenic transformation
- Duke-NUS Medical School, Singapore
- National University Health System, Singapore
Figures
Figure 1 with 12 supplements
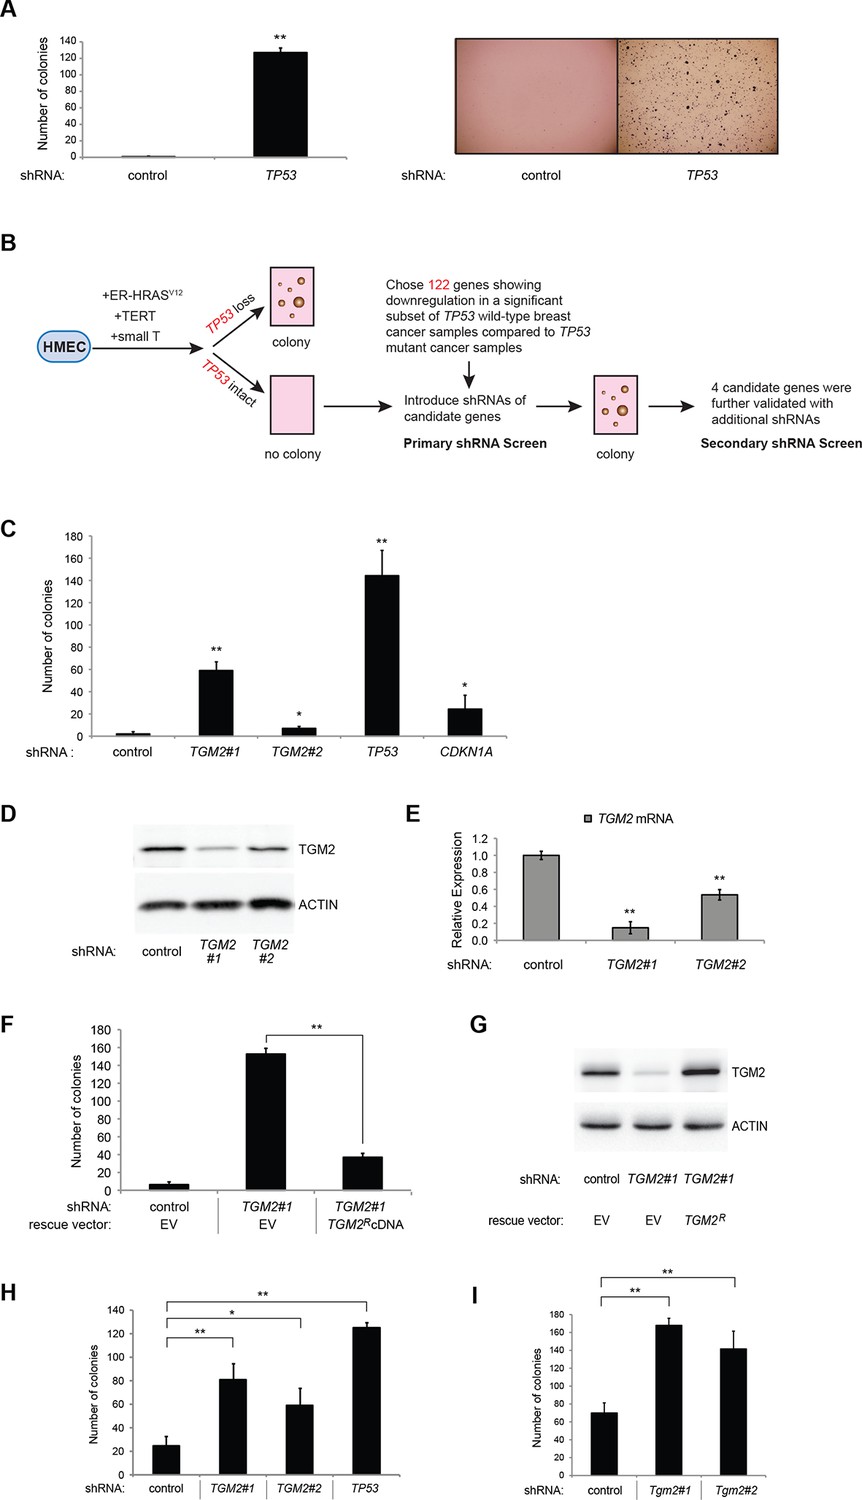
TGM2 suppresses transformation of primary human mammary epithelial cells in soft agar.
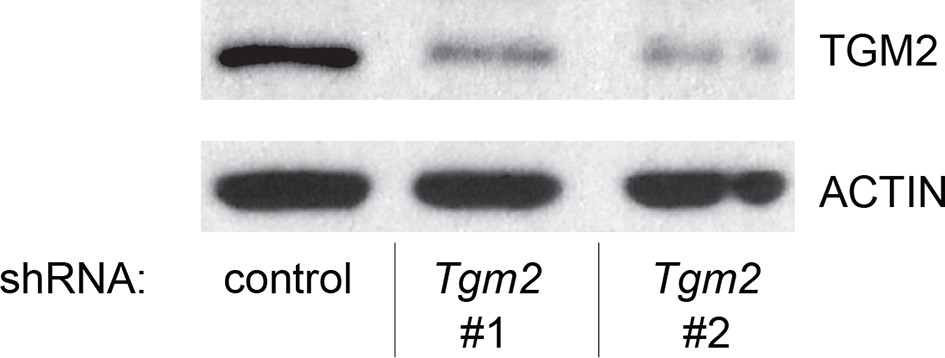
(A) HMECTERT/ST/ER-RasV12 cells were transduced with retroviral vectors encoding control or TP53 shRNAs and plated in soft agar in medium with 4-OHT (to activate RasV12). Growth supplements (EGF, insulin, hydrocortisone) were withheld for the first 3 days. Results (left panel) shown are the average colony number ± SD in biological triplicates. Representative MTT-stained colonies are shown in the right panel. (**p<0.01 compared to control cells, student’s t-test) (B) Flow diagram for the shRNA screen. The candidate gene list of 122 genes is selected by comparing genes with lower expression in a significant number of TP53 wild-type tumor samples versus TP53 mutant tumor samples using expression array (GSE3494) consisting of 251 breast cancer samples with TP53 mutation status, followed by designing and cloning of shRNAs against the genes. These genes could be under selective pressure to lose expression only in TP53 wild-type tumors, thus could be potential members of the TP53 pathway. HMECTERT/ST/ER-RasV12 cells were generated by overexpressing TERT, SV40 small T antigen and ER-HRASV12. The shRNAs against the candidate genes were introduced into the cells and observed for colony formation in soft agar in the primary and secondary screen. (C) Soft agar analysis for HMECTERT/ST/ER-RasV12 cells expressing control, TGM2- (denoted as TGM2#1 or TGM2#2), TP53-, or CDKN1A- shRNAs using the conditions described in (B). Quantification shows average colony number ± SD in biological triplicates. (*p<0.05; **p<0.01 compared to control cells, student’s t-test) (D) Knockdown efficiency of TGM2 with two independent shRNAs. TGM2 protein expression was analyzed by Western blotting. β-ACTIN serves as the loading control. (E) TGM2 mRNA expression was quantified by qPCR, normalized to TBP expression and to control vector in biological triplicates, and represented as the average fold change ± SD. (**p<0.01 compared to control cells, student’s t-test) (F) Soft agar assay analysis of HMECTERT/ST/ER-RasV12 cells transduced with a retrovirus expressing mCherry with either control or TGM2#1 shRNAs. The populations were verified to have more than 70% mCherry positive cells, and additionally transduced and selected to express an empty vector (EV) or a shRNA-resistant TGM2 cDNA (TGM2RcDNA) by retroviruses. Quantification shows average colony number ± SD in biological triplicates. (**p<0.01, student’s t-test) (G) Western blot analysis of TGM2 protein expression for (F). β-ACTIN serves as the loading control. (EV, Empty Vector) (H) Soft agar assay analysis of BJTERT/ST/ER-RasV12/shp16 cells transduced with a retrovirus expressing control, TGM2-, or TP53- shRNA. Quantification shows average colony number ± SD in biological triplicates. (*p<0.05; **p<0.01, compared to control cells, student’s t-test) (I) Soft agar assay analysis of NIH 3T3ER-RasV12 cells transduced with a retrovirus expressing control or Tgm2-shRNAs. Quantification shows average colony number ± SD in biological triplicates. (**p<0.01 compared to control cells, student’s t-test).
Figure 1—figure supplement 1

The effect of TP53 on colony formation in HMECTERT/ST/ER-RasV12 cells in the presence of EGF, insulin, and hydrocortisone.
Soft agar assay analysis of HMECTERT/ST/ER-RasV12 cells transduced with retroviral vectors encoding control or TP53 shRNAs. Cells were plated in soft agar in medium containing growth supplements (EGF, insulin, hydrocortisone) and 4-OHT (to activate RasV12). Results (left panel) shown are the average colony number ± SD in biological triplicates. Representative MTT-stained colonies are shown in the right panel. (ns: not significant, student’s t-test)
Figure 1—figure supplement 2
Knockdown efficiency of TP53 shRNA.
Western blot analysis corresponding to Figure 1—figure supplement 1 to assess the knockdown efficiency of TP53 shRNA. β-ACTIN serves as the loading control.
Figure 1—figure supplement 3

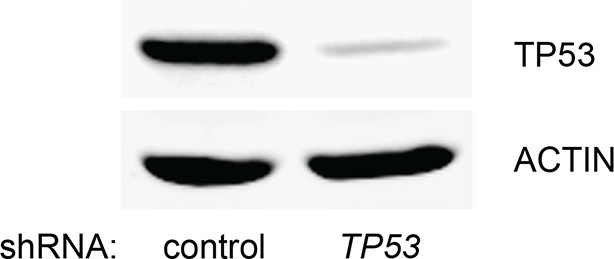
Knockdown efficiency of TP53 shRNA for Figure 1A.
Western blot analysis corresponding to Figure 1A to assess the knockdown efficiency of TP53 shRNA. β-ACTIN serves as the loading control.
Figure 1—figure supplement 4
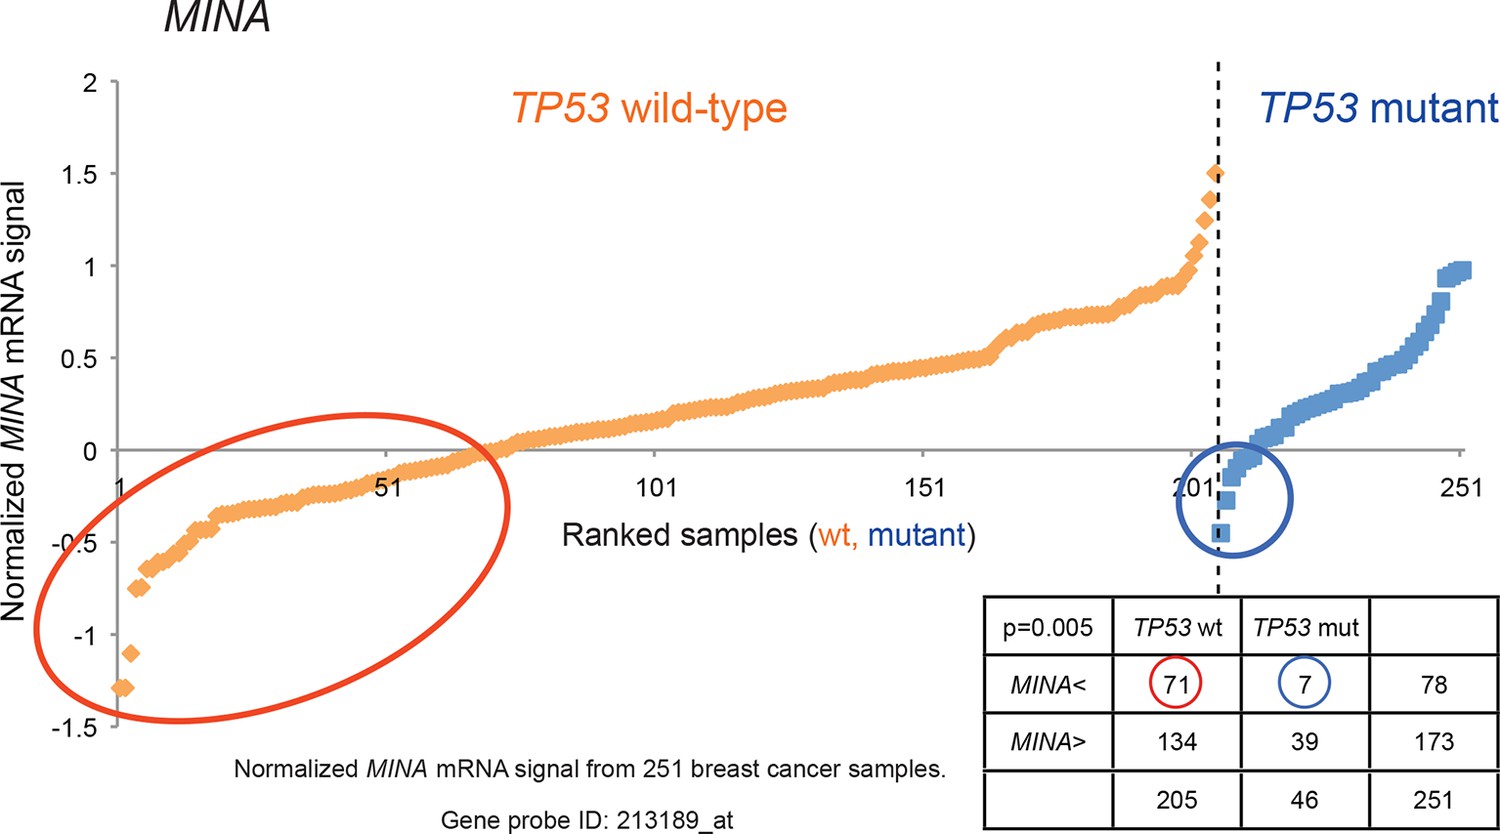
Generating the candidate gene list for screening.
By utilizing a publicly available breast cancer dataset (GSE3494), a chi-square test was used to identify genes with an asymmetric distribution in breast tumors with ‘low’ expression (lowest = 0, highest = 1) in 205 TP53 wild-type samples and 46 TP53-mutant samples. The cut-off level was determined at the average minus one standard deviation cut-off (horizontal axis). A total of 122 genes with lower expression in a significant number of TP53 wild-type samples compared to TP53 mutant samples were selected based on their χ2 p values (p<0.01). MINA was selected as one of the genes in the candidate list and its normalized mRNA signal is shown as an example.
Figure 1—figure supplement 5
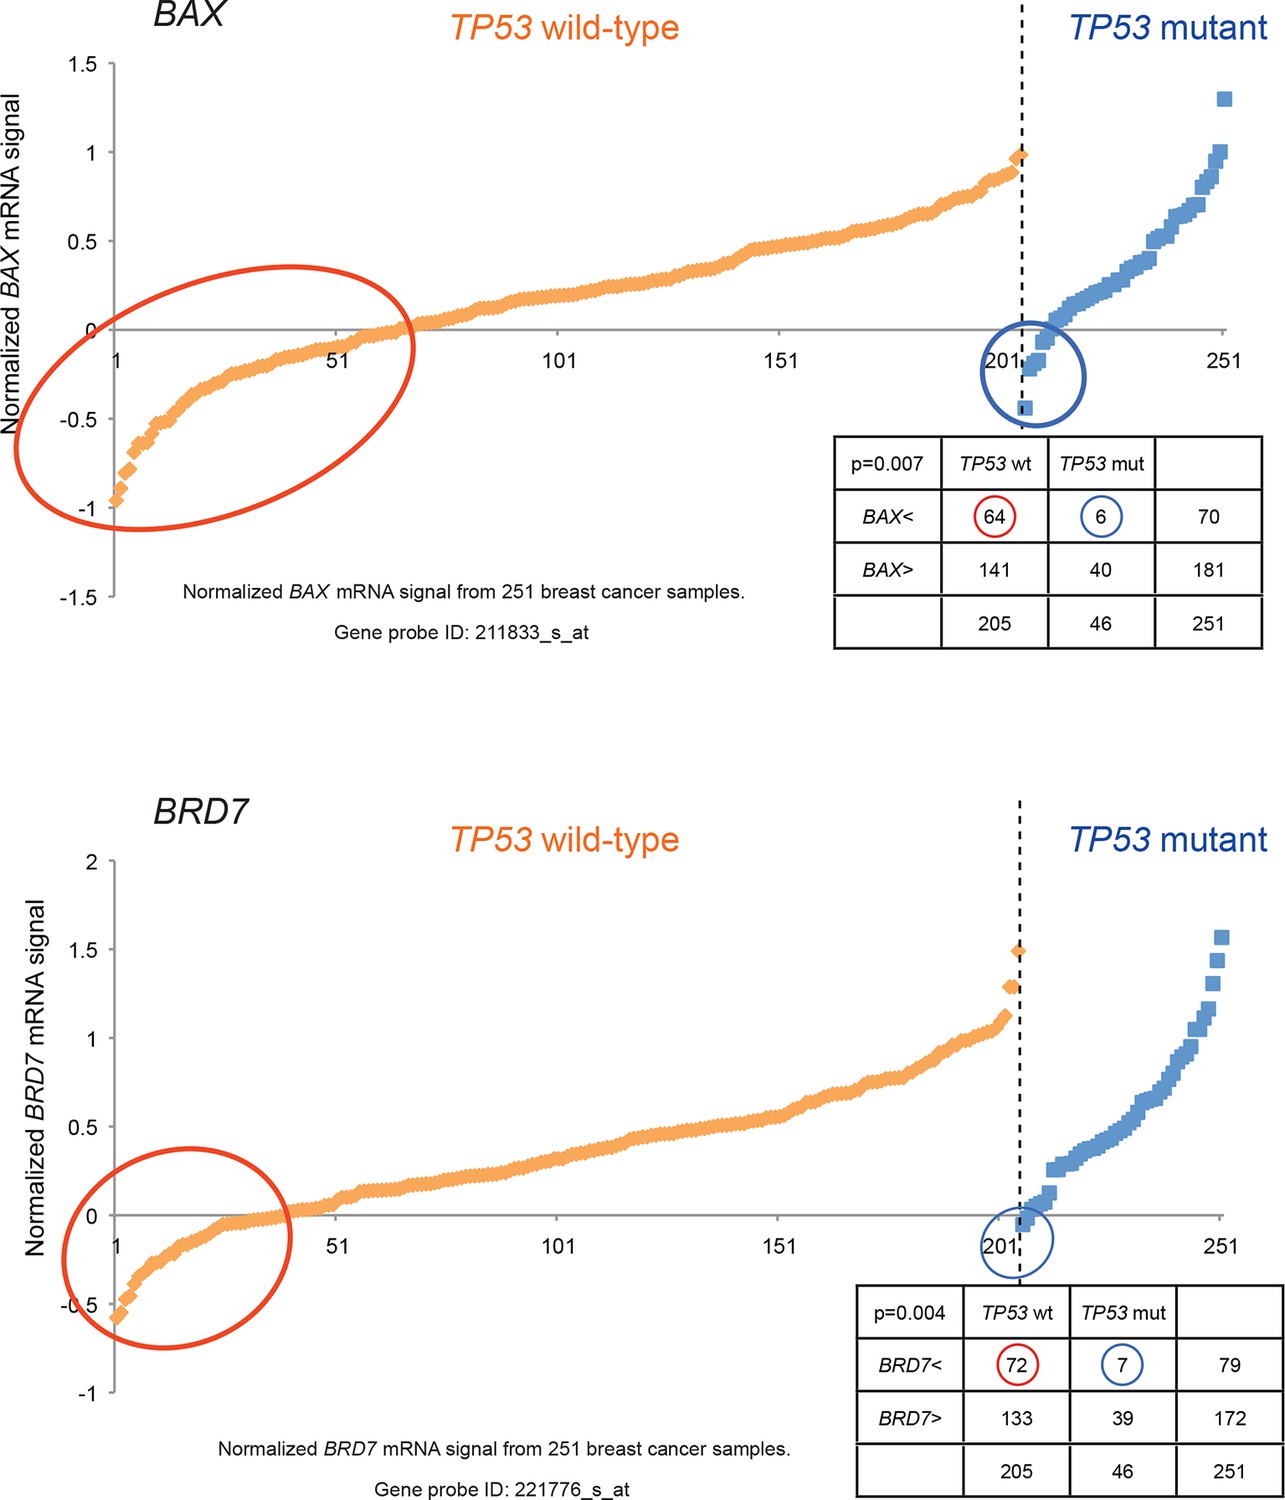
Generating the candidate gene list for screening.
Known TP53 downstream target genes, BAX, and transcriptional cofactor of TP53, BRD7, were also in the candidate list and downregulated in a subset of TP53 wild-type tumors relative to TP53 mutant tumors by chi-square analysis (p<0.01).
Figure 1—figure supplement 6
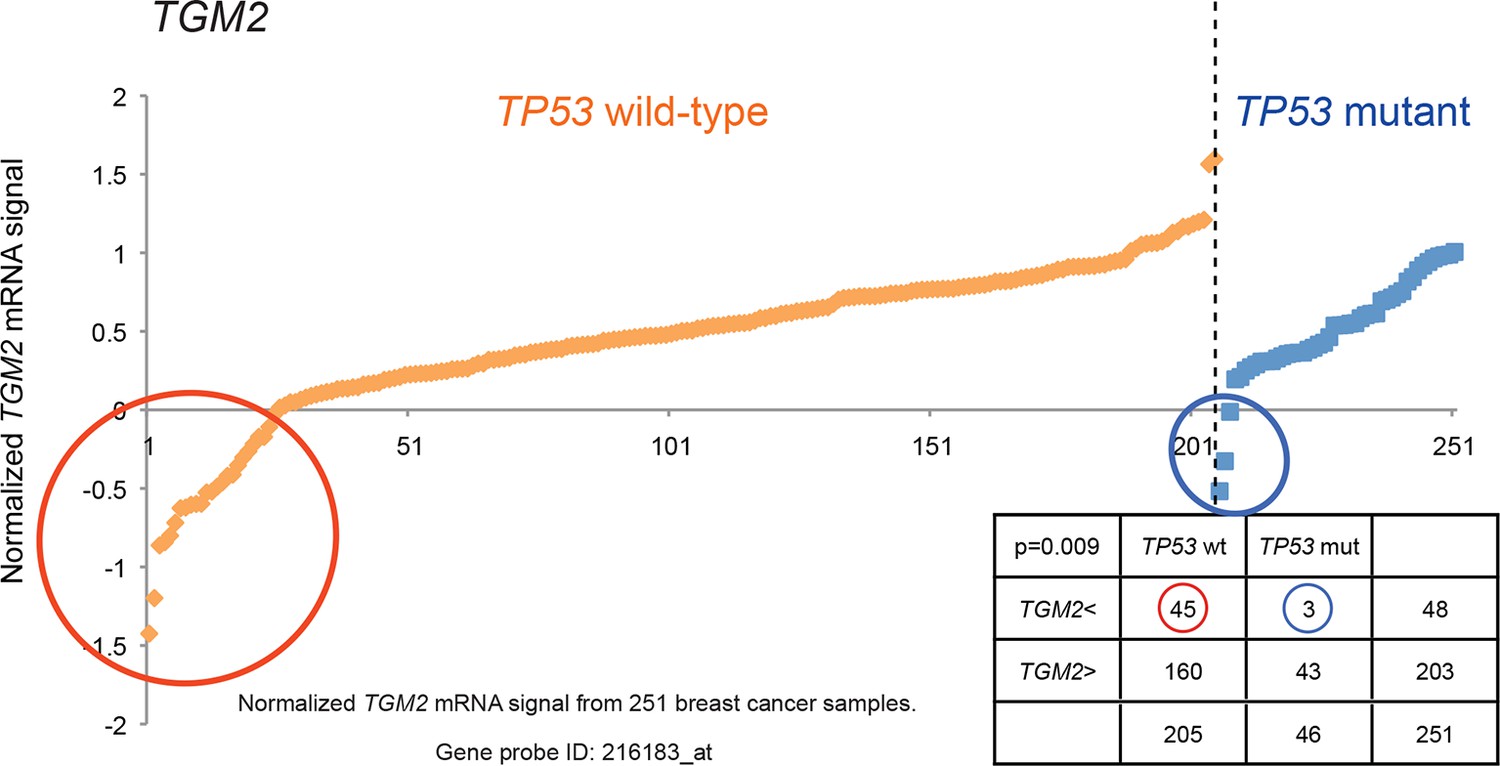
Generating the candidate gene list for screening.
TGM2 expression analysis is shown to illustrate lower expression in a subset of TP53 wild-type tumors compared to TP53 mutant tumors by chi-square analysis (p<0.01)
Figure 1—figure supplement 7
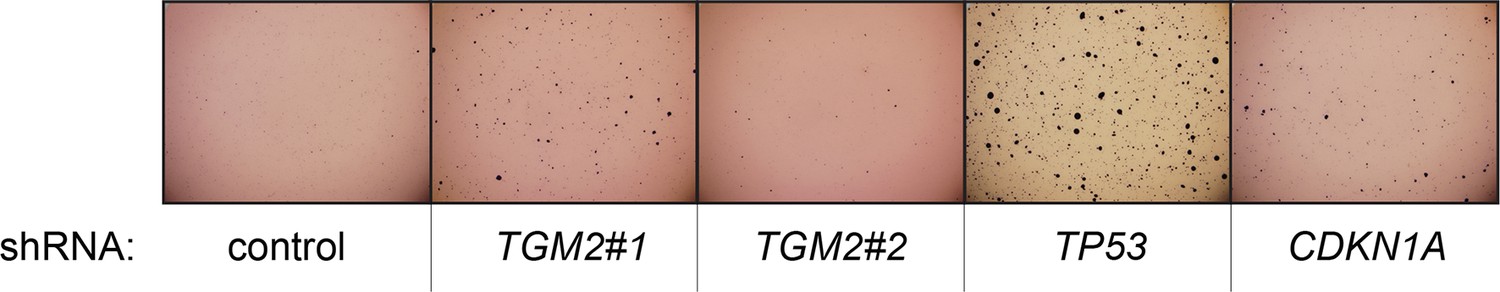
Pictures of soft agar assay for Figure 1C.
Representative MTT-stained colonies corresponding to Figure 1C are shown.
Figure 1—figure supplement 8
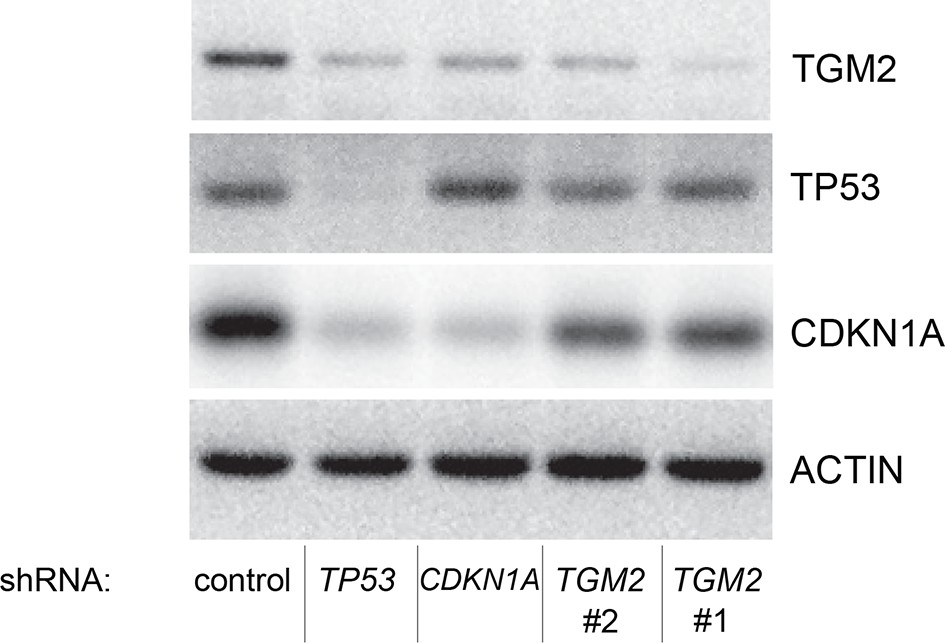
Protein expression for Figure 1C.
Western blot of TGM2, CDKN1A and TP53 corresponding to Figure 1C. β-ACTIN serves as the loading control.
Figure 1—figure supplement 9
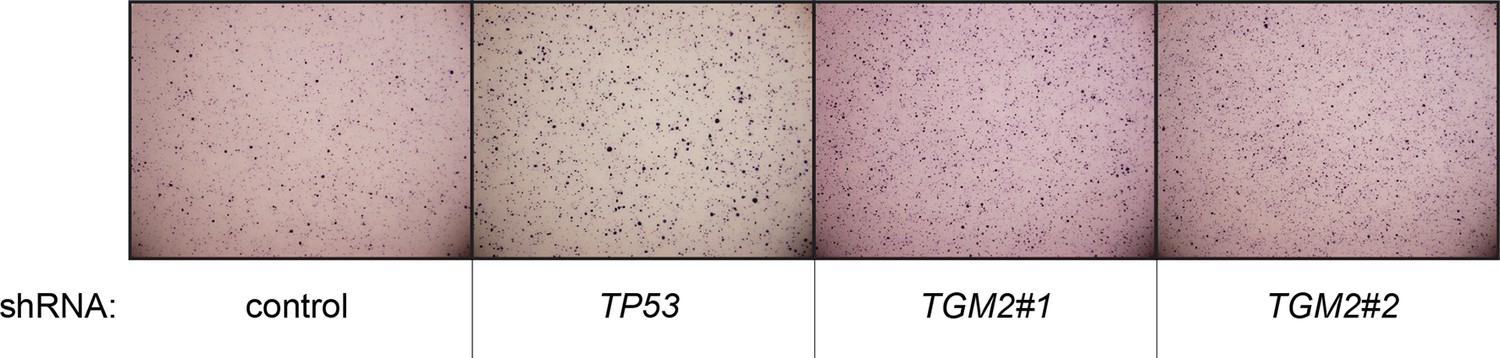
Pictures of soft agar assay for Figure 1H.
Representative MTT-stained colonies corresponding to Figure 1H are shown.
Figure 1—figure supplement 10

Protein expression for Figure 1H.
Western blot of TGM2 and TP53 corresponding to Figure 1H. β-ACTIN serves as the loading control.
Figure 1—figure supplement 11

Pictures of soft agar assay for Figure 1I.
Representative MTT-stained colonies corresponding to Figure 1I are shown.
Figure 1—figure supplement 12
Protein expression for Figure 1I.
Western blot of TGM2 corresponding to Figure 1I. β-ACTIN serves as the loading control.
Figure 2

TGM2 expression is dependent on TP53.
(A) qRT-PCR analysis of the effect of control or TGM2 shRNAs (denoted respectively as control and TGM2#1) on mRNA expression of either TP53, CDKN1A, MDM2, or TGM2 in HMECTERT/ST/ER-RasV12 cells. The levels of mRNA were normalized to TBP expression and to control cells. The data indicate the average ± SD of biological triplicates. (**p<0.01, student’s t-test to control cells) (B) Western blot analysis of HMECTERT/ST/ER-RasV12 cells stably transduced with retroviruses expressing control or TP53 shRNAs. β-ACTIN serves as the loading control. (C) qRT-PCR analysis of the cells in (B). The levels of TGM2 mRNA were normalized to TBP expression and to control cells. The data indicate the average ± SD of biological triplicates. (**p<0.01, student’s t-test to control cells) (D) Western blot analysis of HMECTERT/ST/ER-RasV12 cells stably transduced with a retrovirus expressing mCherry with either control or TP53 shRNAs. The populations were verified to have more than 70% mCherry positive cells, and then retrovirally-transduced and selected to express an empty vector or a 6x His-tag TP53 shRNA-resistant overexpression vector (His-tag TP53RcDNA). β-ACTIN serves as the loading control. (EV, Empty Vector) (E) qRT-PCR analysis of cells in (D) for TGM2 mRNA normalized to TBP expression and to control cells. The data indicate the average ± SD of biological triplicates. (*p<0.05; **p<0.01, student’s t-test) (F) qRT-PCR analysis of BJTERT/ST/ER-RasV12/shp16 cells stably transduced with retroviruses expressing control or TP53 shRNAs. The levels of mRNA were normalized to TBP expression and to control cells. The data indicate the average ± SD of biological triplicates. (**p<0.01, student’s t-test to control cells) (G) qRT-PCR analysis of wild-type and Tp53-/- MEFs. The levels of mRNA were normalized to Gapdh expression and to control cells. The data indicate the average ± SD of biological triplicates. (**p<0.01, student’s t-test to control cells).
Figure 3 with 2 supplements
TGM2 is a potential target gene of TP53.
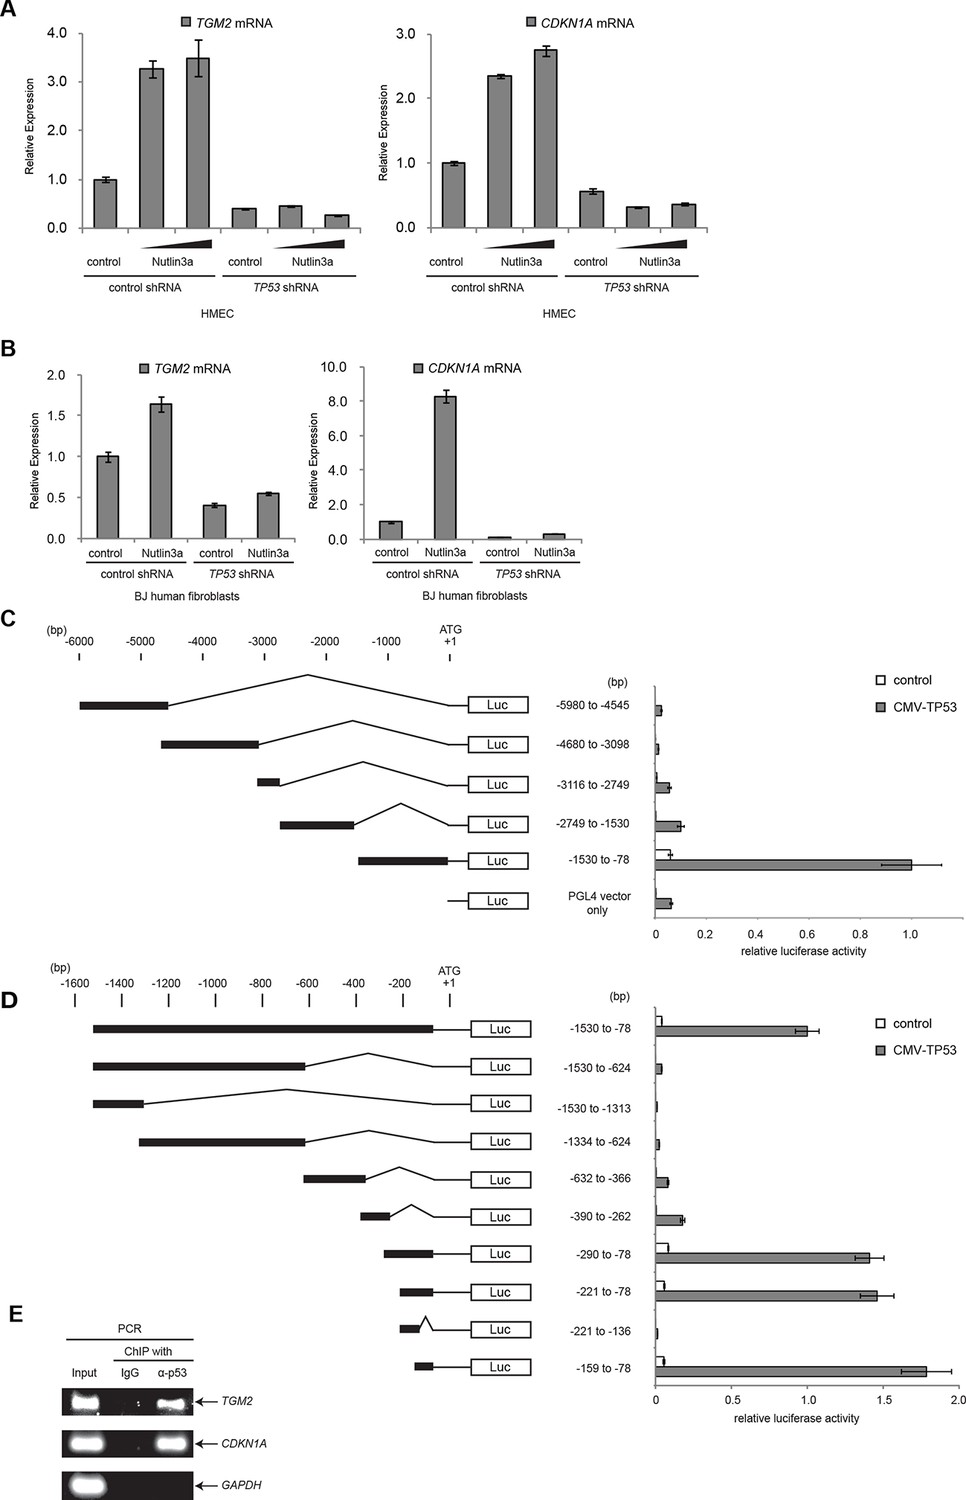
(A) qRT-PCR analysis of HMECTERT/ST/ER-RasV12 cells stably transduced with retroviruses expressing control or TP53 shRNAs. Cells were treated with Nutlin-3a (5 µM or 10 µM) for 2 days. The levels of mRNA were normalized to TBP expression and to control cells. CDKN1A is used as the positive control to see TP53 activation. The data indicate the average ± SD of biological triplicates. (B) qRT-PCR analysis of BJTERT/ST/ER-RasV12/shp16 cells stably transduced with retroviruses expressing control or TP53 shRNAs. Cells were treated with Nutlin-3a (10 µM) for 2 days. The levels of mRNA were normalized to TBP expression and to control cells. CDKN1A is used as the positive control to see TP53 activation. The data indicate the average ± SD of biological triplicates. (C and D) Luciferase reporter assays using a series of promoter deletion mutants of the TGM2 gene. The number (bp) indicates the position relative to the translational start site (ATG). Reporter plasmids containing the indicated deletion constructs were transfected into H1299 cells with control or TP53 plasmid, and luciferase activity was monitored. The average value of the luciferase activity from the cells transfected with CMV-TP53 and the reporter plasmid containing TGM2 (-1530 to -78) promoter fragment is set at 1, and the relative activity is shown. The data indicate the average ± SD of biological triplicates. (E) TP53 binds to the TGM2 promoter. ChIP assay was performed with an antibody detecting endogenous TP53, or IgG (negative control) using HMECTERT/ST/ER-RasV12 cells. The potential TP53 response element in the TGM2 promoter identified in (D) was analyzed by PCR. CDKN1A and GAPDH are served as the positive and negative control respectively.
Figure 3—figure supplement 1
Luciferase reporter assays of TGM2 promoter.
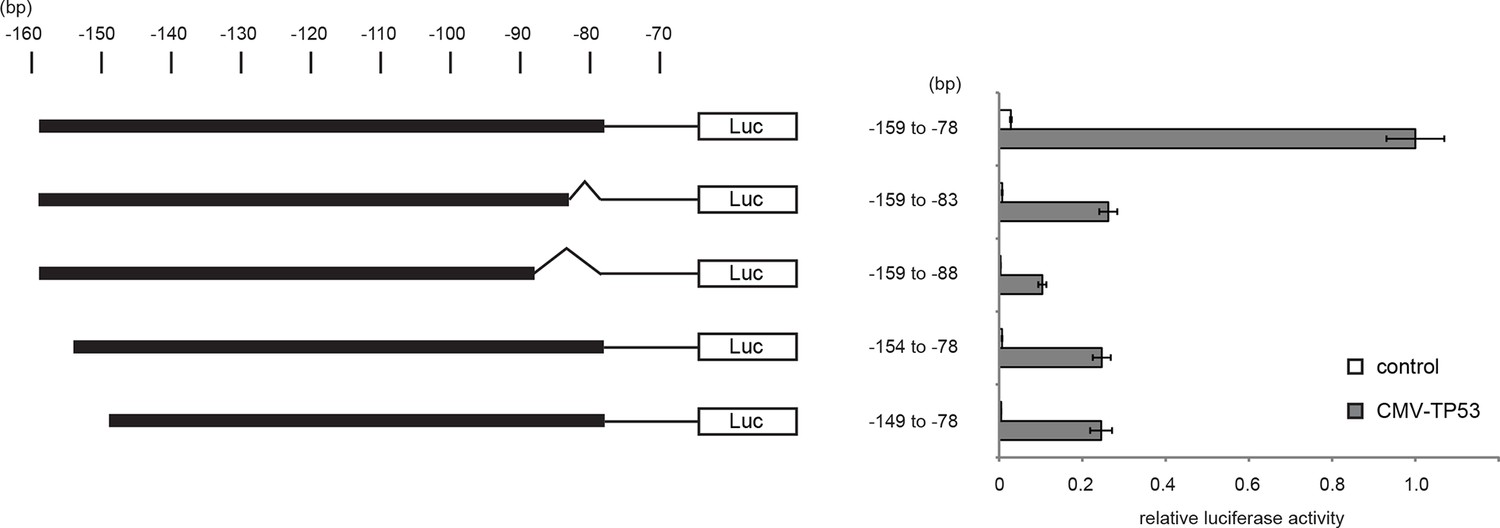
Luciferase reporter assays using a series of promoter deletion mutants of the TGM2 gene. The number (bp) indicates the position relative to the translational start site (ATG). Reporter plasmids containing indicated deletion constructs were transfected into H1299 cells with control or TP53 plasmid, and luciferase activity was monitored. The average value of the luciferase activity from the cells transfected with CMV-TP53 and the reporter plasmid containing TGM2 (-159 to -78) promoter fragment is set at 1, and the relative activity is shown. The data indicate the average ± SD of biological triplicates.
Figure 3—figure supplement 2

Diagram of the TGM2 promoter region.
The genomic sequence and location of 82 bp fragment required and sufficient for TP53-mediated transactivation is shown. Chromosome coordinates are given according to GRCh38/hg38 Human Genome Reference. The sequence and location of the primers used for ChIP analysis are also shown (the position is indicated by the arrow). Genbank accession number (NM_004613.2) of TGM2 mRNA is shown. The TGM2 gene structure, TP53 responsive element, and primers were drawn proportionally to their sizes. The location of the primers for ChIP analysis were chosen to avoid the difficulty of amplifying the highly GC-rich region on the TGM2 promoter to increase the sensitivity of the ChIP analysis.
Figure 4 with 1 supplement
Absence of growth supplements induces TP53-dependent autophagy.
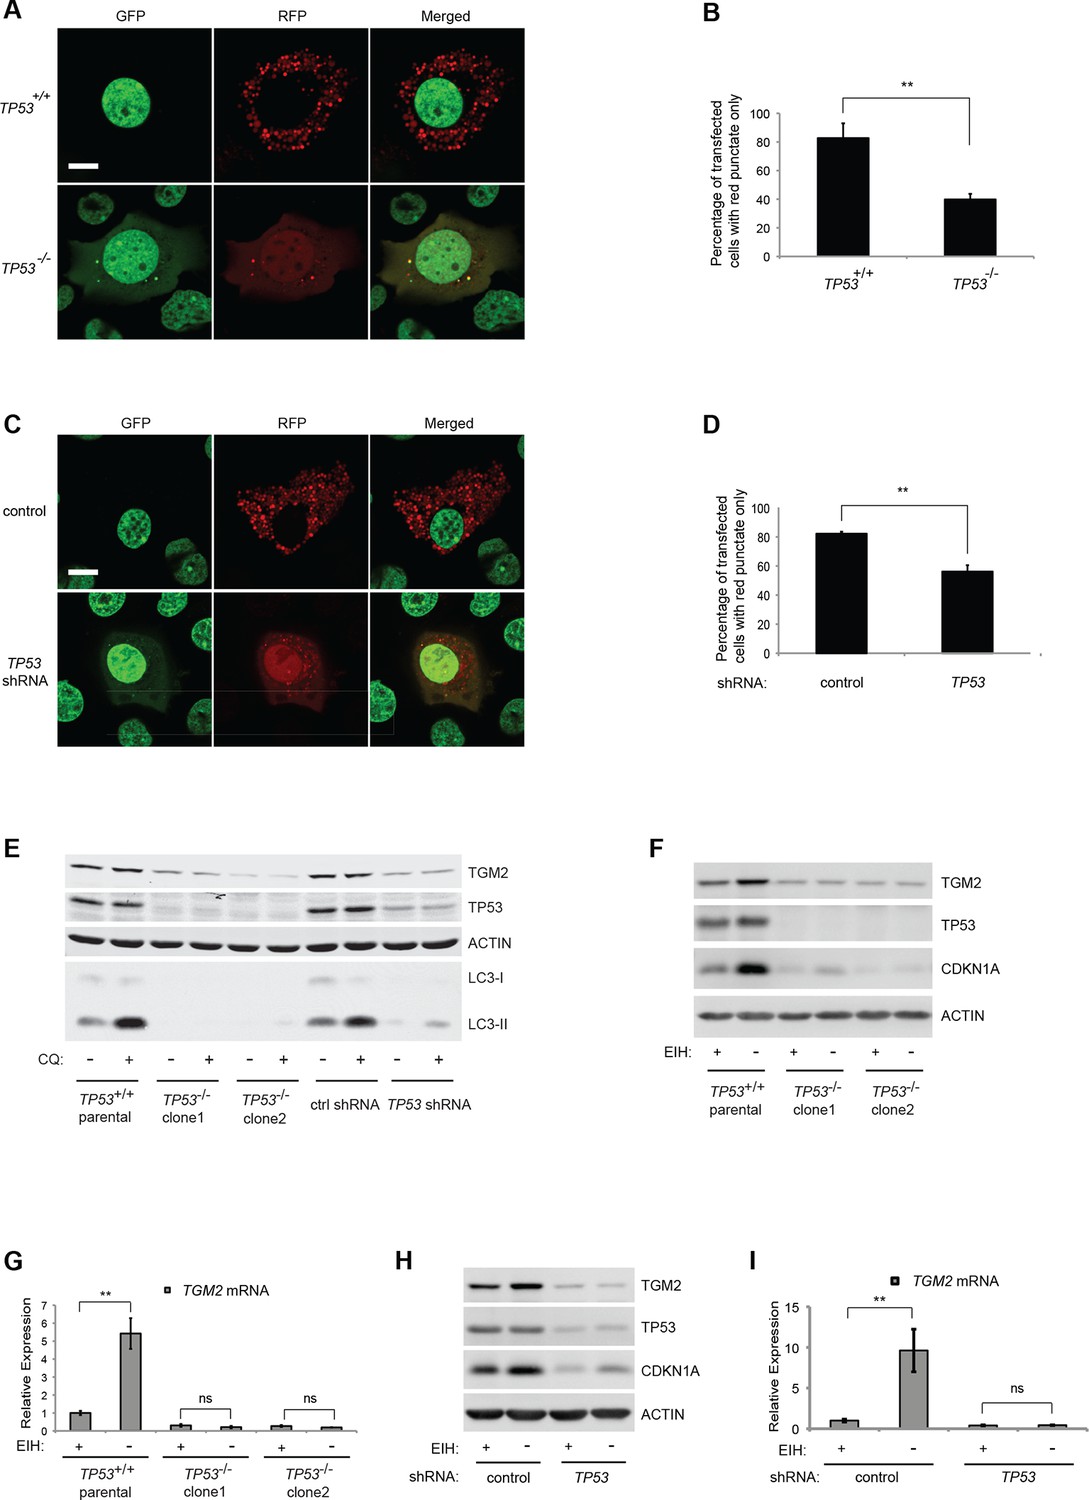
(A) Formation of red punctae following autophagy induction in the absence of growth supplements. HMECTERT/ST/ER-RasV12 cells (TP53+/+) or TP53 CRISPR knockout HMECTERT/ST/ER-RasV12 cells (TP53-/-) cells were transfected with the plasmid RFP-GFP-LC3. Cells were incubated in medium without EGF, insulin, and hydrocortisone for 24 hr before visualization on a confocal microscope. Scale bar: 5 μm (B) Quantification of the fraction of red punctate cells within the total population of transfected cells shown in (A). Red punctate cells were counted as cells containing only RFP signal without visible overlap of GFP signal in the cytoplasm; transfected cells were counted as cells containing either RFP signals or a mix of RFP and GFP signals in the cytoplasm (>250 cells were counted). (**p<0.01, student’s t-test) (C) Control or TP53 knockdown (TP53 shRNA) HMECTERT/ST/ER-RasV12 cells were seeded, treated and visualized as in (A). (D) Quantification of the fraction of red punctate cells within the total population of transfected cells shown in (C), treated as in (B). (**p<0.01, student’s t-test) (E) Western blot analysis of TP53+/+ cells, TP53-/- CRISPR knockout HMECTERT/ST/ER-RasV12 clones, as well as control and TP53 shRNA cells treated with or without chloroquine (CQ, 50 μM, 2 hr) after incubation in medium without EGF, insulin, and hydrocortisone for 24 hr. β-ACTIN serves as the loading control. (F) Western blot analysis of HMECTERT/ST/ER-RasV12 cells and two independent TP53 CRISPR knockout HMECTERT/ST/ER-RasV12 clones. Cells were incubated in medium in the presence or absence of EGF, insulin, and hydrocortisone (denoted as EIH) for 48 hr. β-ACTIN serves as the loading control. (G) qRT-PCR analysis of cells in (F). TGM2 mRNA expression was normalized to TBP mRNA expression. The mean value of TGM2 mRNA expression in TP53+/+ cells with presence of EIH is set at 1, and relative expression is shown. (**p<0.01, ns: not significant, student’s t-test) (H) Western blot analysis of HMECTERT/ST/ER-RasV12 cells expressing either control or TP53 shRNA. Cells were treated the same as in (F). (I) qRT-PCR analysis of cells in (H). Data are shown as in (G).
Figure 4—figure supplement 1
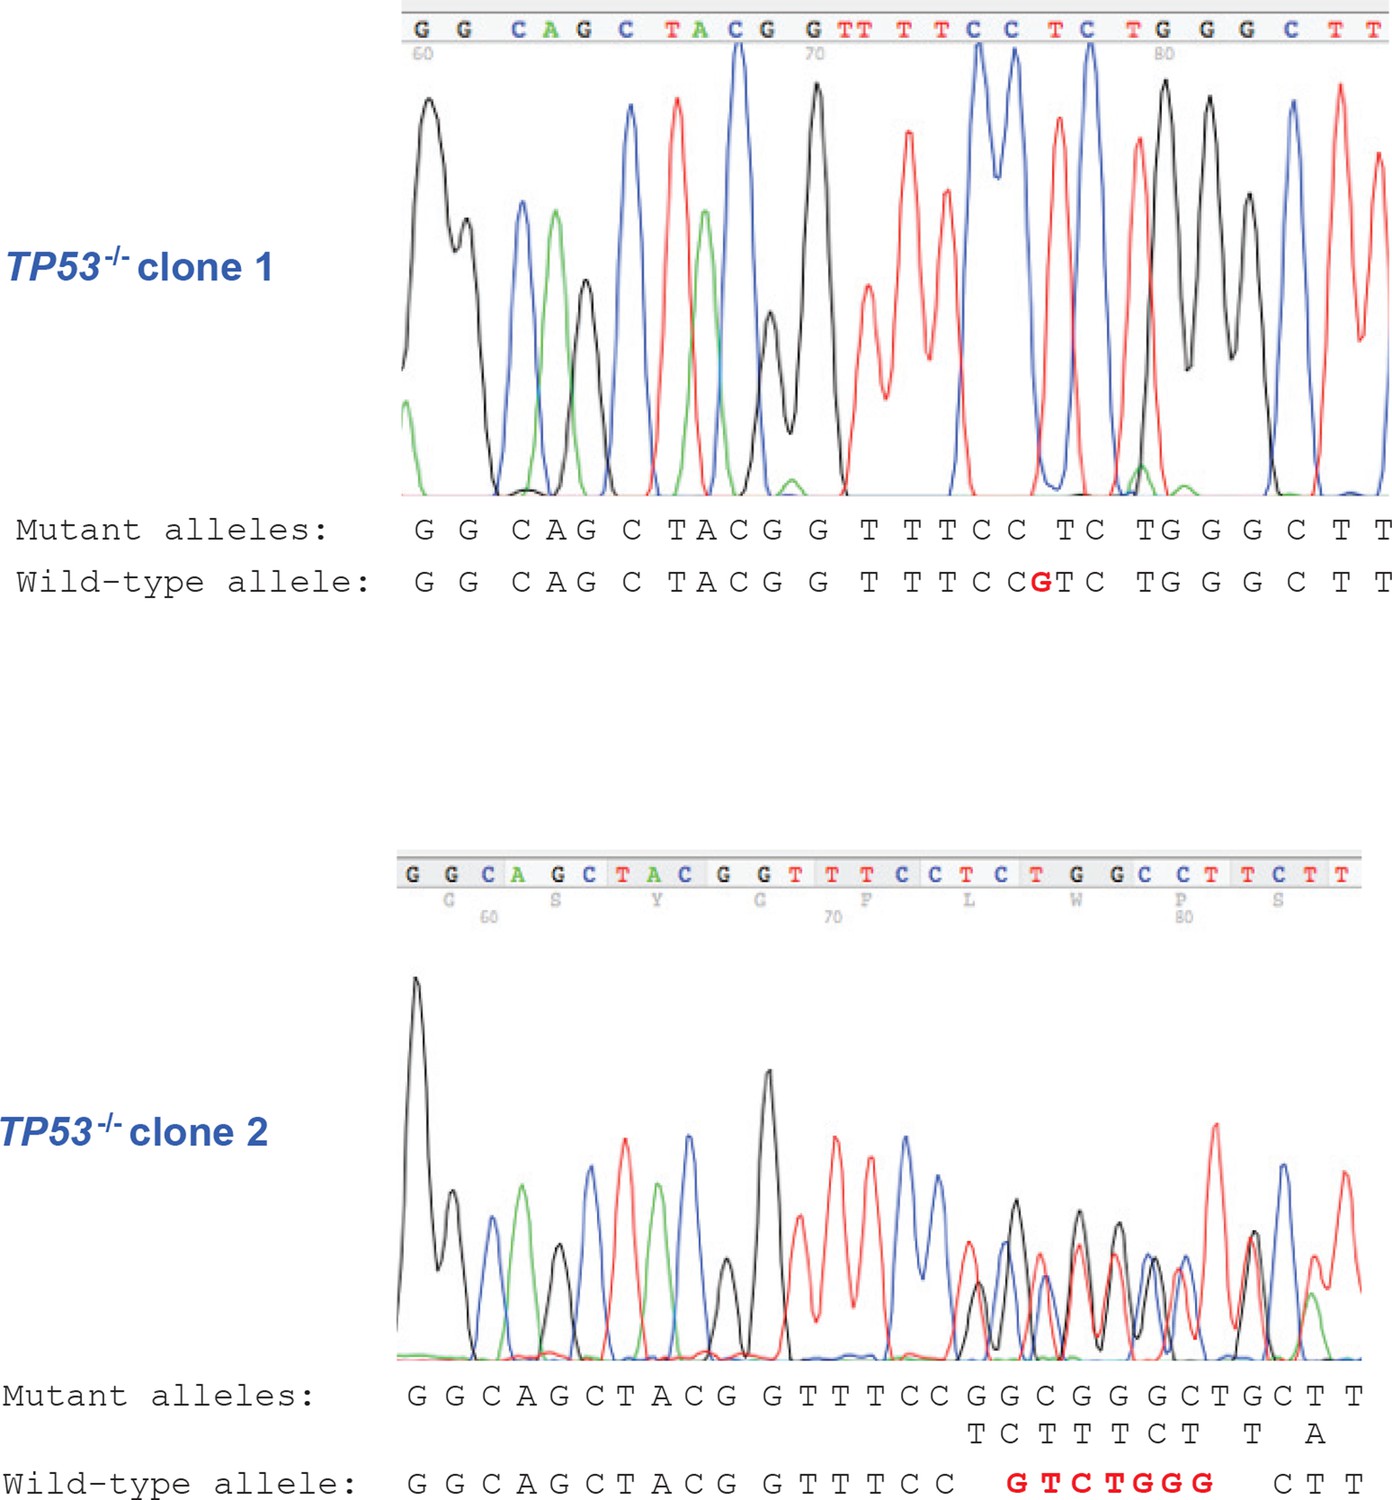
DNA sequencing of TP53-/- clones.
DNA sequencing result of TP53-/- clones showing frameshift mutations in exon 4 of TP53 gene for CRISPR TP53 knockout HMECTERT/ST/ER-RasV12 (TP53-/-) clone 1 and clone 2.
Figure 5
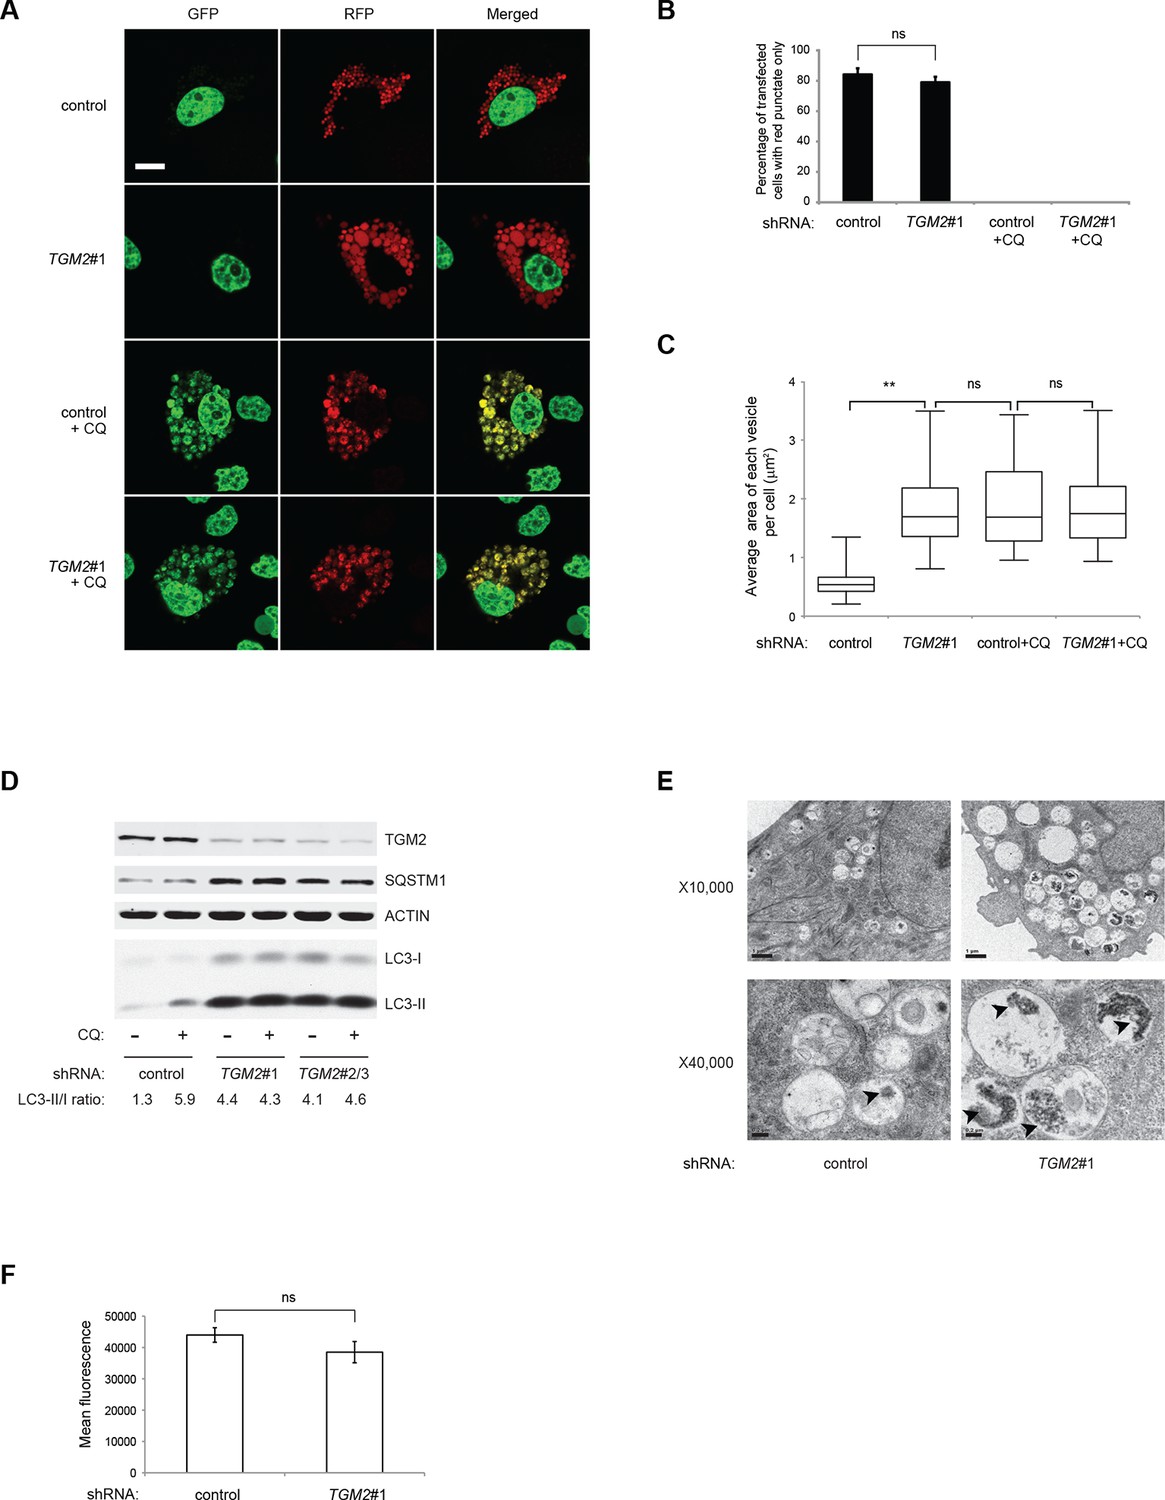
Loss of TGM2 expression inhibits autophagic protein degradation and autolysosome clearance.
(A) Formation of red punctae following autophagy induction in the absence of growth supplements. HMECTERT/ST/ER-RasV12 cells (control) and TGM2 shRNA cells (TGM2#1) were transfected with the plasmid RFP-GFP-LC3. Cells were incubated in medium without EGF, insulin, and hydrocortisone with or without chloroquine (20 µM) for 24 hr before visualization on confocal microscope. Scale bar: 5 μm (B) Quantification of fraction of cells showing only red punctate within the total population of transfected cells in (A). Cells were categorized and counted as in Figure 4B (>250 cells counted). (ns: not significant, student’s t-test) (C) Quantification of puntate size in control and TGM2 shRNA (TGM2#1) cells with and without chloroquine treatment. Average area of each vesicle per cell in (A) was analyzed by Image J software and represented as box plot. (**p<0.01, ns: not significant, student’s t-test) (D) Western blot analysis of HMECTERT/ST/ER-RasV12 cells expressing control and TGM2 shRNA using independent hairpins (TGM2#1 and double hairpins TGM2#2/3) treated with or without chloroquine (CQ, 50 μM, 2 hr) after incubation in medium without EGF, insulin, and hydrocortisone for 24 hr. Note that for TGM2#2/3, cells were generated by transducing with retrovirus carrying TGM2#2 and TGM2#3 shRNAs to achieve similar knock-down efficiency to TGM2 shRNA#1. β-ACTIN serves as the loading control. (E) Transmission electron microscopy images for control and TGM2 shRNA (TGM2#1) cells. Cells were incubated without EGF, Insulin, and hydrocortisone for 24 hr before fixing and imaging. The higher magnification micrograph (x40,000) shows presence of undigested protein aggregates (arrowheads) in autophagic vesicles. Lower magnification was set at x10,000. Scale bar: 1 μm at x10,000 and 0.2 μm at x40,000. (F) Flow cytometry analysis of cells stained with lysotracker after incubation in media without EGF, insulin, and hydrocortisone for 24 hr. The mean fluorescence intensity of control and TGM2 shRNA (TGM2#1) cells was quantified by Flowjo software. The data indicate the mean ± SD of biological triplicates. (ns: not significant, student’s t-test).
Figure 6 with 13 supplements

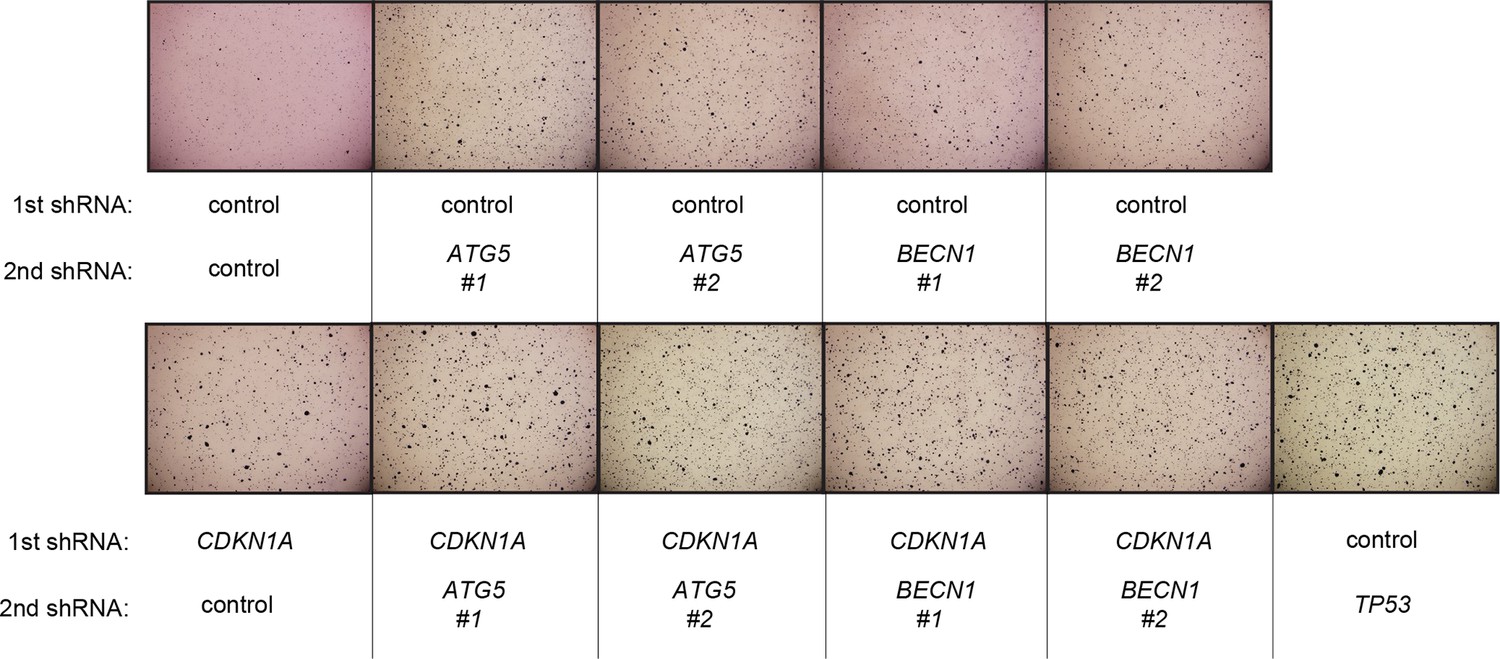
Loss of TGM2 expression synergizes with loss of CDKN1A to promote the transformation of HMECTERT/ST/ER-RasV12 cells.
(A) Soft agar assay analysis of HMECTERT/ST/ER-RasV12 cells transduced with a retrovirus expressing mCherry with either control, CDKN1A or TP53 shRNAs. The populations were verified to have more than 70% mCherry positive cells. The cells were then additionally transduced with the indicated shRNA constructs, selected with 4 µg/ml of blasticidin, and evaluated by soft agar assay analysis. The results shown are the average colony number ± SD from biological triplicates. (*p<0.05, ns: not significant, student’s t-test) (B) Formation of tumors in NOD/SCID mice. 500,000 HMECTERT/ST/RasV12 cells transduced with the indicated vectors were injected subcutaneously in mice (n=6). (Top) The number of tumors observed after 4- and 6-weeks from the time of injection. (Bottom) Pictures of tumors excised 4 weeks after injection. (C and D) HMECTERT/ST/ER-RasV12 cells were transduced with a retrovirus expressing mCherry with either control or CDKN1A shRNAs. The populations were verified to have more than 70% mCherry positive cells. The cells were then additionally transduced with the indicated shRNA constructs, selected with 4 µg/ml of blasticidin, and evaluated by soft agar assay analysis. The results shown are the average colony number ± SD from biological triplicates. (*p<0.05, **p<0.01, ns: not significant, student’s t-test) (E and F) HMECTERT/ST/ER-RasV12 cells were transduced with a retrovirus expressing mCherry with either control or TGM2 (TGM2#1) shRNAs. The populations were verified to have more than 70% mCherry positive cells. The cells were then additionally transduced with the indicated shRNA constructs, selected with 4 µg/ml of blasticidin, and evaluated by soft agar assay analysis. The results shown are the average colony number ± SD from biological triplicates. (*p<0.05, ns: not significant, student’s t-test). (G) Western blot analysis of HMECTERT/ST/ER-RasV12 cells treated with TGM2 inhibitors. The cells were incubated in medium without EGF, insulin, and hydrocortisone in the presence of Z-DON (50 µM) or LDN 27219 (10 µM) for 24 hr. β-ACTIN serves as the loading control. (H) Soft agar assay analysis of HMECTERT/ST/ER-RasV12 cells transduced with a retrovirus expressing mCherry with either control or TGM2 (TGM2#1) shRNAs. The populations were verified to have more than 70% mCherry positive cells, and additionally transduced and selected with 4 µg/ml of blasticidin to express an empty vector (EV) or a TGM2 cDNA resistant to TGM2 shRNA wild-type (WT), C277S, or R580A mutants (denoted as TGM2 WTR, TGM2 C277SR, or TGM2 R580AR cDNA) by retroviruses. Quantification shows average colony number ± SD in biological triplicates. (**p<0.01, *p<0.05, ns: not significant, student’s t-test).
Figure 6—figure supplement 1

Pictures of soft agar assay for Figure 6A.
Representative MTT-stained colonies corresponding to Figure 6A are shown.
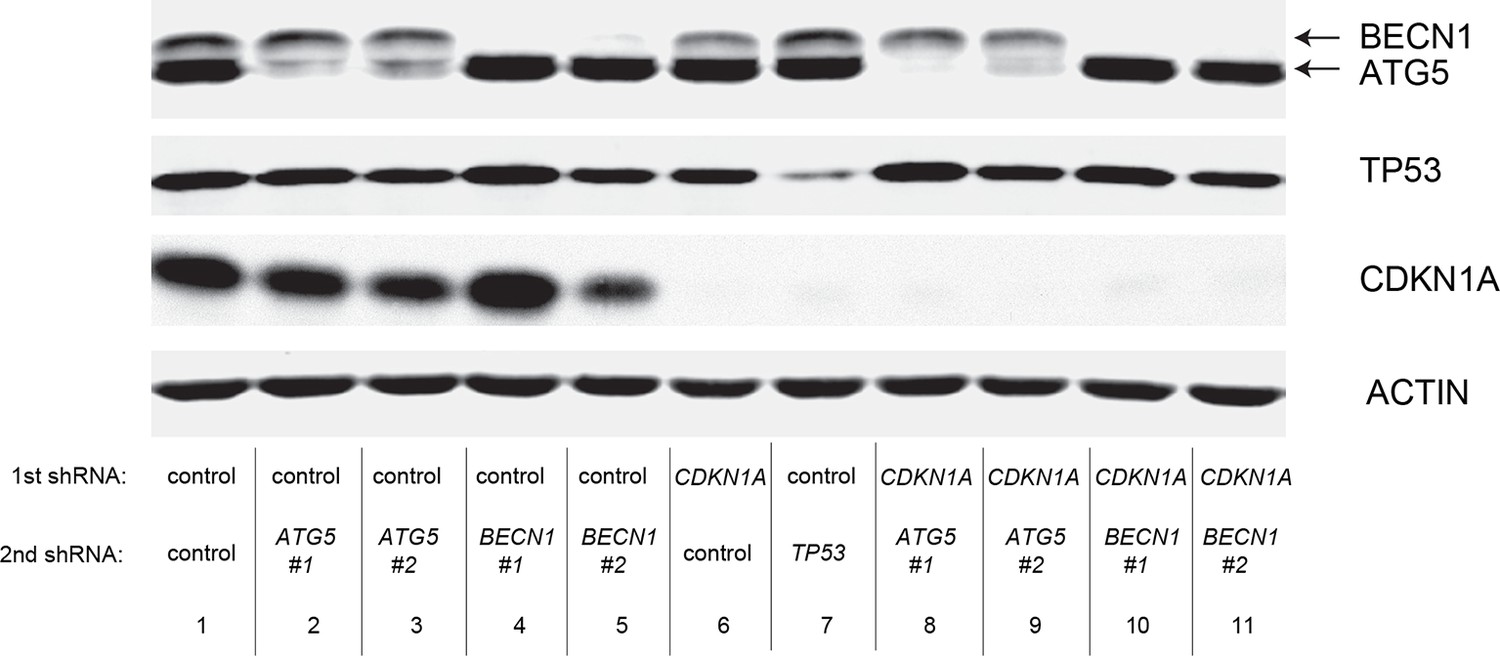
Figure 6—figure supplement 2
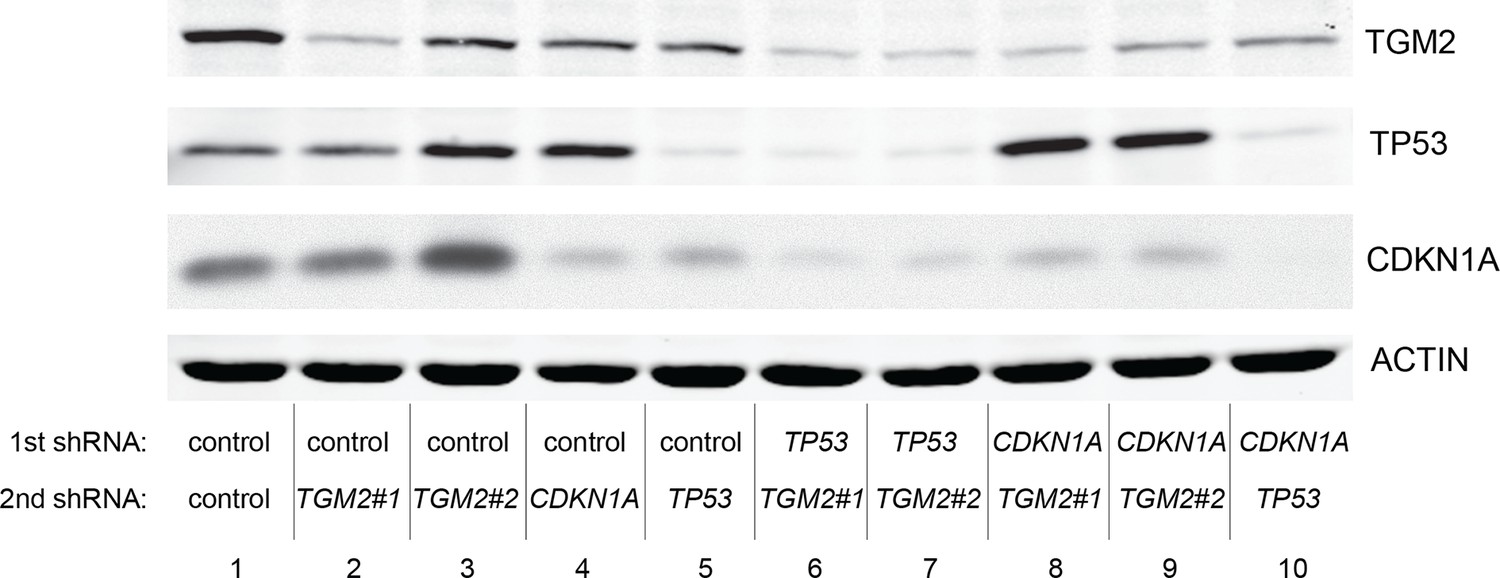
Protein expression for Figure 6A.
Western blot analysis of TGM2, TP53, and CDKN1A corresponding to Figure 6A are shown. β-ACTIN serves as the loading control.
Figure 6—figure supplement 3

Pictures of soft agar assay for Figure 6C.
Representative MTT-stained colonies corresponding to Figure 6C are shown.
Figure 6—figure supplement 4
Protein expression for Figure 6C.
Western blot analysis corresponding to Figure 6C are shown. β-ACTIN serves as the loading control.
Figure 6—figure supplement 5

Protein expression of BECN1, ATG5, ATG12, and LC-3.
Western blot analysis of HMECTERT/ST/ER-RasV12 cells expressing either control, ATG5, BECN1, or ATG12 shRNA. β-ACTIN serves as the loading control. Knockdown of ATG5, BECN1 and ATG12 resulted in the accumulation of LC3-I and decrease in the ratio of LC3-II / LC3-I.
Figure 6—figure supplement 6
Pictures of soft agar assay for Figure 6D.
Representative MTT-stained colonies corresponding to Figure 6D are shown.
Figure 6—figure supplement 7
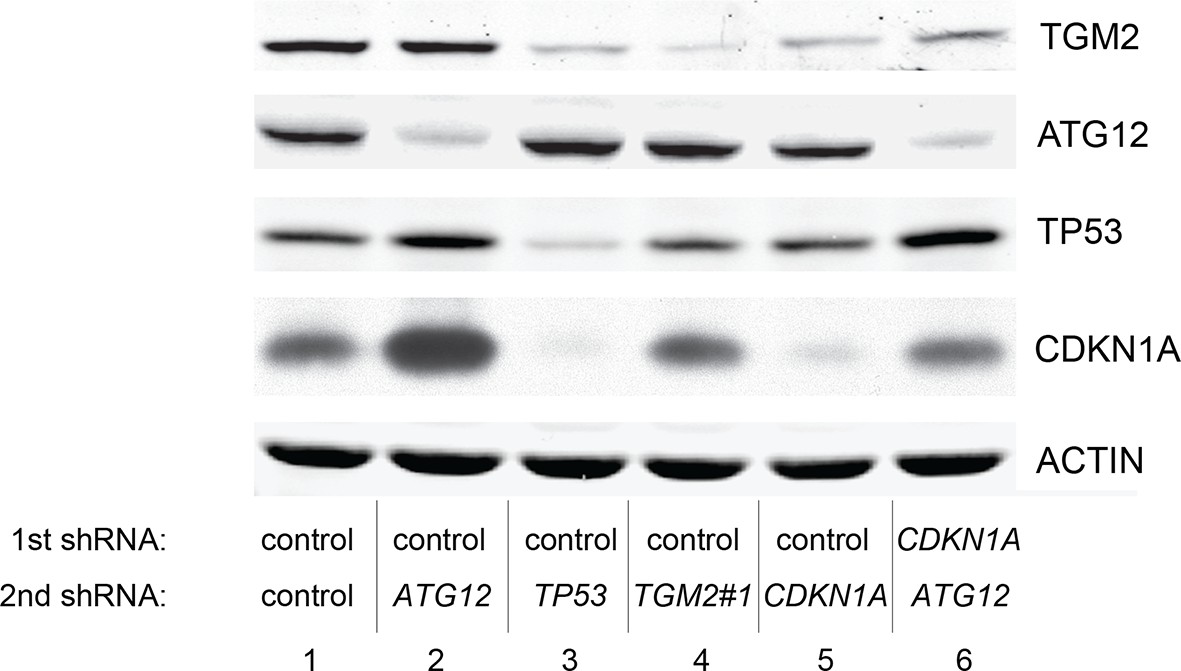
Protein expression for Figure 6D.
Western blot corresponding to Figure 6D. β-ACTIN serves as the loading control.
Figure 6—figure supplement 8

Pictures of soft agar assay for Figure 6E.
Representative MTT-stained colonies corresponding to Figure 6E are shown.
Figure 6—figure supplement 9

Protein expression for Figure 6E.
Western blot analysis corresponding to Figure 6E are shown. β-ACTIN serves as the loading control.
Figure 6—figure supplement 10
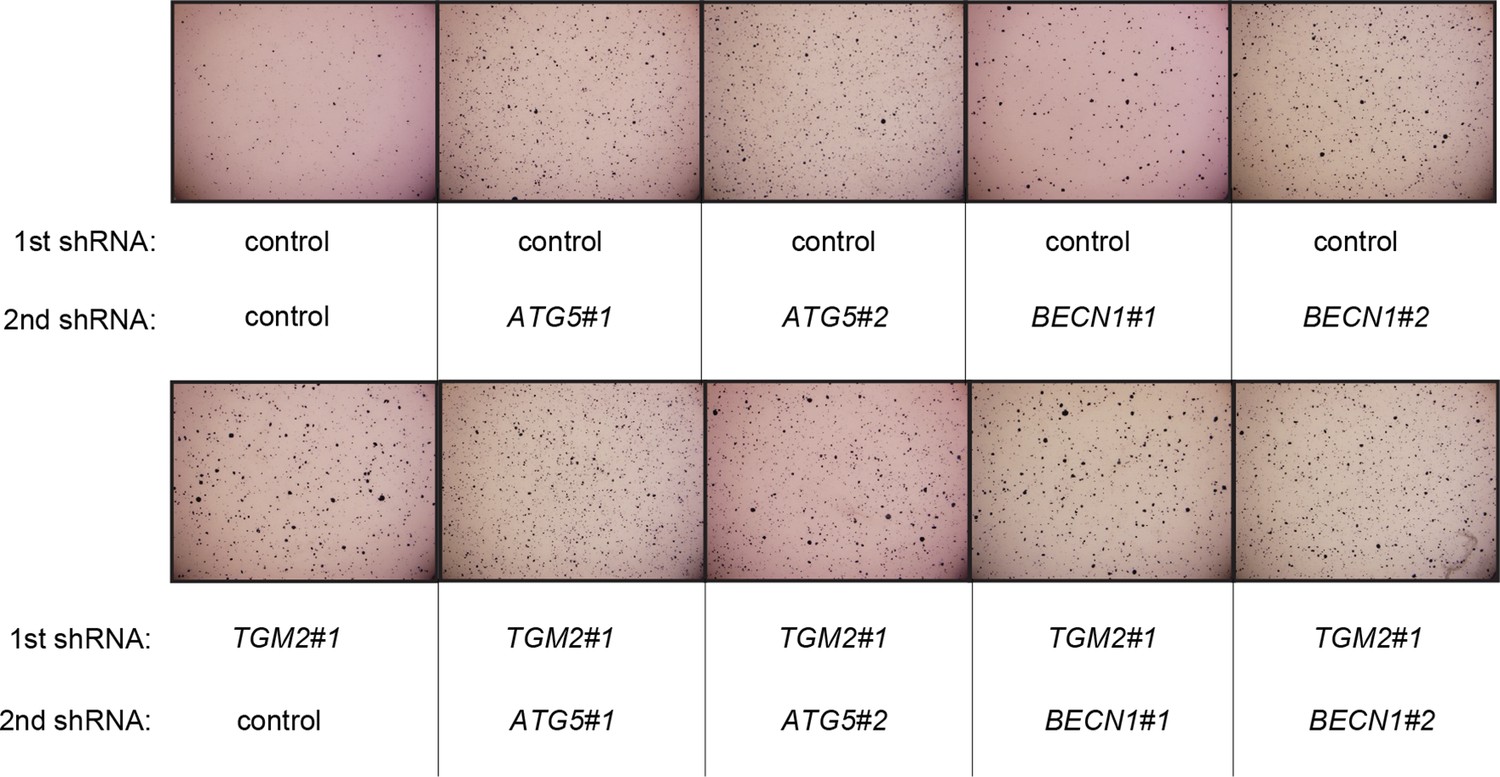
Pictures of soft agar assay for Figure 6F.
Representative MTT-stained colonies corresponding to Figure 6F are shown.
Figure 6—figure supplement 11

Protein expression for Figure 6F.
Western blot corresponding to Figure 6F. β-ACTIN serves as the loading control.
Figure 6—figure supplement 12
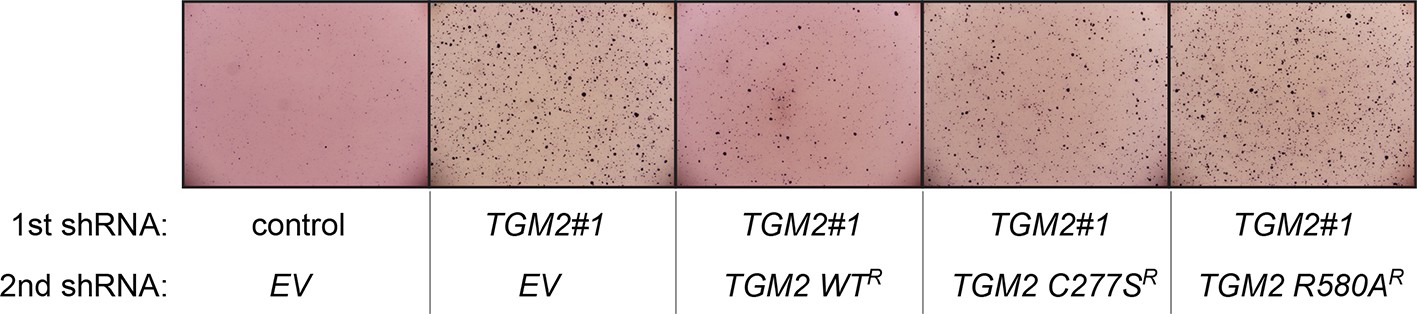
Pictures of soft agar assay for Figure 6H.
Representative MTT-stained colonies corresponding to Figure 6H are shown.
Figure 6—figure supplement 13
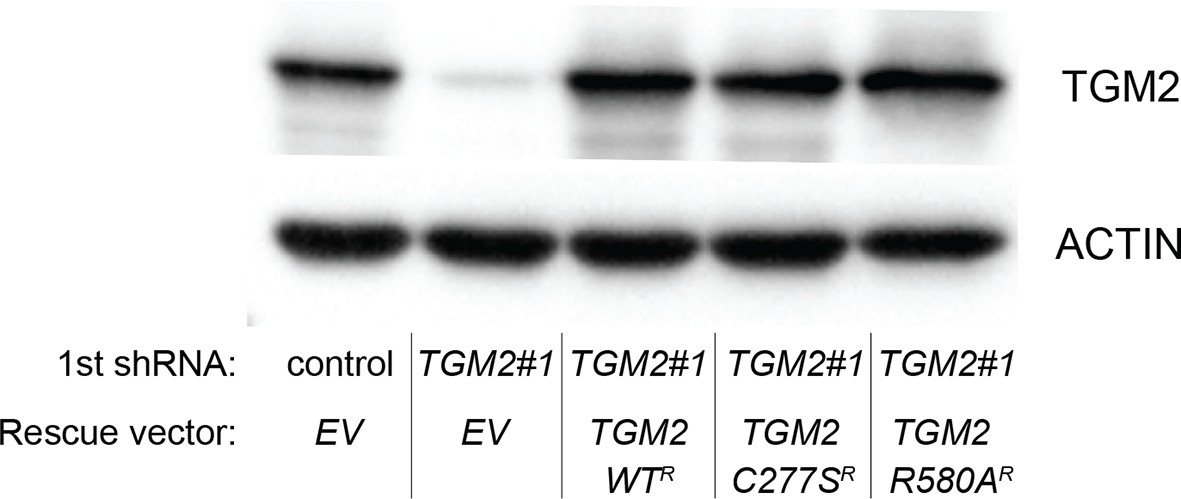
Protein expression for Figure 6H.
Western blot analysis of TGM2 expression corresponding to Figure 6H are shown. β-ACTIN serves as the loading control. Note the comparable expression levels of endogenous TGM2, and the shRNA-resistant wild-type and mutant TGM2 cDNAs.
Figure 7
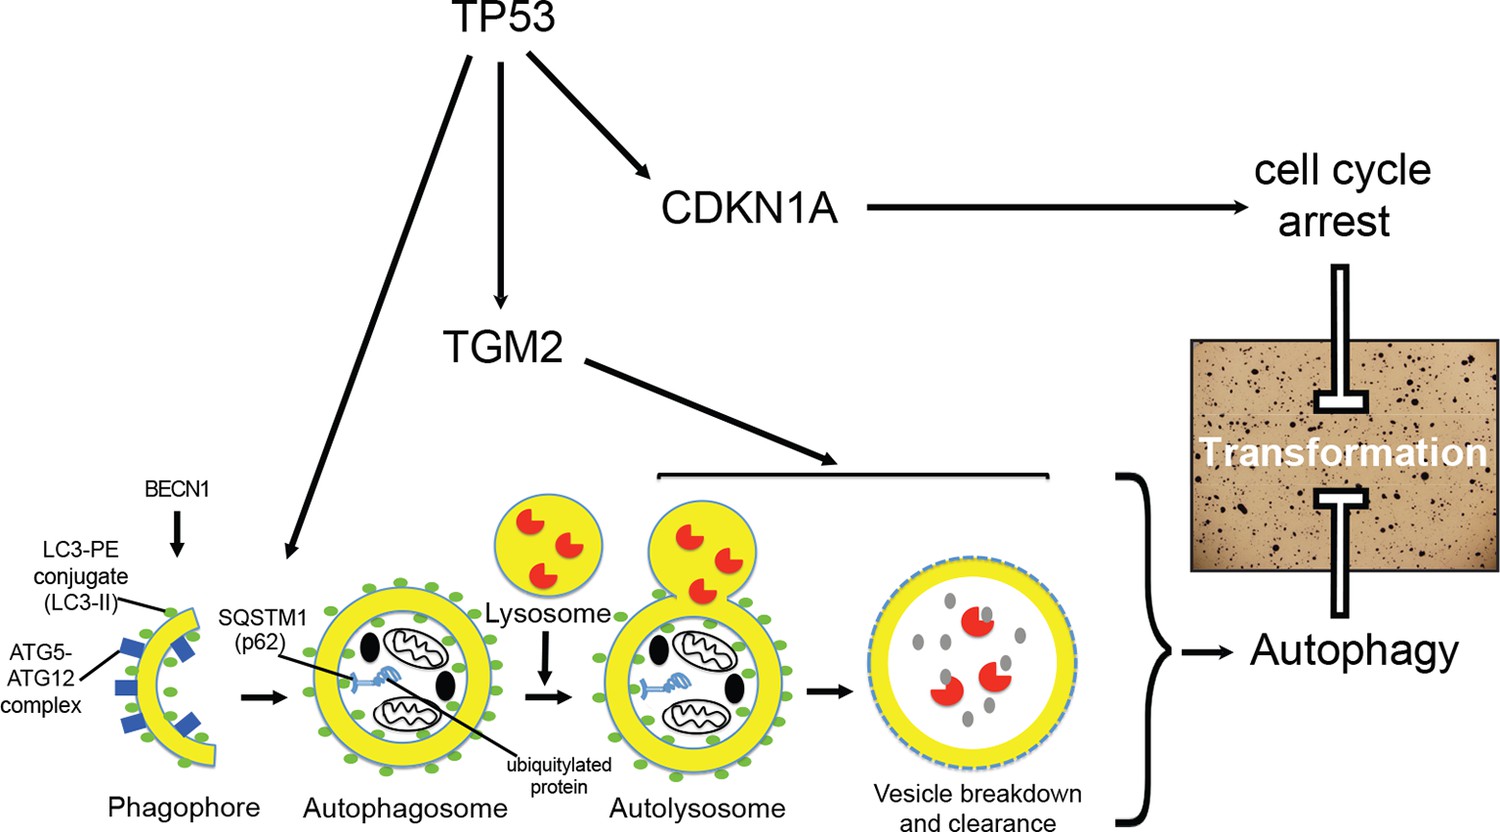
A model of the tumor suppressive functions of TGM2 in HMECTERT/ST/ER-RasV12 cells.
Stress, in this case the depletion of growth supplements, induces autophagy and TP53-dependent expression of TGM2. TGM2 facilitates autophagic flux by promoting autophagic protein degradation and autolysosome clearance. Loss of TGM2 expression synergizes with loss of CDKN1A expression to promote malignant transformation of HMECs. Therefore, TGM2-mediated autophagy and CDKN1A-mediated cell cycle arrest are potentially two critical barriers in the TP53 pathway that prevent oncogenic transformation of HMECs.
Additional files
-
Supplementary file 1
Primary screen.
Gene symbol, % of number of colonies formed in knockdown cells compared to control cells, and shRNA sequences used are shown for 122 of selected target genes. 4 candidate genes identified in primary screen are shown in red. CDKN1A and TP53 shRNAs were used as positive controls and shown in blue.
- https://doi.org/10.7554/eLife.07101.038
-
Supplementary file 2
Secondary screen.
To exclude off-target effects, additional shRNAs against the 4 genes were constructed in a secondary screen. Knockdown of only one, TGM2, produced colonies in soft agar with at least 2 independent shRNAs.
- https://doi.org/10.7554/eLife.07101.039
Download links
A two-part list of links to download the article, or parts of the article, in various formats.
Downloads (link to download the article as PDF)
Open citations (links to open the citations from this article in various online reference manager services)
Cite this article (links to download the citations from this article in formats compatible with various reference manager tools)
Transglutaminase 2 contributes to a TP53-induced autophagy program to prevent oncogenic transformation
eLife 5:e07101.
https://doi.org/10.7554/eLife.07101


