Synaptic representation of locomotion in single cerebellar granule cells
- University College London, United Kingdom
- John Radcliffe Hospital, United Kingdom
- University of Edinburgh, United Kingdom
Figures
Figure 1
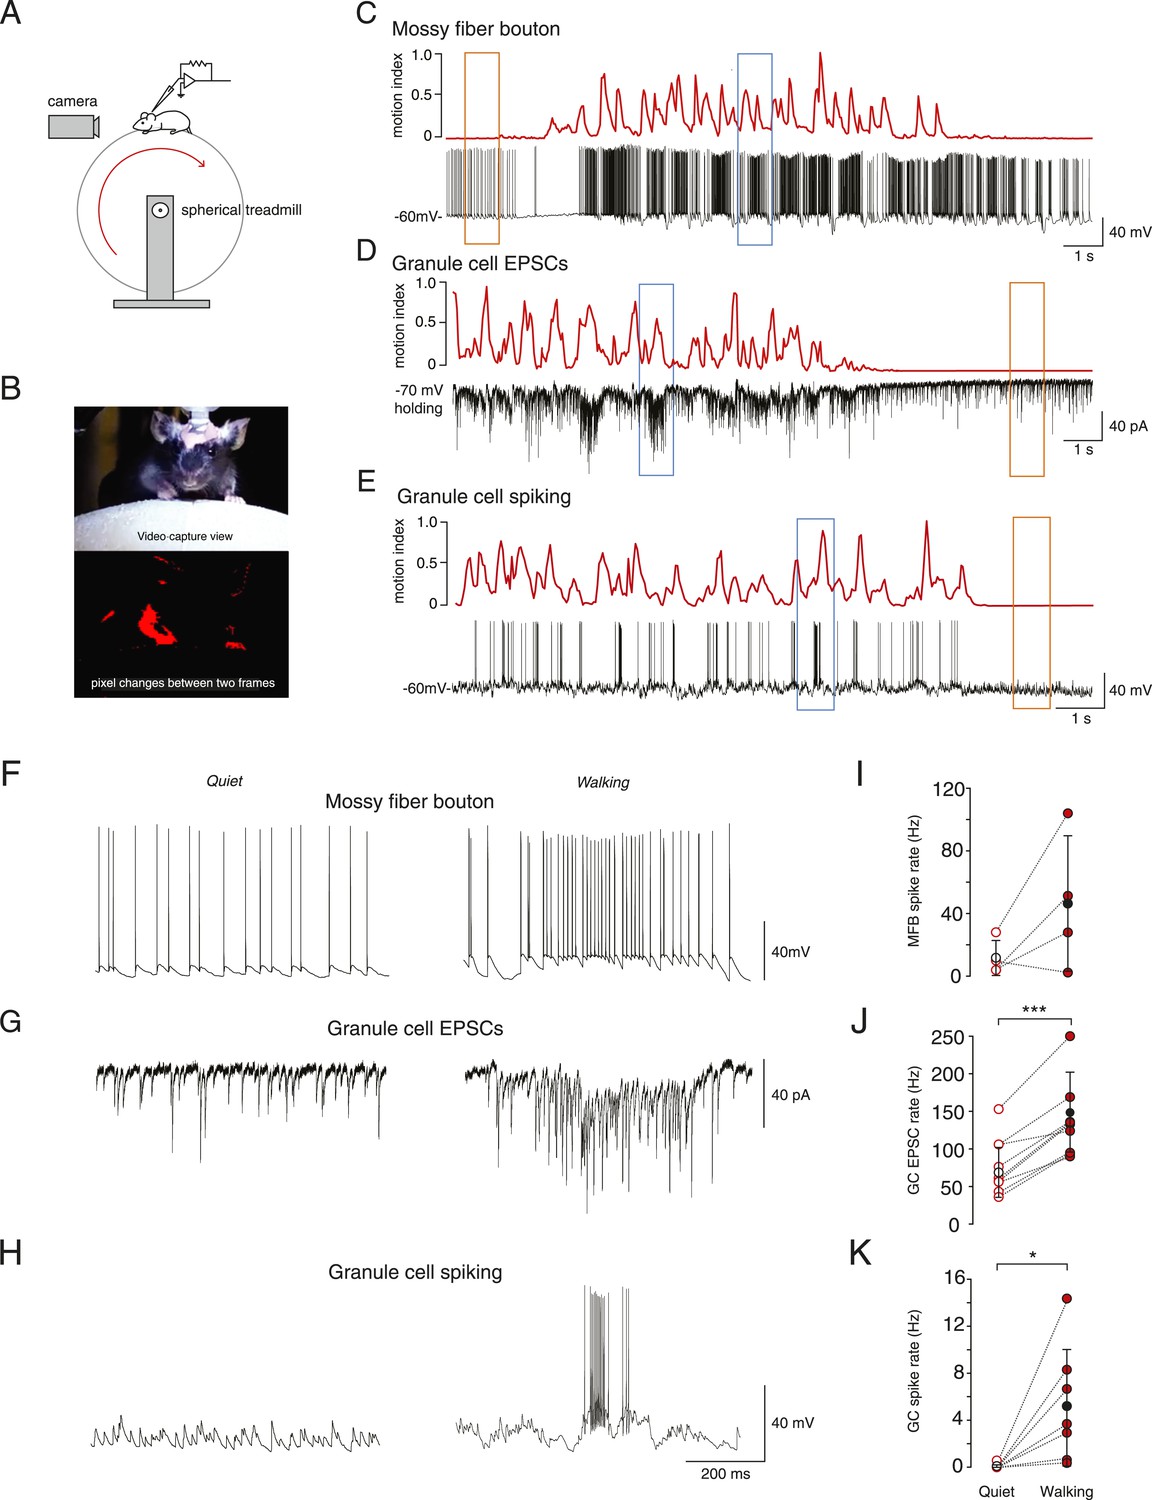
Whole-cell recordings from granule cells and mossy fibers during locomotion.
(A) Schematic of recording configuration. (B) Calculation of motion index. Top panel: a single frame from a video of a mouse walking on the treadmill. Bottom panel: pixel intensity variation between the frame shown in the above panel and the previous frame are highlighted in red. The pixel variation between each frame was quantified for each video to give a continuous signal relating to average motion of the mouse (motion index calculated as described in the ‘Materials and methods’ and normalized to the maximum value in the video). (C–E) Example whole-cell recordings (black) from a presynaptic mossy fiber terminal (C), a granule cell recorded in voltage-clamp mode (D) and a granule cell recorded in current clamp mode (E), together with the corresponding motion index (red). (F–H) Section of each example trace shown in C–E at a higher timescale show spontaneous input recorded during a quiet period (left panels, orange frames in (C–E) indicate the location within the trace) and typical bursts of activity during locomotion (right panels, blue frames in (C–E) indicate the location within the trace). Summary data comparing the average instantaneous frequencies of mossy fiber spikes (I, n = 4 in 4 mice), granule cell EPSCs (J, n = 9 in 6 mice) and granule cell spikes (K, n = 6, in 4 mice). Mean group averages are indicated with black open and closed circles, error bars indicate standard deviation.
Figure 2 with 1 supplement
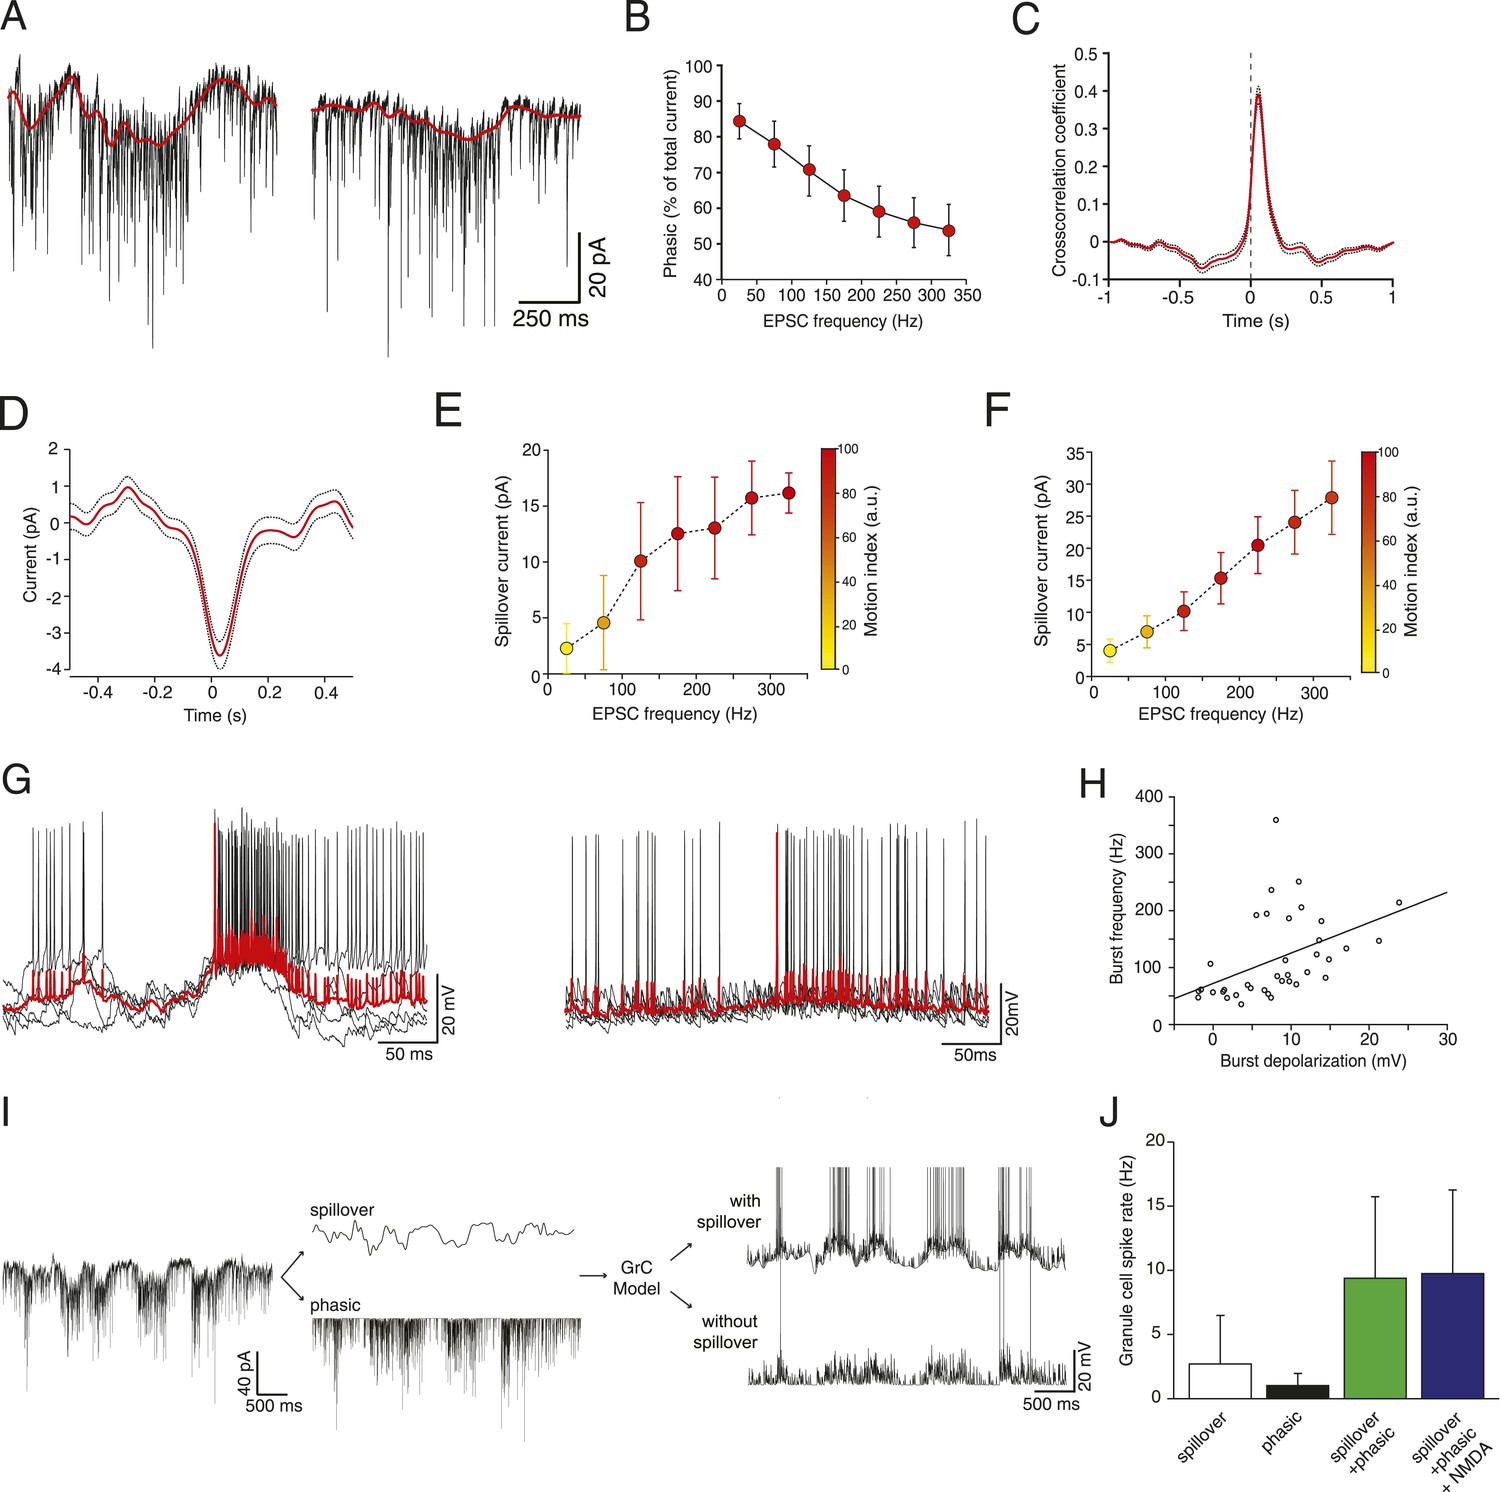
Glutamate spillover enhances transmission during locomotion.
(A) Voltage clamp traces recorded at a holding potential of −70 mV from two granule cells. Red line indicates the spillover current obtained by subtracting the fitted single exponential decays of the phasic EPSCs. (B) Relationship between the EPSC frequency and the relative proportion of excitatory current carried by the phasic EPSC component (average for all recorded cells; n = 9 in 6 mice). (C) Average cross-correlation of instantaneous EPSC frequency with spillover current (n = 9, dotted lines indicate standard deviation). Dashed line indicates zero lag. (D) Average EPSC burst triggered spillover current for all cells (dotted line indicates standard deviation). (E, F) Graphs showing increasing EPSC frequency and spillover conductance occurring with motion in an example granule cell (E) and as an average for all cells (F, n = 9). (G) Overlaid voltage traces showing spike bursts (red traces indicate the average). High-frequency bursting appears to be associated with greater subthreshold depolarization (left panel). (H) Graph showing the relationship between spike burst frequency and subthreshold depolarization for individual bursts across all cells (n = 37 bursts from 4 cells, r = 0.45, p = 0.0055). (I) A representative current trace showing the separation of phasic and spillover EPSCs. A granule cell model was then used to estimate the effect of spillover conductance on granule cell spike output. (J) Summary data showing the simulated granule cell spike frequency resulting from spillover, phasic and combined conductances, as well as combined conductances including an NMDA conductance (n = 9; see ‘Materials and methods’).
Figure 2—figure supplement 1
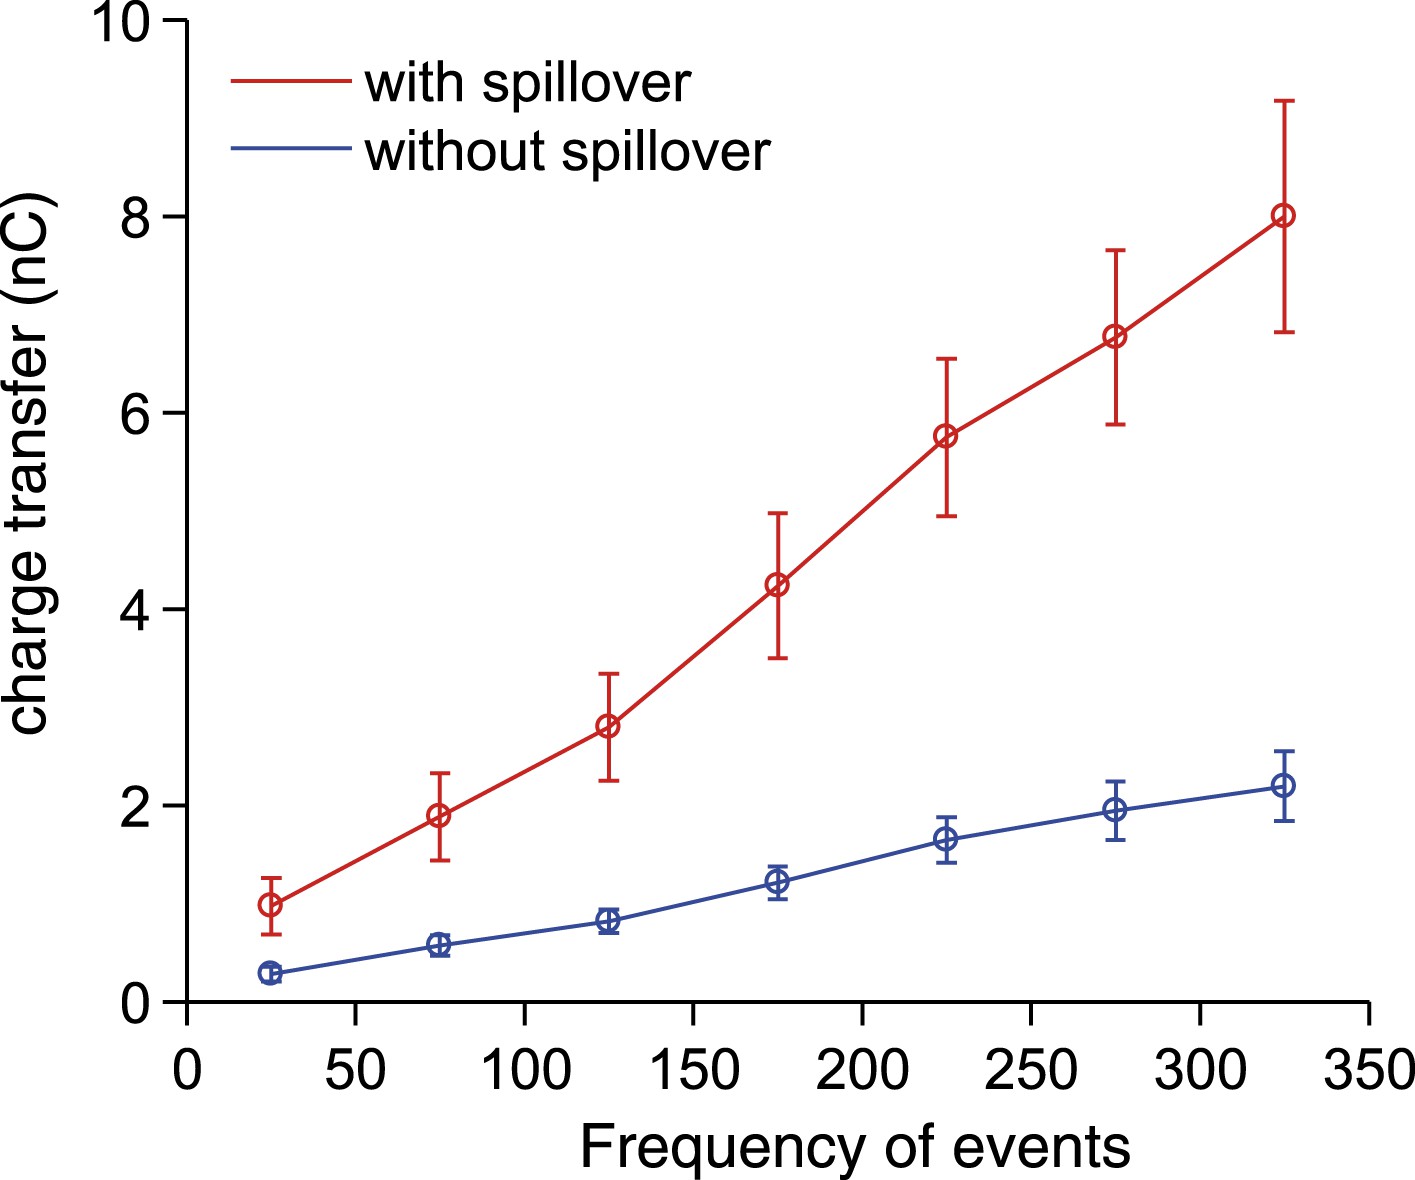
Synaptic charge transfer with and without spillover.
The synaptic charge transfer over 100 ms as a function of EPSC frequency with and without spillover.
Figure 3 with 1 supplement
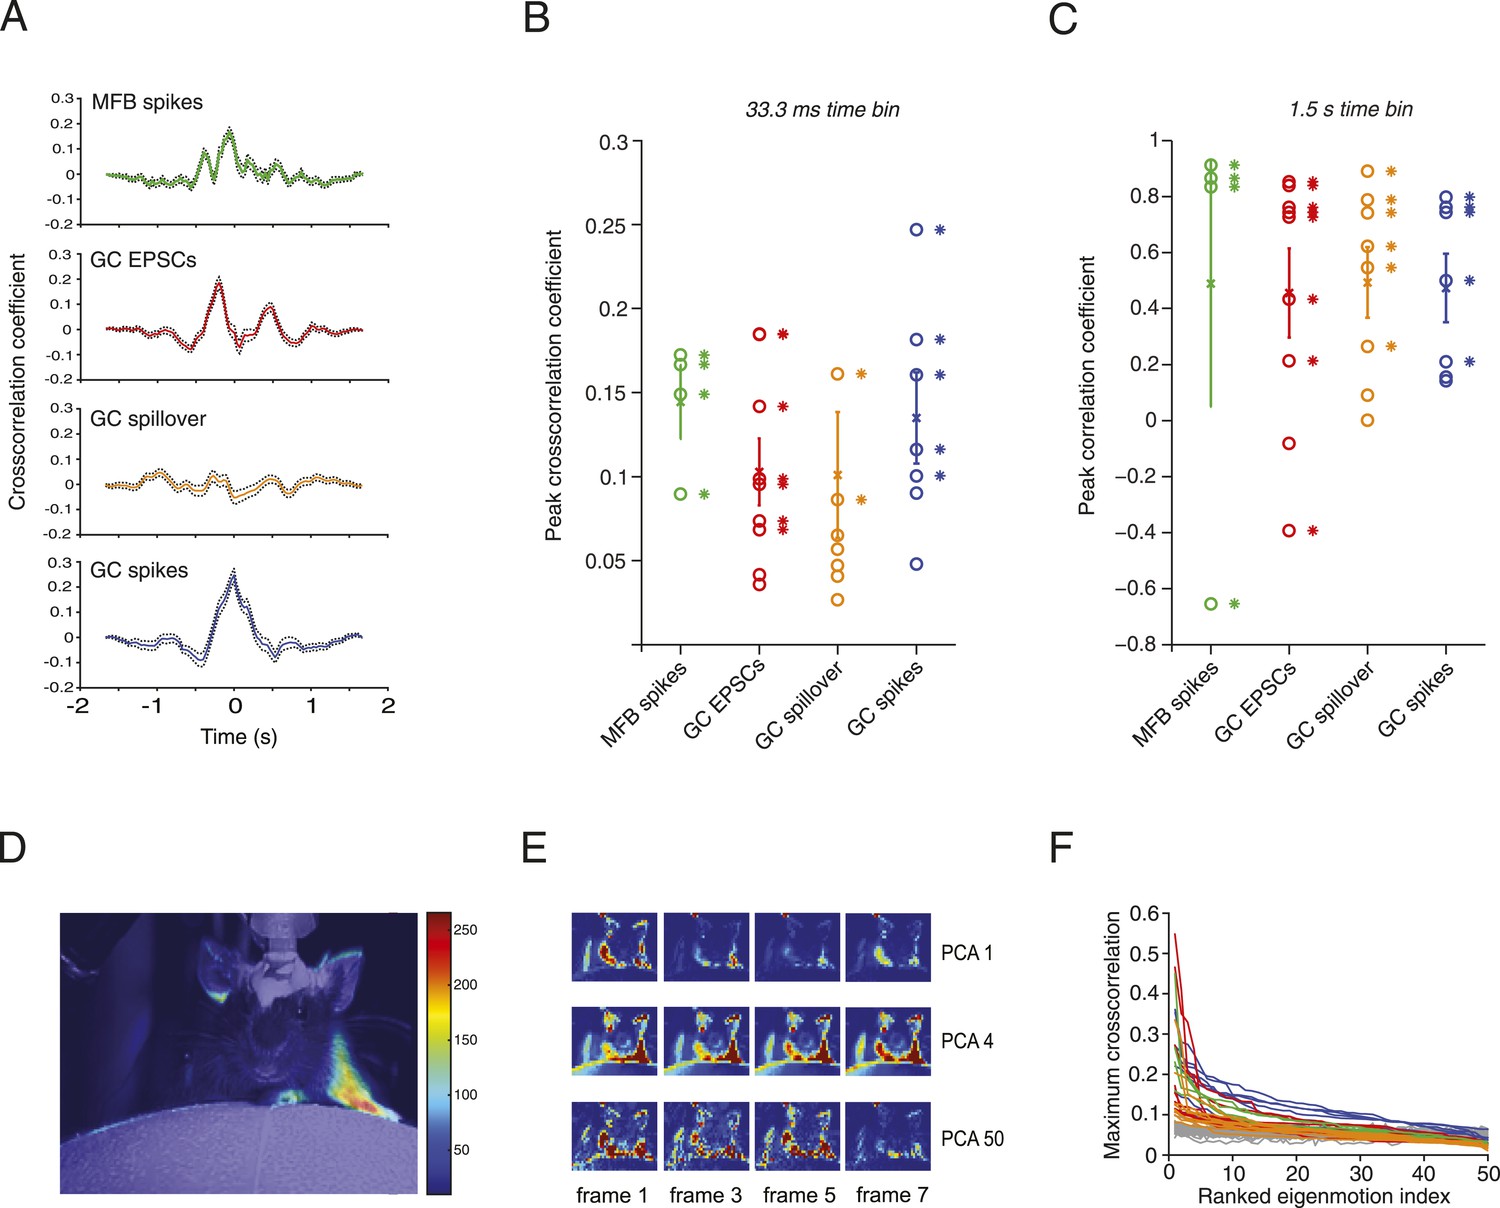
Relationship between motion and activity parameters of single granule cells.
(A) Normalized cross-correlation between motion index and event frequency for a MFB (green), EPSCs (red), spillover (orange), and GC spikes (blue). (B, C) Peak normalized cross-correlation coefficients for each cell using fine time bins (33.3 ms; asterisks denote points with p < 0.05) and raw correlation coefficients using coarse time bins (1.5 s; asterisks in C denote correlation coefficients significant at the p = 0.05 level). (D) Spike triggered average of motion map overlaid on video of mouse. (E, F) PCA analysis: each video was decomposed into 50 8-frame principal components (PCs, top row, 4 frames shown for PC 1, 4 and 50). The activity of each cell was then cross-correlated over time with the PC coefficient (F). Each line represents the maximum cross-correlation of a single cell with the different PCs for the corresponding video (green = MFBs, red = GC-EPSC, orange = GC-spillover, blue = GC-spikes). The gray traces represent the average cross-correlation with bootstrapped data and therefore indicate the noise level. Note that the PCs were ranked according to their cross-correlation.
Figure 3—figure supplement 1

Modulation of responses by locomotion onset and termination.
(A) EPSC rates from 23 locomotion periods from 9 cells aligned to the start of locomotion (at t = 0 ms, defined as the start of the first swing phase). (B) EPSC rates from 22 locomotion periods from 9 cells aligned to the end of locomotion (at t = 0 ms, defined as the end of the last swing phase).
Figure 4 with 2 supplements
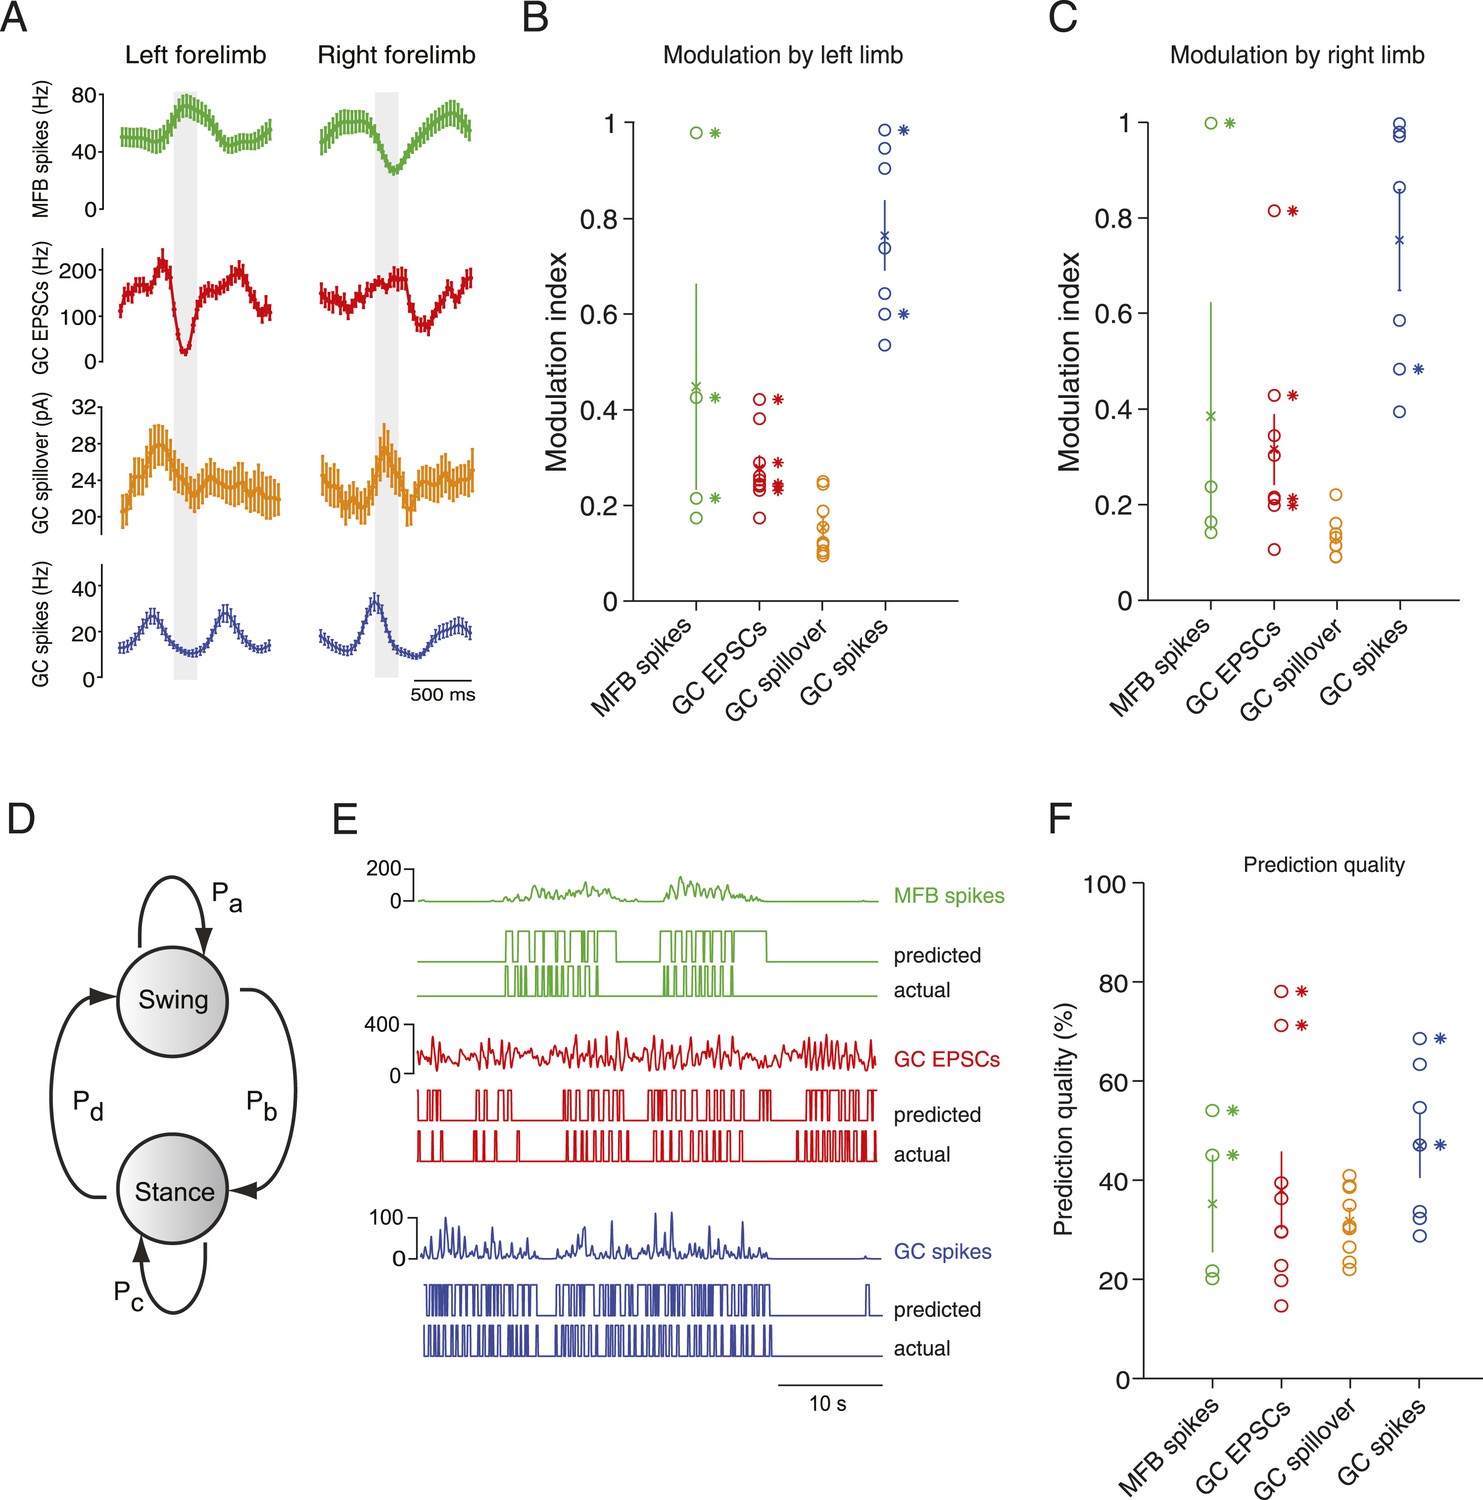
Decoding activity in a single granule cell can predict the step cycle.
(A) Example step-triggered averages of activity for three different cells (EPSC and spillover examples are from the same granule cell). Gray-shaded area indicates the swing phase of the step cycle. (B, C) Step cycle modulation index for each forelimb across all cells. (D) Two state Hidden Markov Model (HMM) used to reconstruct the step cycle from electrophysiological recordings. (E) Example of successful step reconstructions for an MFB (red), GC EPSC recording (green) and GC spikes (blue). The top traces represent the electrophysiological event rate in Hz, the middle traces the step transition (with the high state being the swing phase and the low state being the stance) predicted by the HMM, and the lower trace being the actual step of the best modulated limb. (F) Prediction quality for all cells.
Figure 4—figure supplement 1
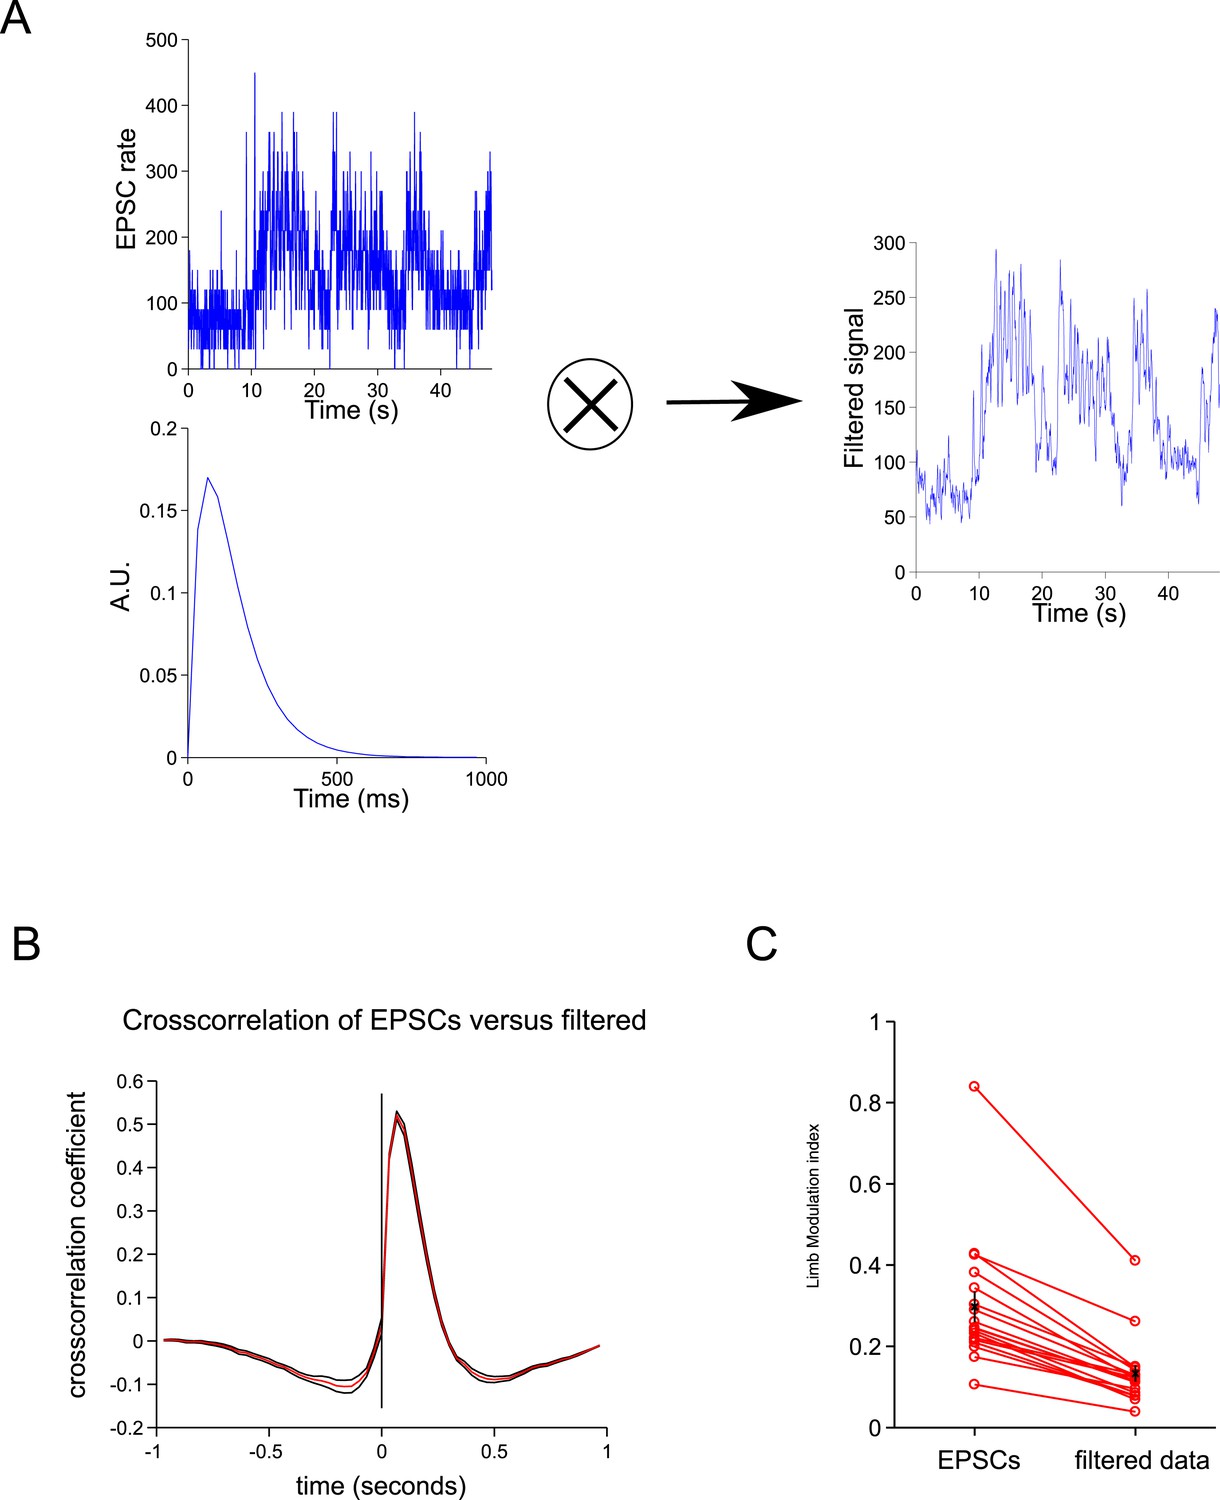
Spillover acts like a temporal filter.
(A) We convolved the ESPCs rates with a biexponential trace to give a filtered trace. (B) The cross-correlation between the filtered traced and EPSCs resembles the cross-correlation between spillover and EPSCs (Figure 2C). (C) The step cycle modulation of the EPSCs is drastically reduced by the filtering procedure (from 0.30 ± 0.03 to 0.13 ± 0.2; p = 4.65 × 10⁻⁴; n = 18, 2 limbs for n = 9 cells).
Figure 4—figure supplement 2
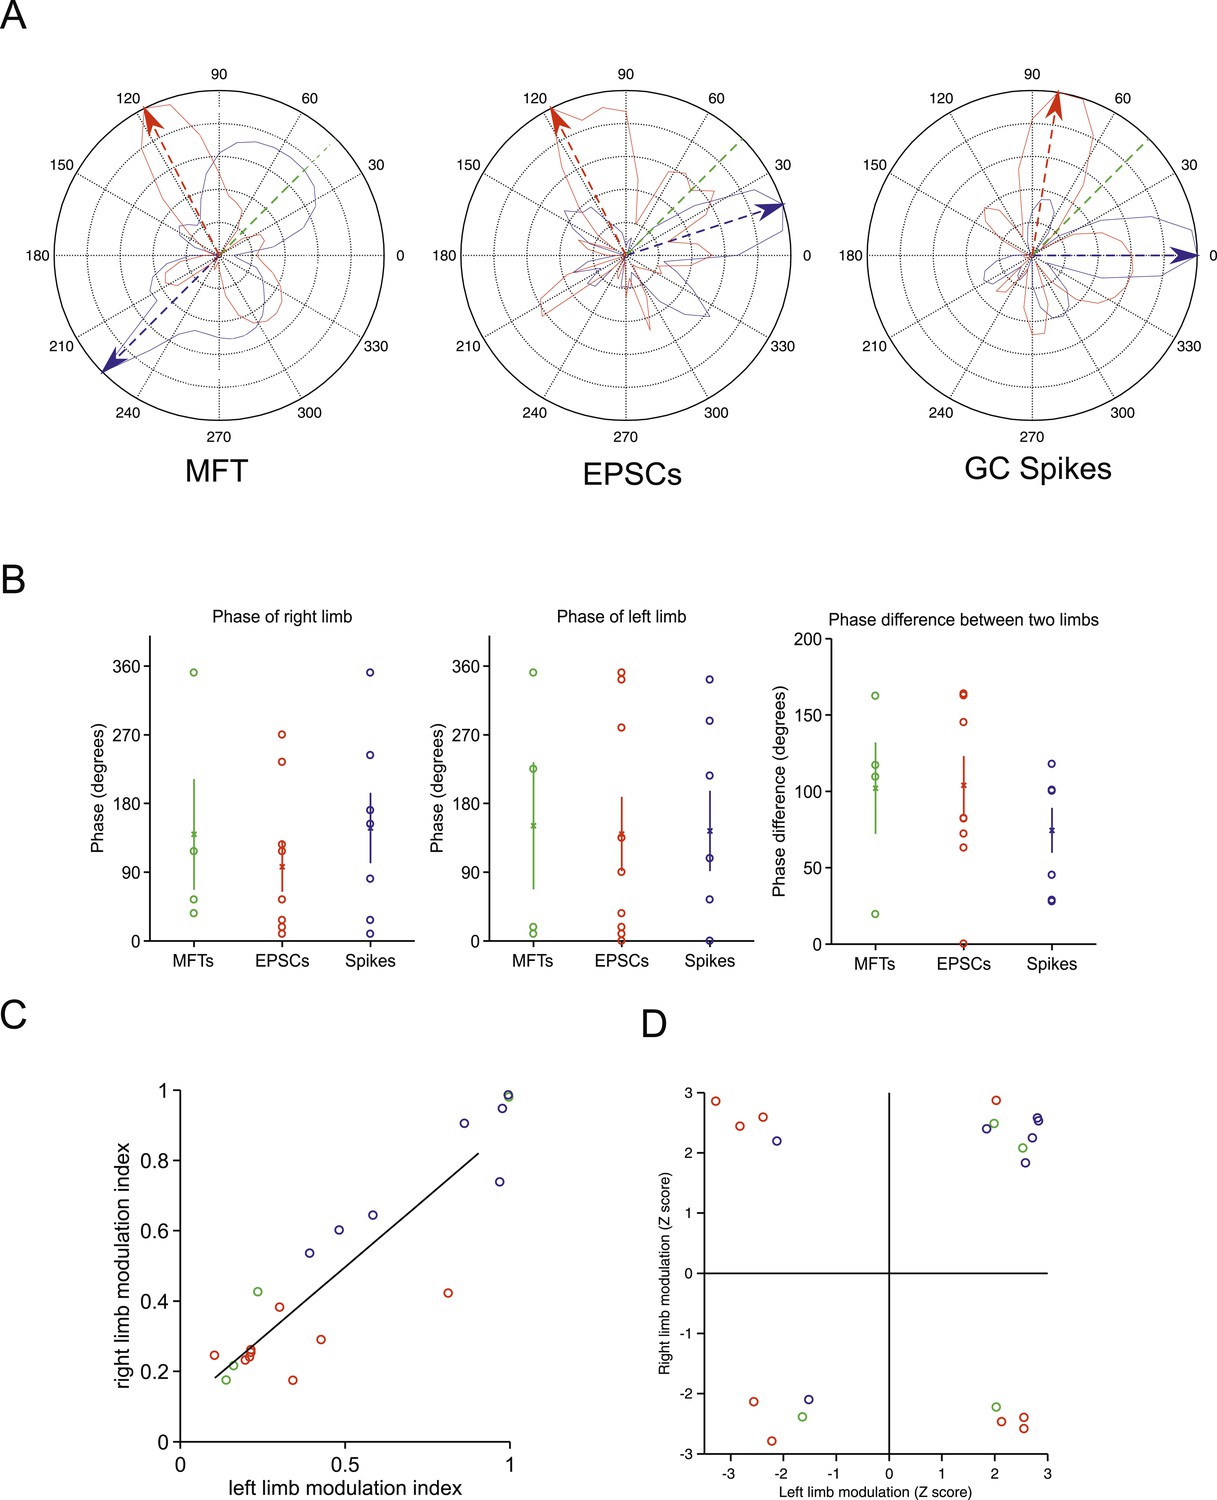
Tuning of responses to the step cycle.
(A) Polar plot representing the step cycle modulation for each of the forelimb. Each of these plots is a representation of the step cycle for one recording (respectively an MFT, EPSC and GC spike recording), 0° being the start of the swing phase, the green line is end of the swing phase. Each trace (blue: left forelimb, red: right forelimb) represents as the radius in the plot the modulation of activity (see ‘Materials and methods’) for that phase of the step cycle (for the MFT plot, the scale corresponds to 2.4 Hz for the blue trace and 2.7 Hz for the red trace, for the EPSC plot the scale is 120 Hz for the blue trace and 65 Hz for the red trace, and for the GC spike trace, the scale is 13.6 Hz for the blue trace and 9.4 Hz for the red trace). The arrows show the phase of maximal modulation. Note that for these recordings, the maximal modulations are at roughly 90°. (B) The phases at which maximal modulation occurs can vary widely across cells for both the left and right forelimb (left and middle trace). The phase difference between these modulations for each cell is shown in the right panel. (C) The magnitude of modulation is highly correlated for the right and left limb across recording modalities (green: MFTS, red: EPSCs, blue: GC spikes). (D) The direction of maximum modulation is plotted here for all cells as a z-value (i.e., negative values indicate a decrease in activity and positive values an increase) for both the left and right forelimb.
Author response image 1
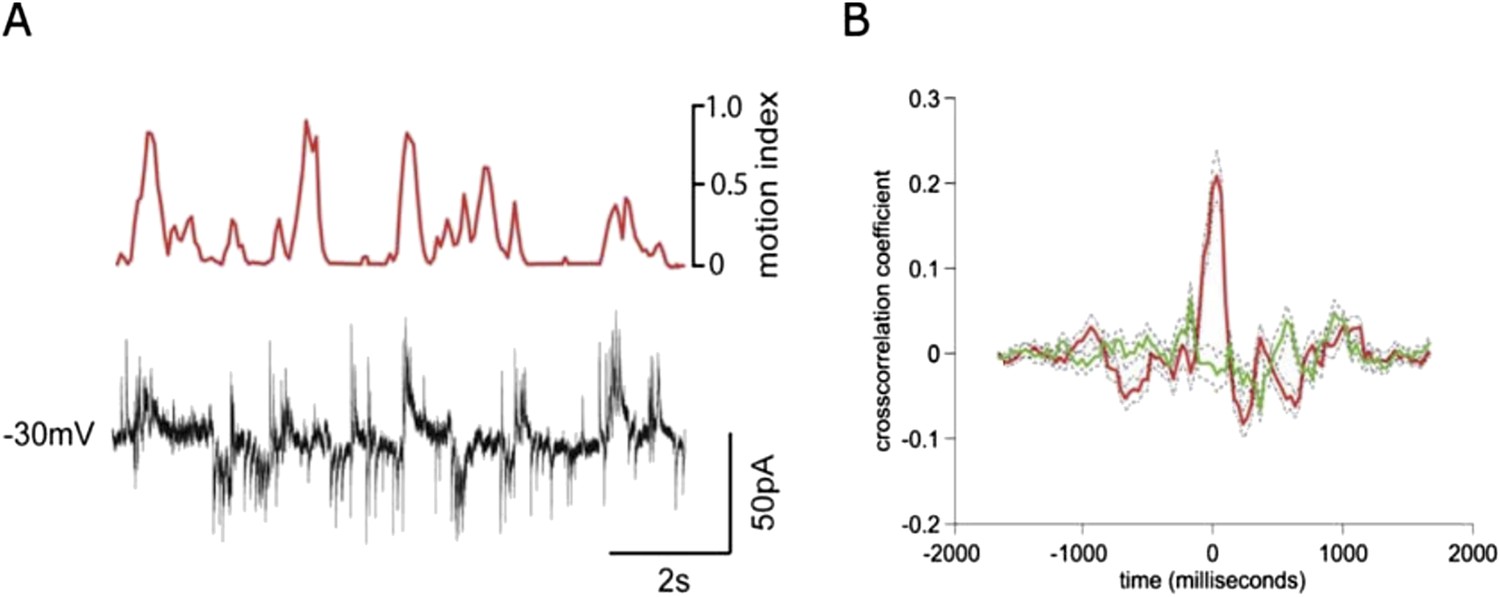
Simultaneous recording of IPSCs and EPSCs during locomotion.
(A) recording of EPSCs (inward currents) and IPSCs (outward currents) concurrently in a granule cell voltage clamped at ∼-30 mV. (B) Cross-correlation with motion index for IPSCs (green) and EPSCs (red), shows a much stronger cross-correlation for EPSCs than IPSCs.
Author response image 2
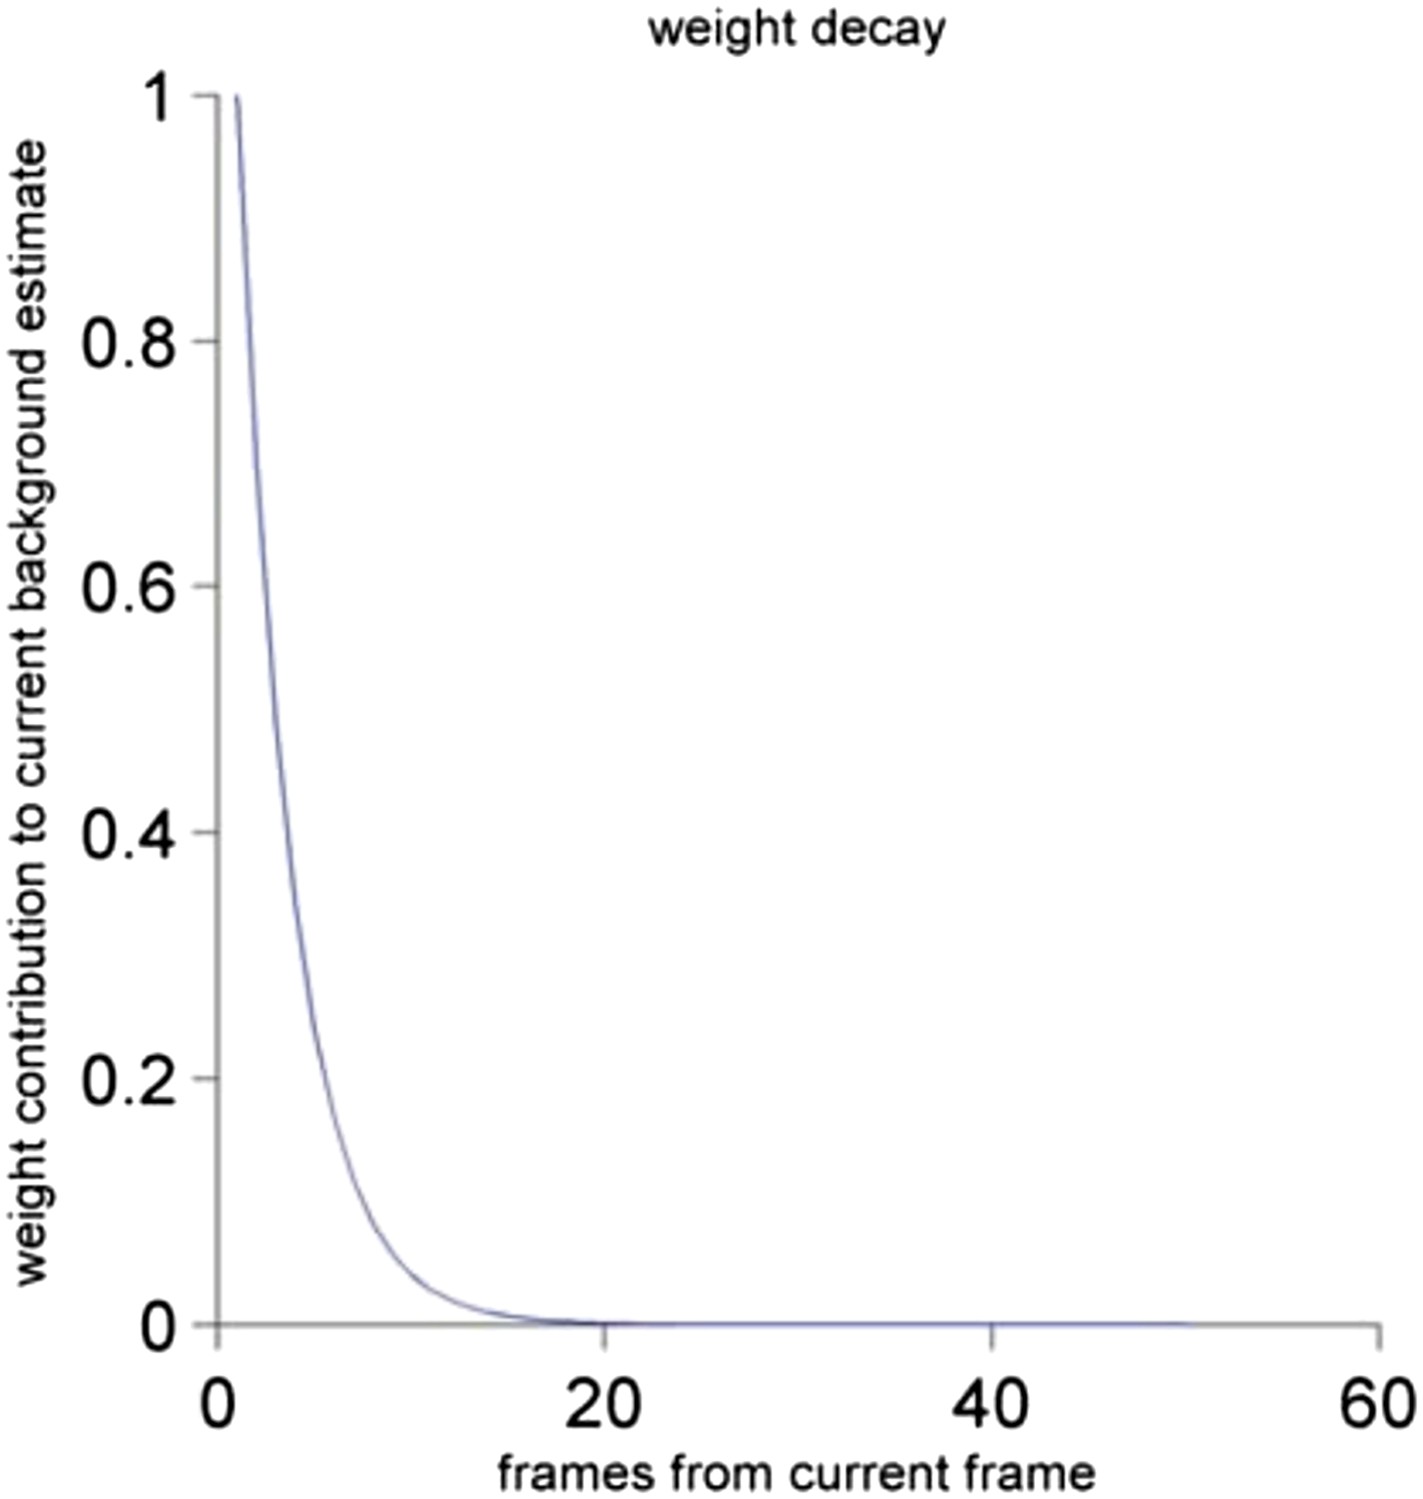
The contribution of the frame to the current background estimate as a function of the distance of the past frame to the current frame. See Materials and methods for a detailed description.
Author response image 3
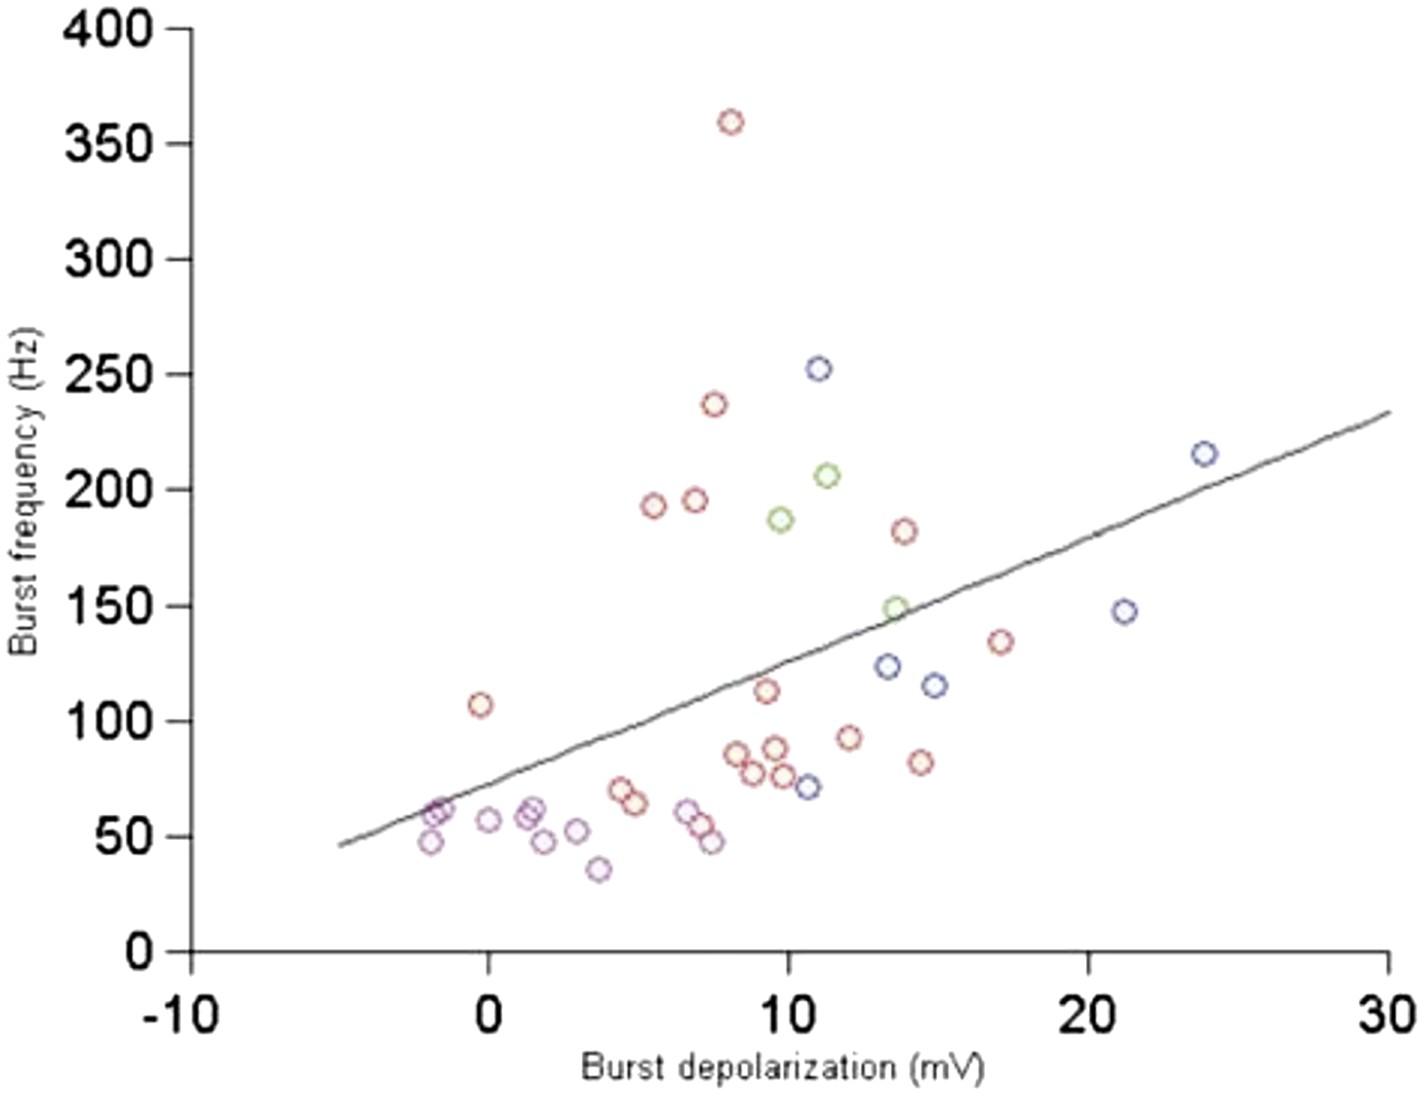
Relationship between burst depolarization and burst frequency. Each colour represents a different cell from which the burst was recorded.
Additional files
-
Source code 1
Custom built software in Matlab (Mathworks).
- https://doi.org/10.7554/eLife.07290.011
Download links
A two-part list of links to download the article, or parts of the article, in various formats.
Downloads (link to download the article as PDF)
Open citations (links to open the citations from this article in various online reference manager services)
Cite this article (links to download the citations from this article in formats compatible with various reference manager tools)
Synaptic representation of locomotion in single cerebellar granule cells
eLife 4:e07290.
https://doi.org/10.7554/eLife.07290


