Negative regulation of ABA signaling by WRKY33 is critical for Arabidopsis immunity towards Botrytis cinerea 2100
- Max Planck Institute for Plant Breeding Research, Germany
- Leibniz Institute of Plant Biochemistry, Germany
Figures
Figure 1 with 2 supplements
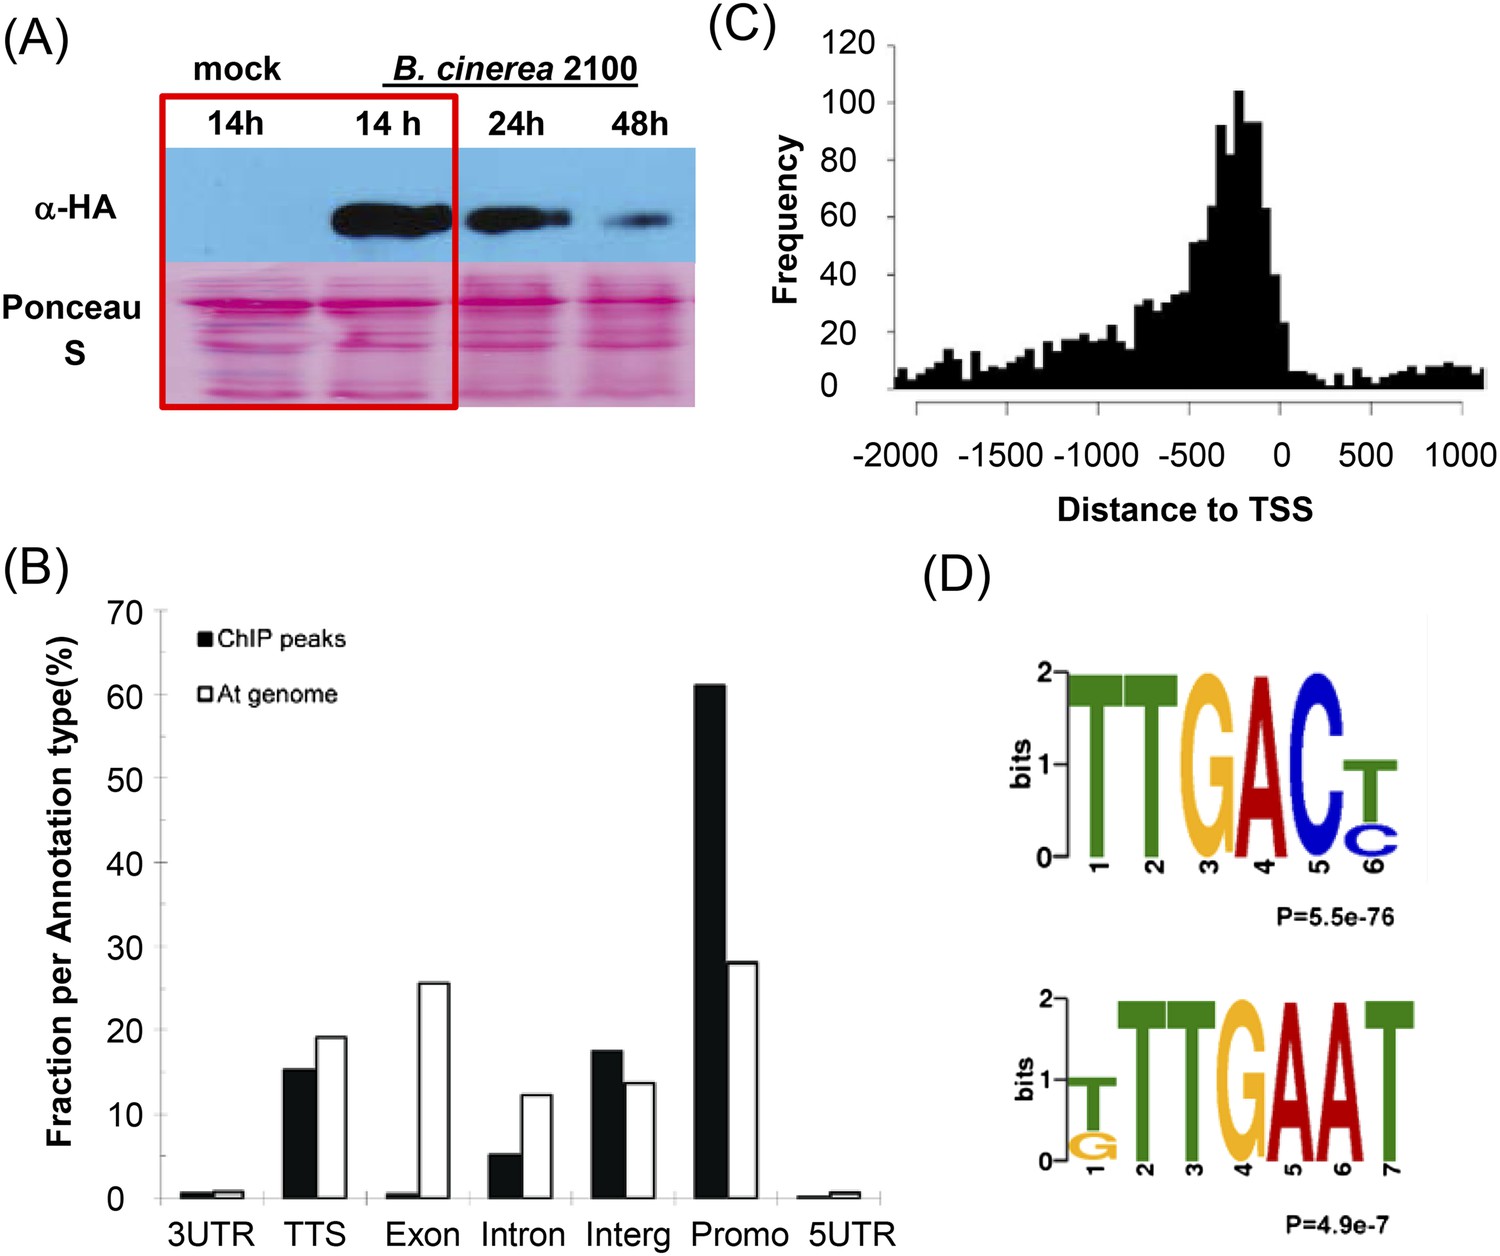
Genome-wide identification of Arabidopsis WRKY33 binding sites.
(A) Western-blot analysis of WRKY33-HA protein levels after mock treatment or spray-inoculation of PWRKY33:WRKY33-HA transgenic plants with B. cinerea 2100 spores. Plant material selected for ChIP-seq is boxed. (B) Relative binding-peak distribution across genomic regions. The 1 kb region upstream of the transcription start site is defined as promoter. The fraction of nucleotides in the complete At genome associated with each annotation type is included in the figure as background control (At genome). (C) Distribution of identified WRKY33 binding sites relative to the TSS. (D) Conserved DNA elements enriched within the 500 bp WRKY33 binding peak regions identified by DREME motif search. The TTGACT/C motif represents the well-established W-box, whereas T/GTTGAAT is an identified new motif.
Figure 1—figure supplement 1
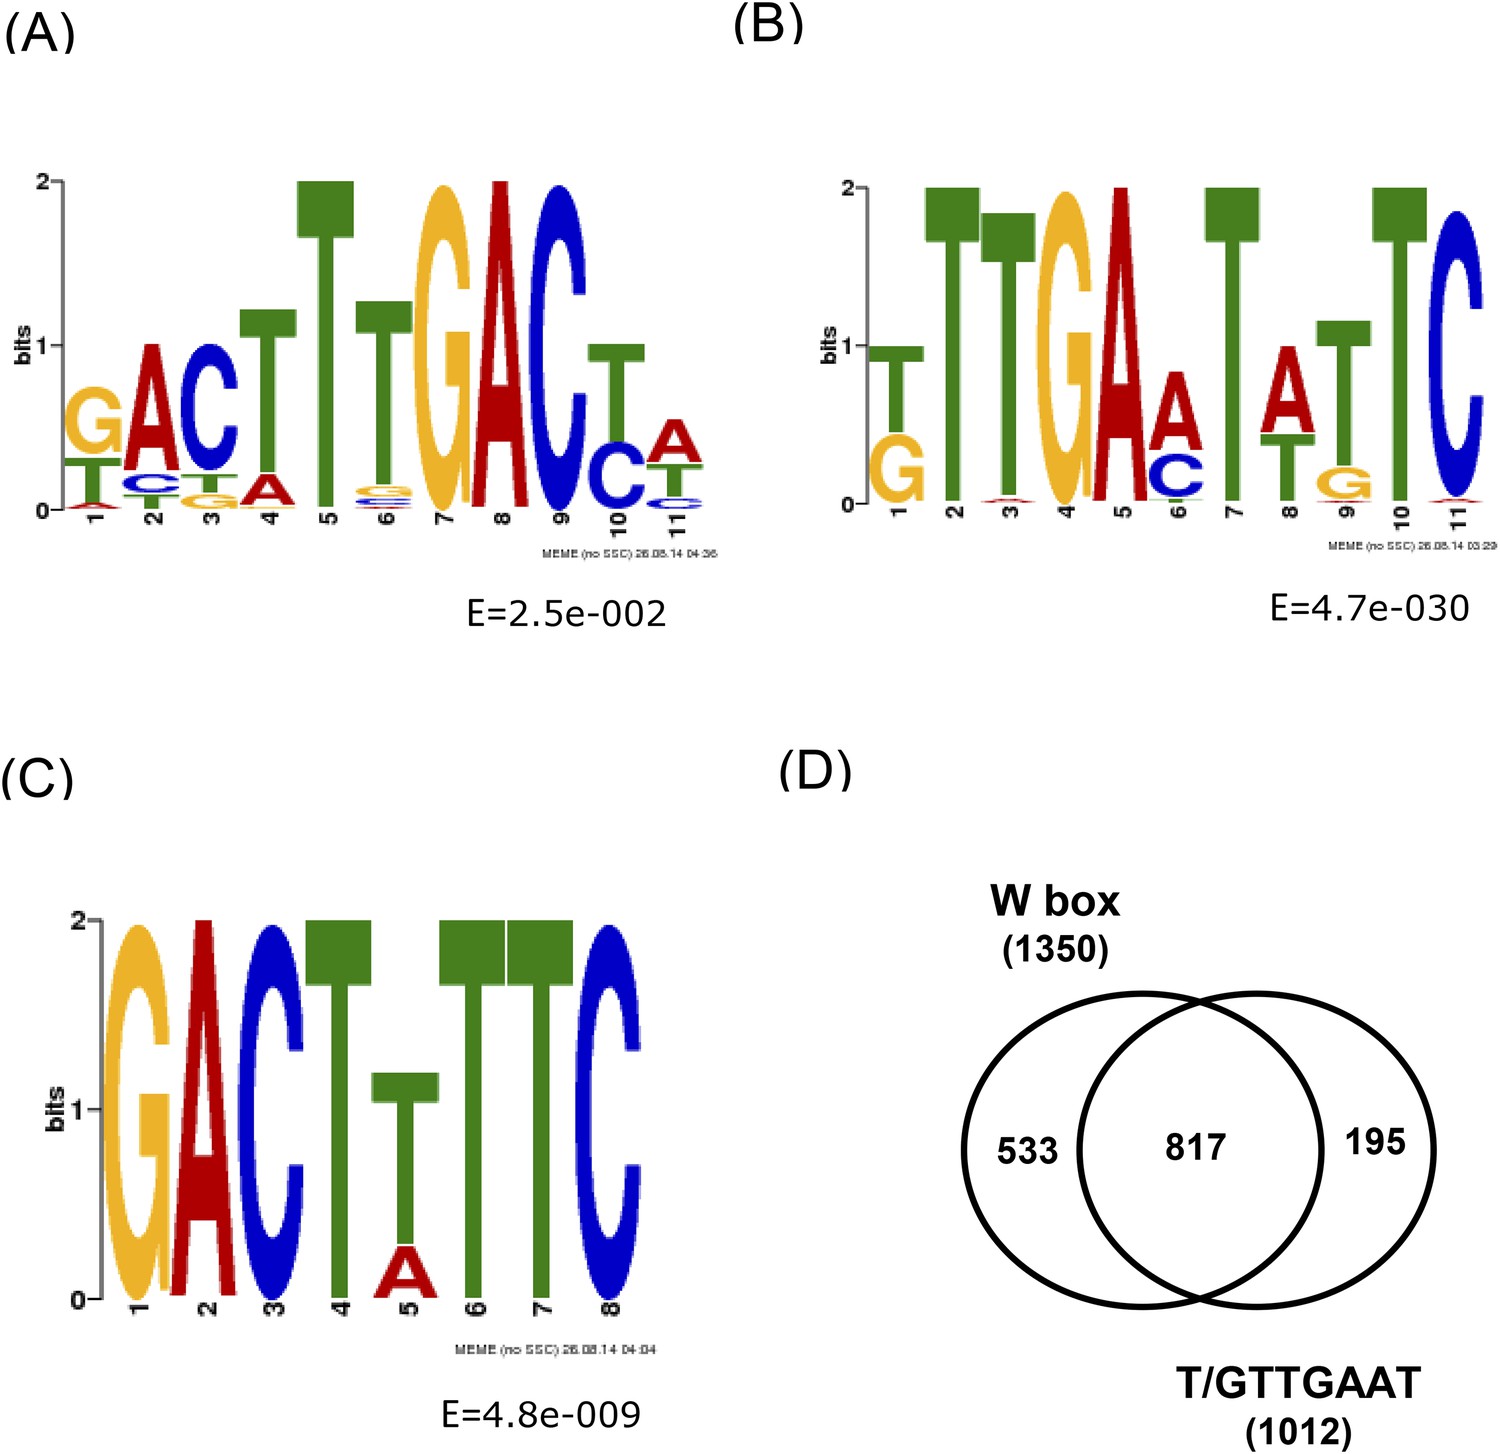
Conserved DNA elements within the 500 bp WRKY33 binding peak summit regions identified by MEME.
(A) W-box with 5′ extended motifs. (B) W-box with 3′ extended motifs. (C) Additional conserved sequence GACTT/ATTC element. (D) Venn diagram illustrating the number of overlapping peaks containing both the W-box and the newly identified motif T/GTTGAAT.
Figure 1—figure supplement 2
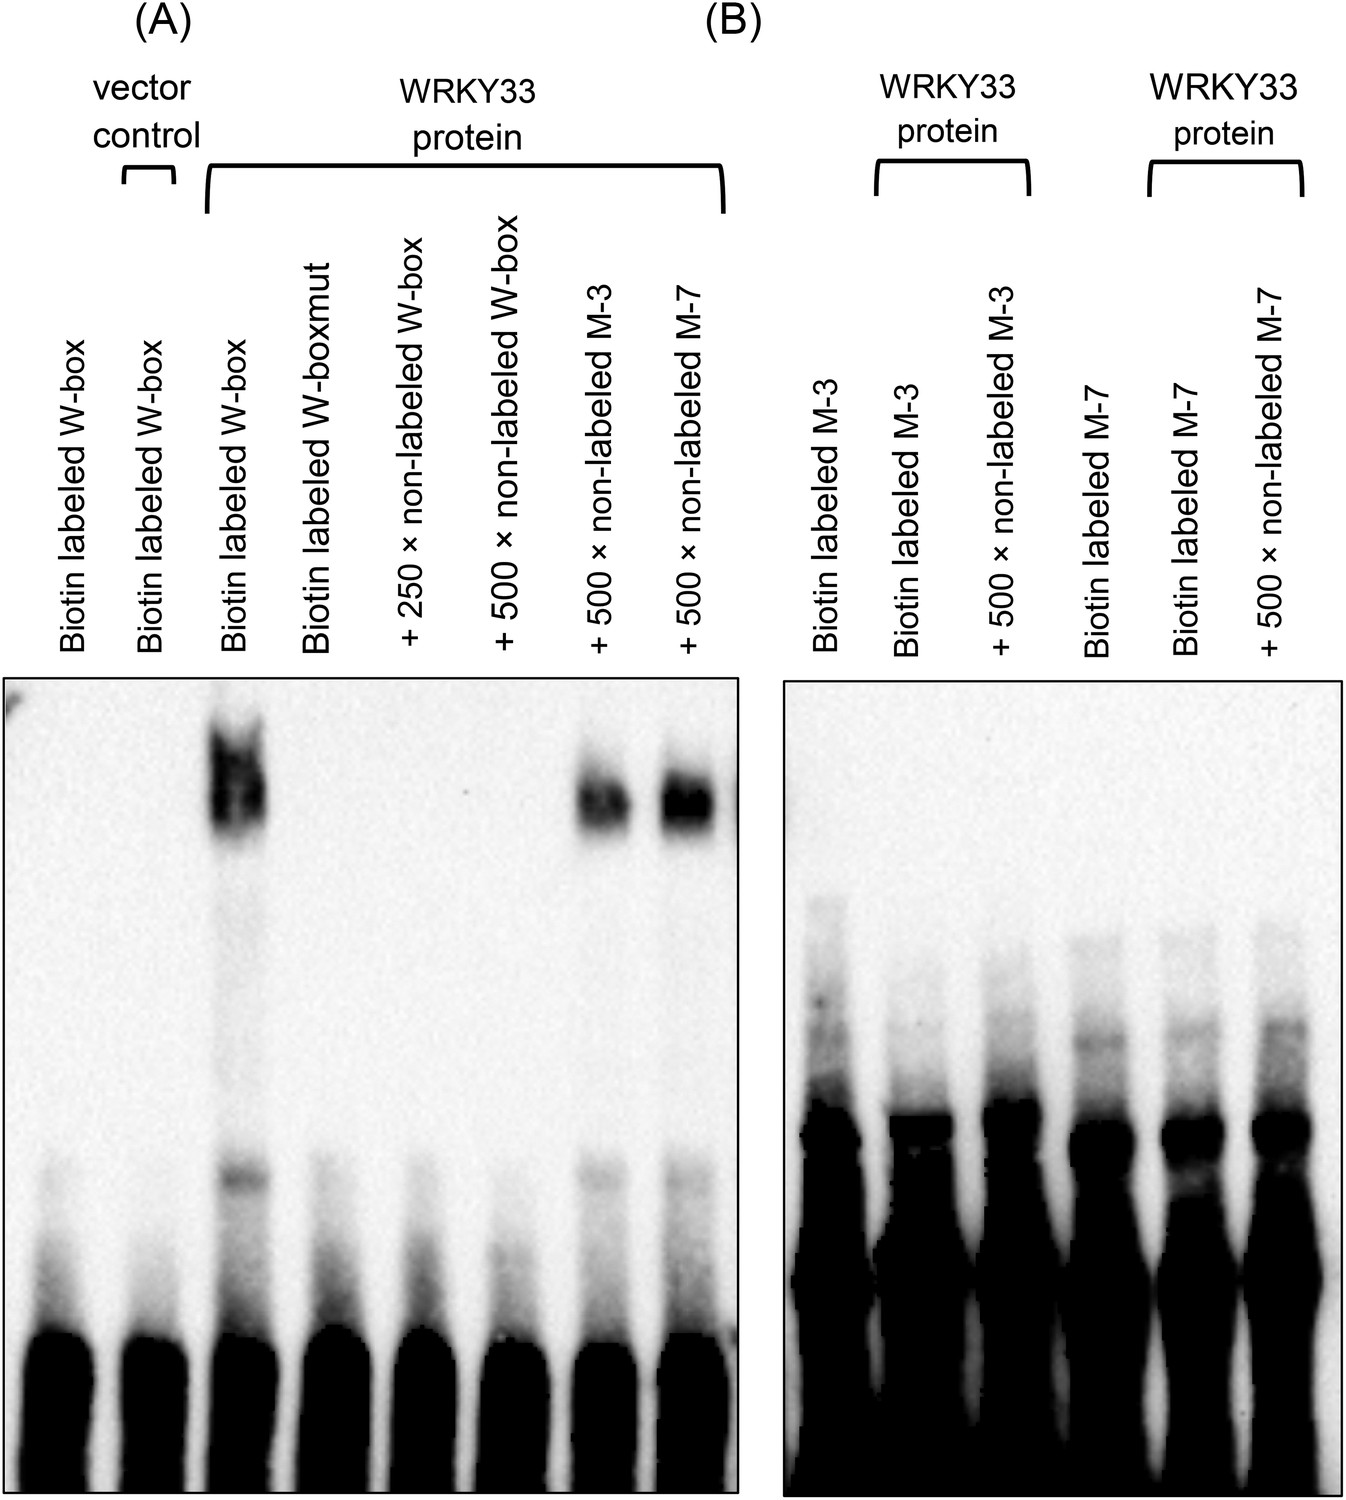
WRKY33 does not bind to the G/TTTGAAT motif.
EMSA was performed using recombinant WRKY33 and biotin labeled DNA probes. A DNA oligonucleotide containing 3 W-box elements (Mao et al., 2011) or a W-box mutated version (W-boxmut) hereof served as a positive and as a negative control, respectively (A). The 45 bp M-3 was derived from the PROPEP3 (At5g64905) gene promoter and contained three copies of the G/TTTGAAT motif, whereas the 40 bp M-7 was derived from the WAKL7 (At1g16090) gene promoter and contained one G/TTTGAAT motif. No binding of WRKY33 was observed to the W-boxmut probe and to both the M-3 and M-7 probes (B). Specificity of W-box binding was shown by competition assays using 250-fold (W-box) and 500-fold (W-box; M-3, M-7) excess of unlabeled probes. Protein lysates derived from IPTG-induced bacteria harboring the empty expression vector pMCSG48 served as an additional control.
Figure 2 with 2 supplements
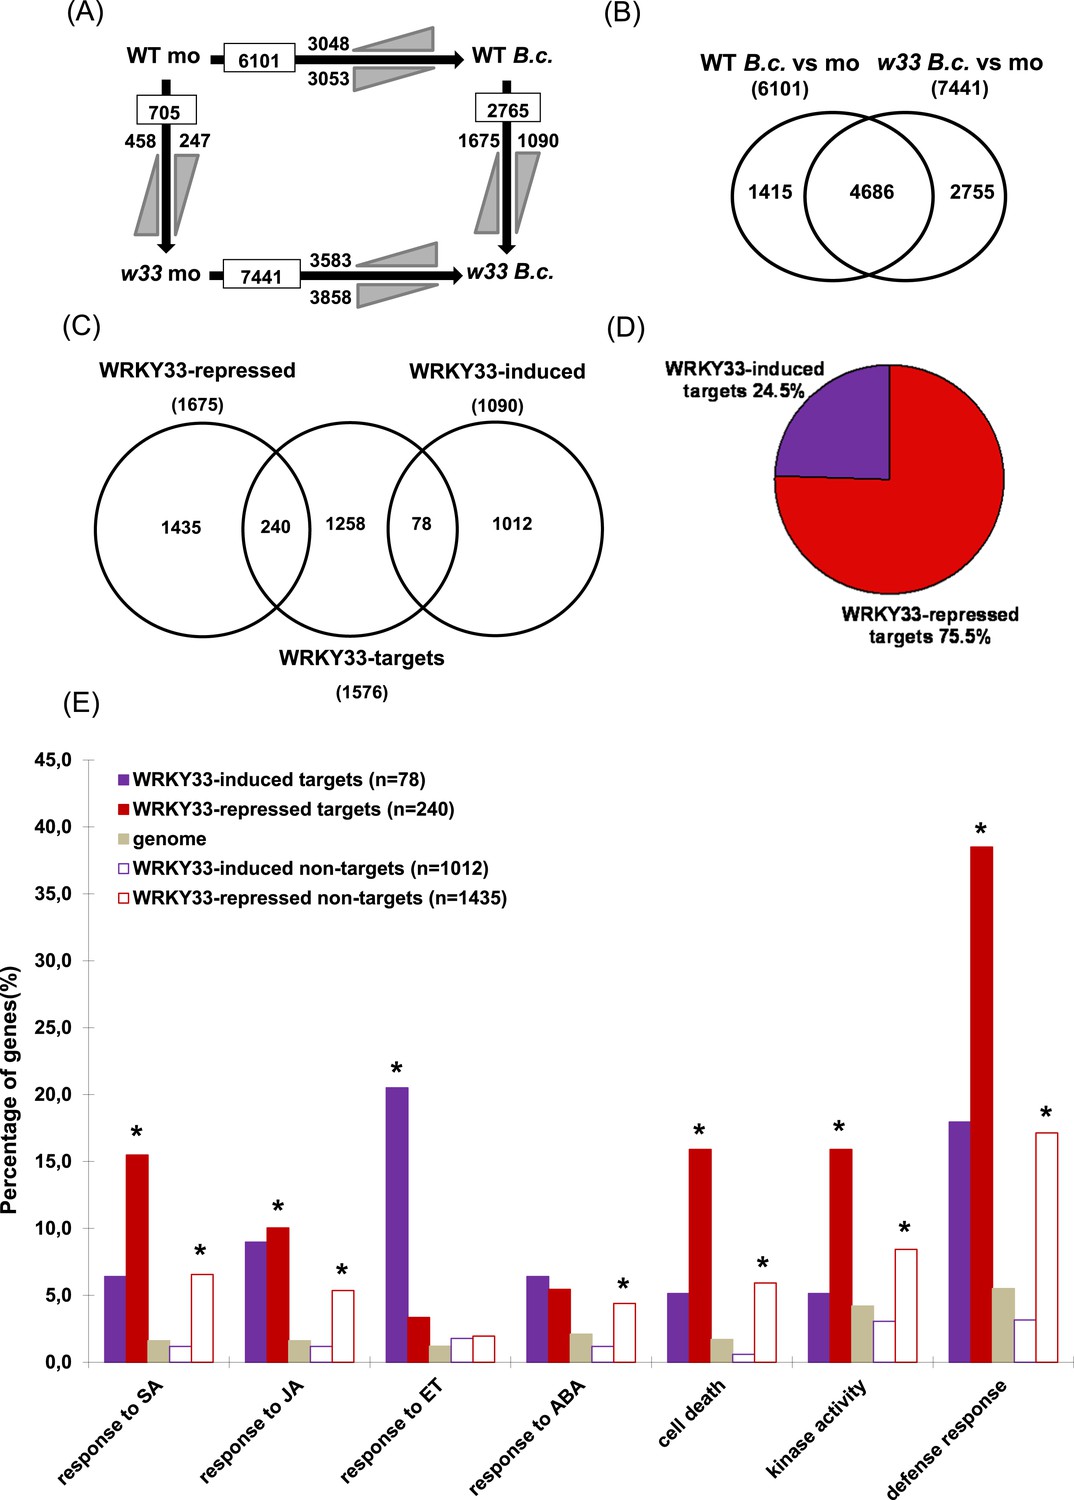
WRKY33-regulated direct target genes in response to B. cinerea 2100 infection.
(A) Number of differentially expressed genes (≥ twofold; p ≤ 0.05) between WT and wrky33 (w33) at 14 hr after mock treatment (mo) or spray inoculation with spores of B. cinerea 2100 (B.c.) identified by RNA-seq. Indicated are total numbers (boxed) and numbers of up-regulated ( ) and down-regulated genes (
 ) between treatments or genotypes. (B) Venn diagram illustrating the total numbers and the number of common genes affected in WT and wrky33 14 hr post B. cinerea 2100 inoculation. (C) Venn diagram showing the numbers of genes common to WRKY33-regulated genes and WRKY33 target genes. (D) Percentage of WRKY33-repressed and WRKY33-induced target genes (in total 318). (E) Enrichment of specific Gene Ontology (GO) terms related to defense response, kinase activity, cell death, and hormone responses among WRKY33-regulated target and non-target genes (compared to the overall genome). The y-axis indicates the percentages of genes associated to each GO category in each gene set. Asterisks indicate significant enrichment (adj. p value < 0.05) of genes associated to the respective GO term within a gene set as determined by GO term enrichment analysis with goseq (null distribution approximated as Wallenius distribution; correction for potential count biases via probability weighting).
Figure 2—figure supplement 1
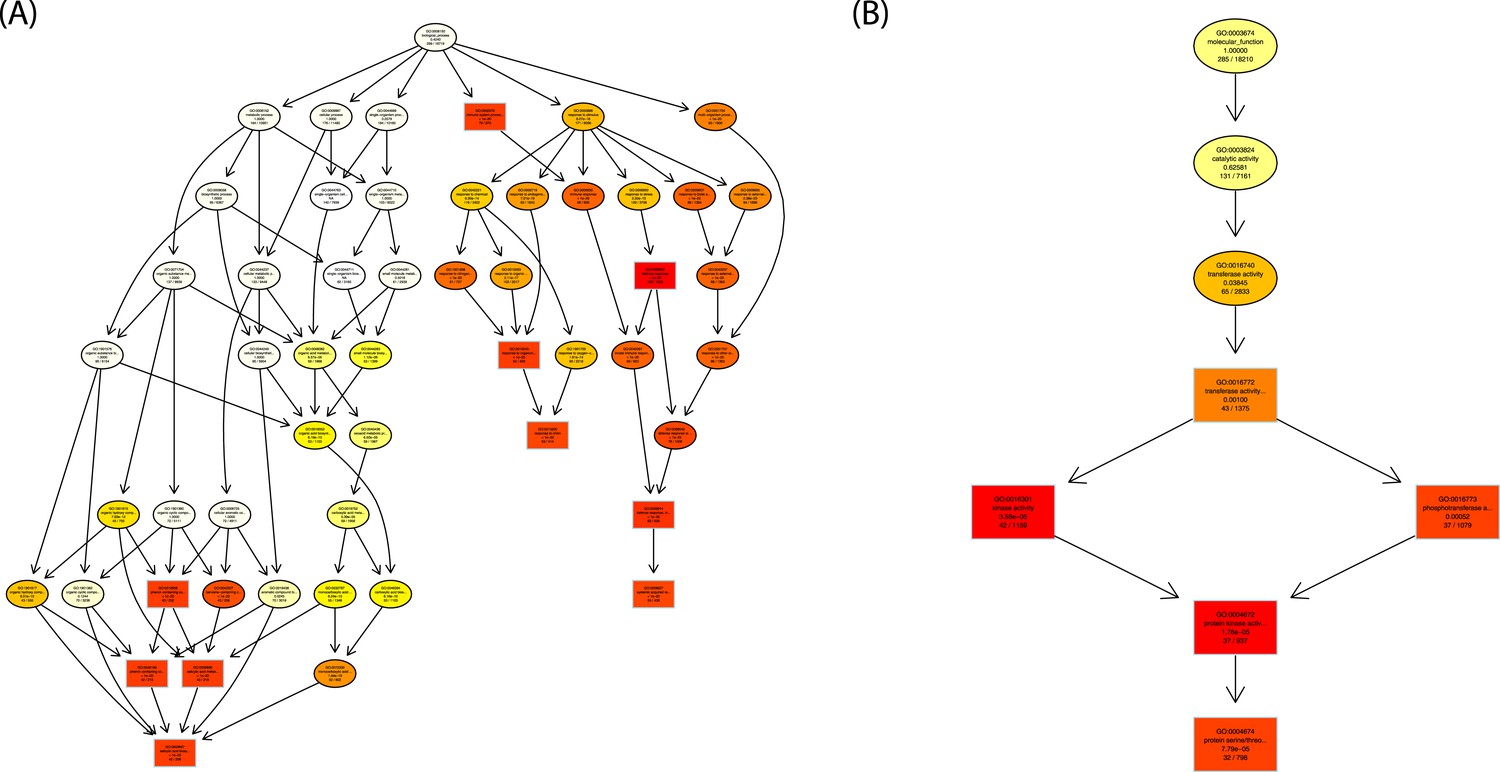
GO graph visualization of top GO terms enriched among WRKY33-regulated WRKY33 target genes.
(A) GO sub-graph induced by the top 10 GO terms in the category ‘Biological Process’. (B) GO sub-graph induced by the top 5 GO terms in the category ‘Molecular Function’. Boxes indicate the 10 (A) and 5 (B) most significant terms, respectively. Box color represents the relative significance, ranging from dark red (most significant) to light yellow (least significant). GO term enrichment was determined using goseq, with the null distribution approximated as Wallenius distribution and correcting for potential count biases via probability weighting.
Figure 2—figure supplement 2
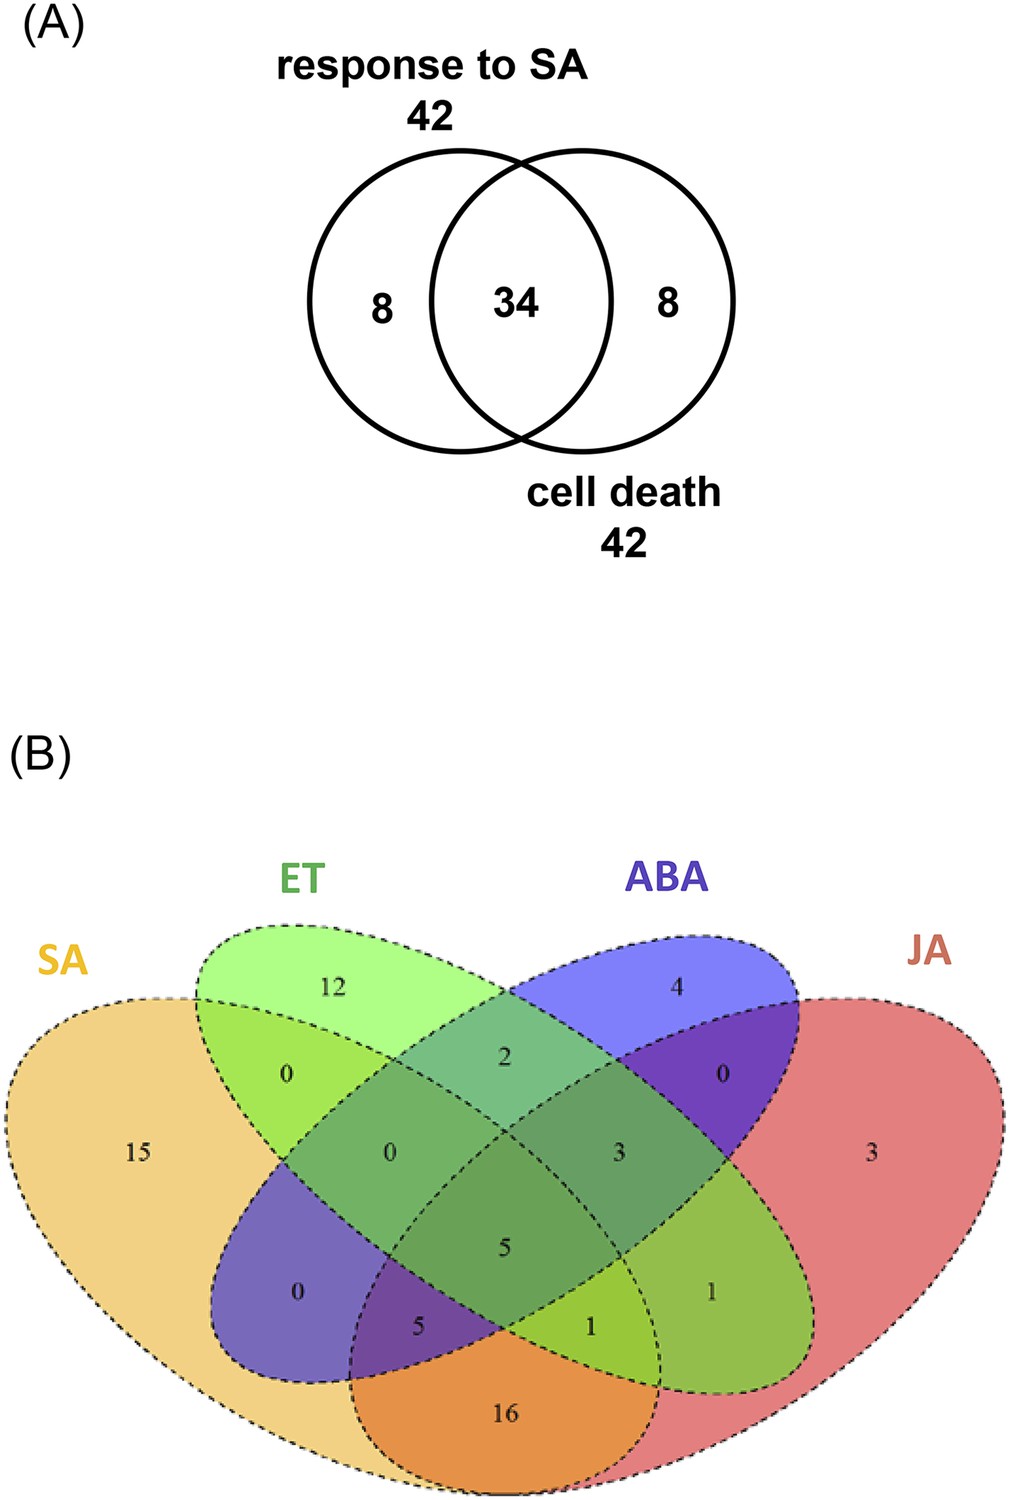
Analysis of WRKY33-regulated target genes associated to GO-terms ‘hormone responses and cell death’.
(A) Venn diagram showing the overlap between the WRKY33-regulated target genes responsive to SA and associated with cell death. (B) The overlap of WRKY33-regulated target genes associated with the hormone pathways SA, ET, ABA, and JA.
Figure 3 with 1 supplement
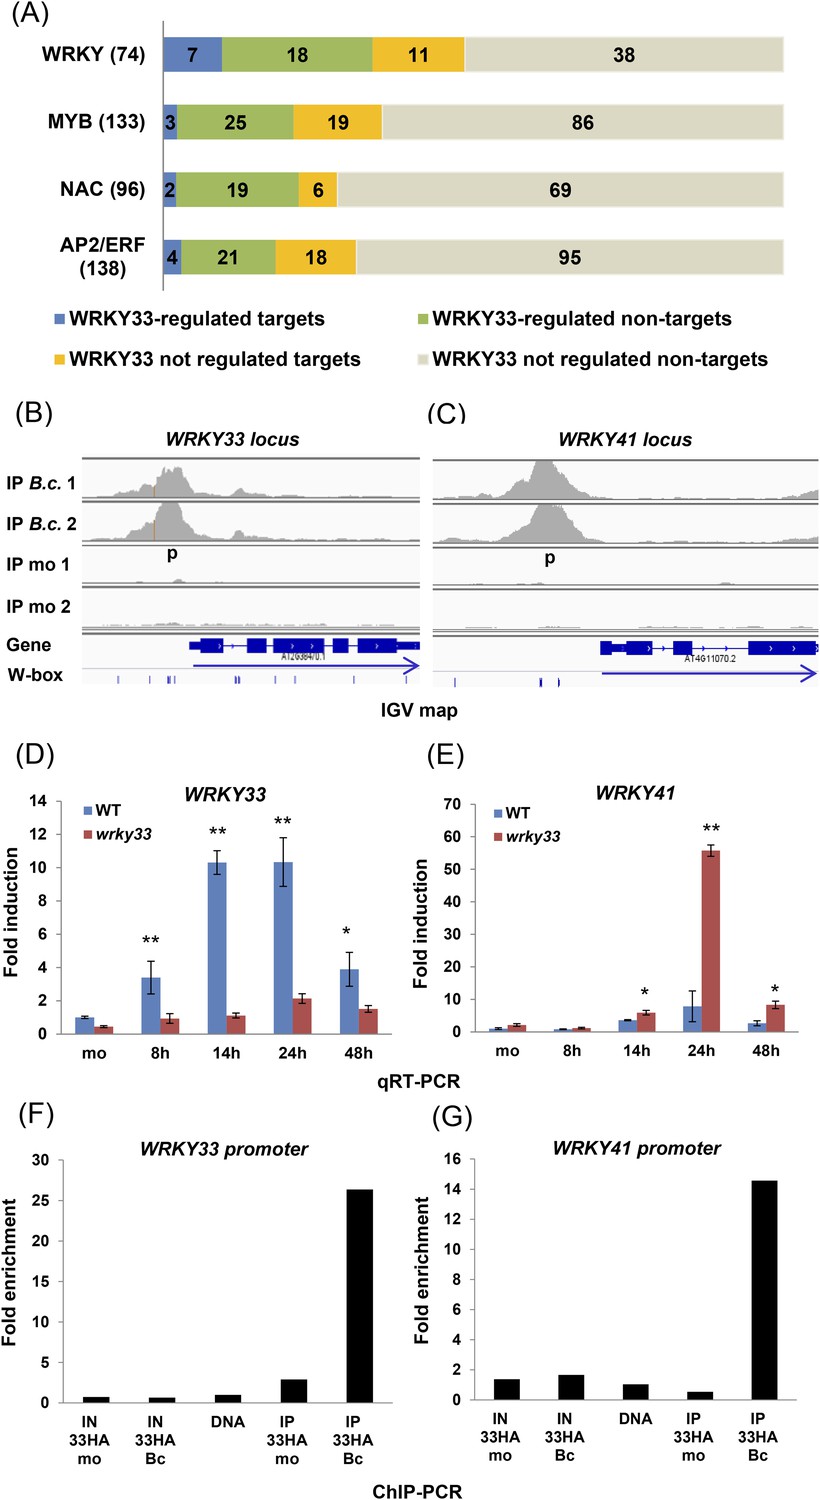
WRKY33-regulated transcription factor families commonly associated with stress responses.
(A) WRKY, MYB, NAC, and AP2/ERF TF family genes are dominant targets of WRKY33 after B. cinerea 2100 infection. The total number of members for each TF family is given in parenthesis next to name. The number of WRKY33 directly or indirectly regulated family members are indicated. (B, C) Integrative Genomics Viewer (IGV) images of ChIP-seq data revealing high infection-dependent WRKY33 binding at the promoters of Arabidopsis WRKY33 (B) and WRKY41 (C). Images for mock and B.c. treatment of both biological repetitions are shown (1 and 2). Structure of the targeted genes is indicated below along with the position of all W-box motifs within the loci. Arrows indicate direction of transcription. (D, E) qRT-PCR analysis of B. cinerea 2100-induced expression of WRKY33 (D) and WRKY41 (E) in WT and wrky33 mutant plants at indicated time points post fungal spore application. All data were normalized to the expression of At4g26410 and fold induction values of all genes were calculated relative to the expression level of mock treated (mo) WT plants set to 1. Error bars represent SD of three biological replicates. Asterisks indicate significant differences between WT and wrky33 (*, p < 0.05; **, p < 0.001; two-tailed t-test). (F, G) Validation of ChIP-seq data by ChIP-qPCR showing WRKY33 binding to its own promoter region (F) and to the WRKY41 promoter (G). WRKY33-HA (33HA) plants were spray inoculated with spores of B. cinerea 2100 (Bc) or mock treated (mo) for 14 hr. Input DNA before immune precipitation (IN) and immune-precipitated DNA using an anti-HA antibody (IP) was analyzed by qPCR employing gene-specific primer pairs (p) indicated in the IGV graph. Shown is the fold enrichment of bound DNA relative to a non-bound DNA fragment from At2g04450. As a control for primer efficiency purified genomic DNA was included in the analysis. Each ChIP experiment was repeated at least twice with similar results.
Figure 3—figure supplement 1
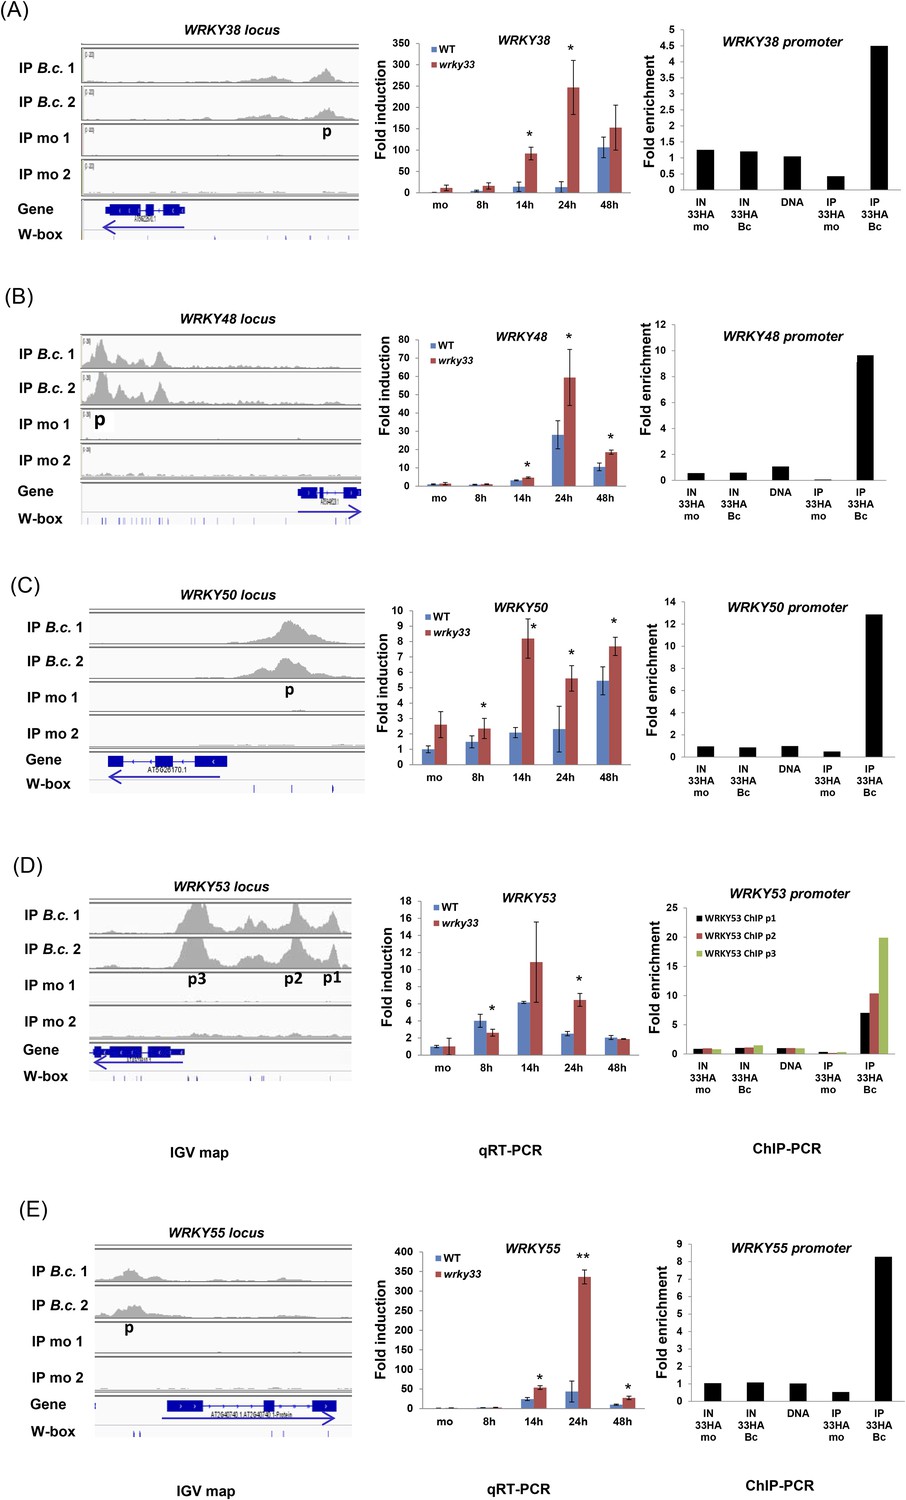
Validation of WRKY33 directly regulated WRKY genes.
Shown for each of the WRKY genes 38 (A), 48 (B), 50 (C), 53(D), and 55 (E), are; (i) the ChIP-seq data, visualized in the IGV browser, revealing strong infection-dependent WRKY33 enrichment at the corresponding promoter, (ii) qRT-PCR analysis of B. cinerea 2100-induced expression of the respective WRKY gene in WT and wrky33 at indicated time points post spore inoculation, and (iii) ChIP-qPCR confirmation of WRKY33 binding to the respective WRKY promoter. Amplicons used are indicated in the IGV images (p, p1, p2, p3). For detailed descriptions on how qRT-PCR and ChIP-qPCR were performed see legend to Figure 3.
Figure 4
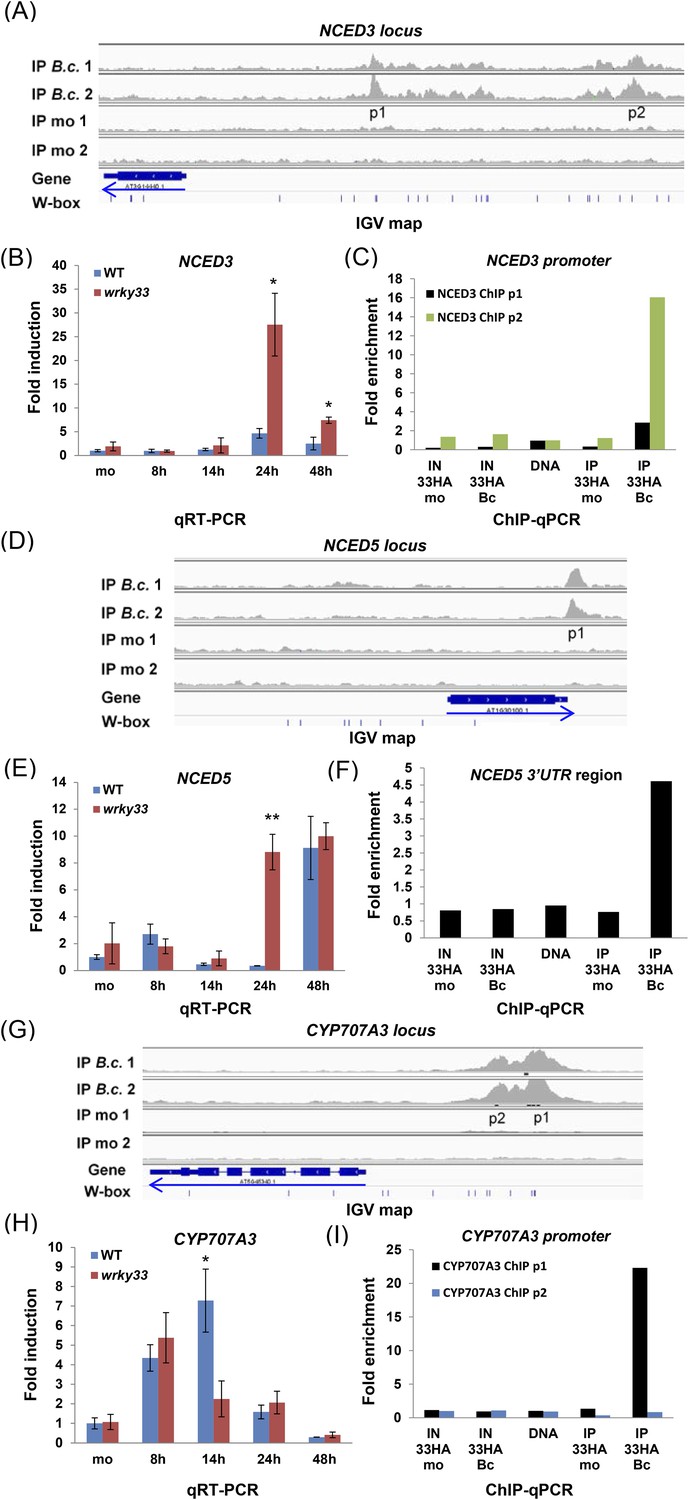
WRKY33 directly regulates target genes encoding ABA biosynthetic (NCED3, NCED5) and metabolic (CYP707A3) enzymes by binding to their promoters or 3′UTR after B. cinerea 2100 treatment.
(A, D, G) IGV visualization of ChIP-seq data revealing infection-dependent WRKY33 enrichment at the Arabidopsis NCED3 (A), NCED5 (D) and CYP707A3 (G) loci with features described in Figure 3. (B, E, H) qRT-PCR analysis of B. cinerea 2100-induced expression of NCED3 (B) NCED5 (E) and CYP707A3 (H) in WT and wrky33 as described in Figure 3. (C, F, I) Validation of the ChIP-seq data for WRKY33 binding to the promoters of NCED3 (C, with primer pairs p1 and p2) and CYP707A3 (I), and to the 3′UTR of NCED5 (F) performed as described the legend to Figure 3.
Figure 5 with 4 supplements
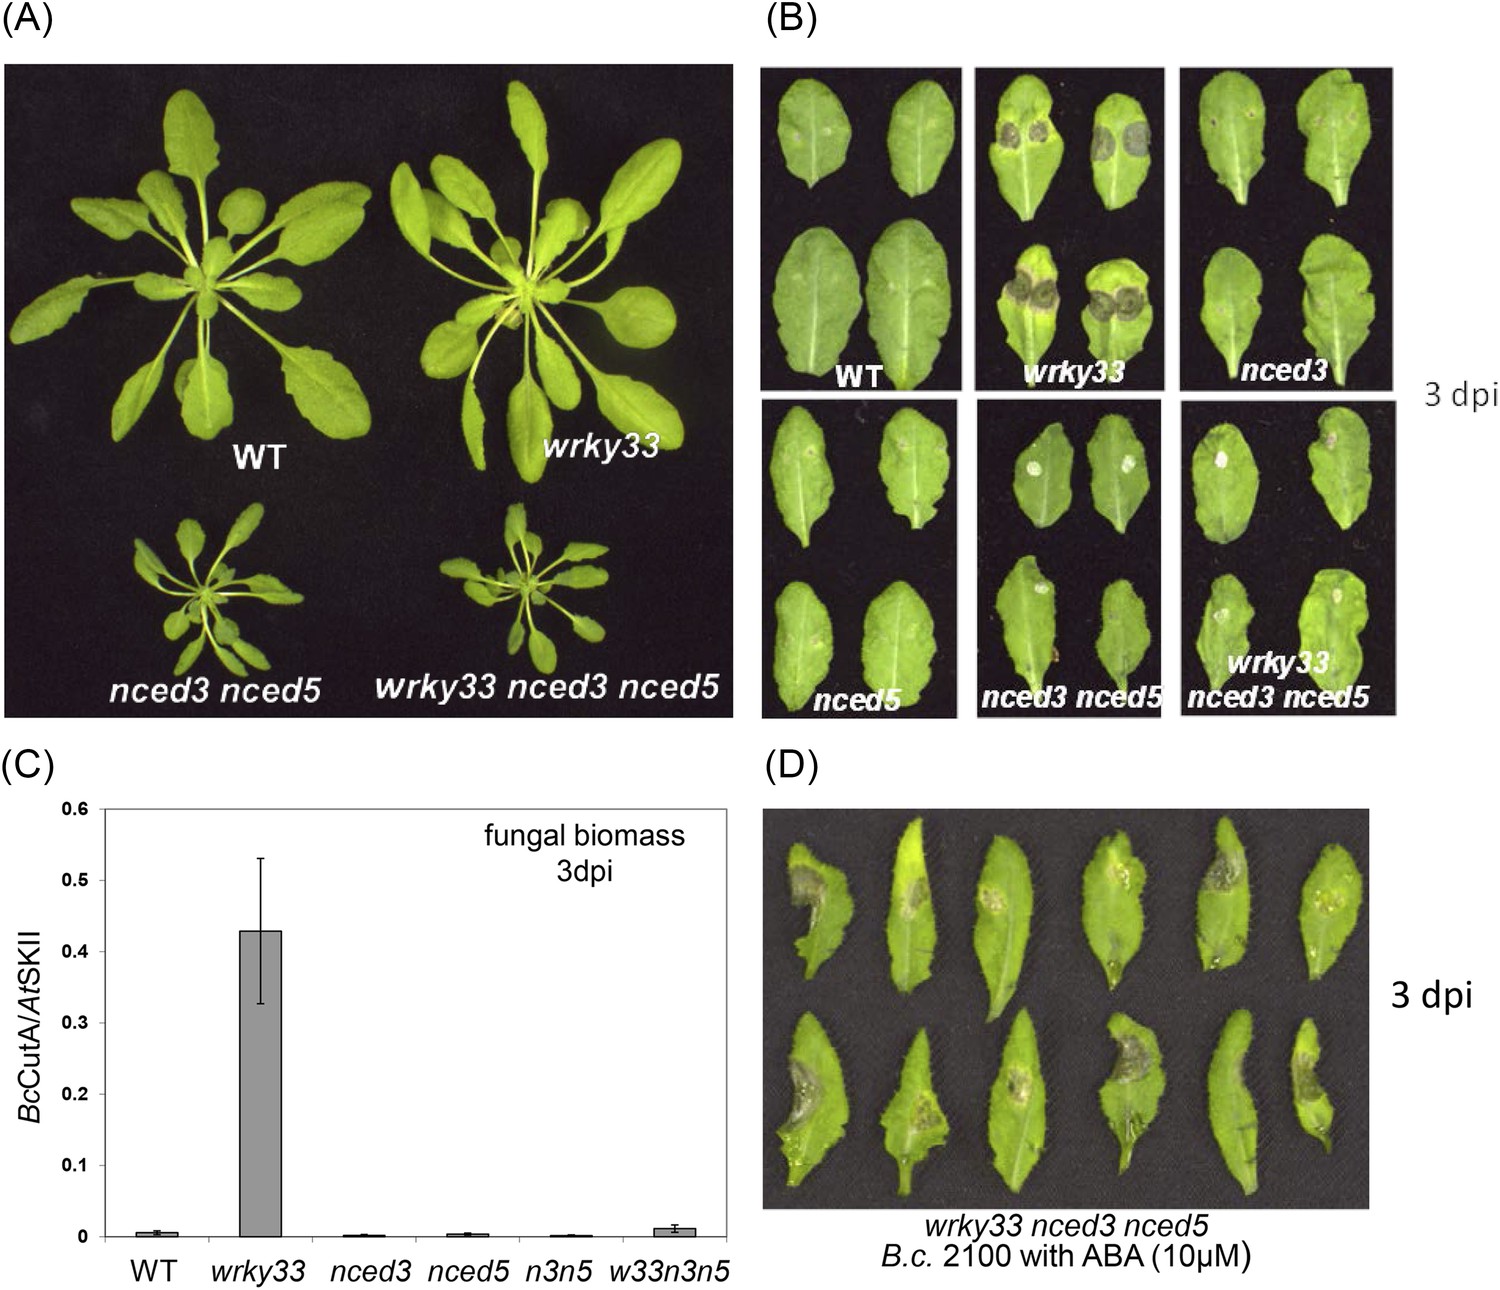
WRKY33 controls ABA-mediated plant susceptibility to B. cinerea 2100.
(A) Growth phenotypes of WT, wrky33, nced3 nced5, and wrky33 nced3 nced5 Arabidopsis plants at 4 weeks under short day conditions. (B) B. cinerea infection phenotypes 3 days post inoculation of WT, wrky33, nced3, nced5, nced3 nced5, and wrky33 nced3 nced5. (C) B. cinerea biomass quantification on indicated Arabidopsis genotypes. For fungal biomass determination, the relative abundance of B. cinerea and Arabidopsis DNA was determined by qPCR employing specific primers for BcCutinase A and AtSKII, respectively. (D) Exogenous application of ABA (10 μM) directly to infection droplets on wrky33 nced3 nced5 leaves partially rendered plants susceptible to B. cinerea 2100. Upon completion of the infection experiments (3 dpi), leaves were detached and photographed. For the infections, one or two 2 μl droplets containing 2.5 × 10⁵ spores were applied to each leaf.
Figure 5—figure supplement 1
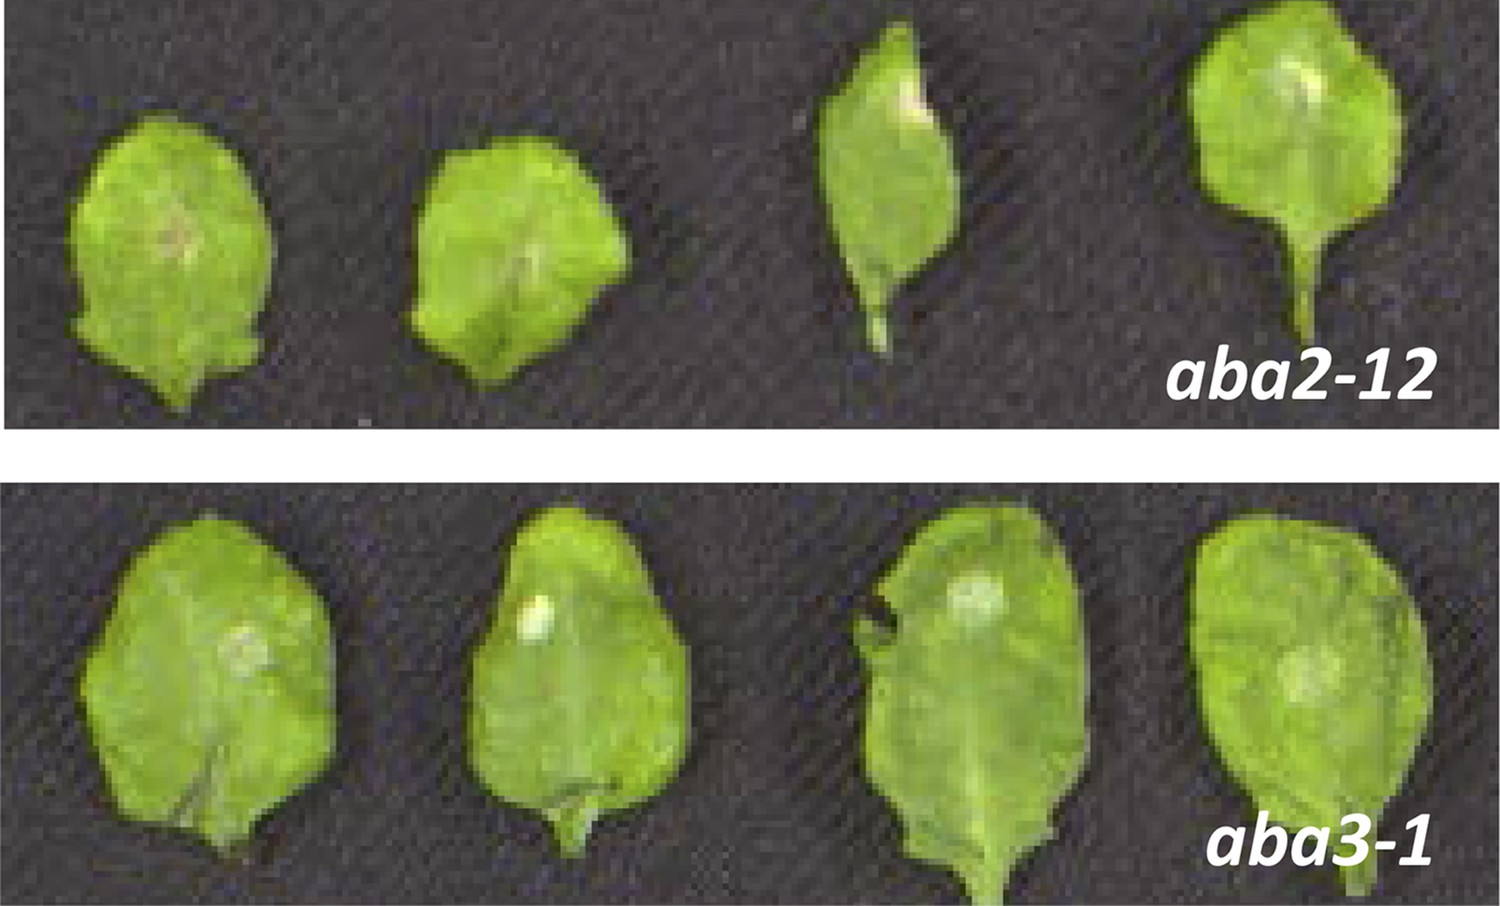
B. cinerea 2100 infection phenotypes of mature 4-week old leaves derived from aba2-12 and aba3-1 mutant plants.
Pictures were taken 3 days post inoculation of two 2 μl droplets containing 2.5 × 10⁵ spores to each leaf (leaves were detached after completion of the experiment for photographic purposes only).
Figure 5—figure supplement 2

B. cinerea 2100 infection phenotypes of mature 4-week old leaves derived from wrky33 nced3 and wrky33 nced5 mutant plants.
Pictures were taken 3 days post inoculation of two 2 μl droplets containing 2.5 × 10⁵ spores to each leaf (leaves were detached after completion of the experiment for photographic purposes only).
Figure 5—figure supplement 3

Phenotype of WT Col-0 plants treated with ABA.
Infection droplets with ABA (10 μM; red arrows) or without ABA (black arrows) were applied to 4-week old leaves. No alteration of the WT resistant phenotype was observed. Picture was taken 3 days post inoculation of two 2 μl droplets containing 2.5 × 10⁵ spores to each leaf.
Figure 5—figure supplement 4
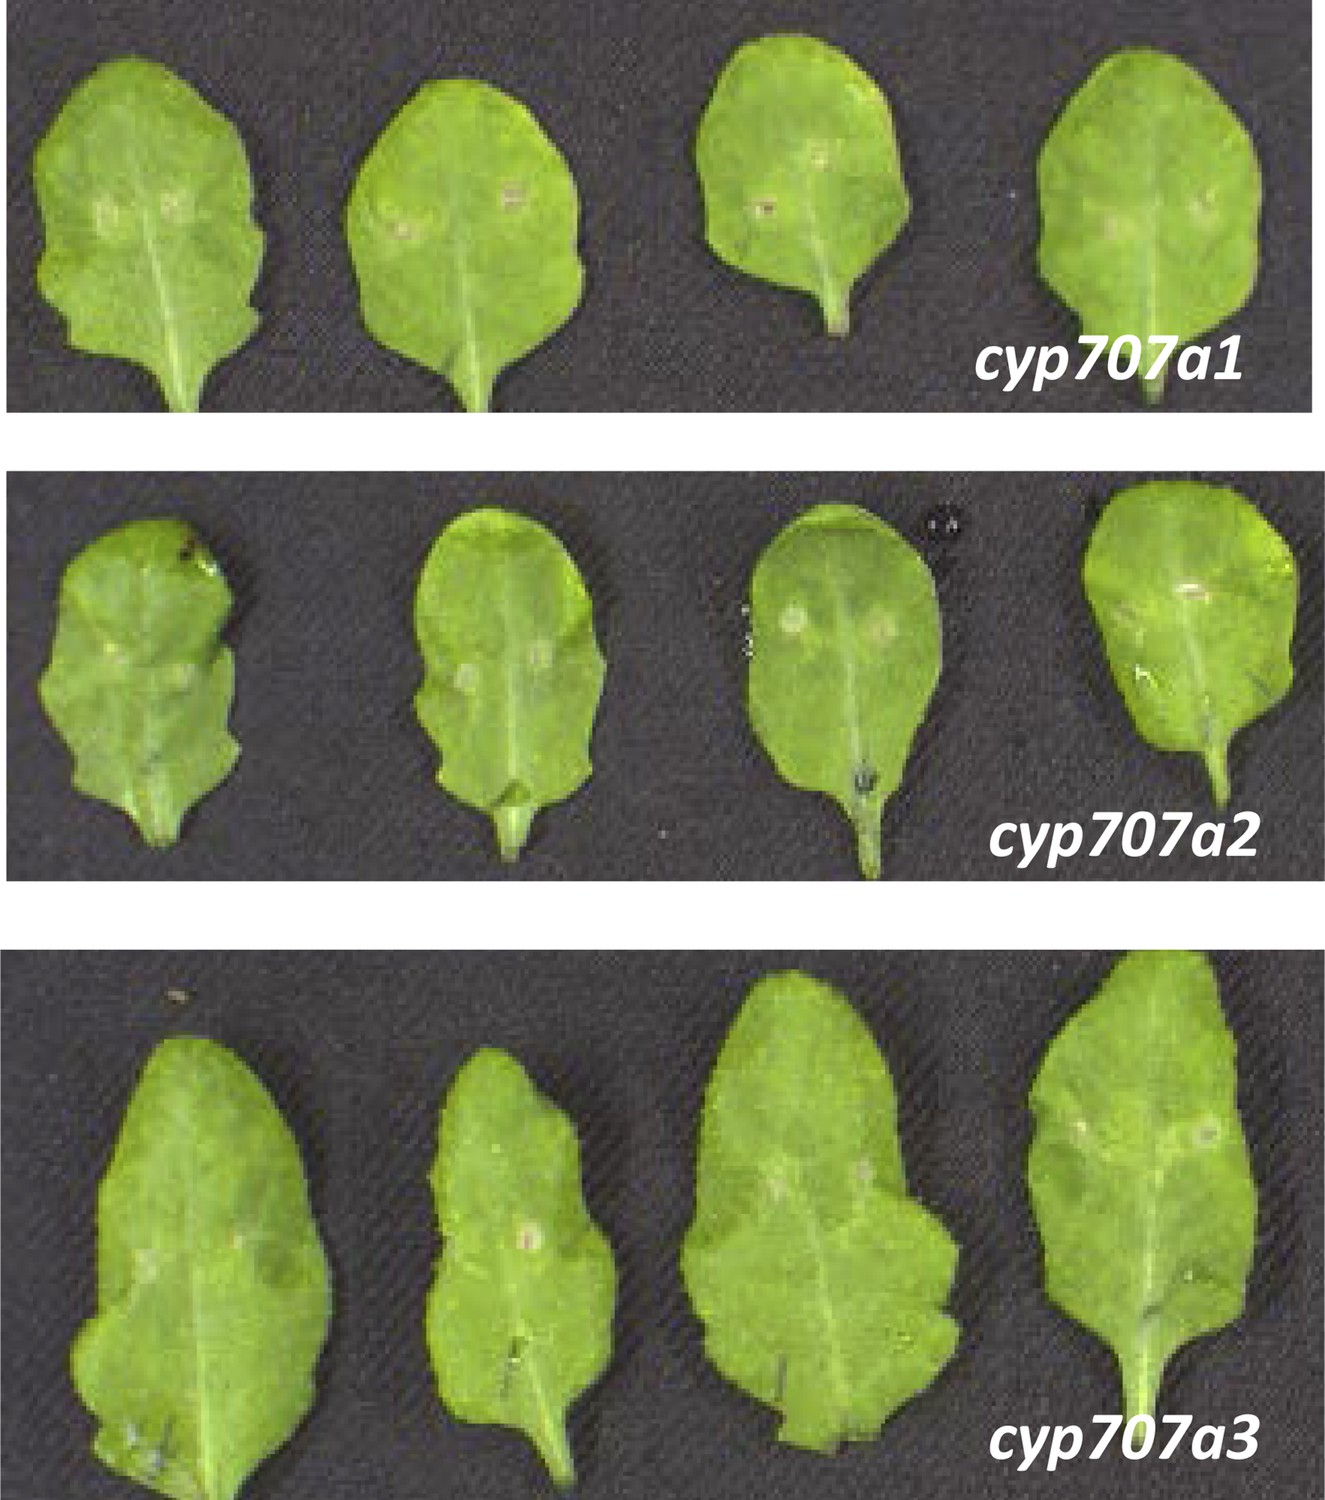
B. cinerea 2100 infection phenotypes of mature 4-week old leaves derived from cyp707a1, cyp707a2 and cyp707a3 mutant plants.
Pictures were taken 3 days post inoculation of two 2 μl droplets containing 2.5 × 10⁵ spores to each leaf (leaves were detached after completion of the experiment for photographic purposes only).
Figure 6
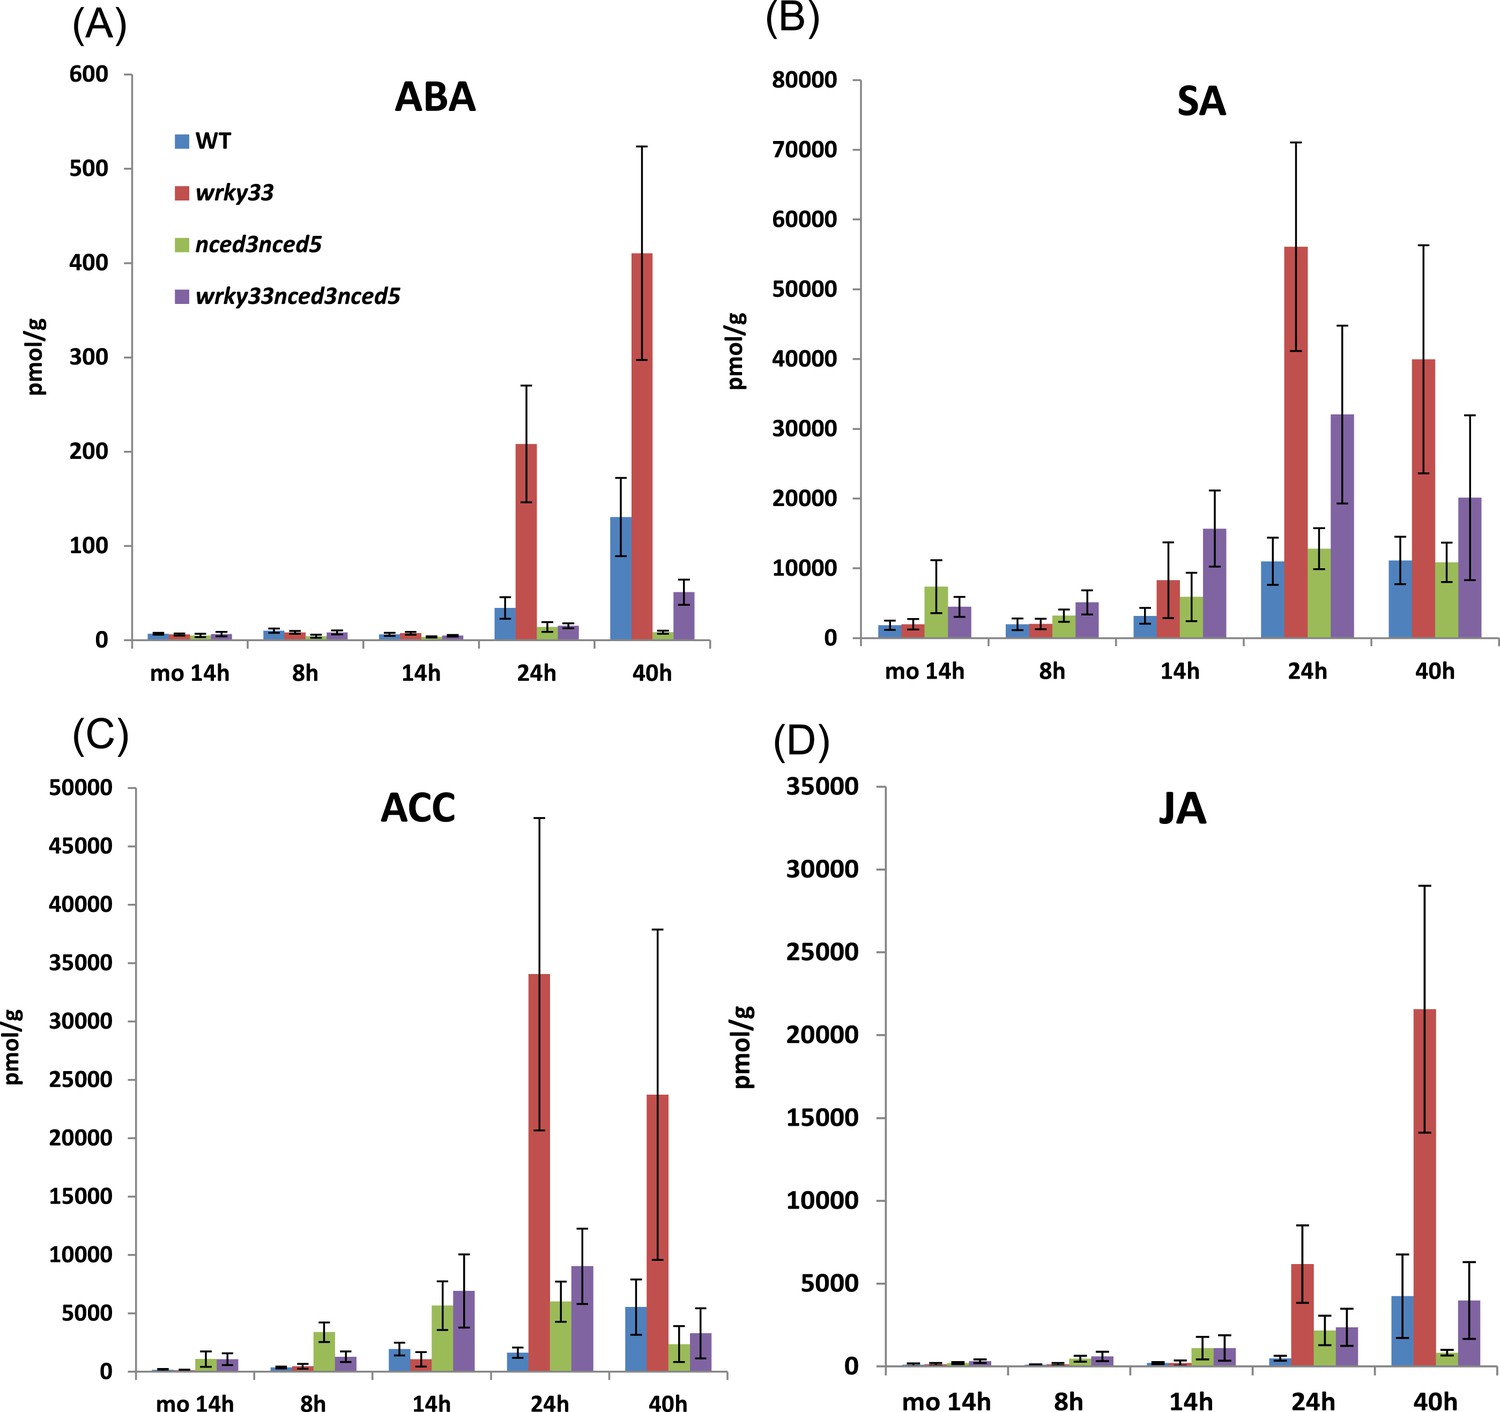
Hormone levels in different genotypes during B. cinerea 2100 infection.
Concentrations of the hormones ABA (A), SA (B), ACC (C), and JA (D) were measured at 8, 14, 24, and 40 hpi in leaves of indicated Arabidopsis genotypes spray inoculated with spores of B. cinerea 2100. Mock treated plants (mo, 14 hr) served as a control. The data show the average values and SDs of the combined data from three independent experiments with up to four replicates each.
Figure 7

Expression of numerous genes up-regulated in infected wrky33 plants showing WT-like levels in the wrky33 nced3 nced5 triple mutant.
Heatmap showing expression levels of genes, differentially expressed in RNA-seq and analyzed by qRT-PCR in WT, wrky33 (w33), nced3 nced5 (n3n5), and wrky33 nced3 nced5 (w33n3n5) after mock treatment or 24 hr post B. cinerea (B.c. 2100) infection. Genes showing high expression levels in wrky33 but reduced levels in the triple mutant are boxed. All values were normalized to the expression of At4G26410.
Figure 8 with 3 supplements
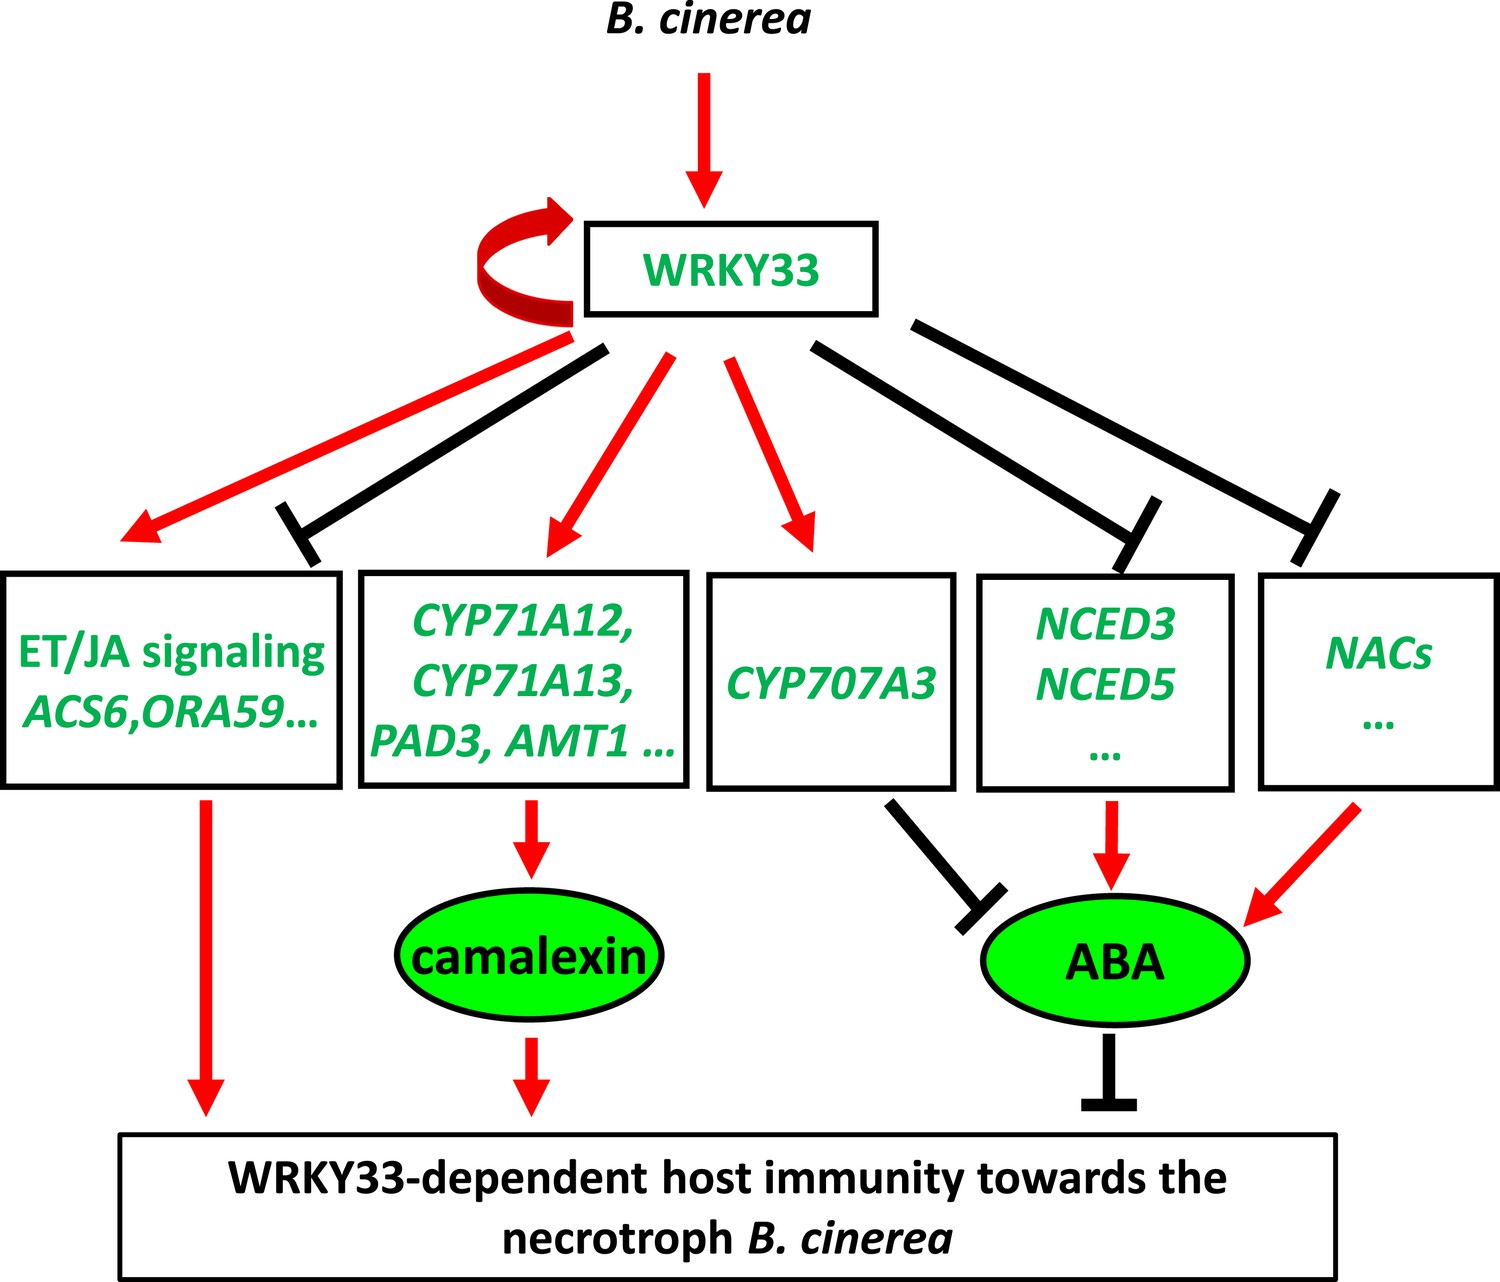
Dual regulatory role of WRKY33 in modulating host defenses to B. cinerea 2100.
WRKY33 positively regulates target genes involved in camalexin biosynthesis thereby contributing to host resistance towards B. cinerea 2100. Target genes involved in ET/JA biosynthesis and signaling can either be positively or negatively regulated by WRKY33. On the other hand, WRKY33 negatively regulates ABA levels by directly targeting and repressing NCED3 and NCED5 expression, or inducing expression of CYP707A3, a gene involved in ABA metabolism. Thus, WRKY33 has both activator and repressor functions that may depend on promoter context. Red arrows indicate positive regulation, whereas black bars indicate negative regulation. The curved red arrow highlights positive feedback regulation of WRKY33 on its own gene promoter.
Figure 8—figure supplement 1
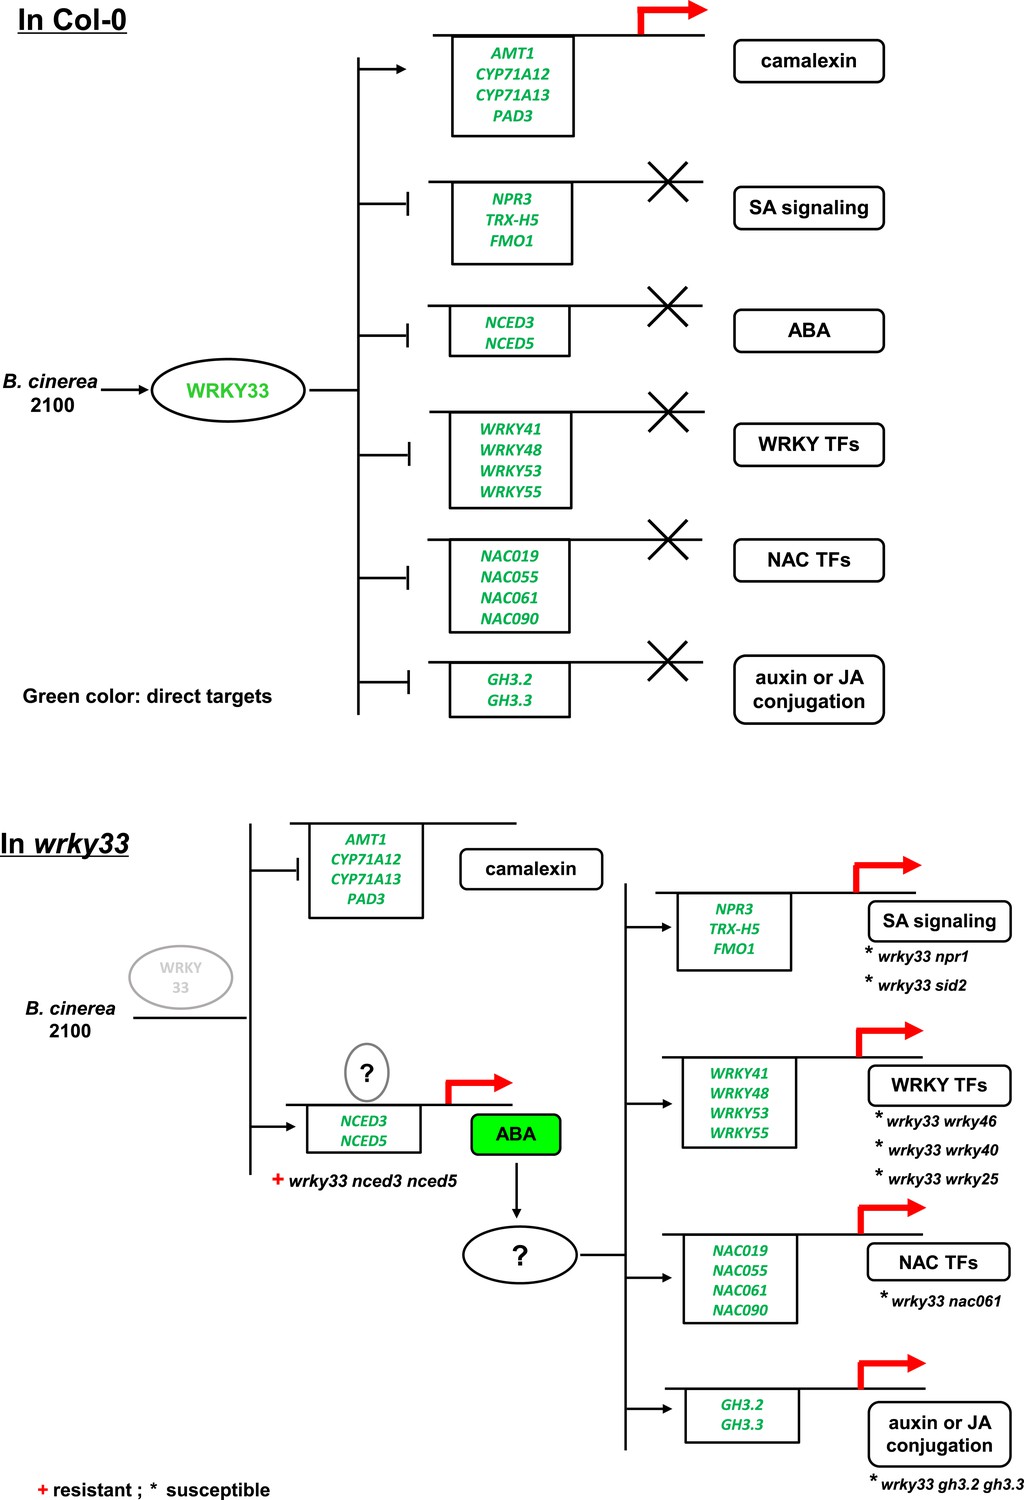
Schematic representation showing WRKY33-dependent host immunity towards the necrotroph B. cinerea 2100 through repressing the ABA network.
In WT Arabidopsis Col-0 plants (upper panel), B. cinerea inoculation induces WRKY33 expression and protein accumulation that controls ABA levels by repressing the ABA biosynthetic target genes NCED3 and NCED5, and by inducing the ABA metabolic gene CYP707A3. WRKY33 also directly or indirectly represses expression of other genes in different hormone signaling pathways as well as genes encoding WRKY, and NAC TFs. WRKY33 also positively affects resistance towards B. cinerea 2100 by directly targeting and inducing the expression of several genes involved in camalexin biosynthesis. In the wrky33 mutant (lower panel), B. cinerea infection fails to activate host camalexin biosynthesis genes and increases ABA levels by up-regulation of NCED3 and NCED5, which activates downstream ABA-dependent genes and ABA signaling. Among the ABA-dependent genes are genes involved in SA signaling, WRKY TFs, NAC TFs, and genes associated with auxin or JA conjugation indicating that ABA may act as a key sub-node in WRKY33-dependent host immunity to B. cinerea. Whereas WT-like resistance is restored in the wrky33 nced3 nced5 triple mutant, all currently tested mutants of WRKY33-regulated genes acting downstream of ABA failed to restore resistance in the wrky33 mutant background (marked by an asterisk). Thus, additional crucial genes causal for WRKY33-dependent resistance to B. cinerea 2100 remain to be discovered, as do ABA signaling components affecting WRKY33 expression (indicated by the question marks). The solid lines with arrows indicate induction or positive modulation, the bar heads indicate suppression. Direct WRKY33 targets are indicated by the green color.
Figure 8—figure supplement 2
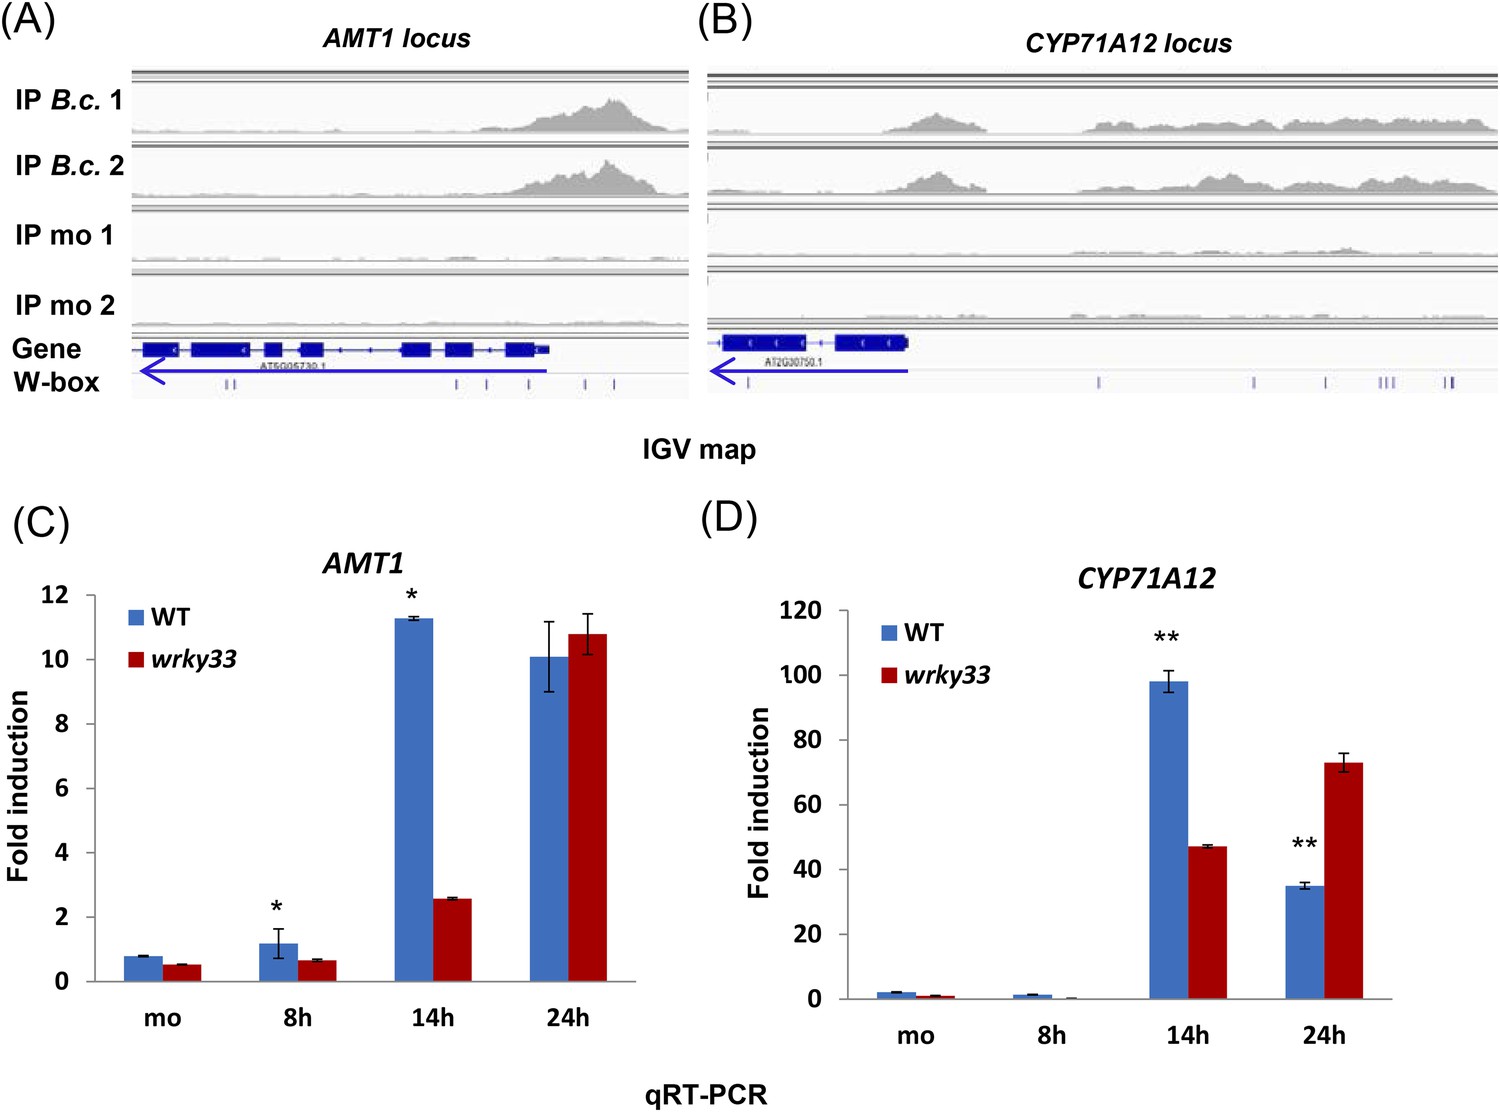
AMT1 and CYP71A12 expression is positively regulated by WRKY33.
(A–B) IGV images of ChIP-seq data revealing high infection-dependent WRKY33 binding at the promoters of AMT1 (A) and CYP71A12 (B). (C–D) qRT-PCR analyses of AMT1 (C) and CYP71A12 (D) in WT and wrky33 at the indicated time points after B. cinerea 2100 spore inoculation. qRT-PCR data were normalized to the expression of At4g26410. Error bars represent SD of three biological replicates (n = 3). Asterisks indicate significant differences between WT and wrky33 (*, p < 0.05; **, p < 0.001; two-tailed t-test).
Figure 8—figure supplement 3
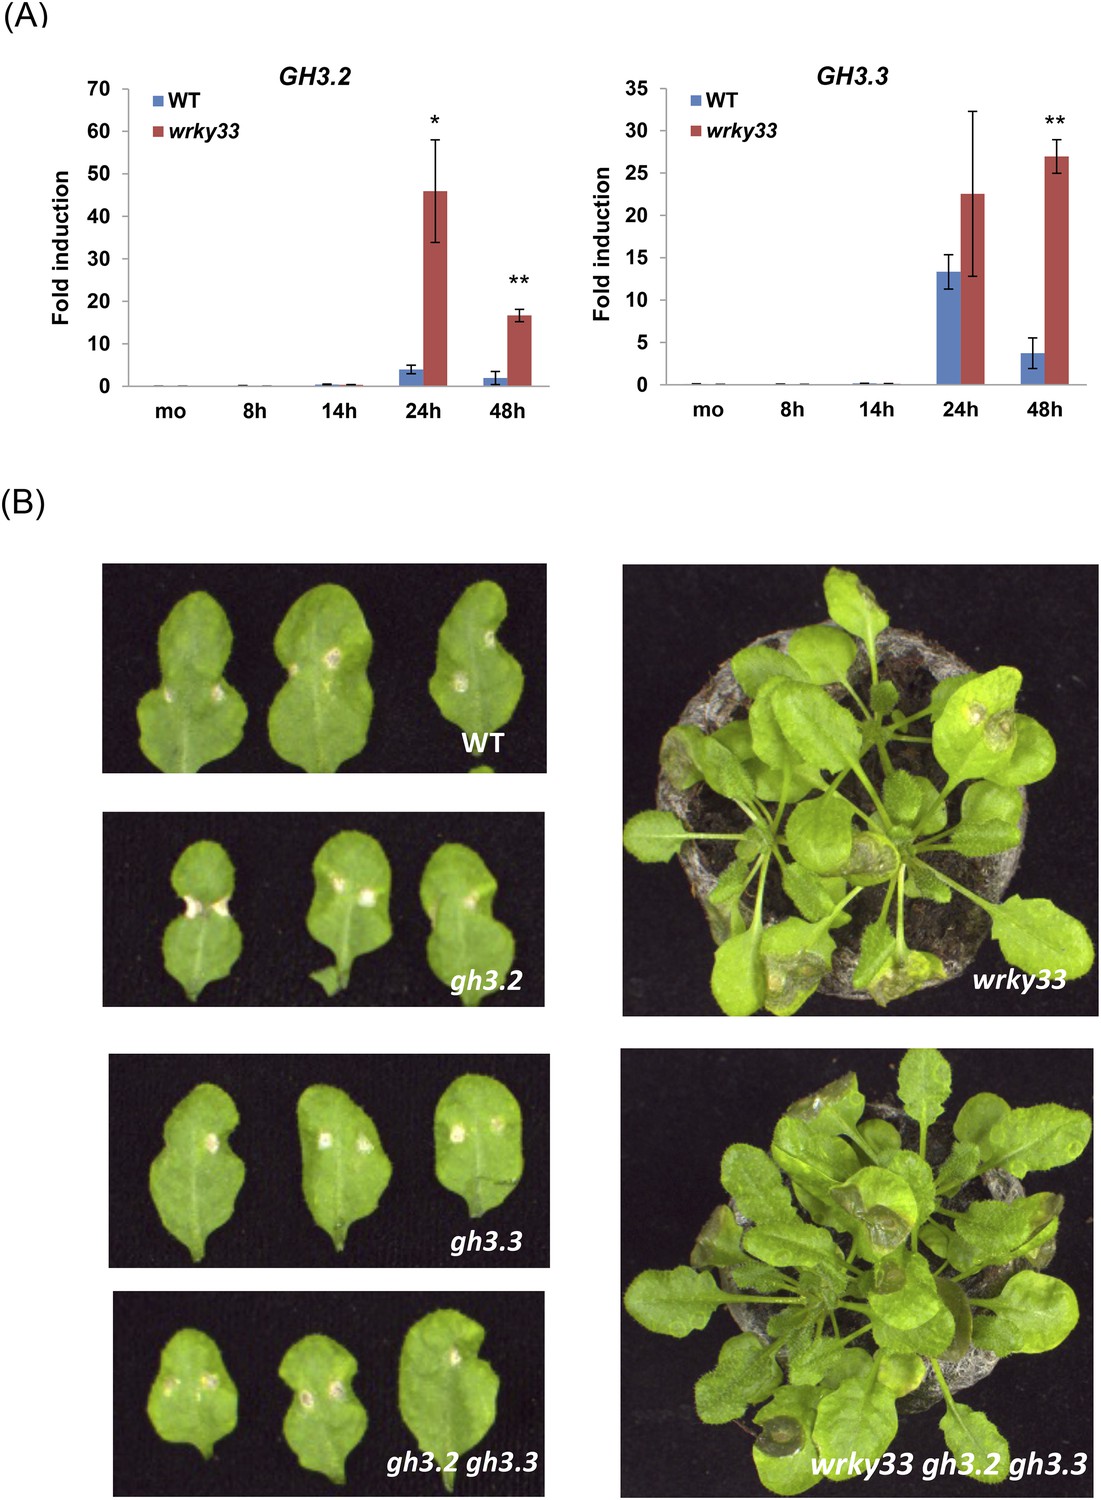
The role of GH3 genes in WRKY33-mediated host resistance to B. cinerea 2100.
(A) Expression levels of GH3.2 and GH3.3 in WT and wrky33 plants determined by qRT-PCR at the indicated time points after B. cinerea 2100 spore inoculation. Data were normalized to the expression of At4g26410. Error bars represent SD of three biological replicates (n = 3). Asterisks indicate significant differences between WT and wrky33 (*, p < 0.05; **, p < 0.001; two-tailed t-test). (B) B. cinerea 2100 infection phenotypes of WT, wrky33, gh3.2, gh3.3, gh3.2 gh3.3, and wrky33 gh3.2 gh3.3 plants are shown at 3 days post infection. Two 2 μl droplets containing 2.5 × 10⁵ spores were applied to each leaf.
Author response image 1
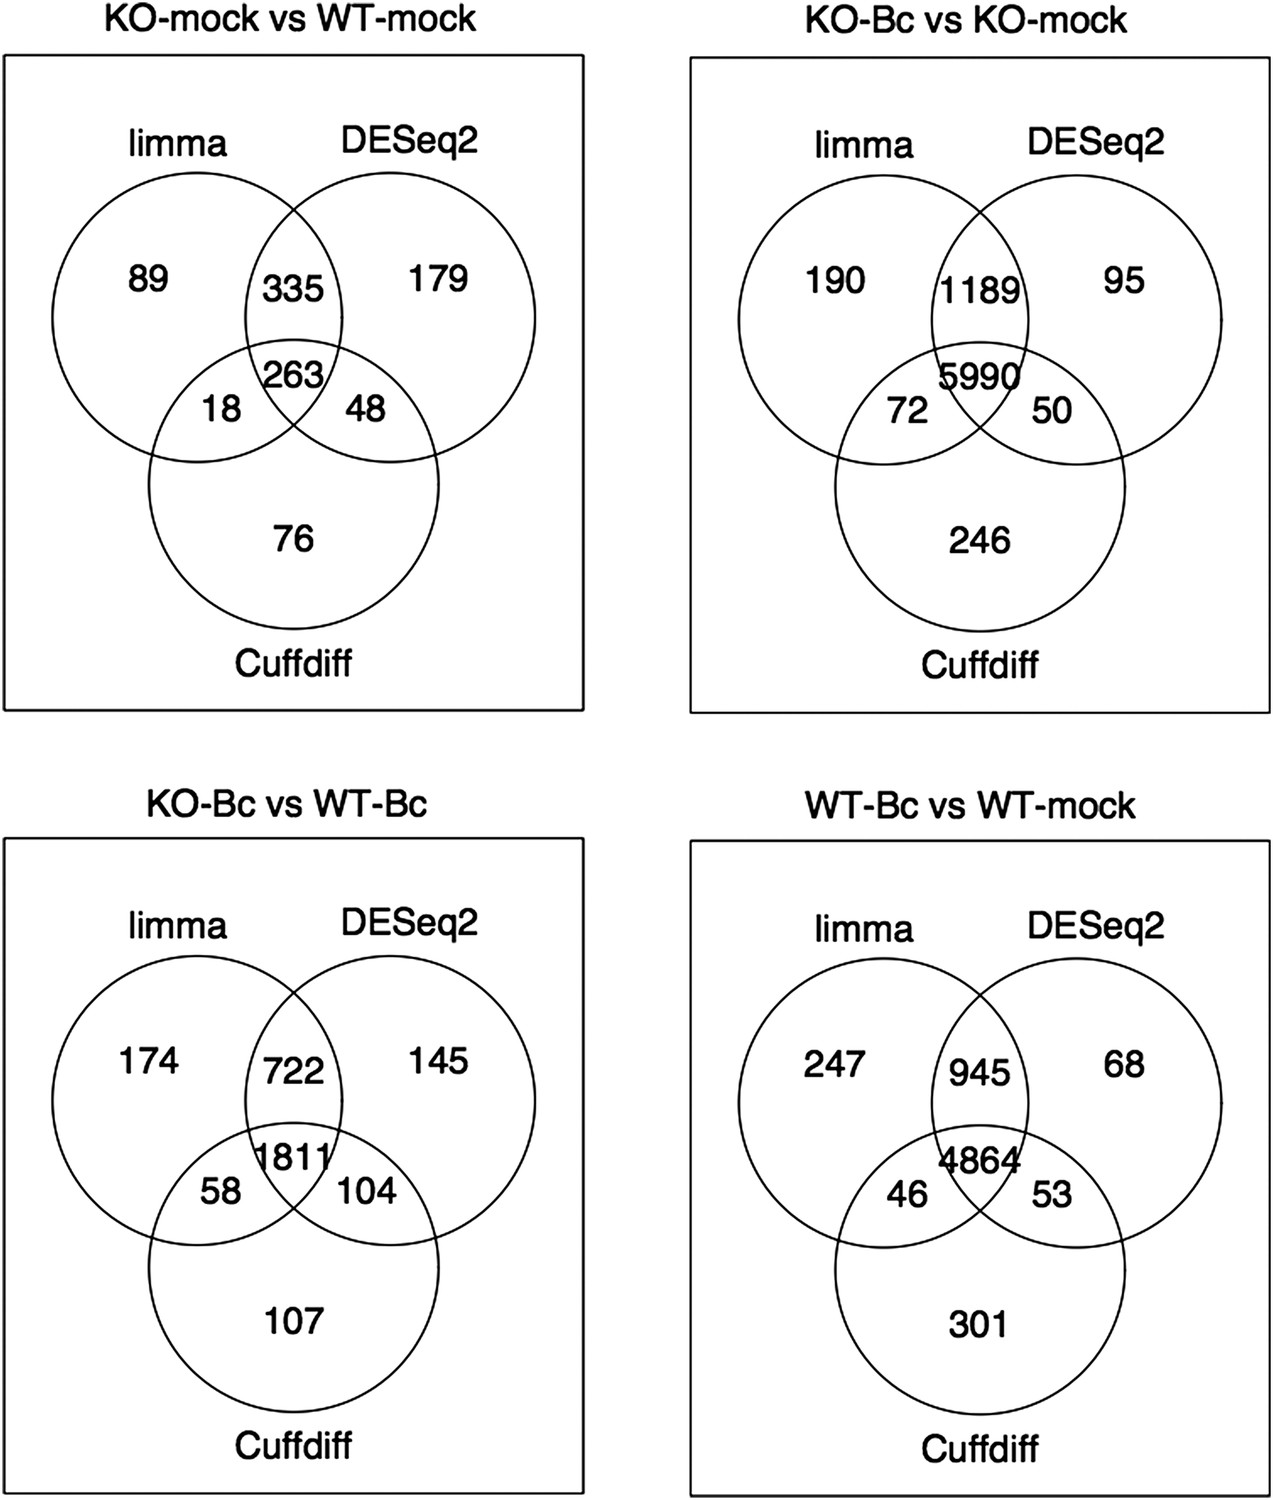
Venn diagrams showing the overlap between the sets of genes identified as significantly differentially expressed (abs(log2FC) ≥ 1, p adj < 0.05) with the three different tools limma (used in our study), DESeq2 and Cuffdiff for the four analysed comparisons.
Author response image 2
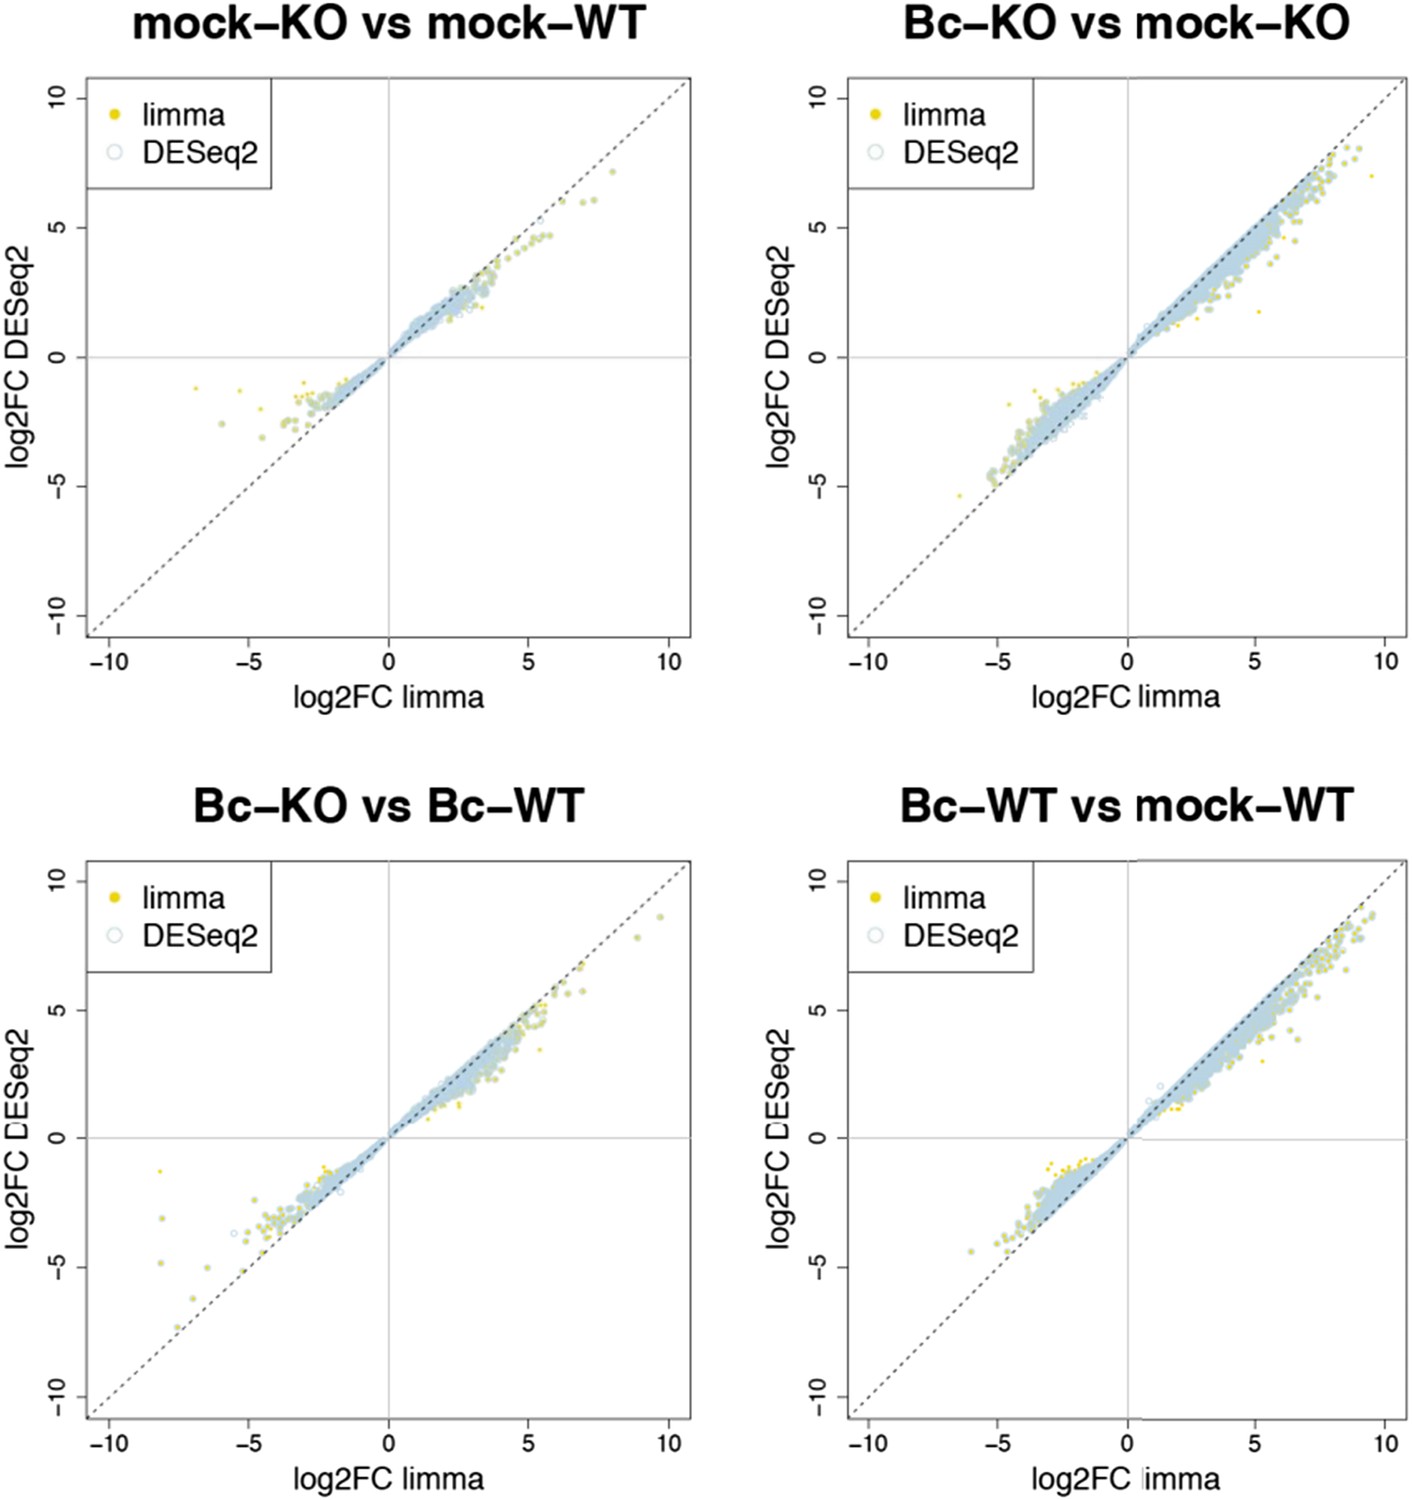
Plots show the correlation between the log2 fold changes obtained for each gene with limma (used in our study) and the alternative tool DESeq2. Yellow points represent genes identified with limma as significantly DE (p adj < 0.05), blue circles represent genes identified with DESeq2, and an overlap of both marks represents genes consistently identified with both tools.
Author response image 3
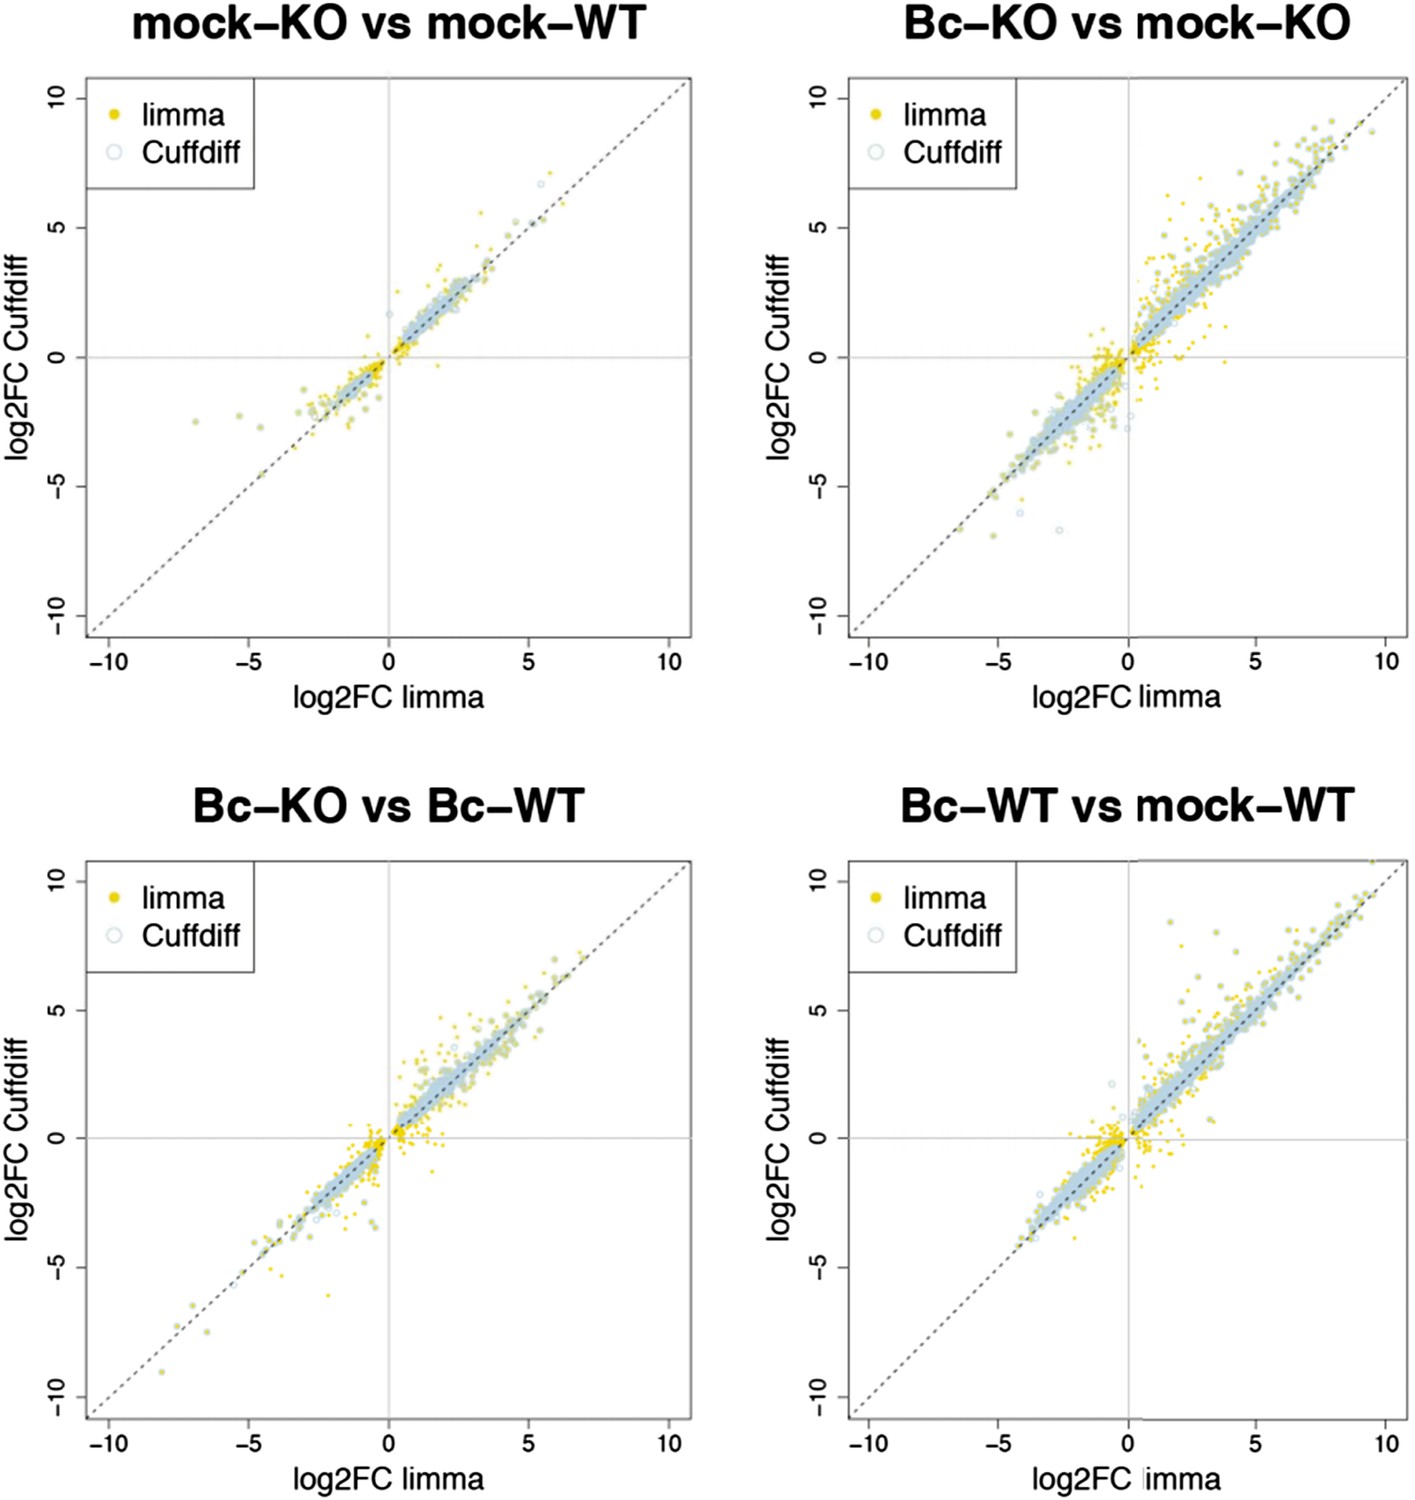
Plots show the correlation between the log2 fold changes obtained for each gene with limma (used in our study) and the alternative tool Cuffdiff. Yellow points represent genes identified with limma as significantly DE (p adj < 0.05), blue circles represent genes identified with Cuffdiff, and an overlap of both marks represents genes consistently identified with both tools.
Author response image 4
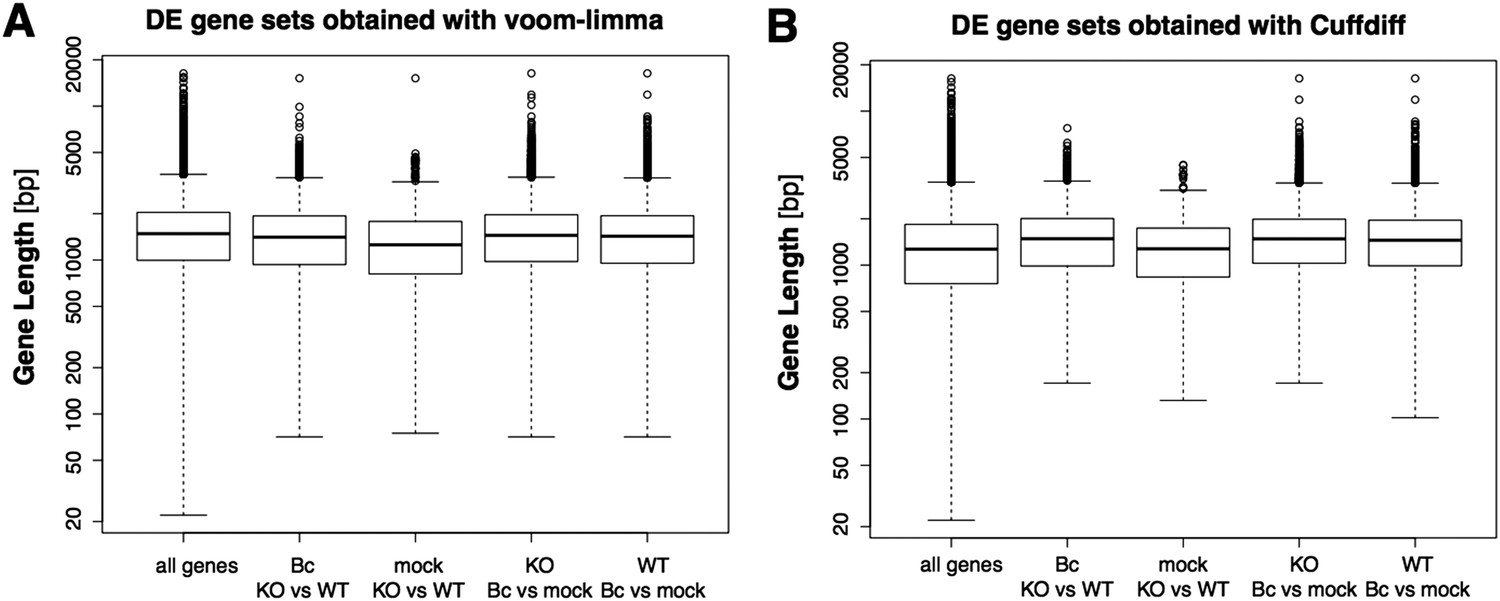
Boxplots represent the gene length distributions among the set of all analyzed genes and the subsets of genes identified as significantly differentially expressed (with abs(log2FC) ≥ 1, p adj < 0.05) in the four analyzed pairwise comparison with the voom-limma workflow used in our study (A) or the alterantive tool Cuffdiff (B).
Author response image 5
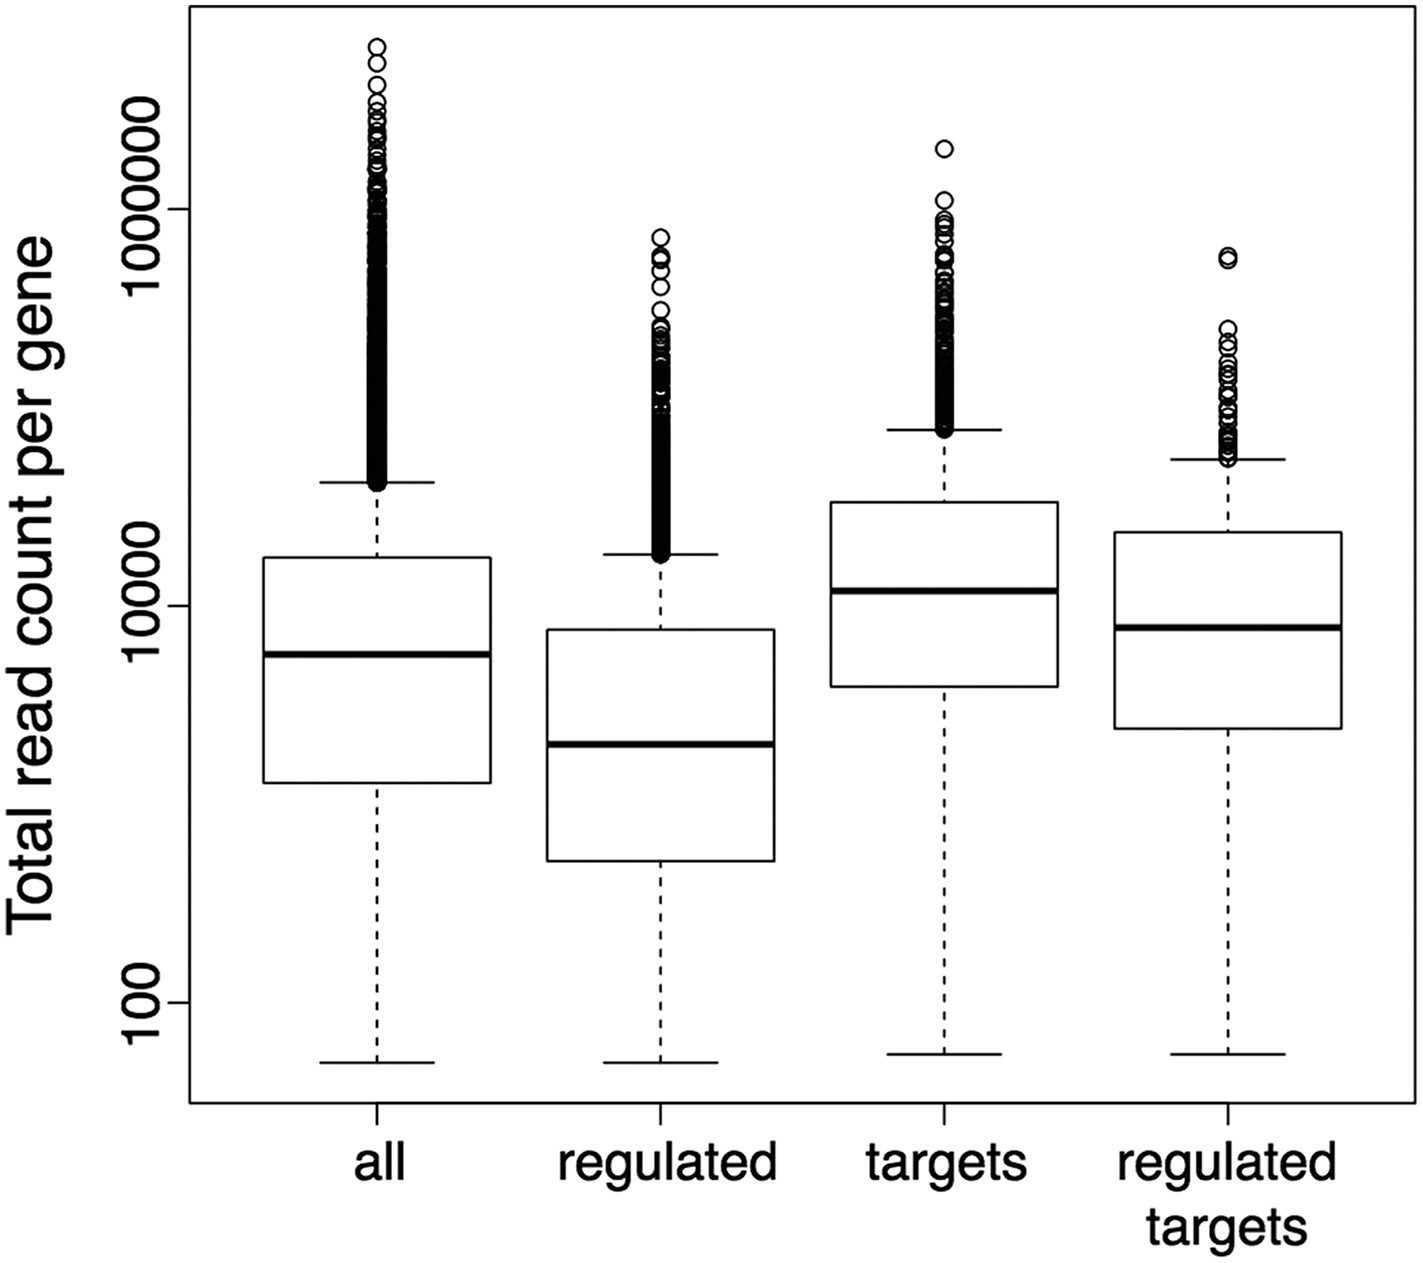
Boxplots represent the distributions of total read counts (over all samples together) per gene among the set of all analysed genes and the subsets of wrky33-regulated genes (from RNA-seq), wrky33 targets (from ChIP-seq) and wrky33-regulated wrky33 targets.
Additional files
-
Supplementary file 1
Summary of identified WRKY33 binding sites 14 hr post B. cinerea 2100 inoculation.
- https://doi.org/10.7554/eLife.07295.023
-
Supplementary file 2
List of confirmed WRKY33 target genes.
- https://doi.org/10.7554/eLife.07295.024
-
Supplementary file 3
List of WRKY33 regulated target genes involved in cell death.
- https://doi.org/10.7554/eLife.07295.025
-
Supplementary file 4
List of WRKY33 regulated target genes associated in the GO category ‘kinase activity’.
- https://doi.org/10.7554/eLife.07295.026
-
Supplementary file 5
List of WRKY33 target genes encoding transcription factors.
- https://doi.org/10.7554/eLife.07295.027
-
Supplementary file 6
List of primers used for genotyping.
- https://doi.org/10.7554/eLife.07295.028
-
Supplementary file 7
List of primers used for ChIP-qPCR.
- https://doi.org/10.7554/eLife.07295.029
-
Supplementary file 8
List of primers used for qRT-PCR.
- https://doi.org/10.7554/eLife.07295.030
-
Source code 1
R function to identify overlapping peak regions.
- https://doi.org/10.7554/eLife.07295.031
Download links
A two-part list of links to download the article, or parts of the article, in various formats.
Downloads (link to download the article as PDF)
Open citations (links to open the citations from this article in various online reference manager services)
Cite this article (links to download the citations from this article in formats compatible with various reference manager tools)
Negative regulation of ABA signaling by WRKY33 is critical for Arabidopsis immunity towards Botrytis cinerea 2100
eLife 4:e07295.
https://doi.org/10.7554/eLife.07295


