A composite double-/single-stranded RNA-binding region in protein Prp3 supports tri-snRNP stability and splicing
- Freie Universität Berlin, Germany
- Max Planck Institute for Biophysical Chemistry, Germany
- International Institute of Molecular and Cell Biology, Poland
- Adam Mickiewicz University, Poland
Figures
Figure 1 with 2 supplements
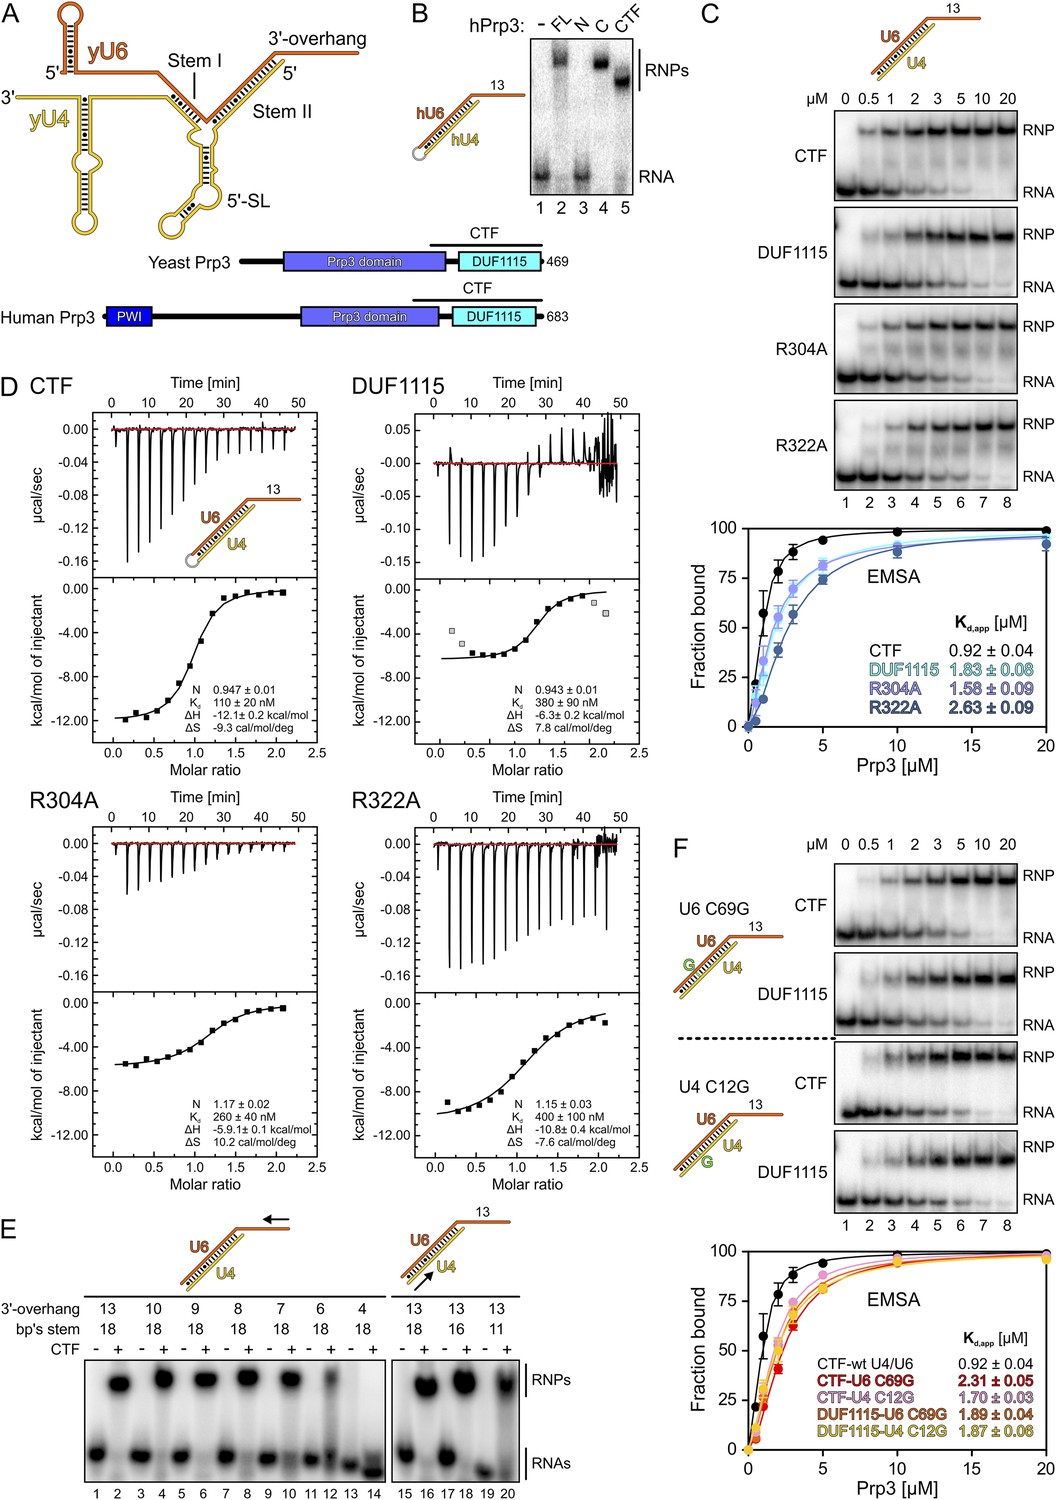
Protein and RNA requirements for Prp3 binding to U4/U6 di-snRNA.
(A) Schematic presentation of yeast U4/U6 di-snRNA (yU4—gold; yU6—orange) and domain organizations of yeast and human Prp3. Regions corresponding to the C-terminal U4/U6-binding fragments (CTF) of the proteins are indicated by black lines above the schemes. (B) ESMA monitoring binding of hPrp3 protein variants (as MBP or GST fusions; 25 µM) to hU4/U6stem II+13nt (scheme on the left). hPrp3 constructs are indicated above the lanes. FL—full-length; N—residues 1–442; C—residues 195–683; CTF—residues 484–683. Bands are identified on the right; RNA—unbound RNA; RNPs—RNA–protein complexes. (C) EMSA titrations monitoring binding of yPrp3CTF variants and yPrp3DUF1115 (proteins indicated at the left of the gels) to yU4/U6stem II+13nt (scheme on the top). Protein concentrations in each lane are indicated above the first gel. Bottom: quantification of the data above. The data were fit to a single exponential Hill equation (fraction bound = A[protein]n/([protein]n + Kdn): A, fit maximum of RNA bound; n, Hill coefficient) (Ryder et al., 2008). Errors indicate standard errors of the mean of at least two independent experiments. (D) Isothermal titration calorimetry monitoring interactions between yPrp3CTF variants or yPrp3DUF1115 (proteins indicated above and on the left of each panel) to yU4/U6stem II+13nt (scheme in the first panel). The proteins, in particular yPrp3DUF1115 and yPrp3CTF,R322A, tended to aggregate when added in excess of available RNA binding sites, giving rise to background signals at the ends of some runs. Data points in gray in the DUF1115 analysis were omitted during the fitting. Deduced binding stoichiometries (N), Kd′s, enthalpies (ΔH) and entropies (ΔS) of the interactions are listed in the lower parts of the panels. (E) Binding of yPrp3CTF (20 µM) to the indicated fragments of yU4/U6 (schemes above the gels; arrows indicate sequential shortening of RNA elements). Lanes 1–14—shortening of the yU6 3′-overhang. Lanes 15–20—shortening of stem II. (F) EMSA titrations monitoring binding of binding of yPrp3CTF or yPrp3DUF1115 to yU4/U6stem II+13nt bearing yU6 C69 G (top two gels) or yU4 C12 G (bottom two gels) exchanges that restore Watson–Crick base pairing (schemes on the far left; mutant residues highlighted in green). Proteins are indicated at the left of the gels. Protein concentrations in each lane are indicated above the first gel. Bottom: quantification as in panel 1C. CTF-wt U4/U6—reference copied from panel 1C. Errors indicate standard errors of the mean of at least two independent experiments.
Figure 1—figure supplement 1
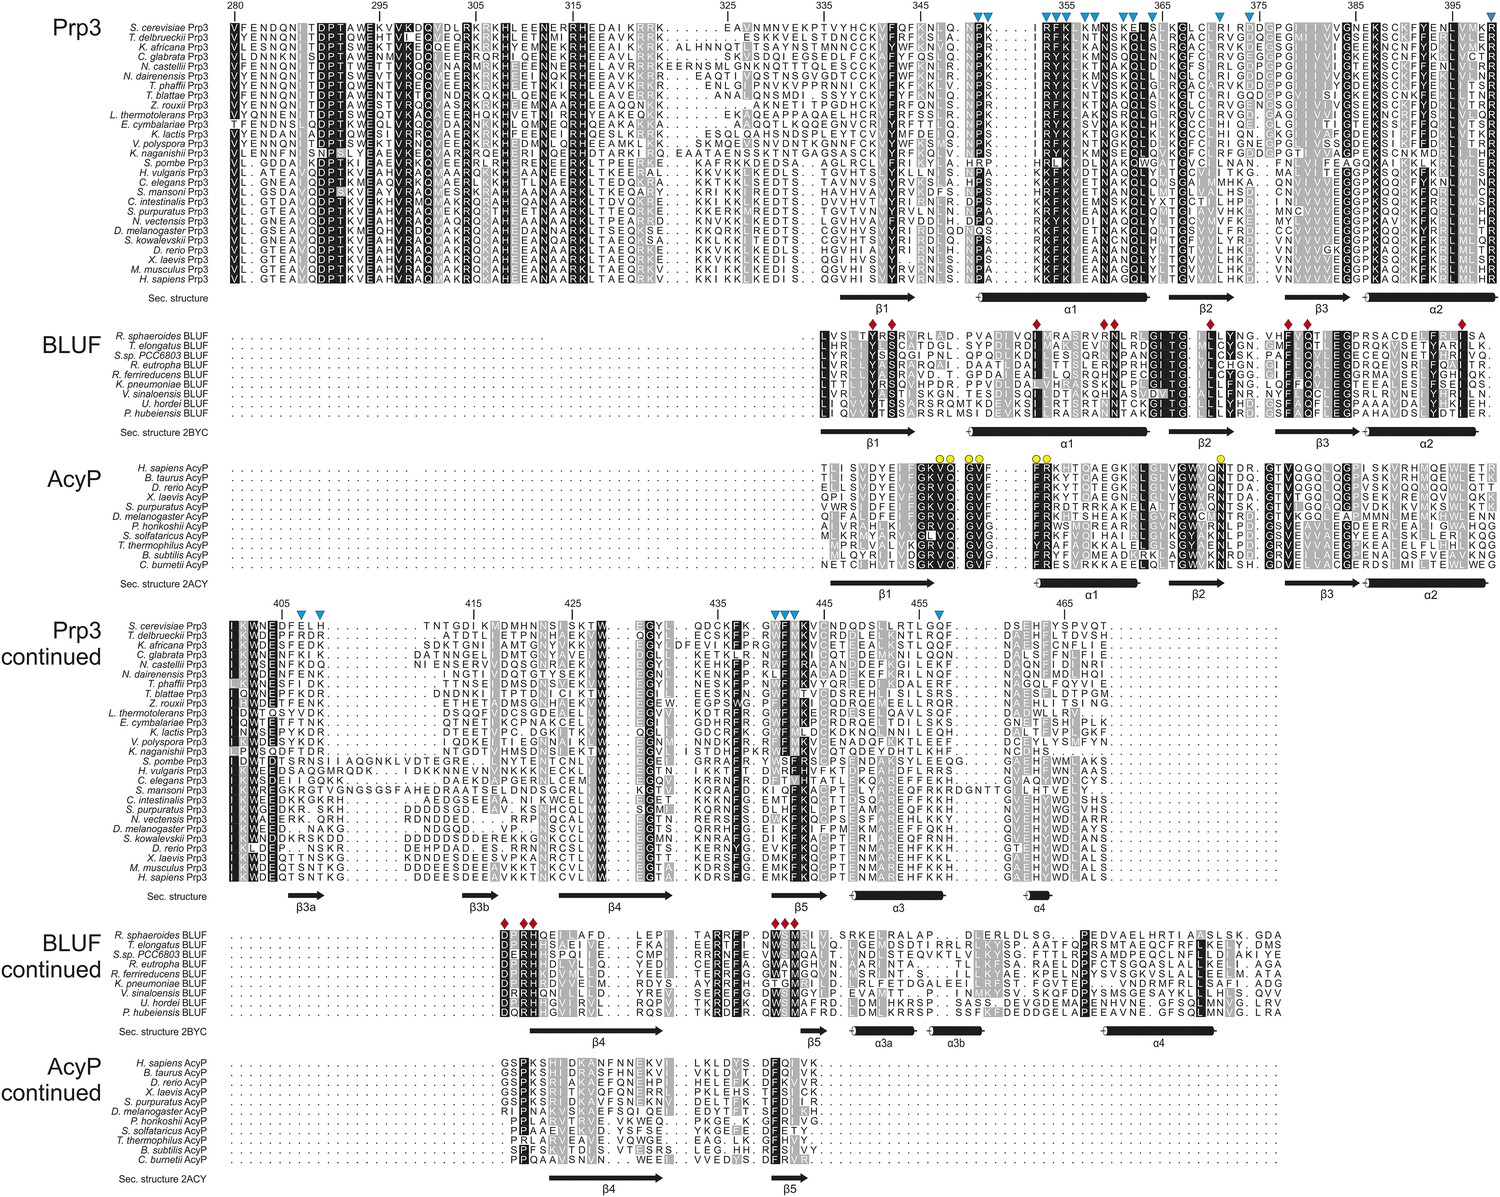
Protein sequence comparisons.
Multiple sequence alignments of Prp3 orthologs, acylphosphatases (AcyP) and blue light photoreceptors containing the BLUF domain. Sequences were aligned using the program MUSCLE (Edgar, 2004), manually adjusted and displayed using ALSCRIPT (Barton, 1993). Symbols below the alignments denote secondary structure elements assigned using PDBsum (Laskowski et al., 1997) based on the crystal structures of yPrp3CTF (this study), Bos taurus AcyP (PDB ID 2ACY) (Thunnissen et al., 1997) and the R. sphaeroides BLUF domain (PDB ID 2BYC) (Jung et al., 2005). Cyan triangles—yPrp3296−469 residues in contact with yU6 snRNA; red diamonds—residues in the flavin-binding pocket of the R. sphaeroides BLUF domain, yellow circles—phosphate-binding and active site residues in B. taurus AcyP. Residue numbers refer to the yPrp3 sequence.
Figure 1—figure supplement 2
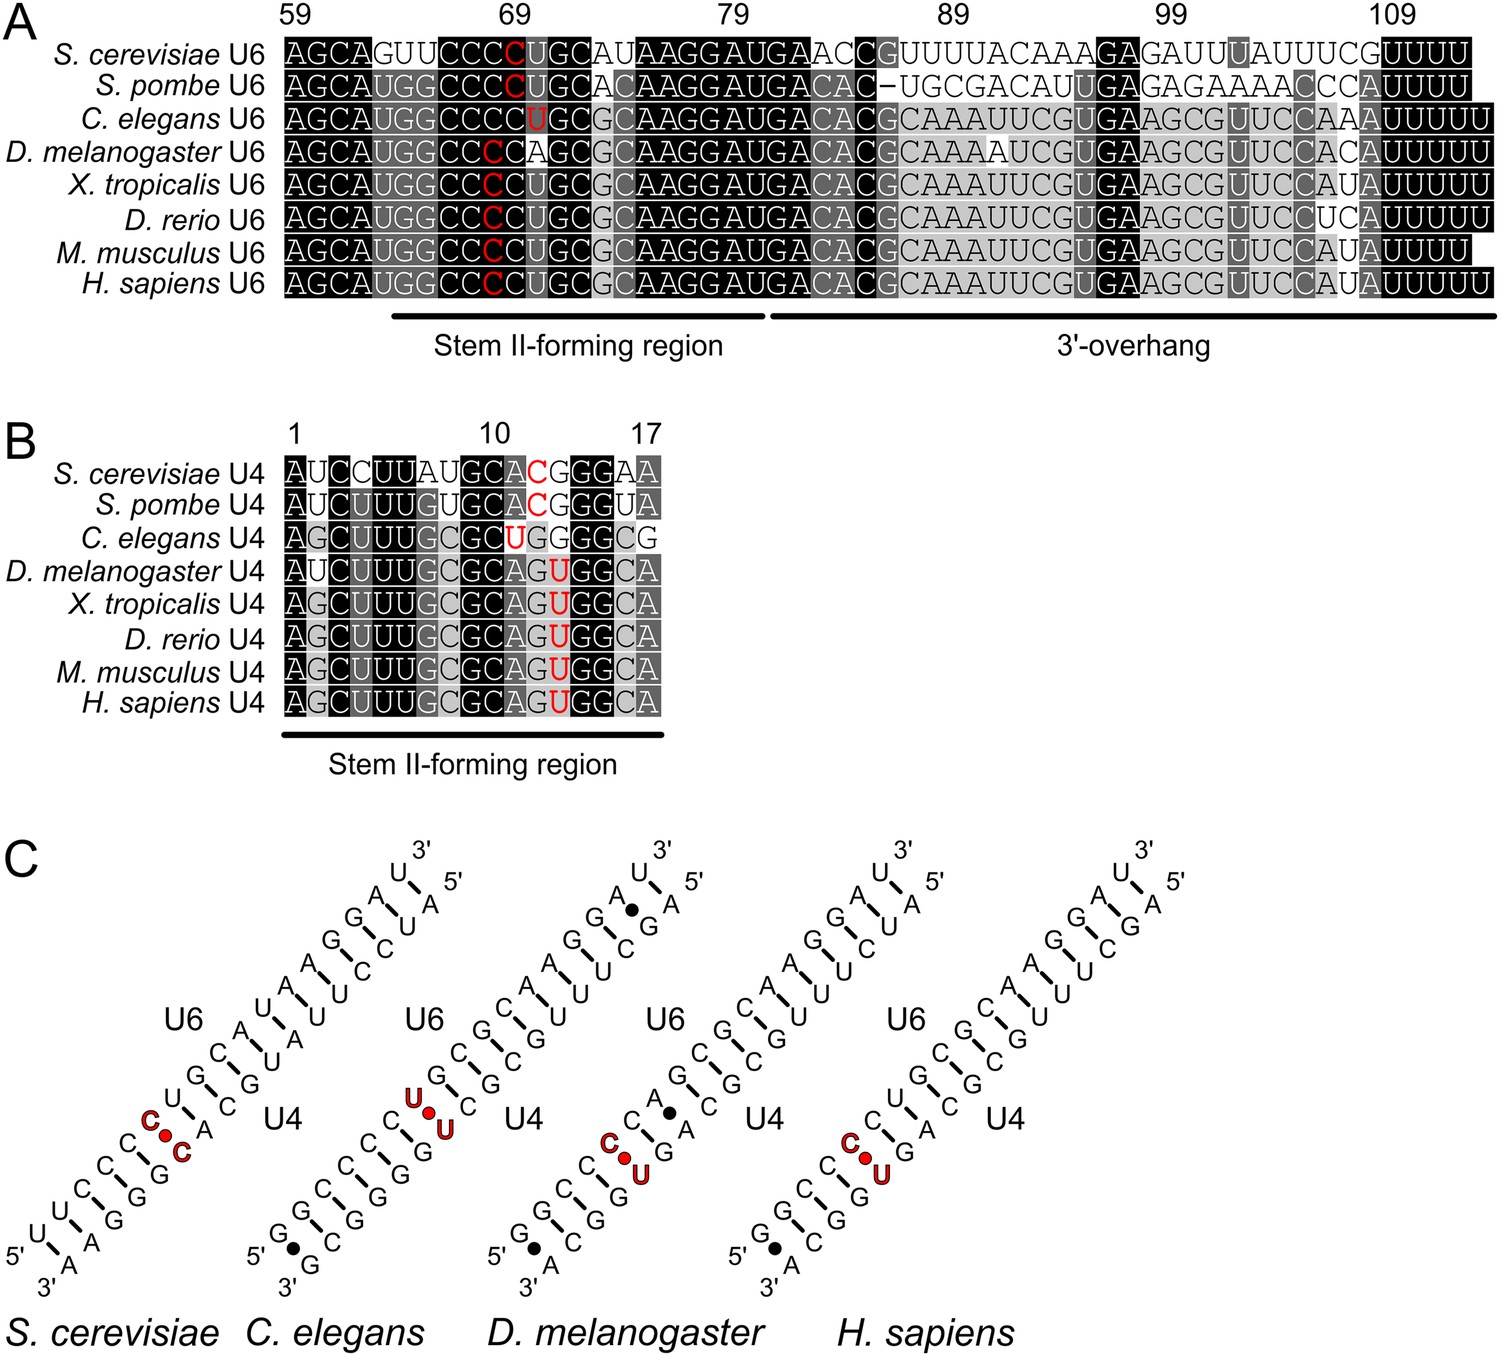
RNA sequence comparisons.
(A, B) Multiple sequence alignments of U6 regions (B) forming stem II and the 3′-overhang and the U4 region (C) forming stem II in U4/U6 di-snRNAs. Residues in red form non-Watson–Crick pyrimidine–pyrimidine base pairs in the lower parts of stem II. The U6 sequences for H. sapiens (gi: 669633321), M. musculus (gi: 90855862), D. rerio (gi: 159248718), X. tropicalis (gi: 284925142), D. melanogaster (gi: 8768), C. elegans (gi: 6894), S. pombe (gi: 159883886) and S. cerevisiae (gi: 4512) as well as the U4 sequences for H. sapiens (gi: 36,174), M. musculus (gi: 175433), D. rerio (gi: 111306314), D. melanogaster (gi: 45557156), C. elegans (gi: 6893), S. pombe (gi: 5084) and S. cerevisiae (gi: 172644) were obtained from NCBI (http://www.ncbi.nlm.nih.gov). The U4 sequence for X. tropicalis was extracted from the X. tropicalis 8.0 Genome (http://www.xenbase.org/entry) by using H. sapiens U6 as a query sequence. Sequences were aligned using the program MUSCLE (Edgar, 2004), manually adjusted and displayed using Geneious (http://www.geneious.com). The relevant U6 (B) and U4 regions (C) were extracted according to the full-length sequence alignments and secondary structure predictions. (C) Schemes of U4/U6 stem II from selected organisms, highlighting (red) the non-Watson–Crick pyrimidine–pyrimidine base pairs in the lower parts of stem II.
Figure 2
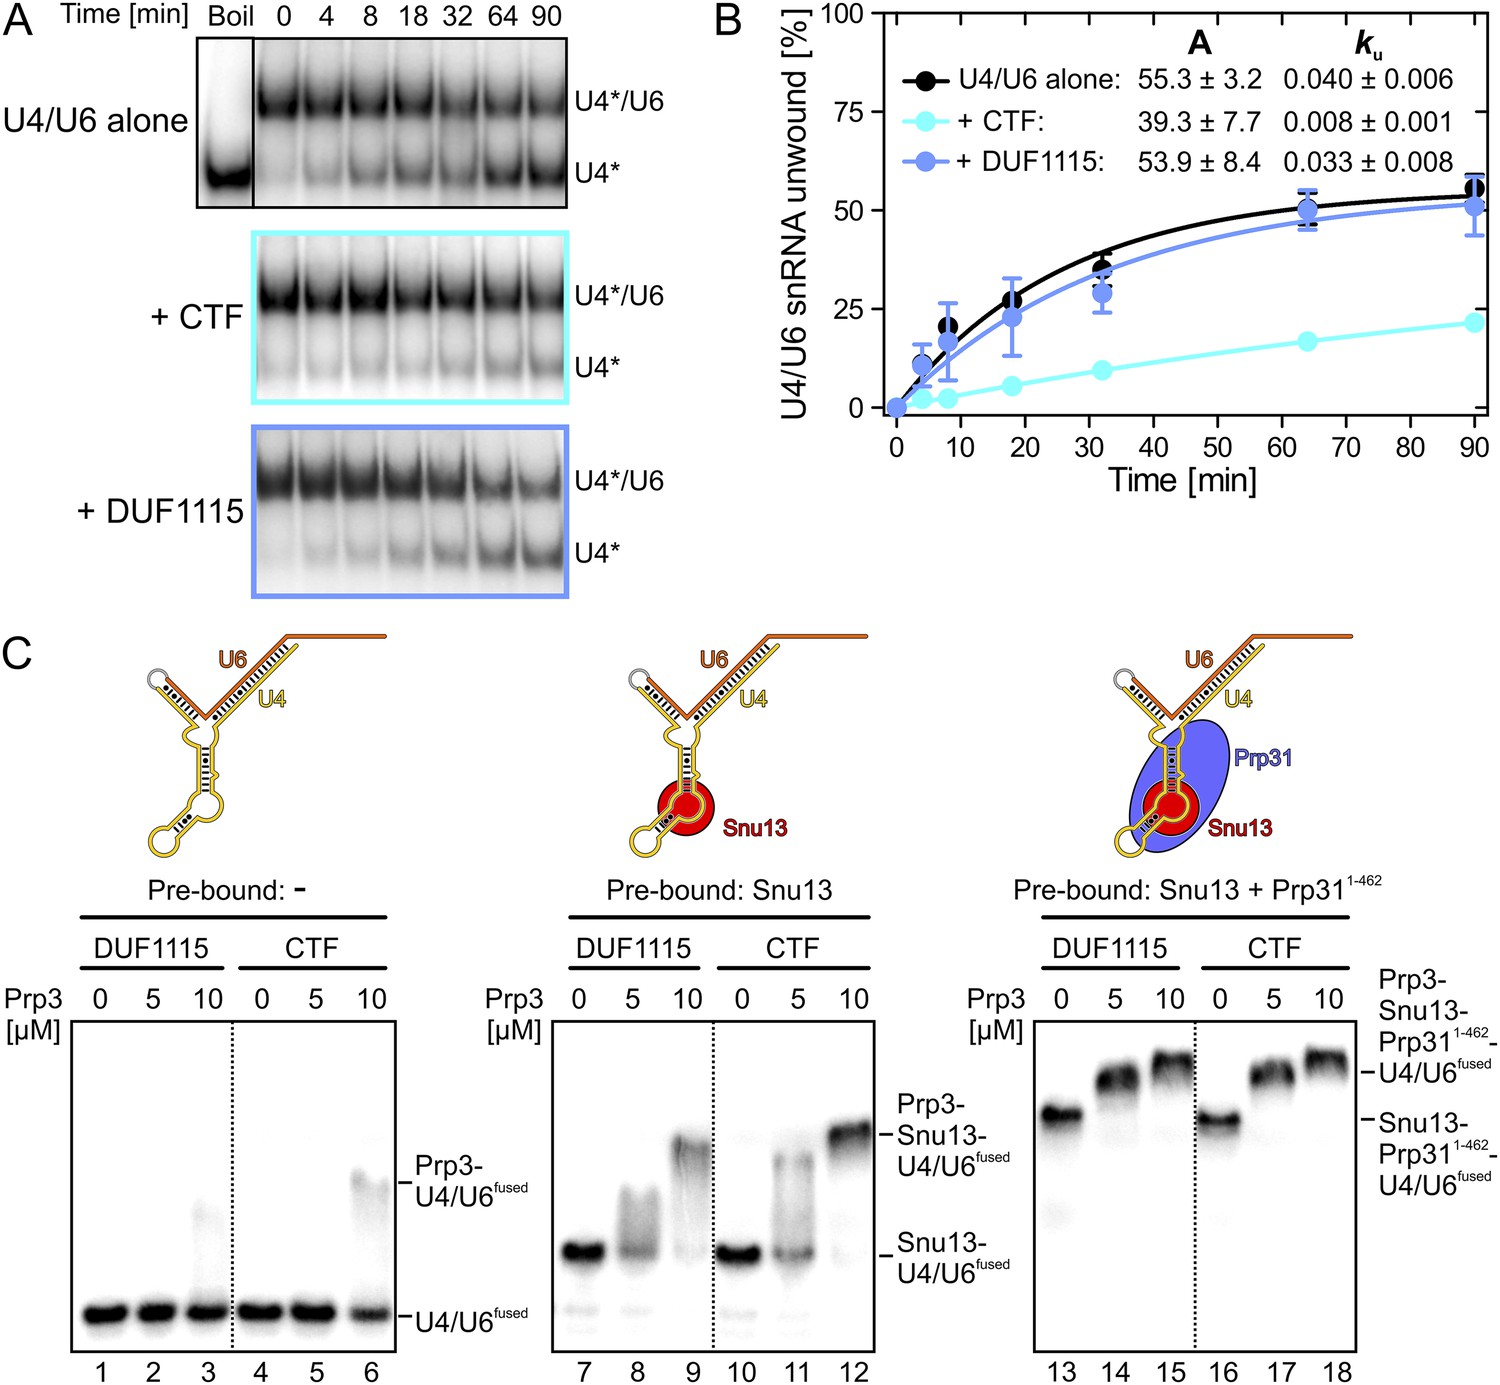
Effects on Brr2-mediated U4/U6 unwinding and interplay with other U4/U6 proteins.
(A) Native gels monitoring yU4/U6 di-snRNA unwinding by yBrr2 in the absence of other proteins (top), in the presence of yPrp3CTF (middle) or yPrp3DUF1115 (bottom). Asterisks indicate radioactive label on yU4 snRNA. (B) Quantification of the data in (A). The data were fit to a single exponential equation: % duplex unwound = A{1 − exp(−ku t)}; A—amplitude of the reaction; ku—apparent first-order rate constant; t—time. Amplitudes and rate constants are listed. Errors indicate standard errors of the mean of four independent experiments. (C) Binding of yPrp3DUF1115 (left three lanes of each panel) or yPrp3CTF (right three lanes of each panel) to yU4/U6fused (lanes 1–6; left), yU4/U6fused pre-bound to Snu13 (lanes 7–12; middle) or yU4/U6fused pre-bound to Snu13 and Prp311−462 (lanes 13–18; right) under otherwise identical conditions. All three panels are from the same gel and were regrouped. Schemes of yU4/U6fused alone or pre-bound by proteins are shown on the top.
Figure 3 with 2 supplements
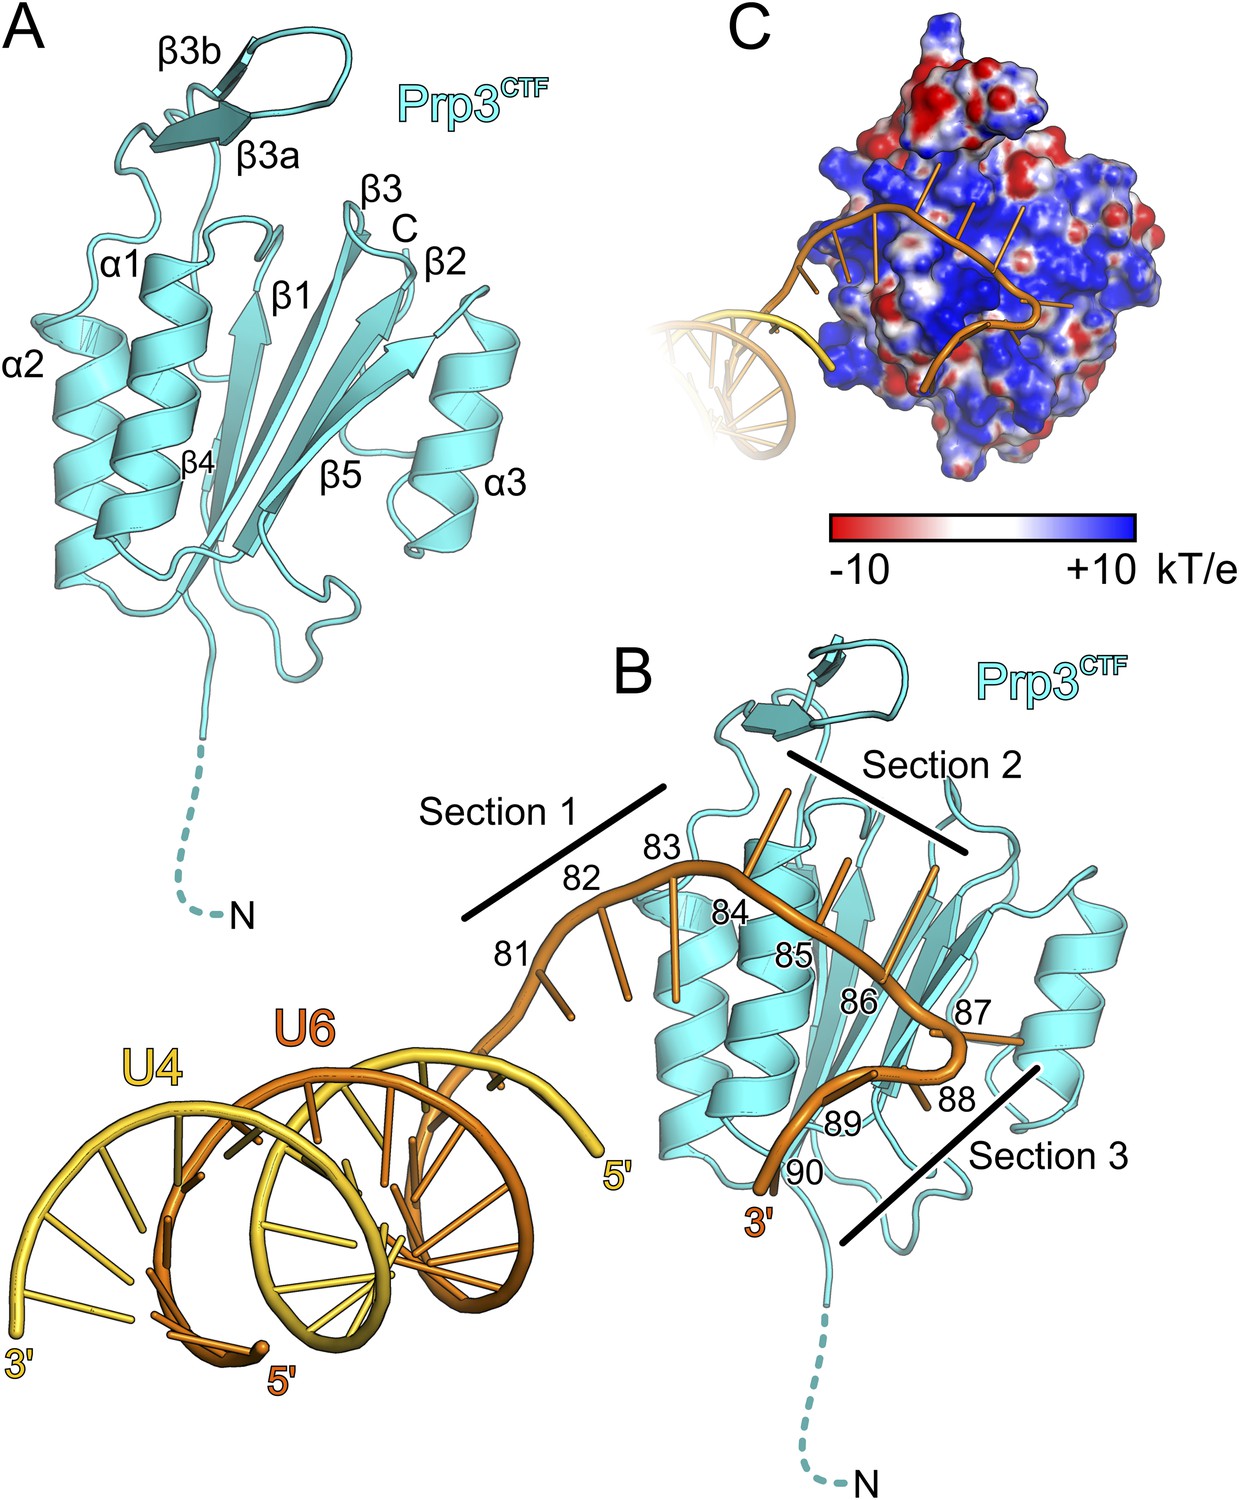
Structural overviews.
(A) Structure of a yPrp3CTF. Secondary structure elements and termini are labeled. Dashed line indicates residues contained in the construct but not visible in the electron density. (B) Structure of a yPrp3CTF-yU4/U6stem II+10nt complex with the protein in the same orientation as in Figure 3A. yPrp3CTF—cyan; yU4—gold; yU6—orange. Dashed line indicates residues contained in the construct but not visible in the electron density. Sections 1–3, between which the yU6 3′-overhang changes direction on the surface of yPrp3CTF, are indicated by black lines. Residues in the yU6 3′-overhang are numbered. (C) Electrostatic surface potential of yPrp3CTF in complex with yU4/U6stem II+10nt. Blue—positive; red—negative. Units kT/e with k—Boltzmann'’s constant, T—absolute temperature, E—charge of an electron.
Figure 3—figure supplement 1
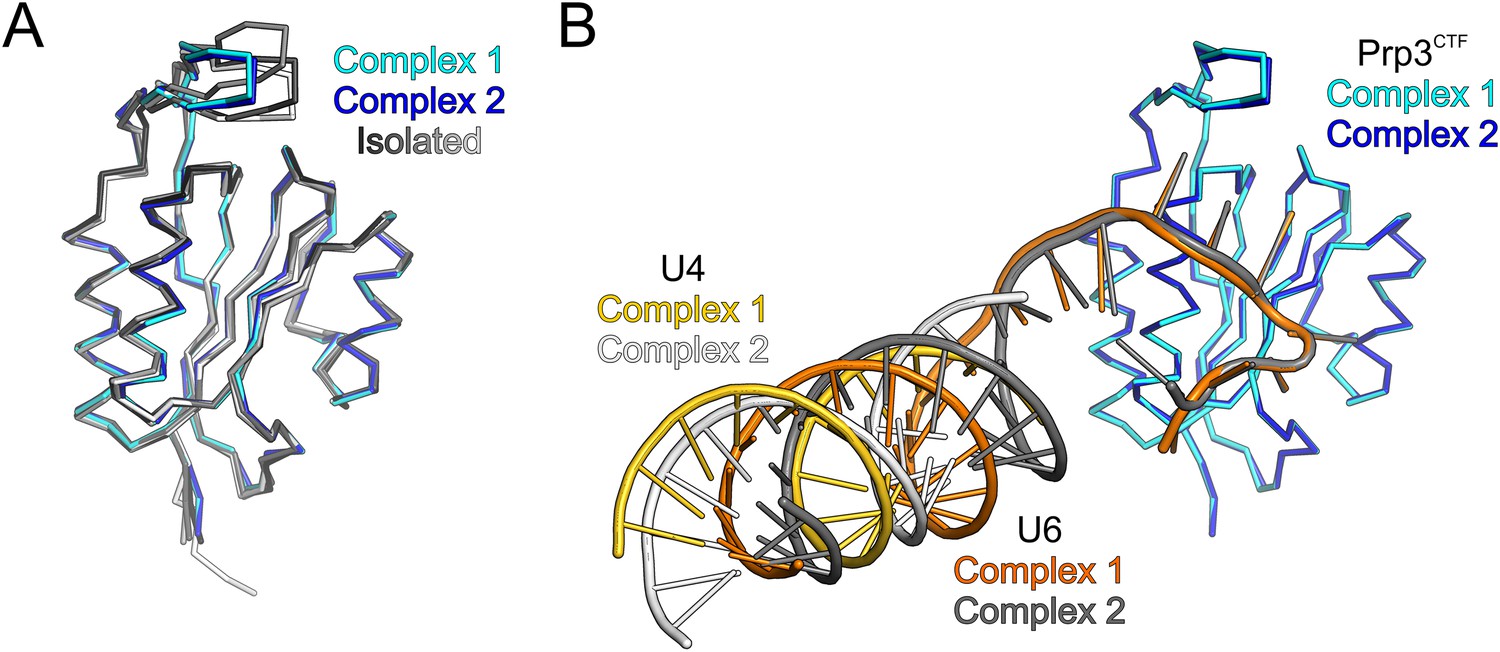
Structural comparisons.
(A) Ribbon plots of all crystallographically independent, superimposed structures of the yPrp3 DUF1115 domain. Isolated yPrp3DUF1115—white; isolated yPrp3CTF—gray colors; RNA-bound yPrp3CTF—cyan and blue. (B)Structural superimposition of the two crystallographically independent yPrp3CTF-yU4/U6stemII+10nt complexes based on the protein portions. yPrp3296−469—cyan (complex 1) and blue (comply 2); yU4—gold (complex 1) and light gray (complex 2); yU6—orange (complex 1) and dark gray (complex 2).
Figure 3—figure supplement 2
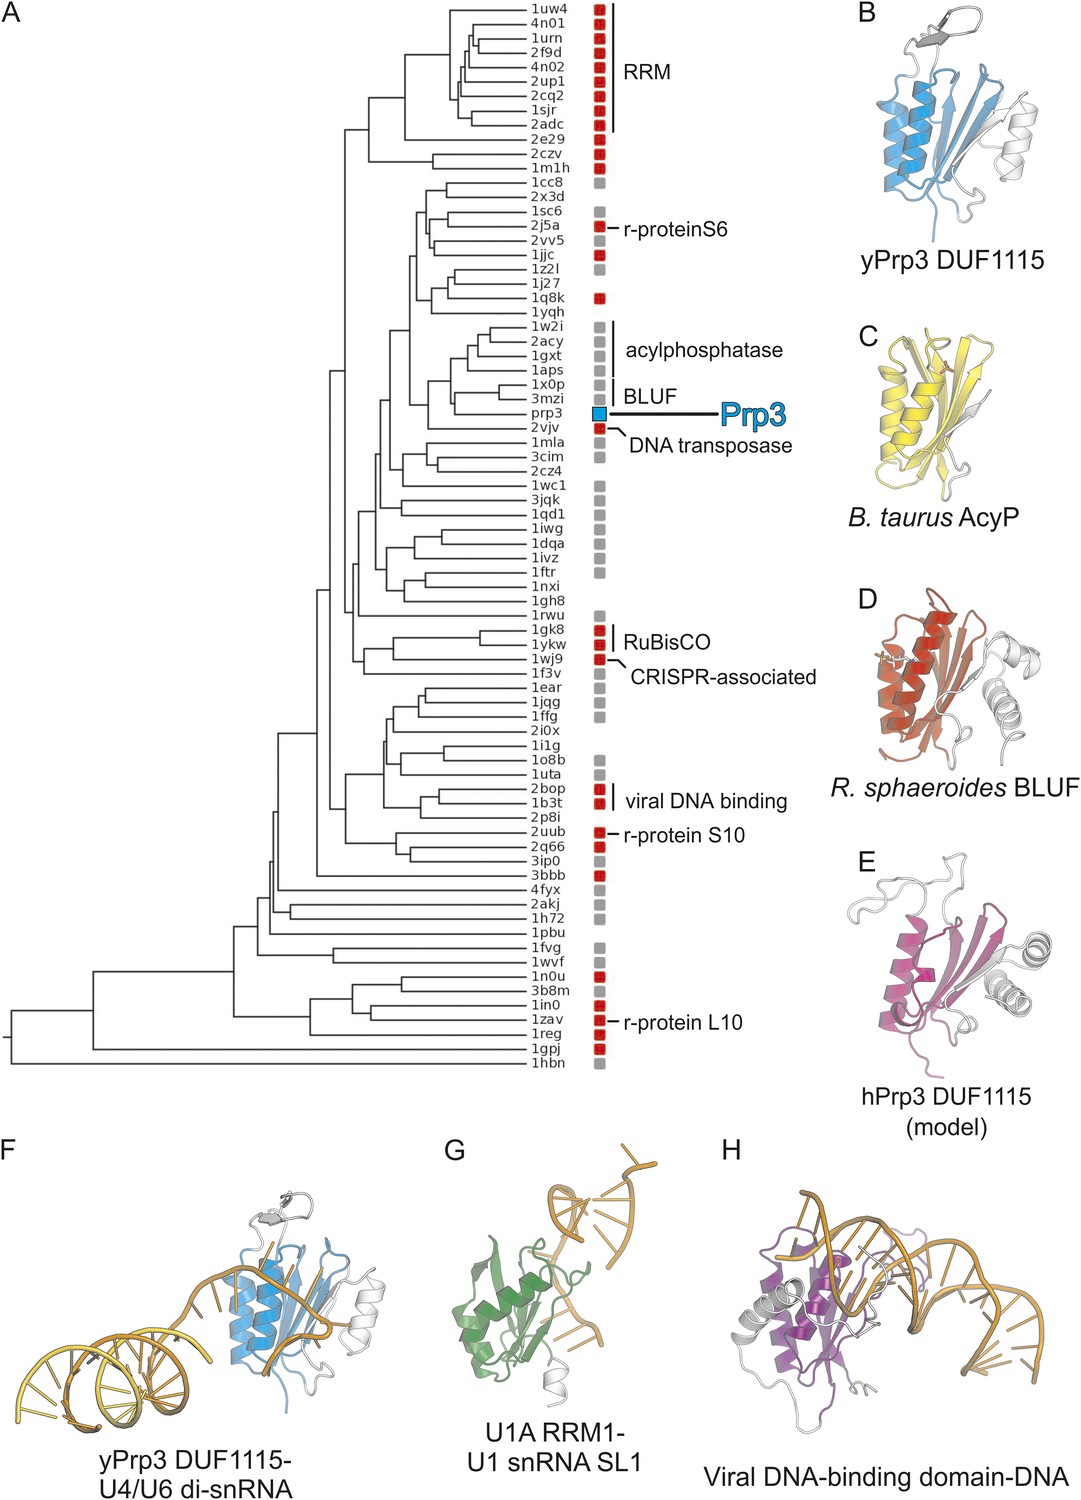
Phylogenetic analysis.
(A) Structure-based phylogenetic tree of ferredoxin-like fold proteins. Red and gray boxes indicate structures that recognize and do not recognize nucleic acids, respectively. The position of the Prp3 ssRNA-binding domain is indicated by a cyan box. (B–H) Comparison of the yPrp3 DUF1115 domain alone (B) and in complex with RNA (F) to B. taurus AcyP (C; PDB ID 2ACY) (Thunnissen et al., 1997), the R. sphaeroides BLUF domain (D; PDB ID 2BYC) (Jung et al., 2005), a structural model of the hPrp3 DUF1115 domain (E) (Korneta et al., 2012), the C-terminal RRM of the human spliceosomal U1A protein in complex with stem-loop I of U1 snRNA (G; PDB ID 1URN) (Oubridge et al., 1994), and Epstein–Barr viral DNA-binding domain in complex with DNA (H; PDB ID 1B3T) (Bochkarev et al., 1998). All structures are shown with the ferredoxin-like core elements in the same orientation. The cores are shown in color, additional elements in light gray. Nucleic acids—orange.
Figure 4
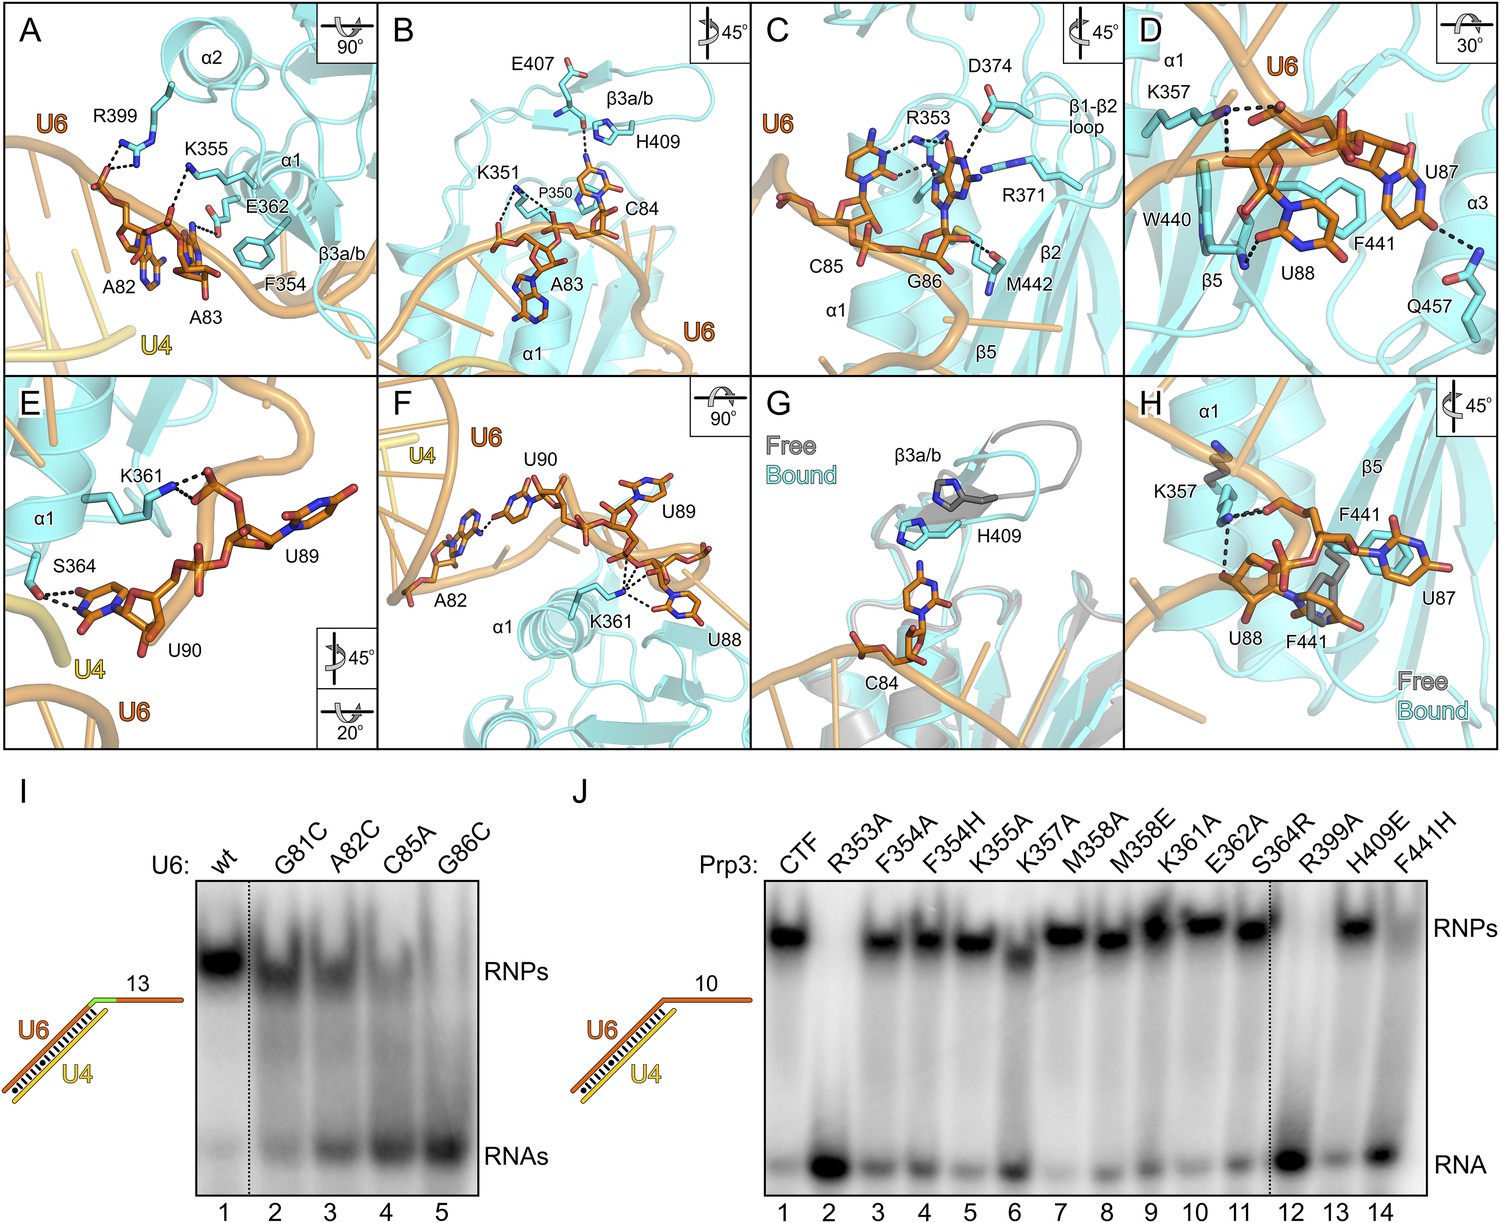
Details of the yPrp3-yU4/U6 di-snRNA interaction.
(A–H) Close-up views of yPrp3–RNA contacts. The protein and the RNA are shown as semi-transparent cartoons (yPrp3CTF—cyan; yU6—orange; yU4—gold) with interacting residues as sticks (colored by element; carbon or phosphorus—as the respective molecule; nitrogen—blue; oxygen—red, sulfur—yellow). Black dashed lines—hydrogen bonds or salt bridges. Panels (G) and (H) show overlays of unbound (protein—gray) and complex (protein—cyan; yU6 snRNA—orange) situations. Rotation symbols indicate the views relative to Figure 3B. (I) Binding of yPrp3CTF (20 µM) to wt and mutant versions (indicated above the gel) of U4/U6stem II+13nt (scheme on the left; mutated region in green). (J) Variants of yPrp3CTF (20 µM; indicated above the gel) binding to yU4/U6stem II+10nt (scheme on the left).
Figure 5

Consequences of yPrp3 variants in vivo.
(A) Growth of yeast strains producing the indicated yPrp3 variants at various temperatures. Serial dilutions of liquid cultures were spotted on YPD agar plates and incubated at the indicated temperatures for 1–2 days. (B) In vivo splicing assays, monitoring levels of U3 pre-snoRNAs in yeast strains producing wt yPrp3 or the indicated yPrp3 variants. Cells were grown at 37°C for 5 hr before total RNA was extracted and U3 mature or pre-snoRNAs were detected by primer extension using a radiolabeled DNA oligonucleotide complementary to a region in U3 exon 2. (C, D)Northern blotting of cellular extracts of wt (top) or the indicated prp3 mutant yeast strains (middle and bottom). Cellular extracts were separated on 10–30 % (v/v) glycerol gradients. Even-numbered gradient fractions (indicated above the blots) were probed with radiolabeled DNA oligomers complementary to snRNA regions. Positions of various snRNPs on the gradients are indicated below the blots. (D) Quantification of the data shown (C). (E) Western blots of the same gradients. Odd numbered gradient fractions (indicated above the blots) were probed with anti-ySnu114 (top) and anti-yPrp3 (bottom) antibodies. Positions of various snRNPs on the gradients are indicated below the blots. Dotted boxes—yPrp3 signals in the U4/U6•U5 tri-snRNP fractions.
Figure 6
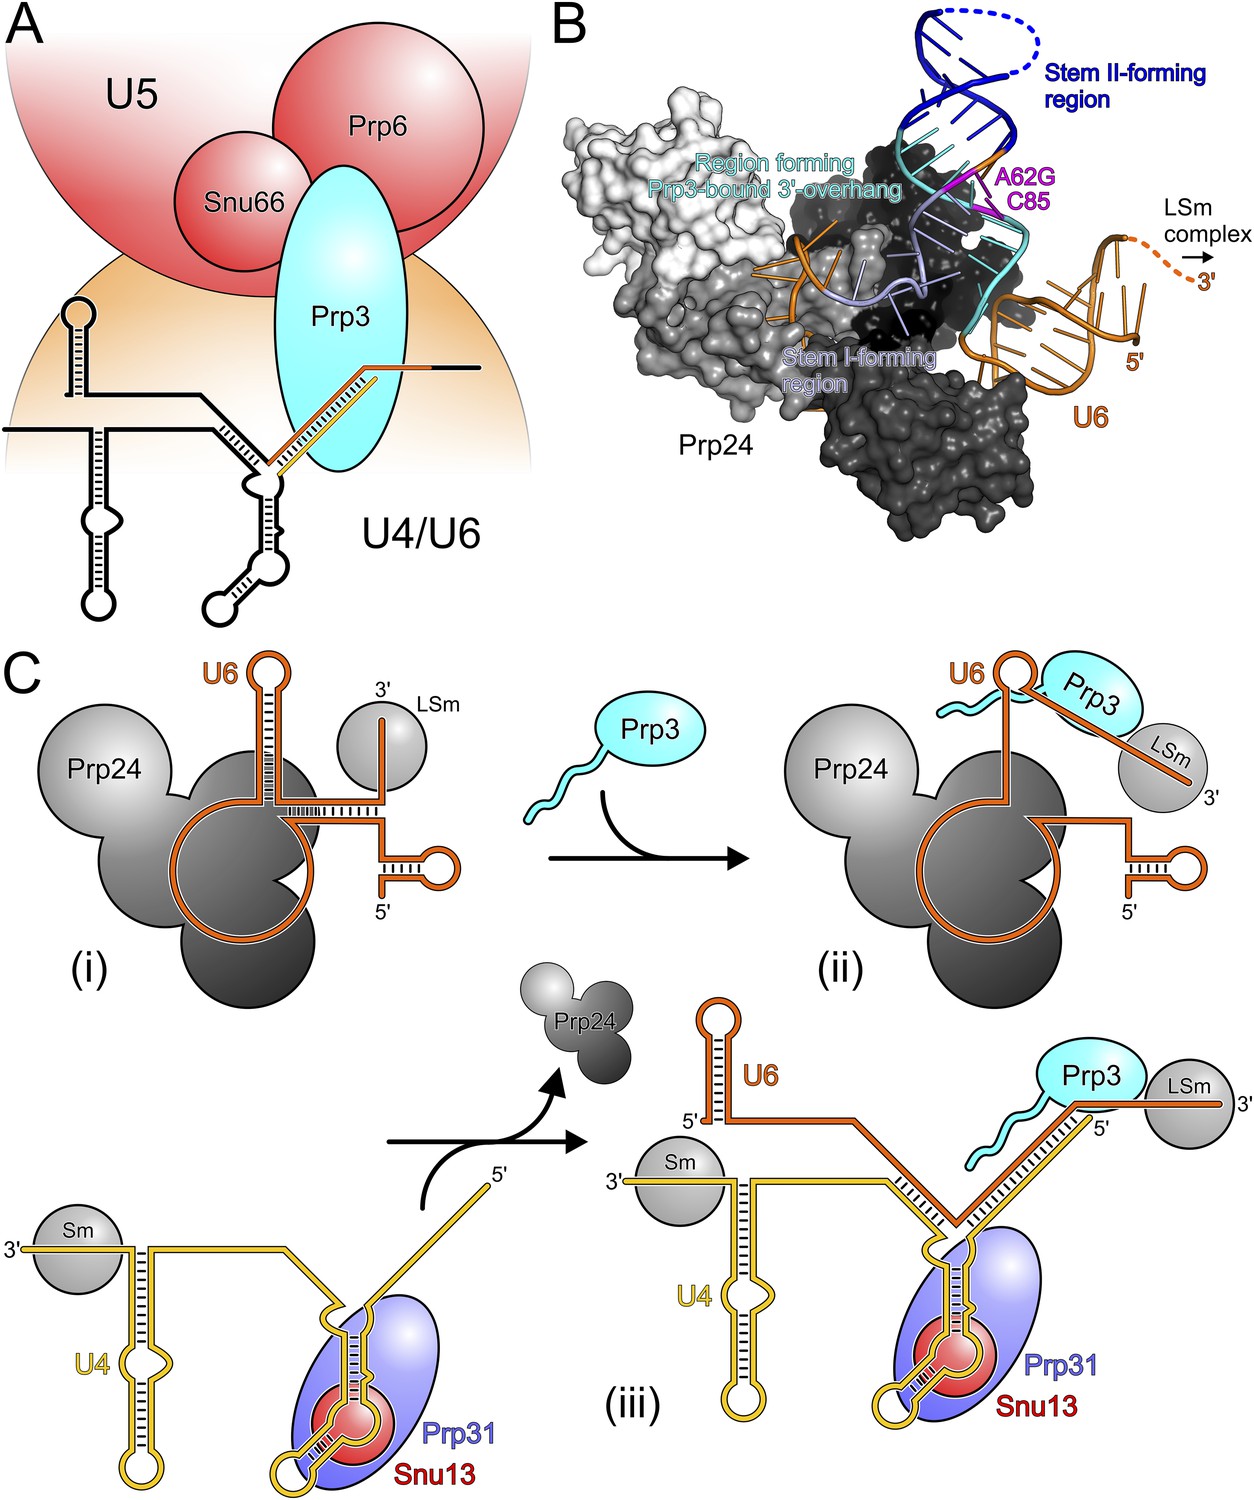
Models for splicing-associated functions of Prp3.
(A) Function of Prp3 as a bridge in the U4/U6•U5 tri snRNP. U4/U6 di-snRNP—orange; U5 snRNP—red; snRNAs—black sticks; U4/U6 stem II and U6 3′-overhang—gold and orange sticks. Prp3 uses its C-terminal region to bind U4/U6 stem II and the U6 3′-overhang on the U4/U6 di-snRNP side (this work) and interacts with proteins Prp6 or Snu66 on the U5 snRNP side (Liu et al., 2006). (B) Structure of yPrp24 in complex with yU6 snRNA (Montemayor et al., 2014). yPrp24 RRM 1–4 domains—white, light gray, dark gray and black, respectively. Regions of yU6 forming stem I, stem II and the 3′-overhang in yU4/U6 are shown in different blue colors. Cold-sensitive A62G mutation and its paired nucleotide, C85—magenta. (C) Model for the function of Prp3 during U4/U6 di-snRNP reassembly after splicing. (i) Upon release from the spliceosome, U6 snRNA is bound by Prp24 and LSm proteins. (ii) Recruitment of Prp3 and association with its cognate U6 regions, which are partially exposed in the Prp24-U6 complex. Emerging Prp3-U6 interactions initiate detachment of U6 snRNA from Prp24. (iii) Incorporation of pre-assembled U4 snRNP may complete Prp24 displacement and assembly of U4/U6 di-snRNP. U4 incorporation may be aided by Prp3 stabilizing the emerging stem II and by the cooperative binding of Snu13, Prp31 and Prp3 to U4/U6 di-snRNAs.
Tables
Table 1
Crystallographic data
| Data set | yPrp3296-469 | yPrp3325-469 | yPrp3296-469-yU4/U6stem II-2 |
|---|---|---|---|
| Data collection | |||
| Wavelength (Å) | 0.91840 | 0.91841 | 0.97968 |
| Space group | C2221 | P65 | C2 |
| Unit cell parameters | |||
| a, b, c (Å) | 87.7, 161.2, 105.2 | 56.1, 56.1, 86.8 | 144.7, 59.6, 109.8 |
| α, β, γ (°) | 90.0, 90.0, 90.0 | 90.0, 90.0, 120.0 | 90.0, 118.5, 90.0 |
| Resolution (Å) | 50.0–2.70 (2.80–2.70)* | 50.0–2.00 (2.12–2.00) | 30.0–3.25 (3.33–3.25) |
| Reflections | |||
| Unique | 20,036 (1993) | 10,459 (1622) | 24,895 (1844) |
| Completeness (%) | 97.3 (99.0) | 99.3 (96.2) | 97.9 (98.5) |
| Redundancy | 3.4 (3.3) | 11.4 (11.3) | 2.0 (1.9) |
| Rmeas† | 0.066 (0.791) | 0.072 (0.459) | 0.017 (0.146) |
| I/σ (I) | 13.31 (1.11) | 24.96 (5.94) | 5.38 (0.90) |
| CC (1/2)‡ | – | 99.9 (95.5) | 99.4 (42.0) |
| Refinement | |||
| Resolution (Å) | 30.00–2.70 (2.77–2.70) | 24.28-2.00 (2.20–2.00) | 29.78-3.25 (3.38–3.25) |
| Reflections | |||
| Number | 18,932 (1146) | 10,454 (2424) | 24,894 (2631) |
| Completeness (%) | 95.8 (80.5) | 99.3 (97.0) | 98.3 (98.0) |
| Test set (%) | 5.2 | 5.0 | 5.0 |
| R factors§ | |||
| Rwork (%) | 20.7 (37.0) | 16.1 (16.6) | 24.9 (36.9) |
| Rfree (%) | 26.2 (42.7) | 22.1 (21.9) | 29.9 (38.9) |
| RMSD# | |||
| Bond lengths (Å) | 0.010 | 0.013 | 0.007 |
| Bond angles (°) | 1.316 | 1.278 | 1.006 |
| Ramachandran plot¶ (%) | |||
| Favored | 96.57 | 98.56 | 90.87 |
| Allowed | 2.64 | 1.44 | 7.98 |
| Outlier | 0.79 | 0.00 | 1.14 |
-
*
Values for the highest resolution shell in parentheses.
-
†
Rmeas = Σh[n/(n − 1)]1/2Σi|Ih − Ih,i|/ΣhΣiIh,I, where Ih is the mean intensity of symmetry-equivalent reflections and n is the redundancy.
-
‡
CC (1/2) is the percentage of correlation between intensities from random half-data sets.
-
§
R = Σhkl||Fobs| − |Fcalc||/Σhkl|Fobs|; Rwork − hkl ∉ T; Rfree − hkl ∈ T; T—test set.
-
#
Root-mean-square deviation from target geometries.
-
¶
Calculated with MolProbity (http://molprobity.biochem.duke.edu/).
Download links
A two-part list of links to download the article, or parts of the article, in various formats.
Downloads (link to download the article as PDF)
Open citations (links to open the citations from this article in various online reference manager services)
Cite this article (links to download the citations from this article in formats compatible with various reference manager tools)
A composite double-/single-stranded RNA-binding region in protein Prp3 supports tri-snRNP stability and splicing
eLife 4:e07320.
https://doi.org/10.7554/eLife.07320


