Species-wide whole genome sequencing reveals historical global spread and recent local persistence in Shigella flexneri
- Cardiff School of Biosciences, United Kingdom
- Wellcome Trust Sanger Centre, United Kingdom
- Institut Pasteur, France
- International Centre for Diarrhoeal Disease Research, Bangladesh
- University of the Witwatersrand, South Africa
- Oxford University Clinical Research Unit, Vietnam
- Oxford University, United Kingdom
- The London School of Hygiene and Tropical Medicine, United Kingdom
- University of Campinas, Brazil
- Freie University, Germany
- Robert Koch Institute, Germany
- Public Health England, United Kingdom
- Global Evaluative Sciences, Inc., United States
- Hanyang University, Republic of Korea
Figures
Figure 1 with 7 supplements
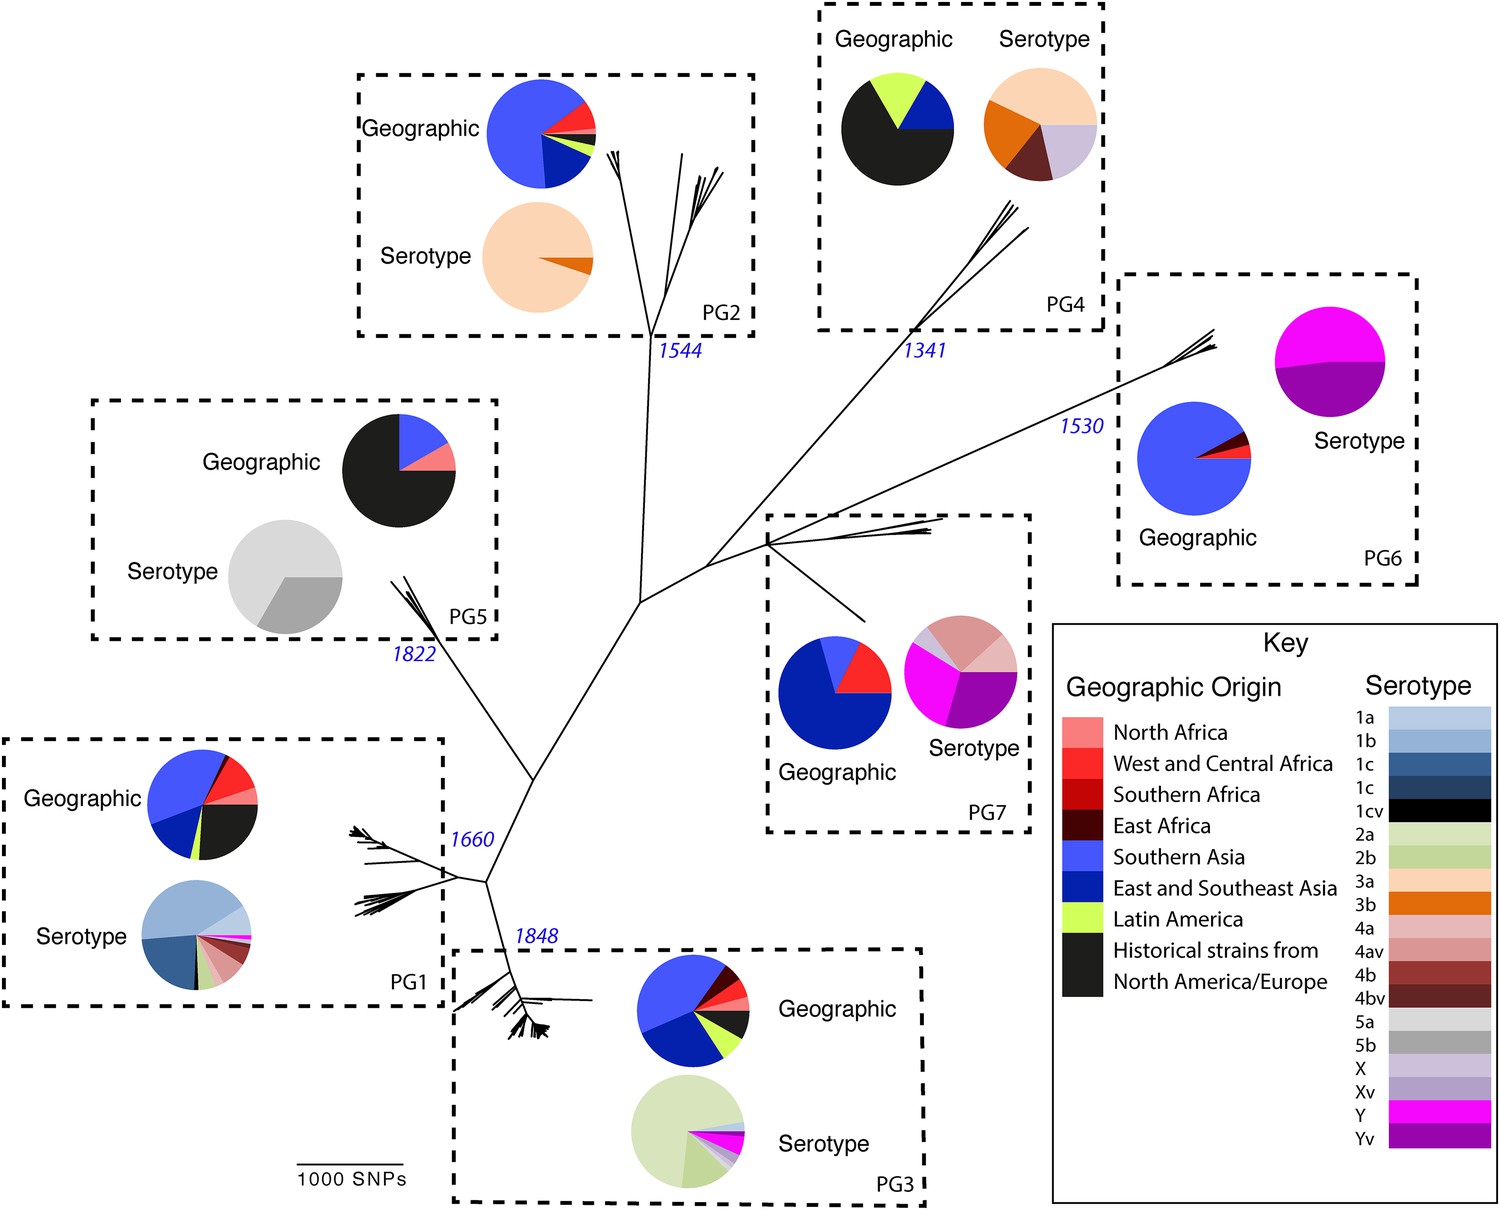
Maximum likelihood phylogeny for Shigella flexneri isolates including serotypes 1–5, X and Y produced from the results of mapping sequence reads against the genome of S. flexneri 2a strain 301, with recombination removed.
Phylogenetic groups (PGs) determined by Bayesian analysis of population structure clustering are boxed within dotted lines, with the geographic and serotype composition of isolates in each PG being inlaid as pie charts.
Figure 1—figure supplement 1
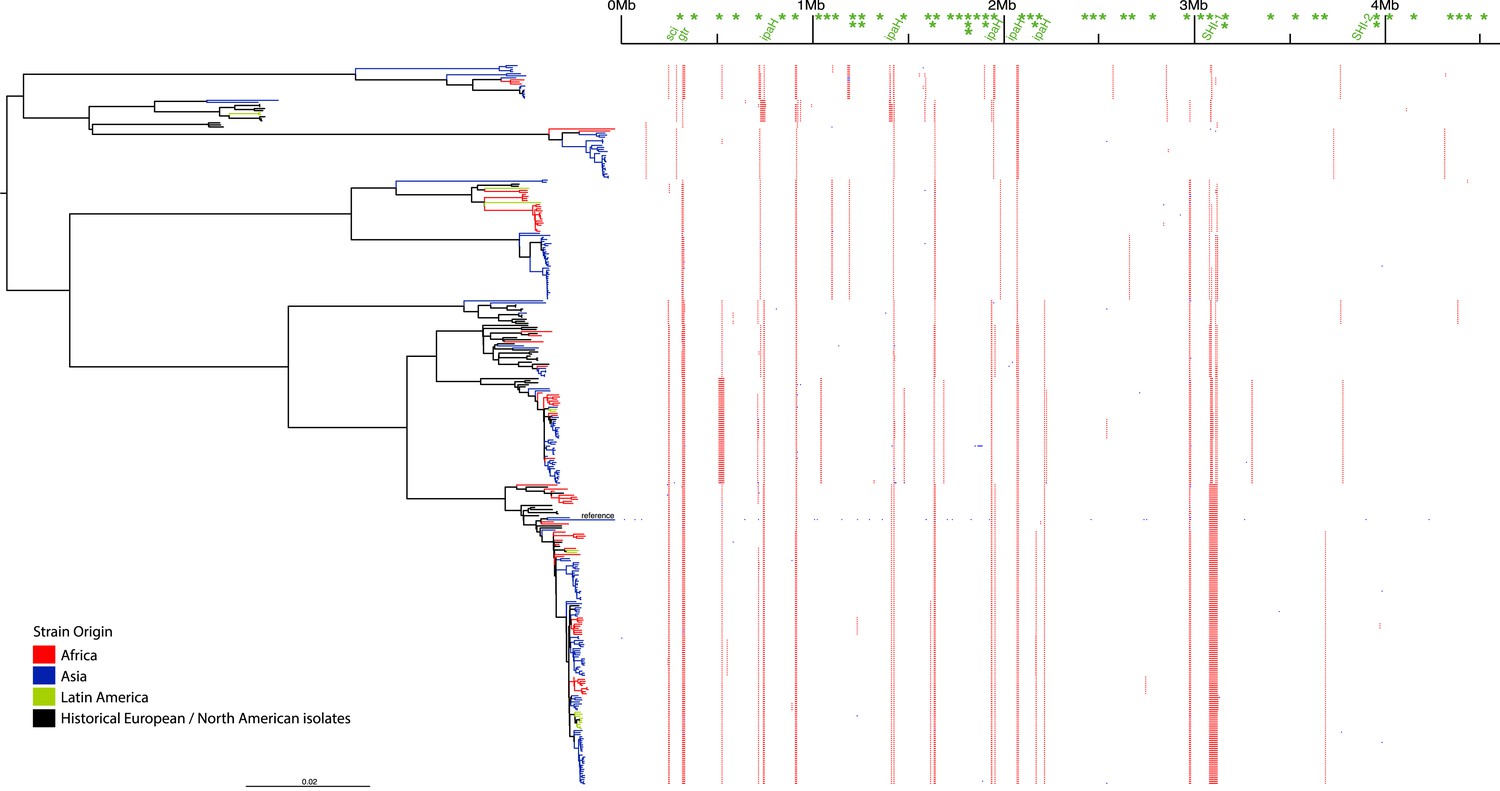
Location of segments detected as recombinant.
Blue indicates a likely recombination within an individual isolate while red indicated recombination common to multiple isolates. Green text at the top indicates mobile elements determined by a manual examination of the reference S. flexneri strain 301 genome.
Figure 1—figure supplement 2
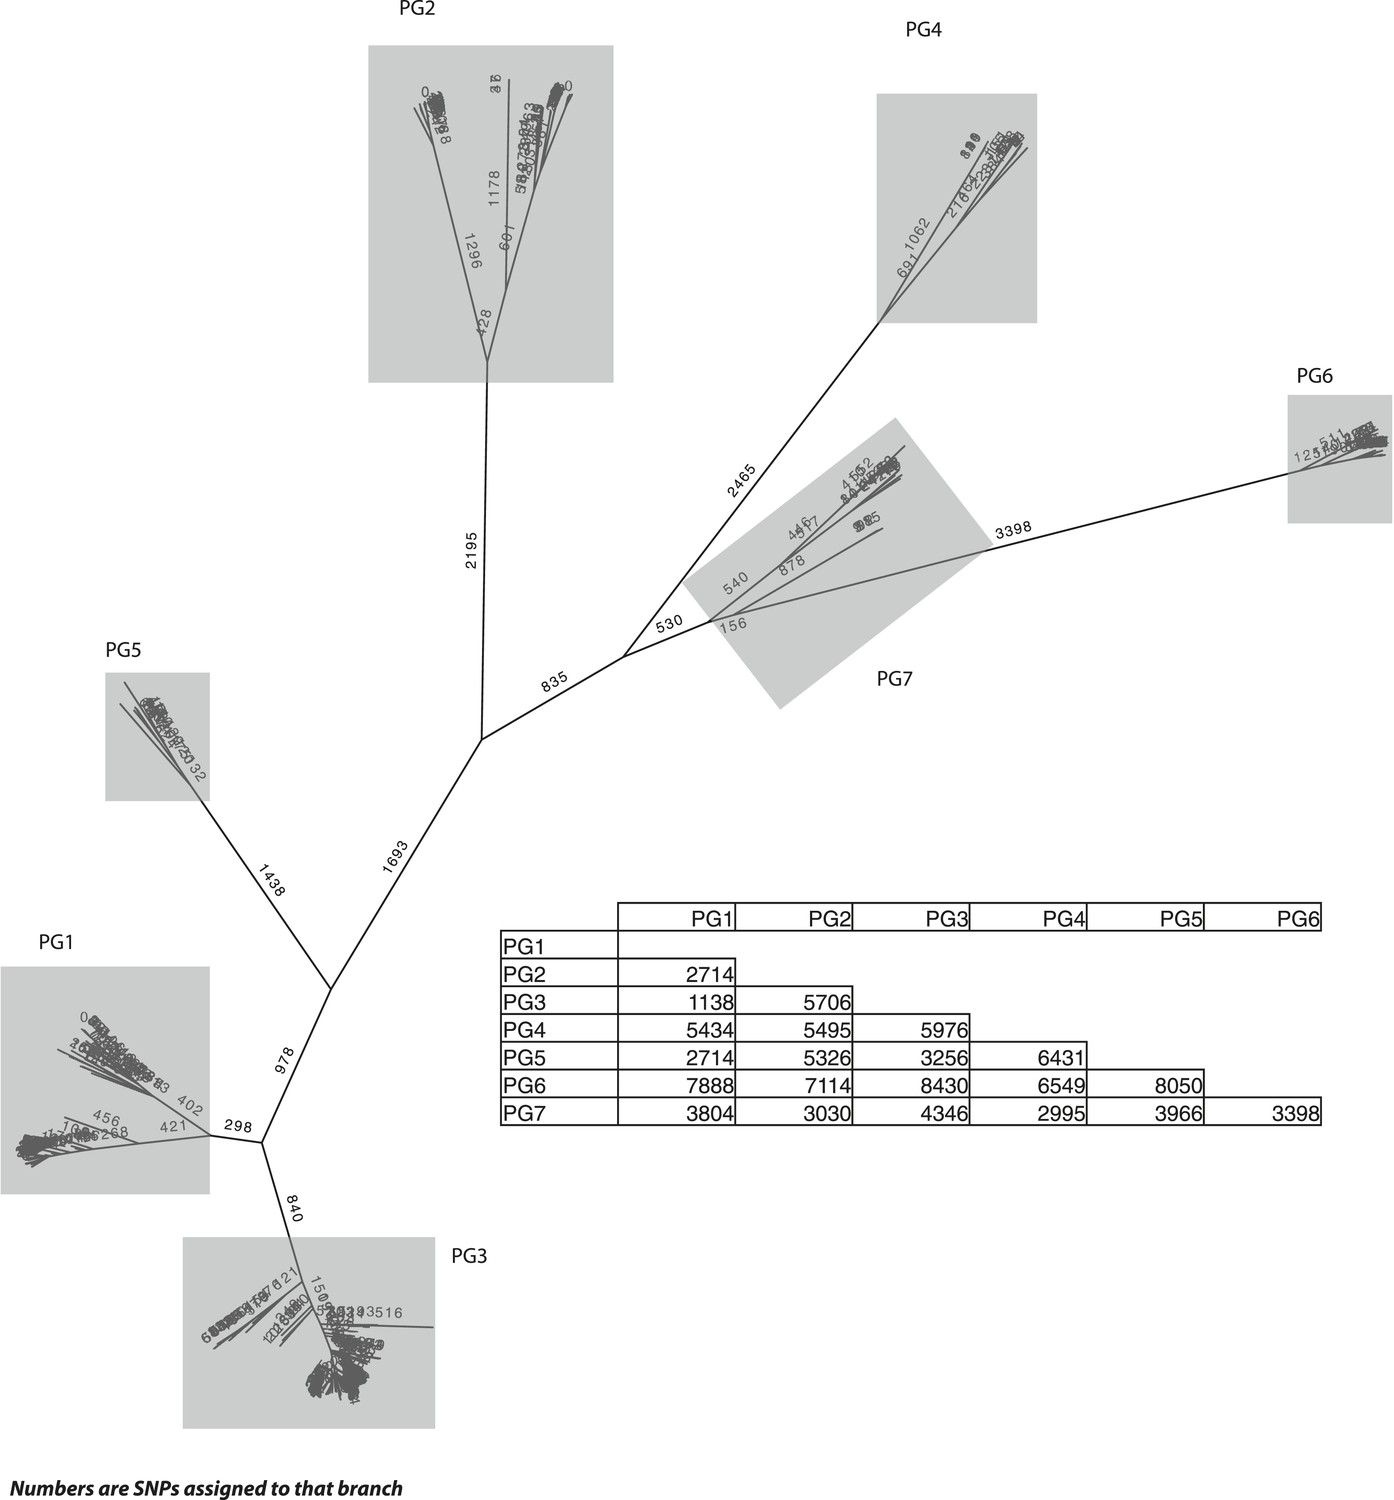
S. flexneri species tree, with the number of single nucleotide polymorphisms (SNPs) per branch.
The SNP tree uses the same alignment as in Figure 1, but is constructed from the SNPs that can be assigned to each branch. The ancestral states were reconstructed using ACTRAN. Insert—a table showing the number of SNPs between the most recent common ancestor (MRCA) of each of the PGs identified.
Figure 1—figure supplement 3
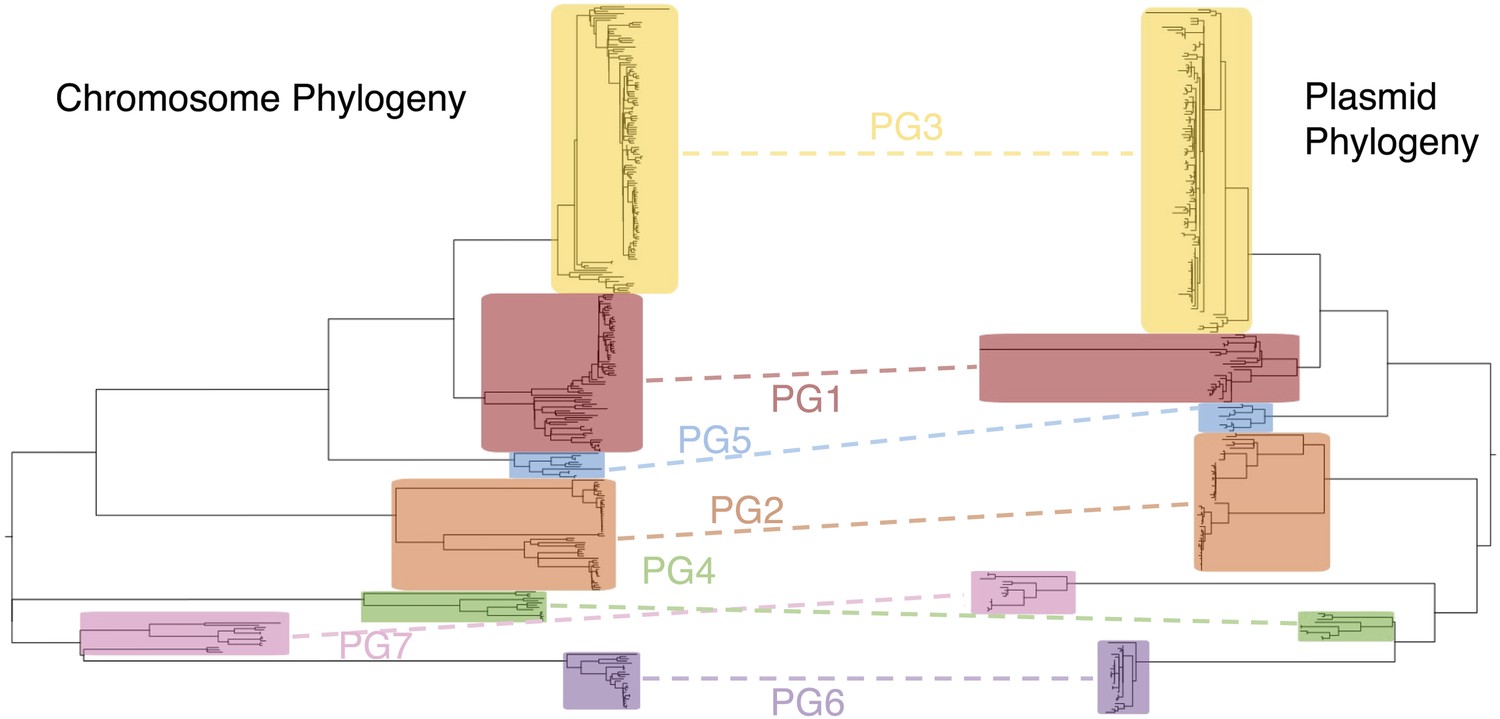
Co-evolutionary relationships of the S. flexneri genome and virulence plasmid (VP).
A maximum likelihood phylogeny of the S. flexneri chromosome (left) is shown adjacent to one of the VP (right). Collared blocks and labels enclose independently identified BAPs clusters for sequence alignments of the chromosome and VP. Dotted lines indicate groups of isolates shared between clusters in phylogeny.
Figure 1—figure supplement 4
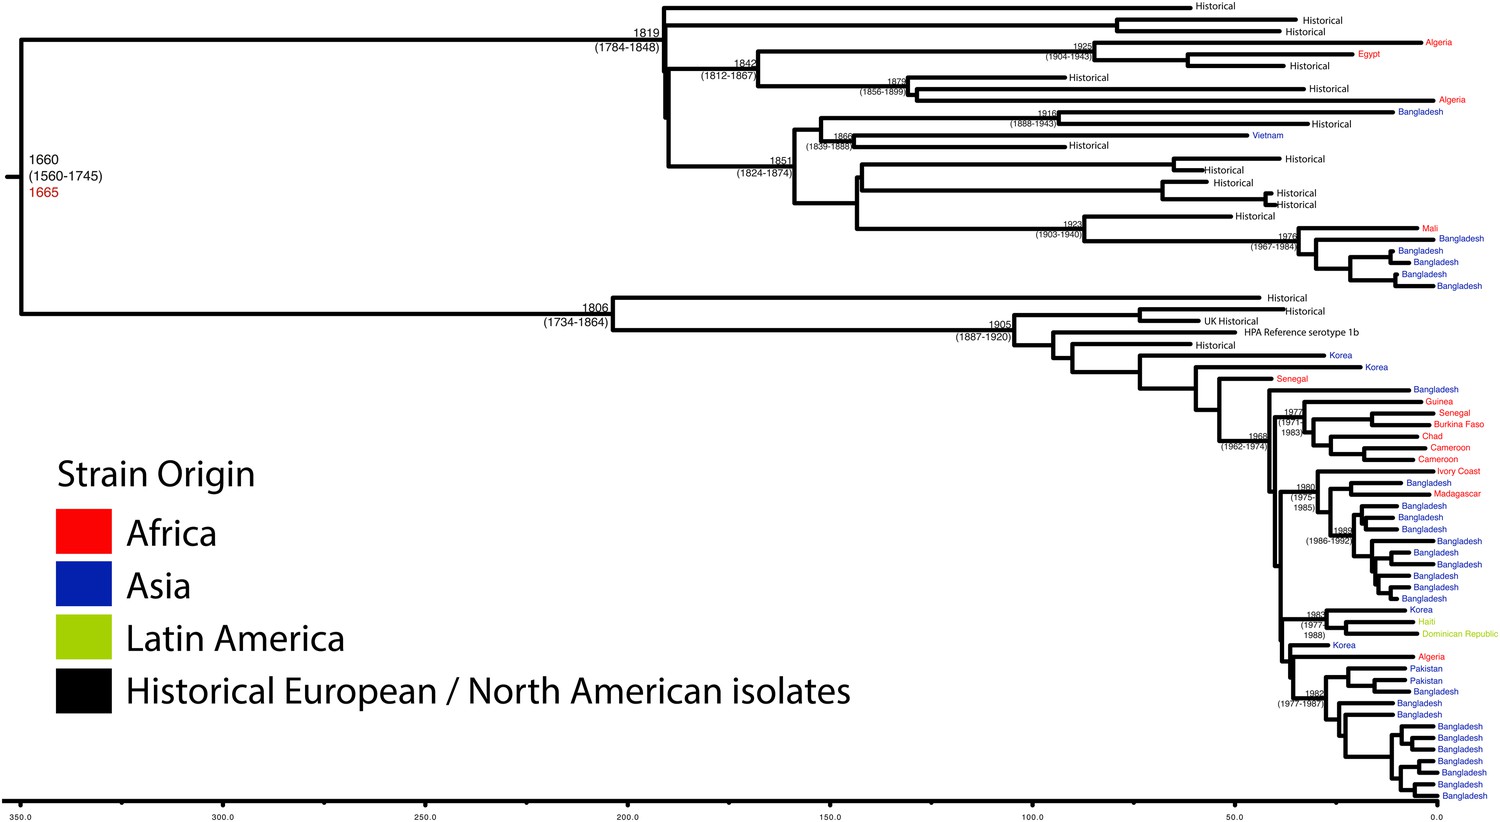
Maximum Clade Credibility trees generated using Bayesian evolutionary analysis by sampling trees (BEAST) for PG 1.
Dates of MRCA are shown overlying internal nodes followed by 95% HPD in parentheses. Tips display the country of origin for each isolate (where available), coloured by region while the date given in red at the base of each group is the MRCA date obtained from the software Path-O-Gen, calculated based on the root-to-tip distance. The horizontal scale is in the unit of years in the past.
Figure 1—figure supplement 5
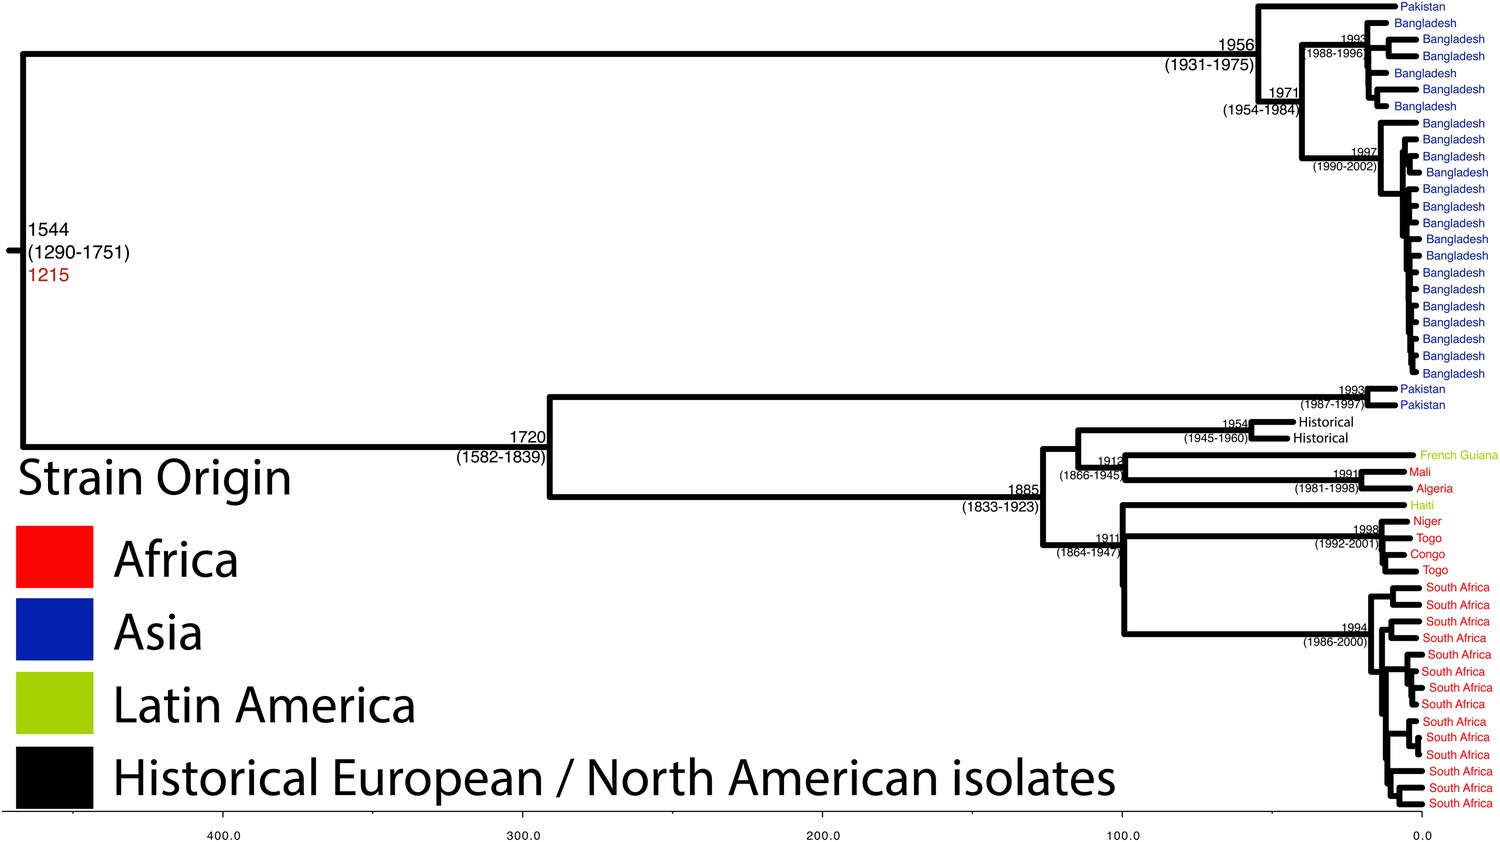
Maximum Clade Credibility trees generated using BEAST for PG 2.
Dates of MRCA are shown overlying internal nodes followed by 95% HPD in parentheses. Tips display the country of origin for each isolate (where available), coloured by region while the date given in red at the base of each group is the MRCA date obtained from the software Path-O-Gen, calculated based on the root-to-tip distance. The horizontal scale is in the unit of years in the past.
Figure 1—figure supplement 6
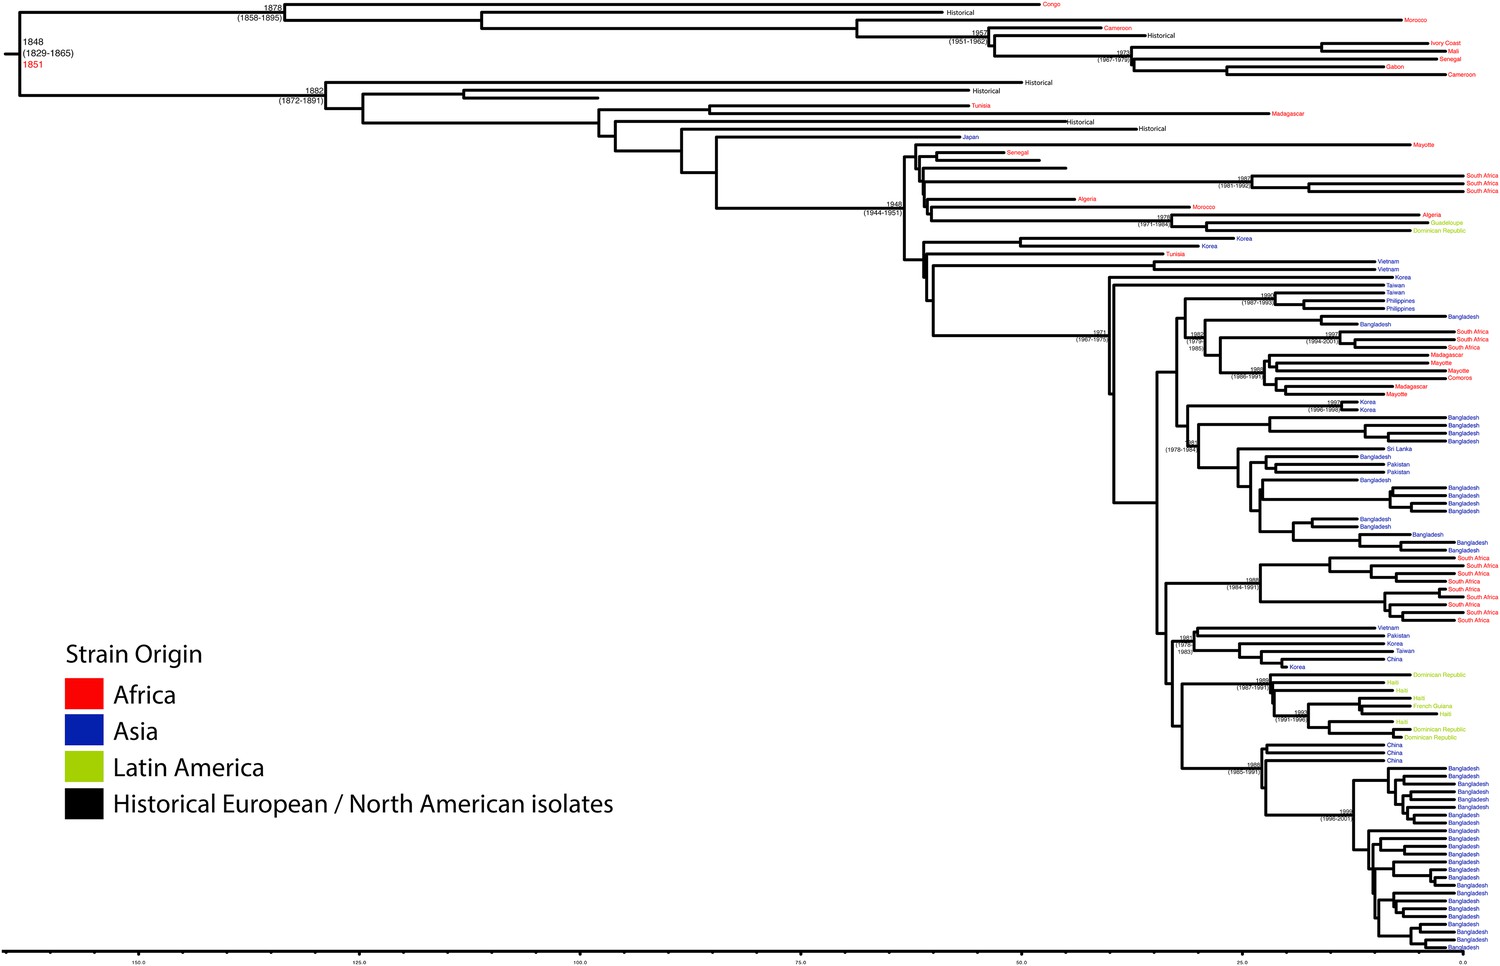
Maximum Clade Credibility trees generated using BEAST for PG 3.
Dates of MRCA are shown overlying internal nodes followed by 95% HPD in parentheses. Tips display the country of origin for each isolate (where available), coloured by region while the date given in red at the base of each group is the MRCA date obtained from the software Path-O-Gen, calculated based on the root-to-tip distance. The horizontal scale is in the unit of years in the past.
Figure 1—figure supplement 7
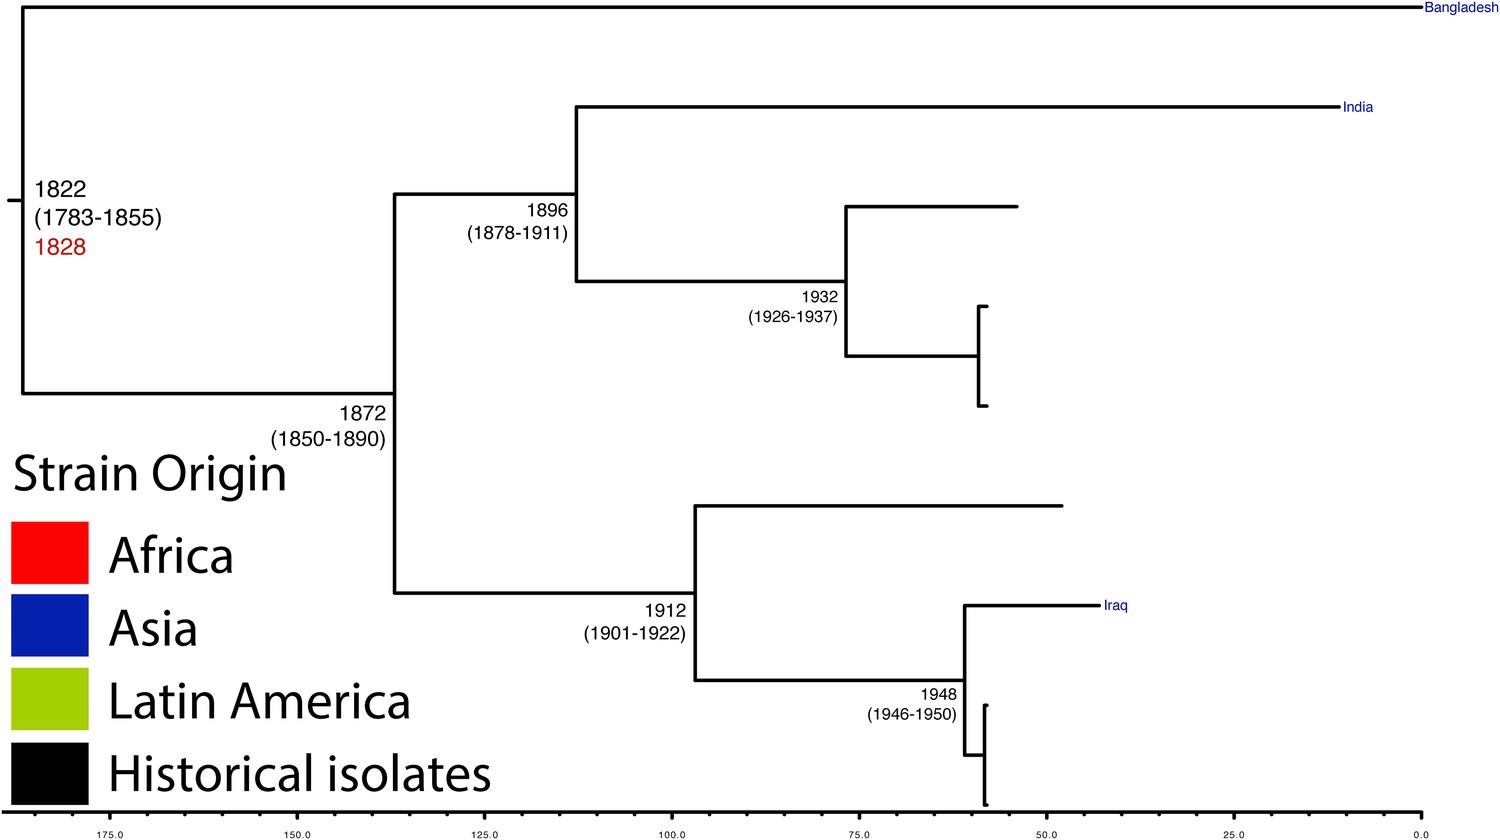
Maximum Clade Credibility trees generated using BEAST for PG 5.
Dates of MRCA are shown overlying internal nodes followed by 95% HPD in parentheses. Tips display the country of origin for each isolate (where available), coloured by region while the date given in red at the base of each group is the MRCA date obtained from the software Path-O-Gen, calculated based on the root-to-tip distance. The horizontal scale is in the unit of years in the past.
Figure 2 with 3 supplements
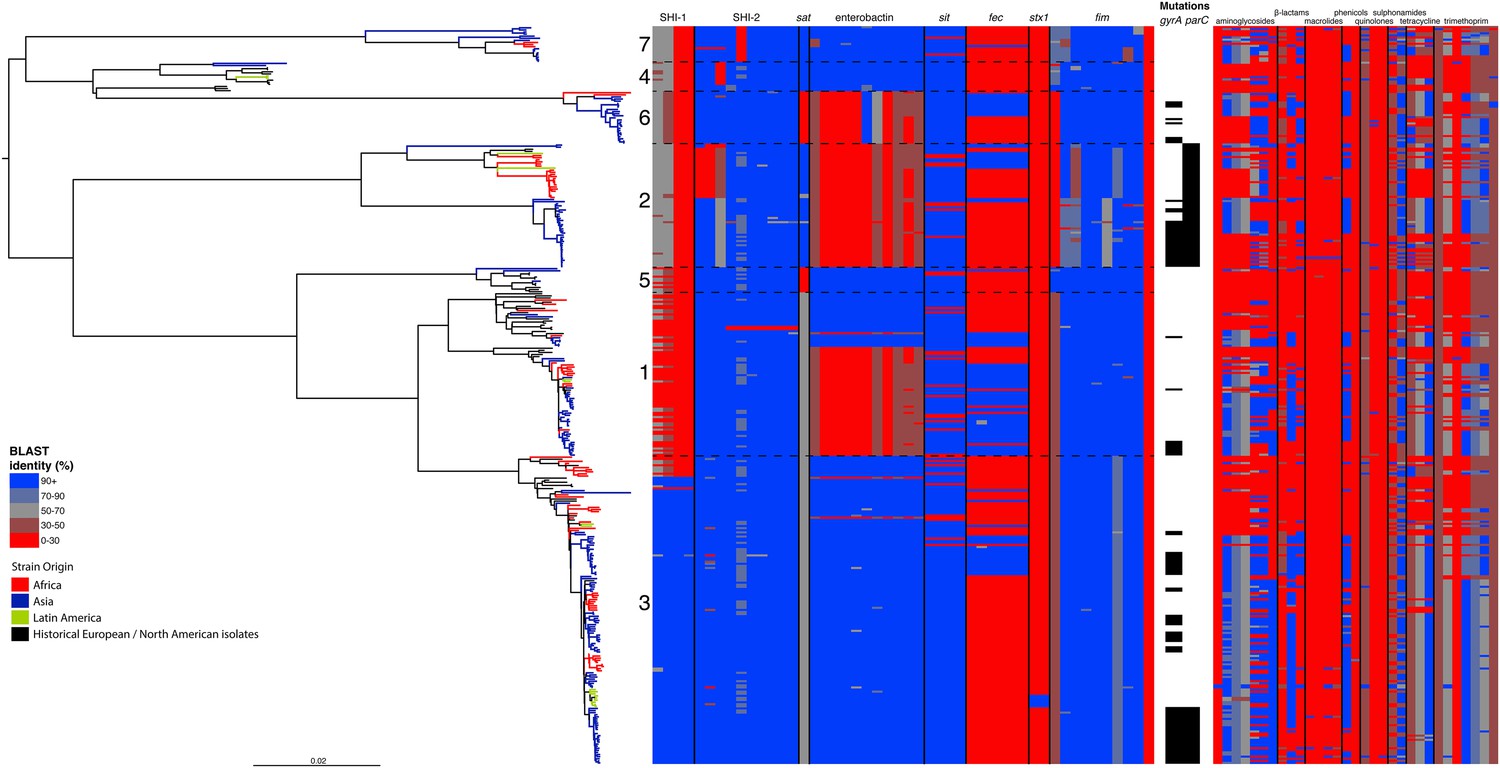
Correlation of isolate phylogeny with pathogenicity and antimicrobial resistance (AMR) determinants.
The midpoint-rooted maximum likelihood phylogenetic tree shows PGs, with tips and terminal branches collared by continent of origin. Tracks adjacent to each isolate show the percentage BLAST identity of the best hit in the sample assembly against key virulence and AMR determinants. Isolates with mutations in the gyr/par genes have black bars in the relevant tracks. The virulence determinants shown are SHI-1 (pic, sigA, set1AB), SHI-2 (shiABCDE, iucABCD, iutA), sat, enterobactin (entABECFD, fepABCDG), sitABCD, fecEDCBAR, stx1ab, fimZBCHGFDEAY, and the AMR genes are aac(3)-II, aadA1, aadA2, aadA5, strA, strB, sat1 (aminioglycosides), blaCTX-M-24, blaOXA-1, blaTEM-1, (β-lactams) ermB, msrE, mphA, mphE, (macrolides) catA1, catB1, (phenicols) qacEΔ1, qnrS1, (quinolones) qepA, sul1, sul2 (sulphonamides) tetA(A), tetA(D), tetA(B) (tetracyclin), dfrA17, dfrA3b, dfrA1, dfrA5, dfrA14 and dfrA8 (trimethoprim).
Figure 2—figure supplement 1
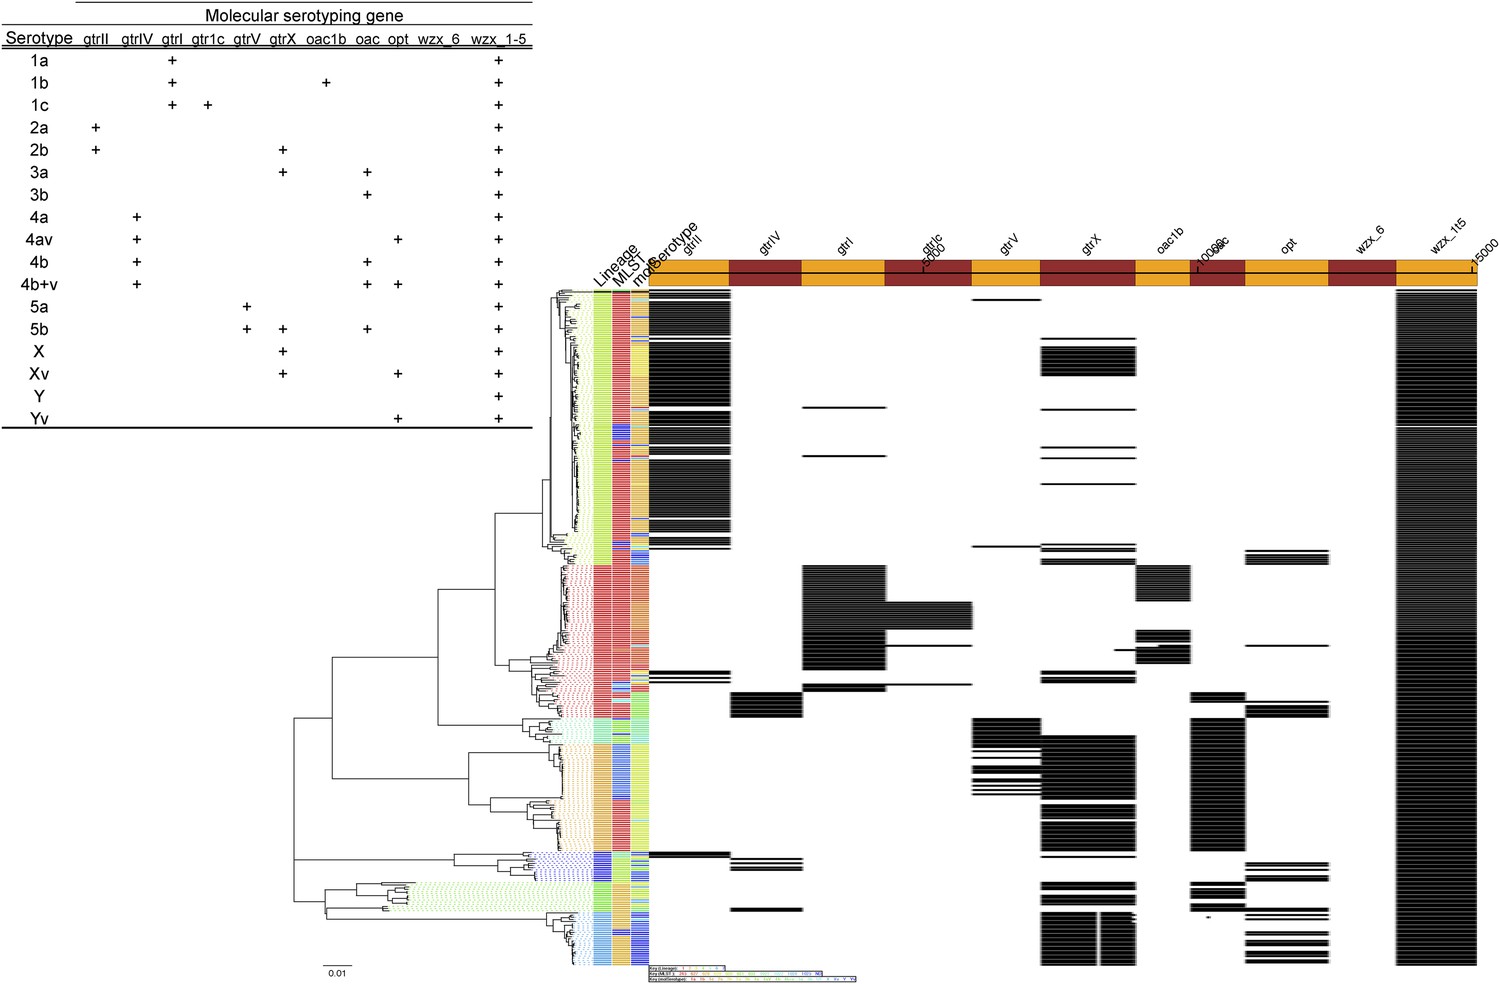
Results of molecular serotyping, displaying the distribution of MLST, molecular serotype, and the distribution of defining genes (according to key, top left) among isolates.
https://doi.org/10.7554/eLife.07335.012
Figure 2—figure supplement 2
Maximum likelihood phylogeny of an alignment of the concatenated nucleotide sequences the enterobactin locus of 13 genes (34,732 NT; containing entABCDEFS, fepABCDG and fes).
The tree is drawn using PhyML, with a GTR model and contains 191 strains. Isolate labels are collared according to whole-genome based PG definition.
Figure 2—figure supplement 3
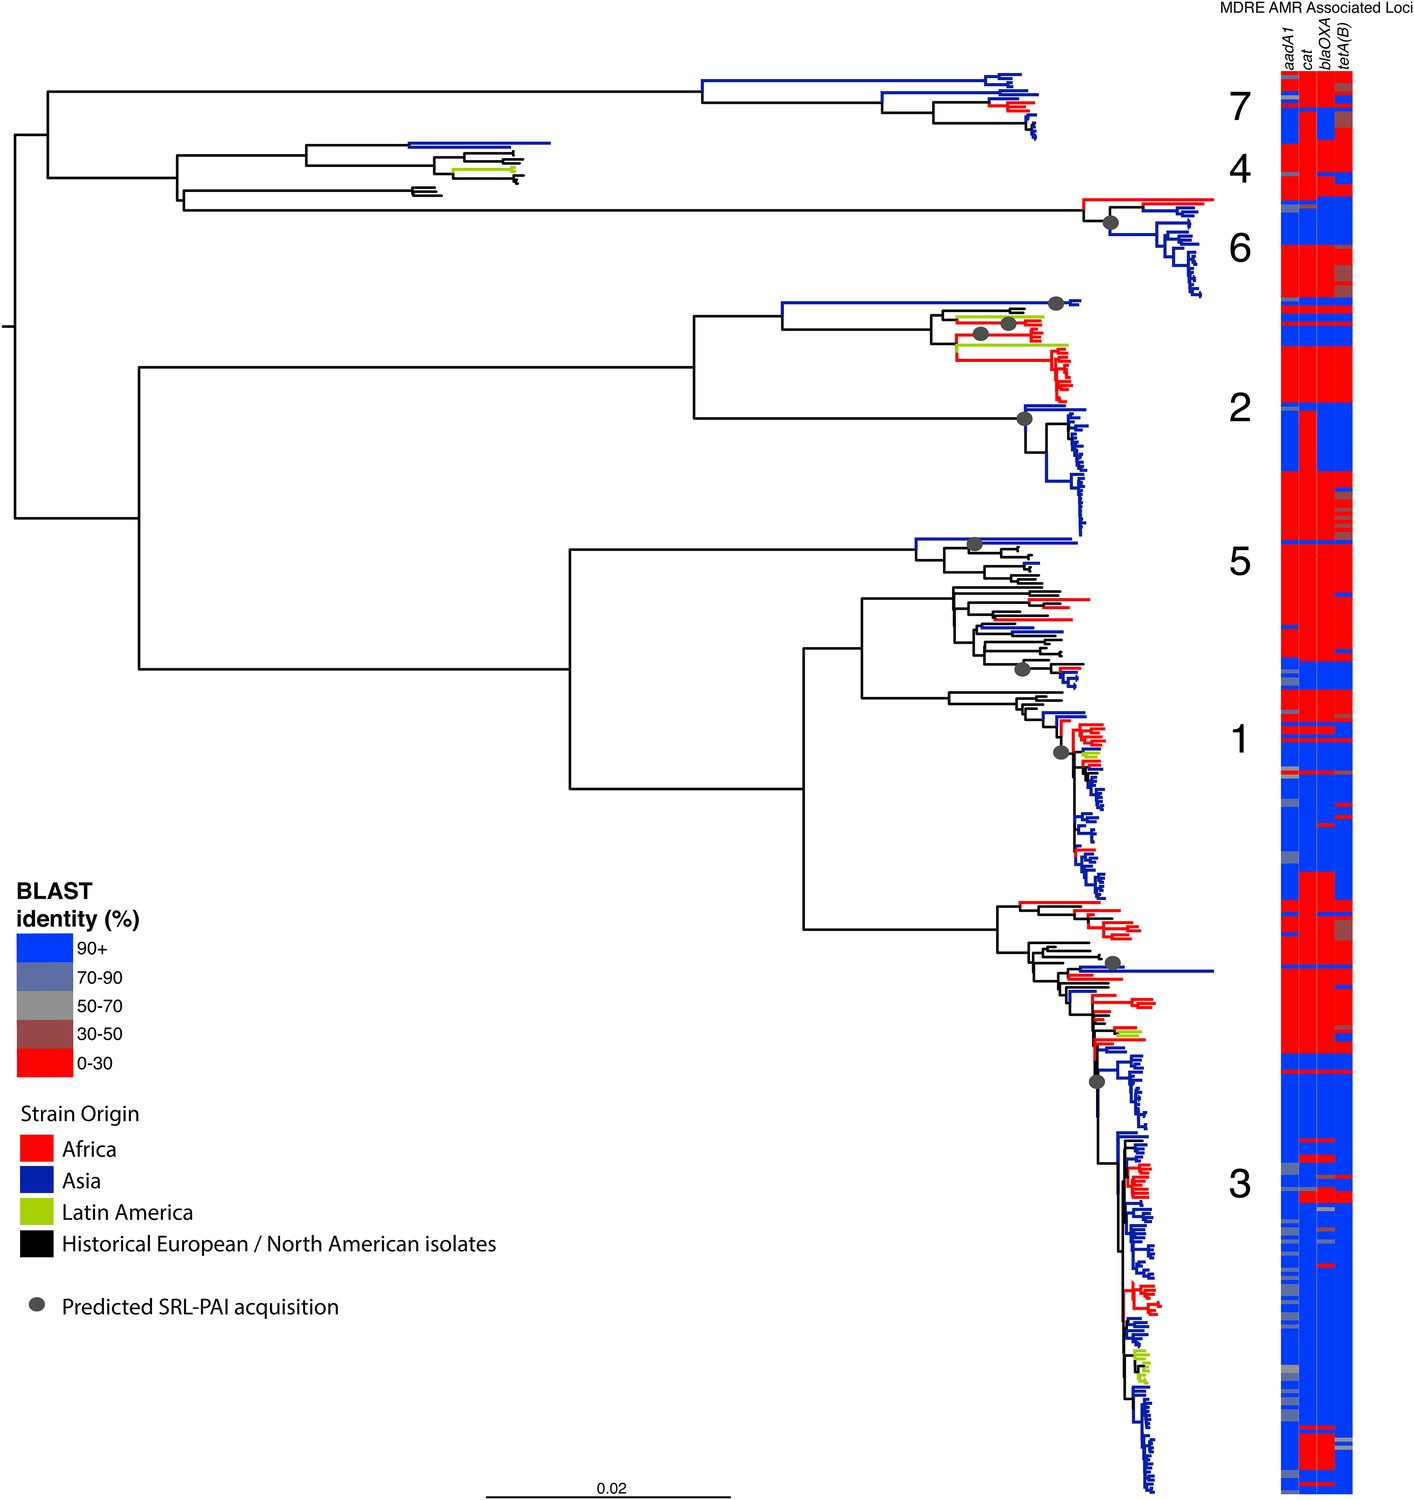
Correlation of isolate phylogeny with AMR determinants, showing only the SRL-MDRE-associated loci aadA1, blaOXA-1, cat and tetA(B).
Grey circles indicate branches where acquisition events are predicted to have taken place.
Figure 3
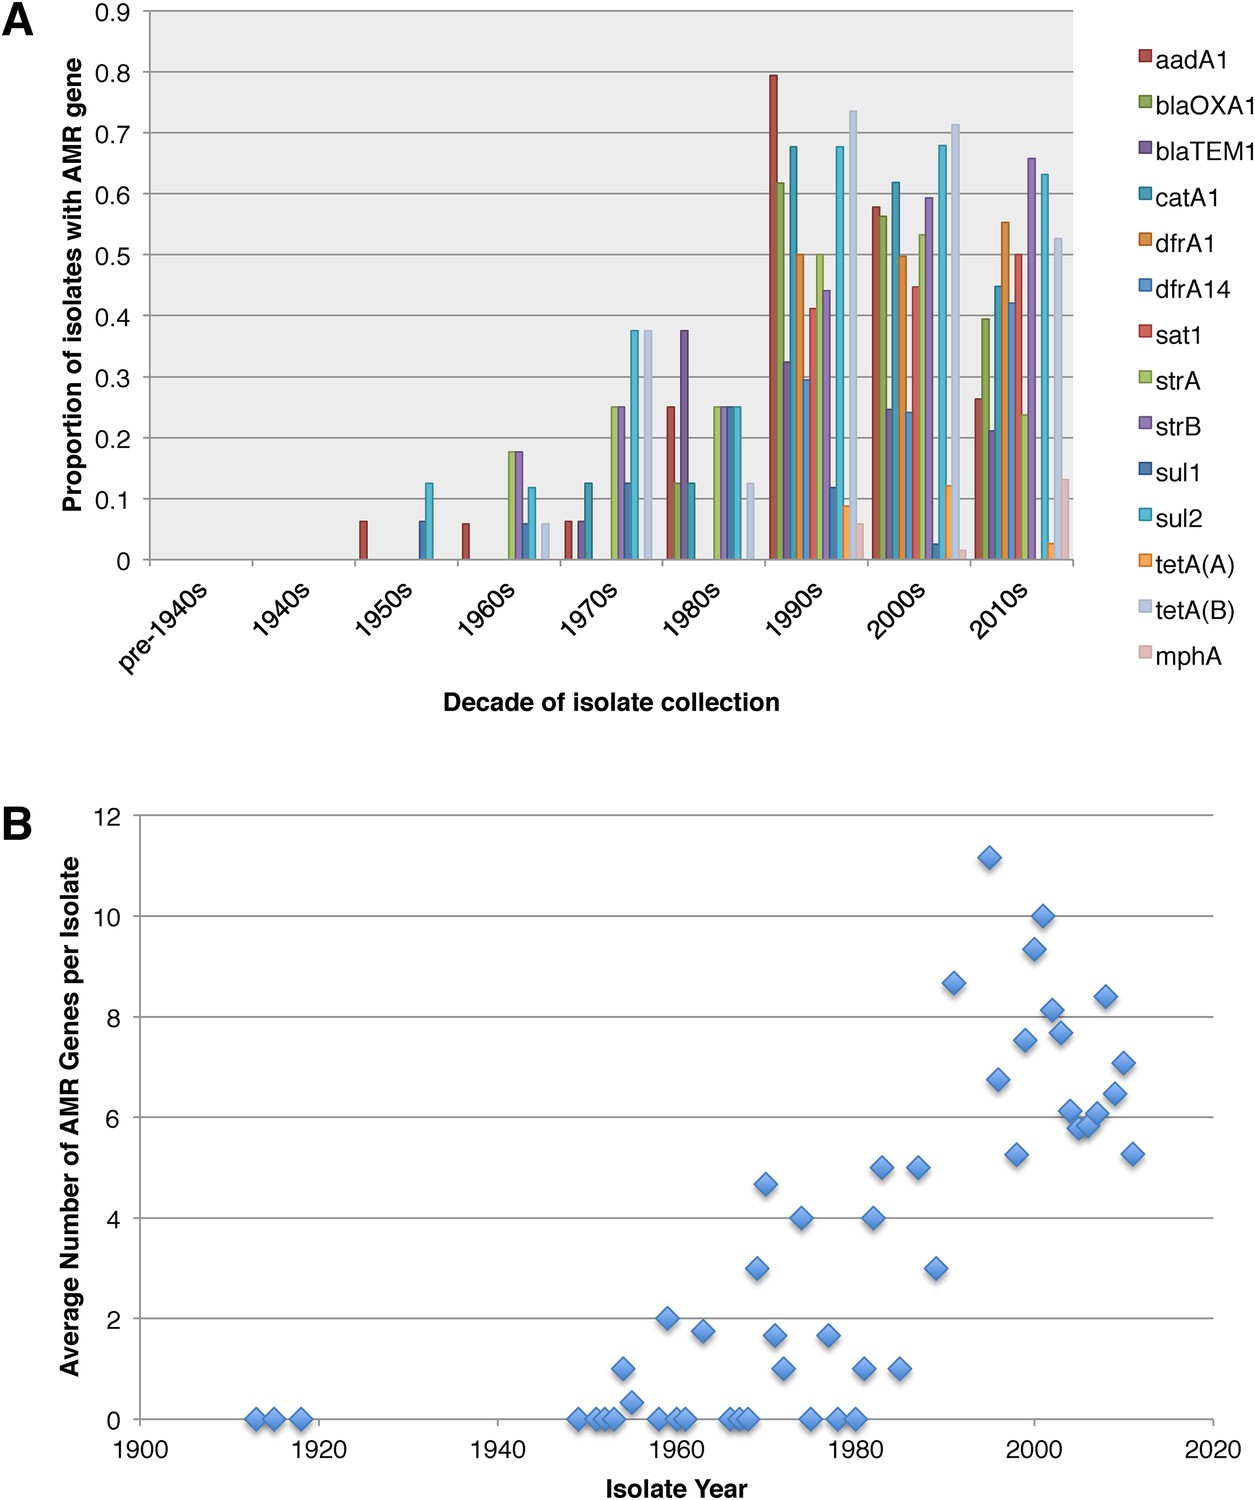
Graphs showing the pattern of AMR presence within our dataset.
(A) Graph showing the proportion of isolates from each decade that contain the AMR genes. (B) Graph showing the average number of resistance genes found in each isolate collected, by year.
Additional files
-
Supplementary file 1
Table containing strain information, accession numbers for the strains used in this study along with the blast identities for the virulence and AMR genes displayed in Figure 2.
- https://doi.org/10.7554/eLife.07335.016
Download links
A two-part list of links to download the article, or parts of the article, in various formats.
Downloads (link to download the article as PDF)
Open citations (links to open the citations from this article in various online reference manager services)
Cite this article (links to download the citations from this article in formats compatible with various reference manager tools)
Species-wide whole genome sequencing reveals historical global spread and recent local persistence in Shigella flexneri
eLife 4:e07335.
https://doi.org/10.7554/eLife.07335


